

Abstract
Objective:
To determine if changes in brain metabolites are observed during early HIV infection and correlate these changes with immunologic alterations.
Methods:
Eight subjects with early HIV infection, 9 HIV-seronegative controls, and 10 chronically HIV-infected subjects without neurologic impairment underwent 1H magnetic resonance spectroscopy. Subjects with early stage infection were identified near the time of HIV seroconversion and imaged within 60 days of an evolving Western blot, while still having detectable plasma virus. Subjects had blood drawn for viral RNA and T cell quantification.
Results:
Both N-acetylaspartate (NAA) and Glx (glutamate + glutamine) were decreased in the frontal cortical gray matter of seropositive subjects. NAA levels were found to be decreased in the centrum semiovale white matter of chronically HIV-infected subjects, but not in those with early infection. Both HIV-infected cohorts demonstrated a lower number of CD4+ T lymphocytes and a higher number of CD8+ T lymphocytes in their blood. Lower NAA levels in the frontal cortex of subjects with early infection were associated with an expansion of CD8+ T cells, especially effector CD8+ T cells.
Conclusions:
These results verify metabolism changes occurring in the brain early during HIV infection. Lower NAA and Glx levels in the cortical gray matter suggests that HIV causes neuronal dysfunction soon after infection, which correlates to the expansion of CD8+ T cells, specifically to an activated phenotype. Utilizing magnetic resonance spectroscopy to track NAA levels may provide important information on brain metabolic health while allowing better understanding of the virus–host interactions involved in CNS functional deficits.
GLOSSARY
- APC
= allophycocyanin;
- Cho
= choline;
- Cr
= creatine;
- CTL
= cytotoxic T lymphocyte;
- Cy5.5
= cyanin 5.5;
- FITC
= fluorescein isothiocyanate;
- FOV
= field of view;
- Glx
= glutamate + glutamine;
- MI
= myoinositol;
- MRS
= magnetic resonance spectroscopy;
- NAA
= N-acetylaspartate;
- NRTI
= nucleoside reverse transcriptase inhibitors;
- PE
= phycoerythrin;
- PerCP
= peridinium chlorophyll protein;
- PHI
= primary HIV infection;
- SIV
= simian immunodeficiency virus;
- TE
= echo time;
- TI
= inversion time;
- TR
= repetition time.
Primary HIV infection (PHI) manifests mononucleosis-like symptoms in 40–90% of patients with HIV infection.1 During this period, important pathogenic processes occur, including extensive viral replication, formation of anatomic reservoirs, and the transient depletion and functional impairment of CD4+ T lymphocytes before cytotoxic T lymphocyte (CTL) populations expand.1–5 This CTL response is essential in the control of viral replication during PHI (termed seroconversion), reducing the high viral loads within weeks to months during early infection, and does not wane until progression to AIDS occurs.4 Primary and early infection are critical phases since these initial events contribute to the establishment of patients’ viral set point and viral reservoirs.6
Numerous magnetic resonance spectroscopy (MRS) studies have examined chronically HIV-infected individuals, but primary/early HIV infection remains unexplored.7,8 Previous results in the simian immunodeficiency virus (SIV)–macaque neuroAIDS model demonstrated neuronal injury during primary infection using both neuropathology and MRS.9–11 Temporal, reversible changes of animals’ frontal cortex metabolites correlated with transient presynaptic injury, CD8+ T lymphocyte expansion, and peak viremia. Links between biologic hallmarks of infection, pathology, and MRS in SIV-macaque models provide rationale for the hypothesis that HIV-specific immune responses outside the brain influence HIV-related CNS disease.12,13 More importantly, the mechanisms by which the immune system regulates HIV infection of the CNS are not completely elucidated. Accumulating HIV-specific CNS-penetrating CD8+ T lymphocytes, while having a protective role,14 may induce cellular damage and functional CNS abnormalities during early infection.13 The present work was designed to evaluate neuronal dysfunction and relationships with T cell phenotypes in the periphery during early and chronic HIV infection.
METHODS
Subjects.
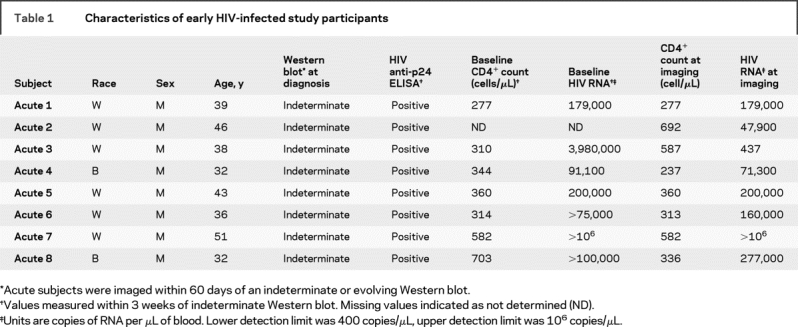
Eighteen HIV+ subjects were identified from a well-established cohort15 screened to exclude individuals with current or past neurologic disorders, opportunistic infections of the CNS, unstable or severe intercurrent medical conditions, or magnetic resonance contraindications. Of these, eight (age 39 ± 5.0 years) were identified during primary HIV infection defined by having detectable plasma HIV RNA and a positive ELISA but negative or indeterminate Western blot (table 1). These subjects presented with symptoms of acute viral ailment and not necessarily neurologic symptoms. No changes in T1 or T2 images of the subjects were observed by a neuroradiologist. These subjects were imaged within 60 days of an indeterminate or positive Western blot, while they still had detectable viral RNA levels (mean = 240,000 copies of RNA/mL). Thus, they are classified as having early HIV infection, during which the viral set point is occurring but they have not yet progressed into the asymptomatic stage. Subjects enrolled during early infection were exposed to HIV through sexual contact (7 homosexual, 1 heterosexual exposure) and none was taking antiretroviral therapy. All chronically HIV-infected subjects (identified as HIV+ for >4 years) were defined as neurocognitively asymptomatic based on a neurologic examination performed by a neurologist, and all were on a documented antiretroviral regimen. Eight of the 10 were on a combination of protease inhibitors and nucleoside reverse transcriptase inhibitors (NRTI), one was on a fusion inhibitor in addition to an NRTI and protease inhibitors, and the final was taking a NRTI and non-NRTI combination. Nine HIV-seronegative healthy control subjects (age 32 ± 4.4 years) with no known neurologic or psychiatric disease and no identified risk factors for HIV were enrolled in this study. In all, the 27 subjects were composed of 7 women and 20 men; 6 Hispanic/Latino and 21 non-Hispanic/non-Latino; 7 black and 20 white. This study was approved by the collaborating institutions’ Internal Review Boards. Subject consent was received from those enrolled.
Table 1 Characteristics of early HIV-infected study participants
Magnetic resonance studies.
Magnetic resonance studies were conducted on a 1.5-T Signa scanner (General Electric, Milwaukee, WI), with a standard GE head coil. Four imaging sequences were performed: 1) three-plane T2* FGRE (5-mm slices, 5-mm spacing, 24-cm field of view [FOV]); 2) sagittal T1 (echo time [TE]/repetition time [TR] 20/550 msec, 5-mm slices, 1-mm spacing, 24-cm FOV); 3) axial T2 (TE/TR 102/5,500 msec, 5-mm slices, 1-mm spacing, 24-cm FOV); 4) axial fluid-attenuated inversion recovery (TE/inversion time [TI]/TR 140/2,200/10,000 msec, 5-mm slices, 1-mm spacing, 24-cm FOV). Two voxels were selected for spectroscopy and prescribed from the axial T2 images (figure 1): 1) frontal cortical gray matter centered on the superior frontal gyrus along the longitudinal fissure and 2) white matter centrum semiovale. Spectral data were acquired with the GE pulse sequence PROBE-P,16 a PRESS sequence with CHESS water suppression17 using standard clinical parameters (TE/TR 35/3,000 msec, 20 × 20 × 15 mm3 voxels, 128 acquisitions, spectral width 2,500 Hz, 2,048 points). Spectroscopic data were processed using LCModel,18 yielding absolute concentrations of N-acetylaspartate (NAA, being the sum of N-acetylaspartate + N-acetylaspartylglutamate), myoinositol (MI), choline (Cho), glutamate + glutamine (the overlapping resonances known as Glx), and creatine (Cr). Differences in gray and white matter water content were taken into consideration during spectral analysis. A phantom was used for quality assurance between imaging sessions.

Figure 1 Voxel placement and magnetic resonance spectroscopy from a subject with HIV during early infection
Single voxel magnetic resonance spectroscopy was performed on two regions of interest: the frontal cortex (A) and the white matter of the centrum semiovale (B). No structural abnormalities were observed in the enrolled subjects who had primary HIV infection. A representative spectrum (C) of the frontal cortex region indicates the measured metabolites of N-acetylaspartate, glutamate + glutamine, choline, creatine, and myoinositol.
Immunologic and virologic assessment.
Within 48 hours of imaging, all subjects had blood drawn for complete blood count, assessment of T cell phenotypes, and HIV RNA quantification (Amplicor Monitor, Roche, Indianapolis, IN). HIV antibody testing was performed to confirm seronegative status of control subjects.
Flow cytometric immunophenotyping of lymphocytes.
EDTA-anticoagulated whole blood (100-μL aliquots) was washed with phosphate-buffered saline to deplete the plasma, and cell pellets were incubated at room temperature for 15 minutes with a mixture of antibodies for immunofluorescence staining. Antibodies used in this study were conjugated with fluorescein isothiocyanate (FITC), phycoerythrin (PE), peridinium chlorophyll protein (PerCP)/PerCP-cyanin 5.5 (PerCP-Cy5.5), or allophycocyanin (APC). Lymphocyte immunophenotyping was performed using combinations of the following monoclonal antibodies: CD3-PerCP-Cy5.5 or -APC (SP34; BD Pharmingen), CD4-FITC (19thy5d7; Beckman Coulter), CD8-FITC or -PE (SK1; Becton Dickinson), CD20-PerCP-Cy5.5 (L27; Becton Dickinson), CD28-PE (28.2; Beckman Coulter), and CD95-APC (DX2; BD Pharmingen). Within the CD3+CD4+ and CD3+CD8+ lymphocyte population, naïve T lymphocytes were identified as CD28+CD95−, central memory T lymphocytes as CD28+CD95+, and effector memory T lymphocytes as CD28−CD95+.
Neurologic evaluation.
Subjects underwent standard neurologic examination by a board-certified neurologist with expertise in HIV neurology, similar to the macroneurologic examination as described by the AIDS Clinical Trials Group. This battery assessed functions of cranial nerve, motor and sensory functions, reflexes, gait, balance, and also included a brief screening for peripheral neuropathy. Dementia severity was determined on the basis of the HIV dementia scale.
Statistical analysis.
Differences in metabolism and T cell phenotypes among the three cohorts were determined using Fisher least-significant difference procedure. If analysis of variance was found to be significant, then Student least-squares mean t tests were used to isolate differences. A Wilcoxon signed-rank test was used to isolate differences in viral RNA between early and chronically infected HIV cohorts. Spearman rank correlations were used to determine associations between T cell populations, NAA, and Glx concentrations.
RESULTS
Neurologic symptoms.
All subjects with primary infection had clinical symptoms consistent with acute HIV syndrome, including fever, fatigue, rash, pharyngitis, myalgia, nausea, vomiting, diarrhea, night sweats, anorexia, and aseptic meningitis. Five of these eight subjects reported additional symptoms such as severe headaches, numbness in extremities, difficulties thinking clearly, and severely enlarged lymph nodes of neck and head. Upon neurologic examination, all subjects with early HIV infection tested similarly to seronegative controls.
Plasma viral RNA and T cell phenotypes.
Average plasma viral loads at the time of imaging for the early HIV infection cohort was significantly higher than that of the chronically infected HIV population (p = 0.006; table 2). As expected, the total number of CD4+ T cells during this early stage of infection was found to be much lower than those of controls (−56%, p < 0.002), while CD8+ T lymphocytes were elevated significantly above the normal range (138%, p < 0.005).19 However, no differences between early and chronically infected HIV-positive individuals were observed in either CD4+ or CD8+ T cell populations.
Table 2 Viral RNA and lymphocyte populations
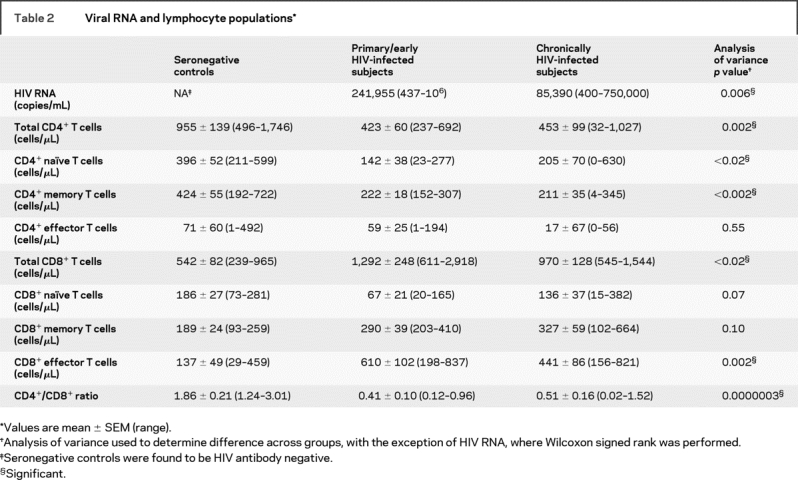
Of the CD4+ T cell phenotypes, reductions in CD4+ naïve and central memory T cells account for this decline in total CD4+ T cells observed in both early and chronically infected HIV cohorts (table 2). In particular, a large reduction of CD4+ naïve (−64%, p < 0.007) and central memory cells (−48%, p = 0.002) were observed in those with early infection when compared to healthy controls. A similar trend was observed in the neurologically asymptomatic HIV+ cohort, with CD4+ naïve (−48%, p < 0.03) and central memory cells (−50%, p < 0.0009). Within the CD8+ T cell phenotypes, the effector memory T cells appear to be causing the expansion in the CD8+ T cell population (table 2). Specifically, a robust expansion from that of the control cohorts was observed in those imaged during early infection (345%, p < 0.0008) and those chronically infected (222%, p = 0.01). No differences between early and chronically infected HIV populations were observed in any CD4+ or CD8+ phenotype.
MRI and spectroscopy.
Sagittal T1, axial T2, and fluid-attenuated inversion recovery images did not indicate significant structural changes indicative of encephalopathy, meningoencephalitis, or demyelinating disease in this early setting of HIV infection, as reported in a handful of case reports in the setting of PHI.20–22 Spectroscopy indicated NAA and Glx concentrations, involved with the neuronal component of the brain, were reduced in frontal cortical gray matter (figure 1A and table 3). Metabolites contributing more to the glial component (MI, Cr, and Cho) were not found to be different between the cohorts. NAA concentrations were decreased in subjects with early (−12%, p < 0.02) and chronic infection (−15%, p = 0.002) compared to levels measured within healthy controls (figure 2). Glx concentrations were reduced in subjects with early (−14%, p < 0.01) and chronic infection (−17%, p = 0.0008) compared to those in controls.
Table 3 Summary of magnetic resonance spectroscopy results
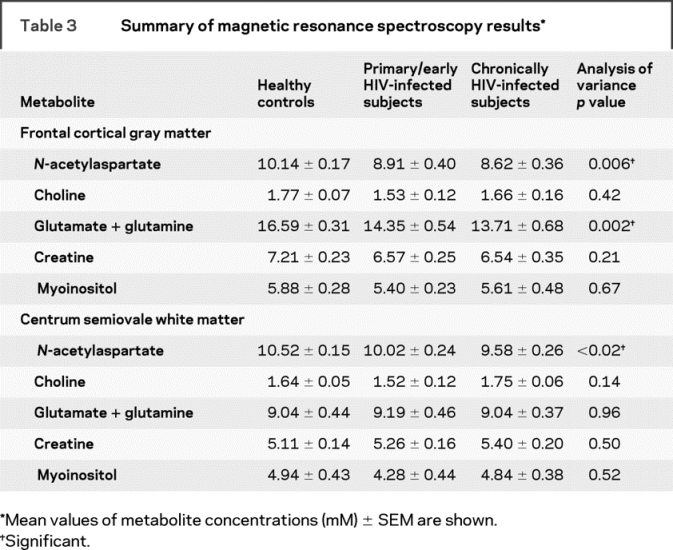
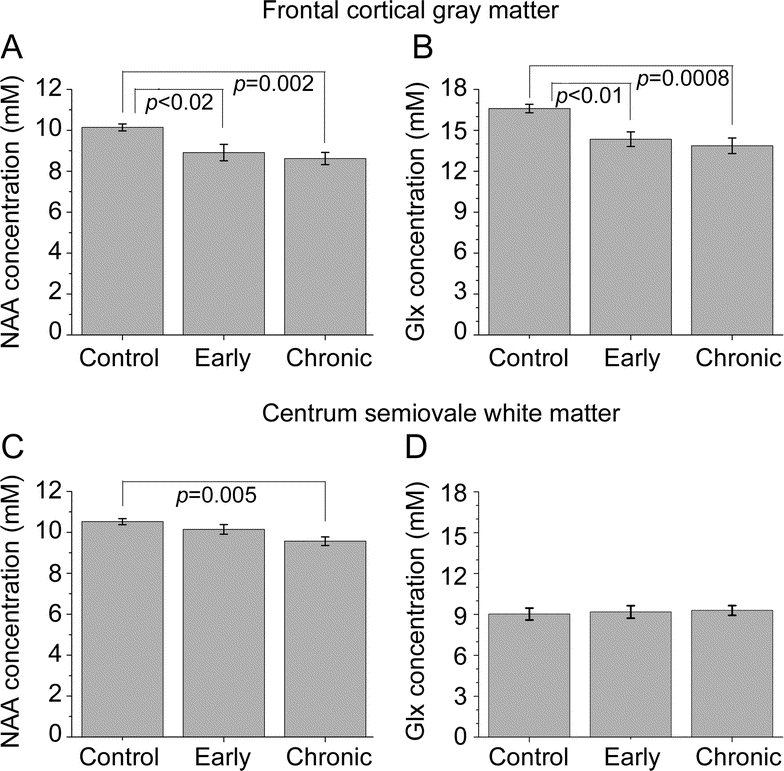
Figure 2 Changes within markers of neuronal metabolism found during both early and chronic HIV infection
N-acetylaspartate (NAA) (A) and glutamate + glutamine (Glx) (B) levels in the frontal cortical gray matter are reduced in subjects during the first few months of infection, similar to subjects with chronic infection who are neurologically asymptomatic. Within the white matter of the centrum semiovale, NAA (C) was found to be reduced in those infected and on treatment for many years with HIV, but not in those during early infection. No changes from control levels for Glx in the white matter were observed (D).
Within the white matter (figure 1B and table 3), no difference was observed between subjects during early HIV infection and seronegative controls (figure 2). Only NAA levels in chronically infected subjects were reduced from those of controls (−9%, p = 0.005). Neither Glx nor any glial response-related metabolite (MI or Cho) was found to be different among the three groups.
Correlations of 1H magnetic resonance spectroscopy with immunologic data.
Spearman rank correlations did not show a relationship between total CD4+ T cells and NAA or Glx levels; however, NAA levels in the FC were found to be higher when CD4+ effector T cell counts were lower in the periphery (Rs = −0.43, p = 0.04), a trend driven by the early HIV infection cohort. The total CD8+ T cell populations were found to expand as NAA declined in the frontal cortex of subjects (Rs = −0.61, p = 0.001) and a similar association with Glx in the same region (Rs = −0.49, p = 0.01). NAA and Glx of the white matter were not associated with the total CD8+ T cell population. Neither CD8+ naïve nor central memory cells were related to NAA or Glx changes in these two regions. However, the expansion of the CD8+ effector T cell population occurred with a reduction in NAA (Rs = −0.66, p = 0.0006) and Glx levels (Rs = −0.48, p < 0.02) measured in the frontal cortical gray matter. A similar trend in white matter NAA (Rs = −0.39, p = 0.06) was observed. Closer examination revealed that this relationship was driven by the early infection cohort, while the chronic infection cohort had no significant correlations between any CD8+ cell population and NAA or Glx levels. No relationship between MRS measurements and plasma viral loads were found.
DISCUSSION
Even though primary HIV infection has been described for well over a decade, there are still few published studies on CNS disease associated with HIV infection during this important time period. SIV and HIV have been found in the brain within 3 to 6 days of infection and consistently by 14 to 21 days where it is associated with the choroid plexus and aseptic meningitis.23–25 A handful of case studies during PHI have described profound neurologic changes that can occur with HIV seroconversion including transient encephalopathy, frank meningoencephalitis, and demyelinating disease.20,21,25 However, it is generally believed this early infection in non-rapid disease animals and humans is typically transient and productive infection is not thought to occur again until the development of AIDS.24,26 The early HIV subjects were enrolled in this study within months of their seroconversion, during an early stage of infection, and did not report severe neurologic problems or have significant structural changes observed by MRI. The neuropsychological battery administered in the present study was not able to indicate a difference among the three subject groups. Given that there is a lack of identified patients in this early phase of infection, it is possible that a larger cohort and a more sensitive neurocognitive battery could reveal cognitive deficits in this early phase of HIV infection.
MRI studies of patients with HIV/AIDS are prevalent within the literature.27,28 However, once lesions are visible within the brain, it is often too late to reverse the effects. In contrast, MRS allows for changes in brain metabolism to be monitored, and may serve as a noninvasive means of determining signs of early neuronal injury and neurologic dysfunction, or observing the effects of therapy on the CNS.7,29 In particular, magnetic resonance studies have shown that the degree of neurocognitive dysfunction correlates with metabolic changes in NAA, and treatment with HAART often reduces symptoms and MRS abnormalities.30,31 The MRS marker NAA exists predominantly in neurons, and can be used as a sensitive marker of neuronal integrity in vivo in lieu of pathologic data that is impossible to obtain at this early stage of infection,9,10 thus allowing for the examination of early CNS damage within this disease. Most interestingly, the cortical gray matter was found to show the most change, with reductions in NAA and Glx in subjects during the first few months of infection, similar to levels found in chronically infected subjects who are neurologically asymptomatic. These initial declines in NAA concentrations are most likely indicative of a transient neuronal dysfunction induced by infected perivascular infiltrates as previously observed in the SIV macaque model.10,11 Little is known about the brain during PHI and all early HIV-infected individuals were recruited based on the presentation of symptoms of acute viral ailment and not the occurrence of neurologic deficits, although studies have suggested the presence of brain abnormalities during this time.20–22
Previous magnetic resonance studies have indicated that the frontal cortex shows signs of damage and dysfunction during the asymptomatic stage of infection, long before onset of AIDS or related dementia. Significant reductions in NAA/Cr were observed in the frontal gray matter tissue of relatively healthy, cognitively asymptomatic (or even with ADC score 0.5), chronically HIV-infected subjects.32 Imaging results have shown that chronically infected subjects lacking cognitive impairment have extensive thinning (−15%) of the cortical gray matter compared to controls.33 MRS results of early infection imply that changes in the frontal cortex may begin within the first few months of infection. Furthermore, MRS results in the acute SIV-infected macaque model indicate that NAA levels measured are affected within the first month of infection in the presence of presynaptic damage as indicated by lower levels of synaptophysin.10 Other studies of acute SIV infection have indicated that upon reaching the viral set point, these metabolism changes may be reversible.9,11 Longitudinal studies of this cohort are necessary to see if these metabolism changes are transient, especially in the context of antiretroviral therapy usage and its CNS penetration effectiveness.
While evaluations of Glx have become more prevalent,34,35 results from this measure must be interpreted carefully. Glx is composed of the major excitatory neurotransmitter glutamate, which is found primarily in glutamatergic neurons, and its stored form, glutamine, found within astrocytes. Since glutamate is required for aspartate synthesis within the neuronal mitochondria, decreased levels of Glx may be an early indicator of neuronal metabolism changes induced by this disease.35 NAA and Glx levels in the frontal gray matter were found post hoc to have a significant linear correlation (Spearman: Rs = 0.56, p < 0.002), implying that as NAA levels decrease, Glx does as well.35 However, at lower field strengths, this region of the MR spectrum is complicated by the overlapping resonances from glutamate, glutamine, and NAA. Therefore, it is possible that changes in Glx are indicative of reductions in NAA due to difficulty in peak isolation.
T cell phenotypes and their expansion during primary HIV infection have been documented previously in both the SIV and HIV immunology literature.13,14,36 More recent studies have underscored the importance of CD8+ T cells both in controlling virus and perhaps contributing to CNS injury.13,37
As NAA and Glx levels decline in cortical gray matter of HIV-infected subjects within the first few months of infection, expansion of total CD8+ cells, especially the effector memory subset, and diminished levels of CD4+ naïve and memory cells within the blood occur. Recent work indicates that similar changes also take place in the CSF at this early stage of infection.14 The declining neuronal markers in subjects with early infection correlated best with total CD8+ and CD8+ effector memory cell expansion. In acute and asymptomatic SIV-infected macaques, control of viral replication in the brain coincided with increased CD8+ T cell infiltration and reduced glial and macrophage activation.26 Early CNS/neuronal disruption in the acute SIV model at 11 weeks postinfection was observed by delays in the electrophysiologic responses.13 Postmortem results as early as 2 weeks postinfection from these animals indicated an influx of the activated effector CD8+ subset that expressed mRNA for cytolytic and proinflammatory molecules, such as granzymes A and B, perforin, and interferon-γ. It is possible that CD8+ T cells, recruited to destroy infected monocytes and macrophages within the CNS, may do harm to bystander neurons, as indicated by decreased NAA and Glx concentrations. Possible processes by which this may occur include free radical-induced oxidative stress, the production of toxic cytokines by infiltrating immune cells, and direct damage to the oligodendrocytes.13,38
However, these trends were not found to carry through to the asymptomatic, chronically infected cohort. Plausible reasons for this include that viral set point has not occurred yet in the early infection subjects, and once established, the correlation may disappear with time. It is also highly possible that the use of antiretrovirals by this chronically infected cohort is disrupting viral, CD4+, and CD8+ kinetics.39,40 Literature is surprisingly stark on brain metabolism changes in the setting of acute viral syndromes (such as influenza, hepatitis, and Epstein-Barr). Therefore, these trends observed in the acute population may not be unique to HIV. Further studies on both early HIV infection and other viral infections will provide details as to the effects of both innate immune and antiretroviral control.
AUTHOR CONTRIBUTIONS
Statistical analysis was performed by Vallent Lee and Dr. Elkan Halpern.
ACKNOWLEDGMENT
The authors thank Kristen Moss, Sarah Placek, Nikki Burgett, RN, and Mary Johnston, RN, for their assistance in identifying subjects and conducting the phlebotomy. They also thank Drs. Tim Lahey and Serena Spudich, who helped initiate this project.
Address correspondence and reprint requests to Dr. Margaret R. Lentz, Harvard Medical School/Massachusetts General Hospital, Building 149, 13th Street, Rm 2301, Charlestown, MA 02129 mlentz@nmr.mgh.harvard.edu
*Drs. Lentz and Kim are co-first authors.
Supported by NIH grants NS051129 (M.R.L.), NS040237 (K.W.), NS037654 and U19MH81835 (K.W.), NS050041 (R.G.G.), AI040873 (E.S.R.), the National Center for Research Resources (P41 RR14075), and the Mental Illness and Neuroscience Discovery (MIND) Institute.
Disclosure: The authors report no disclosures.
Medical Devices: Amplicor Monitor (Roche, Indianapolis, IN); Signa scanner (General Electric, Milwaukee, WI).
Received September 25, 2008. Accepted in final form January 27, 2009.
REFERENCES
- 1.Kassutto S, Rosenberg ES. Primary HIV type 1 infection. Clin Infect Dis 2004;38:1447–1453. [DOI] [PubMed] [Google Scholar]
- 2.Fischer-Smith T, Croul S, Adeniyi A, et al. Macrophage/microglial accumulation and proliferating cell nuclear antigen expression in the central nervous system in human immunodeficiency virus encephalopathy. Am J Pathol 2004;164:2089–2099. [DOI] [PMC free article] [PubMed] [Google Scholar]
- 3.Rosenberg ES, Altfeld M, Poon SH, et al. Immune control of HIV-1 after early treatment of acute infection. Nature 2000;407:523–526. [DOI] [PubMed] [Google Scholar]
- 4.Koup RA, Safrit JT, Cao Y, et al. Temporal association of cellular immune responses with the initial control of viremia in primary human immunodeficiency virus type 1 syndrome. J Virol 1994;68:4650–4655. [DOI] [PMC free article] [PubMed] [Google Scholar]
- 5.Alter G, Teigen N, Ahern R, et al. Evolution of innate and adaptive effector cell functions during acute HIV-1 infection. J Infect Dis 2007;195:1452–1460. [DOI] [PubMed] [Google Scholar]
- 6.Mellors JW, Kingsley LA, Rinaldo CR Jr, et al. Quantitation of HIV-1 RNA in plasma predicts outcome after seroconversion. Ann Intern Med 1995;122:573–579. [DOI] [PubMed] [Google Scholar]
- 7.Chang L, Ernst T, Leonido-Yee M, Walot I, Singer E. Cerebral metabolite abnormalities correlate with clinical severity of HIV-1 cognitive motor complex. Neurology 1999;52:100–108. [DOI] [PubMed] [Google Scholar]
- 8.Yiannoutsos CT, Ernst T, Chang L, et al. Regional patterns of brain metabolites in AIDS dementia complex. Neuroimage 2004;23:928–935. [DOI] [PubMed] [Google Scholar]
- 9.Greco JB, Westmoreland SV, Ratai EM, et al. In vivo 1H MRS of brain injury and repair during acute SIV infection in the macaque model of neuroAIDS. Magn Reson Med 2004;51:1108–1114. [DOI] [PubMed] [Google Scholar]
- 10.Lentz MR, Kim JP, Westmoreland SV, et al. Quantitative neuropathologic correlates of changes in ratio of N-acetylaspartate to creatine in macaque brain. Radiology 2005;235:461–468. [DOI] [PubMed] [Google Scholar]
- 11.Fuller RA, Westmoreland SV, Ratai E, et al. A prospective longitudinal in vivo 1H MR spectroscopy study of the SIV/macaque model of neuroAIDS. BMC Neurosci 2004;5:10. [DOI] [PMC free article] [PubMed] [Google Scholar]
- 12.Willams K, Westmoreland S, Greco J, et al. Magnetic resonance spectroscopy reveals that activated monocytes contribute to the neuronal injury in SIV neuroAIDS. J Clin Invest 2005;115:2534–2545. [DOI] [PMC free article] [PubMed] [Google Scholar]
- 13.Marcondes MC, Burudi EM, Huitron-Resendiz S, et al. Highly activated CD8(+) T cells in the brain correlate with early central nervous system dysfunction in simian immunodeficiency virus infection. J Immunol 2001;167:5429–5438. [DOI] [PubMed] [Google Scholar]
- 14.von Geldern G, Cepok S, Nolting T, et al. CD8 T-cell subsets and viral load in the cerebrospinal fluid of therapy-naive HIV-infected individuals. AIDS 2007;21:250–253. [DOI] [PubMed] [Google Scholar]
- 15.Kassutto S, Johnston MN, Rosenberg ES. Incomplete HIV type 1 antibody evolution and seroreversion in acutely infected individuals treated with early antiretroviral therapy. Clin Infect Dis 2005;40:868–873. [DOI] [PubMed] [Google Scholar]
- 16.Webb PG, Sailasuta N, Kohler SJ, Raidy T, Moats RA, Hurd RE. Automated single-voxel proton MRS: technical development and multisite verification. Magn Reson Med 1994;31:365–373. [DOI] [PubMed] [Google Scholar]
- 17.Keller MA, Venkatraman TN, Thomas A, et al. Altered neurometabolite development in HIV-infected children: correlation with neuropsychological tests. Neurology 2004;62:1810–1817. [DOI] [PubMed] [Google Scholar]
- 18.Provencher SW. Estimation of metabolite concentrations from localized in vivo proton NMR spectra. Magn Reson Med 1993;30:672–679. [DOI] [PubMed] [Google Scholar]
- 19.Hicks CB, Gay C, Ferrari G. Acute HIV infection: the impact of anti-retroviral treatment on cellular immune responses. Clin Exp Immunol 2007;149:211–216. [DOI] [PMC free article] [PubMed] [Google Scholar]
- 20.Mogensen TH, Marinovskij E, Larsen CS. Acute demyelinating encephalomyelitis (ADEM) as initial presentation of primary HIV infection. Scand J Infect Dis 2007;39:630–634. [DOI] [PubMed] [Google Scholar]
- 21.Yoshizawa T, Motonishi S, Saitoh M. [Case of acute primary HIV infection with meningoencephalitis demonstrating high signal intensity of the bilateral globus pallidus in T2-weighted MRI.] Rinsho Shinkeigaku 2007;47:597–600. [PubMed] [Google Scholar]
- 22.McArthur JC, Becker PS, Parisi JE, et al. Neuropathological changes in early HIV-1 dementia. Ann Neurol 1989;26:681–684. [DOI] [PubMed] [Google Scholar]
- 23.Mahadevan A, Shankar SK, Satishchandra P, et al. Characterization of human immunodeficiency virus (HIV)-infected cells in infiltrates associated with CNS opportunistic infections in patients with HIV clade C infection. J Neuropathol Exp Neurol 2007;66:799–808. [DOI] [PubMed] [Google Scholar]
- 24.Williams KC, Corey S, Westmoreland SV, et al. Perivascular macrophages are the primary cell type productively infected by simian immunodeficiency virus in the brains of macaques: implications for the neuropathogenesis of AIDS. J Exp Med 2001;193:905–915. [DOI] [PMC free article] [PubMed] [Google Scholar]
- 25.Gray F, Scaravillio F, Everall I, et al. Neuropathology of early HIV-1 infection. Brain Pathol 1996;6:1–15. [DOI] [PubMed] [Google Scholar]
- 26.Clements JE, Babas T, Mankowski JL, et al. The central nervous system as a reservoir for simian immunodeficiency virus (SIV): steady-state levels of SIV DNA in brain from acute through asymptomatic infection. J Infect Dis 2002;186:905–913. [DOI] [PubMed] [Google Scholar]
- 27.Broderick DF, Wippold FJ, Clifford DB, Kido D, Wilson BS. White matter lesions and cerebral atrophy on MR images in patients with and without AIDS dementia complex. AJR Am J Roentgenol 1993;161:177–181. [DOI] [PubMed] [Google Scholar]
- 28.Heindel WC, Jernigan TL, Archibald SL, Achim CL, Masliah E, Wiley CA. The relationship of quantitative brain magnetic resonance imaging measures to neuropathologic indexes of human immunodeficiency virus infection. Arch Neurol 1994;51:1129–1135. [DOI] [PubMed] [Google Scholar]
- 29.Lee PL, Yiannoutsos CT, Ernst T, et al. A multi-center 1H MRS study of the AIDS dementia complex: validation and preliminary analysis. J Magn Reson Imaging 2003;17:625–633. [DOI] [PubMed] [Google Scholar]
- 30.Chang L, Ernst T, Leonido-Yee M, et al. Highly active antiretroviral therapy reverses brain metabolite abnormalities in mild HIV dementia. Neurology 1999;53:782–789. [DOI] [PubMed] [Google Scholar]
- 31.Stankoff B, Tourbah A, Suarez S, et al. Clinical and spectroscopic improvement in HIV-associated cognitive impairment. Neurology 2001;56:112–115. [DOI] [PubMed] [Google Scholar]
- 32.Lopez-Villegas D, Lenkinski RE, Frank I. Biochemical changes in the frontal lobe of HIV-infected individuals detected by magnetic resonance spectroscopy. PNAS 1997;94:9854–9859. [DOI] [PMC free article] [PubMed] [Google Scholar]
- 33.Thompson PM, Dutton RA, Hayashi KM, et al. Thinning of the cerebral cortex visualized in HIV/AIDS reflects CD4+ T lymphocyte decline. PNAS 2005;102:15647–15652. [DOI] [PMC free article] [PubMed] [Google Scholar]
- 34.Mohamad MA, Sacktor NC, Skolasky RL, Moxley RT, Pomper MG, Barker PB. 3 Tesla MR spectroscopy reveals decreased glutamate and glutamine levels in frontal white matter in HIV-associated dementia. ISMRM 2007;15:2140. [Google Scholar]
- 35.Sailasuta N, Shriner K, Ross B. Evidence of reduced glutamate in the frontal lobe of HIV seropositive patients. NMR Biomed 2008;22:326–331. [DOI] [PubMed] [Google Scholar]
- 36.Hess C, Altfeld M, Thomas SY, et al. HIV-1 specific CD8+ T cells with an effector phenotype and control of viral replication. Lancet 2004;363:863–866. [DOI] [PubMed] [Google Scholar]
- 37.von Herrath M, Oldstone MB, Fox HS. Simian immunodeficiency virus (SIV)-specific CTL in cerebrospinal fluid and brains of SIV-infected rhesus macaques. J Immunol 1995;154:5582–5589. [PubMed] [Google Scholar]
- 38.Kaul M, Lipton SA. Mechanisms of neuroimmunity and neurodegeneration associated with HIV-1 infection and AIDS. J Neuroimmune Pharmacol 2006;1:138–151. [DOI] [PubMed] [Google Scholar]
- 39.Streeck H, Brumme ZL, Anastario M, et al. Antigen load and viral sequence diversification determine the functional profile of HIV-1 specific CD8+ T cells. PLoS Med 2008;5:e100. [DOI] [PMC free article] [PubMed] [Google Scholar]
- 40.Neuenburg JK, Cho TA, Nilsson A, et al. T-cell activation and memory phenotypes in cerebrospinal fluid during HIV infection. JAIDS 2005;39:16–22. [DOI] [PubMed] [Google Scholar]