

Abstract
Microsatellite instability (MSI) is a hallmark of mismatch repair deficiency. High levels of MSI at mono- and dinucleotide repeats in colorectal cancer (CRC) are attributed to inactivation of the mismatch repair genes, hMLH1 and hMSH2. CRC with low levels of MSI (MSI-L) exists; however its molecular basis is unclear. There is another type of MSI - “elevated microsatellite alterations at selected tetranucleotide repeats” - (EMAST) where loci containing [AAAG]n or [ATAG]n repeats are unstable. EMAST is frequent in non-colorectal cancers; however the incidence of EMAST and its cause in CRC is not known. Here, we report that MSH3-knock-down or MSH3-deficient cells exhibit the EMAST phenotype and low levels of mutations at dinucleotide repeats. About 60% of 117 sporadic CRC cases exhibit EMAST. All of the cases defined as MSI-H (16 cases) exhibited high levels of EMAST. Among 101 non-MSI-H cases, all 19 cases of MSI-L and 35 of 82 cases of MSS exhibited EMAST. Although non-MSI-H CRC tissues contained MSH3-negative tumor cells ranging from 2-50% of the total tumor cell population, the tissues exhibiting EMAST contained more MSH3-negative cells (average 31.5%) than did the tissues not exhibiting EMAST (8.4%). Taken together, our results support the idea that MSH3-deficiency causes EMAST or EMAST with low levels of MSI at the loci with dinucleotide repeats in CRC.
Keywords: Microsatellite Instability, MSH3, Colorectal Cancer, DNA Mismatch Repair, Elevated Microsatellite Alterations at Selected Tetranucleotide Repeats (EMAST)
Introduction
Defects in the mismatch repair (MMR) system result in a mutator phenotype, manifesting as microsatellite instability (MSI) in DNA of affected cells. Colorectal cancers (CRC) exhibiting MSI can be classified as MSI-high (MSI-H) or MSI-low (MSI-L), based on frequency of mutations at microsatellite loci (1, 2). MSI-H CRCs have been defined as those exhibiting MSI at a threshold of >30-40% of loci examined. These tumors are defective in MMR activity, usually following losses of hMSH2 or hMLH1 (1, 2). Most Lynch syndrome CRC tumor specimens with germline mutations in hMSH2 or hMLH1 exhibit MSI-H (3), as do all sporadic CRCs where the hMLH1 gene has been silenced by promoter hypermethylation (4). Microsatellite loci containing mono-, di-, tri-, and tetranucleotide repeats may be affected in MSI-H tumors (1).
MSI-L CRCs have mutations at <30-40% of microsatellite loci, and are usually found in non-familial cases (1, 2). These cancers rarely exhibit MSI in loci containing mononucleotide repeats (1); however, they often exhibit MSI at the MYCL1 locus, which harbors [AAAG]n tetranucleotide repeats (2, 5). In many non-colorectal human cancers, a subset of tumors show high or low frequency MSI at loci containing mono- or dinucleotide repeats, similar to MSI-H and MSI-L colorectal tumors respectively (2). However, there is another type of MSI where mutations rarely occur at loci with mono- or dinucleotide repeats, but occur frequently at loci with tri- or tetranucleotide repeats (2, 6). Increase in instability at certain tetranucleotide repeat markers containing [AAAG]n or [ATAG]n is frequently found in non-small cell lung (7, 8), head and neck (8), bladder (8, 9, 10), kidney (8), skin (9) and ovarian (11) cancers. This mutational signature has been termed “elevated microsatellite alterations at selected tetranucleotide repeats” (EMAST) (2). Both MSI-L and EMAST rarely exhibit MSI in loci consisting of mononucleotide repeats, but frequently exhibit MSI in loci containing [AAAG]n repeats, suggesting that MSI-L and EMAST may share a similar molecular basis. However, the mechanisms underlying MSI-L and EMAST are not known (11, 12).
To date, six MMR genes have been identified in eukaryotes. These include three homologs of the Escherichia coli MutS gene: MSH2, MSH3, MSH6, and the MutL homologs MLH1, PMS2 and MLH3 (13). According to the current model, DNA mismatch recognition is mediated by MutSα, a heterodimer of MSH2 and MSH6, or MutSβ, a heterodimer of MSH2 and MSH3 (14, 15, 16). MutSα recognizes the majority of base/base mismatches (14, 15, 16). Both MutSα and MutSβ recognize small insertion/deletion loops (IDLs) with up to 10 unpaired nucleotides (17, 18). In yeast, although both MutSα and MutSβ play a role in repairing IDLs containing one and two unpaired nucleotides (16,17), MutSβ plays a more dominant role in repairing IDLs with more than four unpaired nucleotides (19). In humans, both MutSβ and MutSα are competent for repairing IDLs containing one to ten unpaired nucleotides (18, 20, 21, 22, 23), but MutSβ has a stronger affinity for recognizing more than two unpaired nucleotides (18, 21). Furthermore genetic complementation of MSH3-deficiency in human cells increased stability at loci containing di- and tetranucleotide repeats (22). Thus, it seems plausible that loss of MutSβ due to MSH3 inactivation in human cells may result in MSI not only at loci containing dinucleotide repeats, but also at loci with tetranucleotide repeats, such as EMAST loci.
In this study, we first addressed whether down-regulation or loss of MSH3 results in instability at EMAST and other loci containing mono- and dinucleotide repeats. To answer this question, we generated MSH3-positive and -negative cell lines, and examined them for stability at mono-, dinucleotide microsatellite and EMAST loci. We then examined whether MSI at EMAST loci is common in CRC, and determined the relationships between EMAST and MSI-H, MSI-L and MSS status in CRC as defined by five consensus NCI microsatellite markers including BAT25, BAT26 D2S123, D5S346, D17S250, plus two additional dinucleotide markers (D18S64 and D18S69). Finally, we analyzed CRC tissues for expression of MSH3 by immunohistochemical (IHC) staining using an anti-MSH3 antibody. Our data show that MSH3-deficiency is associated with EMAST and low levels of instability at the loci with dinucleotide repeat in both cell lines and CRC tissues.
Materials and Methods
Cell Culture
The human CRC cell lines, HCT116 and HCT116+3-clone 6, were described previously (24). HCT116 cells were grown in Dulbecco's modified Eagle medium with 10% fetal bovine serum. HCT116+3-clone 6 was grown in growth medium plus 400 μg/ml G418 (25). Mouse A9 cells containing a blasticidin resistant gene-marked human chromosome 5 (A9+5) (24) were maintained in growth medium containing 6 μg/ml blasticidin S (Invitrogen, Carlsbad, CA). The human CRC cell line WiDr was maintained in growth medium containing 10% serum.
Microcell-Mediated Chromosome Transfer
The method for microcell-mediated chromosome transfer has been described (24). Microcells isolated from A9+5 cells were fused to HCT116 and HCT116+3. After 24 h, the cells were trypsinized, pelleted, resuspended, and plated into growth medium containing 6 μg/ml of blasticidin S. After 10 days, growing colonies were isolated, expanded and analyzed for hMSH3 expression.
Single-Stranded Conformational Polymorphism Analysis
Genomic DNA isolated from A9+5, HCT116, HCT116+3, HCT116+5, and HCT116+3+5 was subjected to PCR amplification of hMSH3 exon 7. Primers used were a forward primer (5′–GAGATAATGACTGATACTTCTACC-3′) and a reverse primer (5′–CATTTGTTCCTCACCTGCAAAG-3′). Samples were heated to 85°C for 5 minutes, loaded onto 20% TBE gel (Invitrogen), and run at 300V and 9°C. The gel was silver-stained with a SilverXpress kit (Invitrogen).
cDNA Isolation and Sequencing
Total mRNA was isolated from normal human lymphocytes, HCT116+3, HCT116+5 and HCT116+3+5 using a QuickPrep Total RNA Extraction kit (GE Healthcare, Little Chalfont, UK). Oligo dT-primed cDNAs were synthesized from 2 μg total RNA using a First-Strand cDNA Synthesis kit (Invitrogen). hMSH3 cDNA was prepared by reverse transcriptase using a forward primer (5′-GACTGTTTGTTCAT GTACGC-3′) and a reverse primer (5′-ACTATCAAACACAACCTCGC-3′), and sequenced using an ABI PRISM dye terminator kit with an ABI 373 fluorescent sequencer (Applied Biosystems).
Western Blot Analysis
Anti-hMSH3 monoclonal mouse antibody (Clone 52) and anti-hMLH1 mouse monoclonal antibody (Clone G168-728) were obtained from BD Biosciences Pharmingen (San Jose, CA). Heat-denatured cell lysates (50 μg) were subjected to electrophoresis in a 10% polyacrylamide gel with sodium dodecyl sulphate. Separated proteins were electroblotted to a polyvinylidene difluoride membrane. The membrane was treated with primary antibody followed by treatment with horseradish peroxidase-conjugated goat anti-mouse immunoglobulin G. Horseradish peroxidase was detected by exposure to film with ECL reagent (GE Healthcare, Little Chalfont, UK) and visualized by the Storm imaging system. As a positive control, an extract from the human CRC cell line, WiDr, was used.
Vector Construction, DNA Transfection, siRNA Expression
The tetracycline-regulated retroviral vector, TMP (Open Biosystems, Huntsville, AL) was used to construct a plasmid expressing siRNA against the hMSH3 message. The vector contains a tetracycline regulated Pol II promoter that directs expression of downstream genes including a puromycin resistance gene and GFP genes under the regulation of the transcription factor tTA. Construction of the siRNA expression plasmid was performed according to the manufacturer's protocols. Nineteen coded oligonucleotides (5′-GCAAGGAGTTATGGATTAA-3′) in exon 23 of the hMSH3 gene (26) were inserted into the TMP vector. The resulting vector (pMSH3si) was clone purified and the inserts were verified by DNA sequencing. The HCT116+3+5 cells were co-transfected with a pMSH3si plus pTet-off vector (BD Biosciences) encoding tTA, using Effectene® Transfection Reagent (QIAGEN, Hilden, Germany). After transfection, the cells were selected using 0.6 μg/ml of puromycin for 10 days. The resulting clones were isolated and examined under a fluorescent microscope to detect GFP expression. To turn off the expression of the siRNA, 100 ng/ml of doxycycline (Dox) (BD Biosciences) was added to the culture medium.
Single Clone Microsatellite Assay
The method for single cell MSI assay has been described (24). Genomic DNA from single clones was subjected to DNA amplification and microsatellite analysis as described below. The microsatellite markers used for this assay were BAT25, BAT26, D2S123, D5S346, D17S250, D17S791, MYCL1, D19S394, and D9S242.
Tissue and DNA Extraction
117 unselected sporadic CRCs and corresponding normal tissues were collected at the University of California San Diego (UCSD) under IRB approval. For DNA extraction, tumor and normal tissues were microdissected separately from paraffin-embedded sections (5 μm) according to procedures previously described (27). Genomic DNA was isolated from microdissected tissues using GenReleaser (Bioventures Inc, Murfreesboro, TN) and treated with proteinase K. A second cohort of 88 unselected sporadic CRCs (bearing “CR” in their identifiers) and corresponding normal tissues were collected from patients treated at Toho University Ohmori Hospital (Tokyo).
DNA Amplification and Microsatellite Analysis for CRC tissues
Two methods were used for microsatellite analysis. In the first method, genomic DNA was amplified and labeled with radioisotope by 35-40 cycles of PCR as previously described (27). Following denaturation in formamide at 95°C for 5 min, PCR products were separated on an 8% polyacrylamide gel containing 7.5M urea and exposed to X-ray films. The resulting band images between tumor and normal samples were visually compared. In the second method, PCR amplifications were performed from genomic DNA using fluorescently labeled primers. After heat denaturation, amplified PCR products were electrophoresed on an ABI PRISM 3100 Avant Genetic Analyzer (Applied Biosystems, Foster City, CA) and analyzed by GeneMapper fragment analysis software (Applied Biosystems). Five markers with dinucleotide repeats (D2S123, D5S346, D17S250, D18S64, and D18S69), two markers with mononucleotide repeats (BAT25 and BAT26), and seven EMAST markers (MYCL1, D20S82, D20S85, L17835, D8S321, D9S242 and D19S394) were used. The primer sequences and PCR conditions for D2S123, D5S346, D17S250, D18S64, MYCL1 and L17835 were described previously (1, 7). Those of D18S6, D20S82, D20S85, D8S321, D9S242, D18S64 and D19S394 were found in the Genome Database. Tumors were categorized as follows: 1) MSI-H: tumors exhibiting MSI at three or more of the seven mono- or dinucleotide; 2) MSI-L: tumors exhibiting MSI at one or two of the seven markers; 3) MSS: tumors which did not exhibit MSI at any of the seven markers; 4) EMAST: tumors exhibiting MSI at more than one locus among the seven EMAST markers; and 5) Non-EMAST: tumors which did not show MSI at any of the EMAST markers.
MSH3 IHC
Nineteen cases (USCD cohort) and 27 cases (Toho cohort) were subjected to MSH3 IHC. Paraffin-embedded tissues were deparaffinized and rehydrated. After antigen retrieval (121°C for 15 min in 0.01 M citrate buffer, pH 6.0), the tissues were treated with anti-MSH3 antibody (28) overnight at 4°C, followed by incubation with secondary antibody.
Staining was developed by diaminobenzide chromogen and counterstained with hematoxylin. The brown and blue signals indicate the presence (brown) or absence (blue) of MSH3 immunoreactivity. To determine the percentage of MSH3-negative cells in a tissue, all of the nuclei present in ten randomly chosen sites using the 40× objective lens were scored for MSH3 expression. An average of ∼6000 nuclei per case was examined. As a negative control for MSH3 staining, CRC tissues from MSH2-negative patients were used. The examiner for the IHC was blinded to the MSI and EMAST data.
Statistical Analysis
Groups were compared using Fisher's exact test, the chi-square test, Student's t-test, and the Steel-Dwass test. Analyses were performed using JMP software, version 5.1 (SAS Institute) and Excel Statistics for Windows 2006 software (Social Survey Research Information Co., Ltd., Tokyo, Japan). All P values are two-sided and any P value less than 0.05 was considered statistically significant.
Results and Discussion
MSI profiles caused by loss of MSH3 in cultured colon cancer cell lines
The human colon cancer cell line, HCT116, is defective in MLH1 (MLH1-) and MSH3 (MSH3-). The MLH1-deficiency in HCT116 is corrected by stable transfer of a normal copy of human chromosome 3 into HCT116+3 (24). To examine the degree of instability at microsatellite loci containing mono- and dinucleotide repeats, and EMAST loci in HCT116 (MSH3-/MLH1-) and HCT116+3 (MSH3-/MLH1+), we measured mutation frequencies at these loci using a single clone microsatellite assay. 165 clones from HCT116+3 were analyzed. No mutations were detected in the BAT26 locus, suggesting that transfer of wild-type hMLH1 corrects MSI at mononucleotide repeats (Table 1; Supplementary Table S1). D17S791, which contains [CA]n repeats, showed significantly lower levels of instability in HCT116+3 than were observed in HCT116. In contrast, a comparable mutation frequency was observed at EMAST loci in HCT116+3 and HCT116, including MYCL1, D19S394 and D9S242 (Table 1; Supplementary Table S1). These results suggest that complementation of an MLH1-defect via chromosome 3 transfer stabilizes loci containing [A]n and [CA]n repeats, and fails to stabilize EMAST loci in HCT116.
Table 1. The effect of MSH3-deficiency and/or MLH1-deficiency on stability of various microsatellite loci.
| No. of subclones with MSI/No. of sub-clones examined at each locus (%) | |||||
|---|---|---|---|---|---|
| Cell lines
(MMR status) |
BAT26 [A]n |
D17S791 [CA]n |
MYCL1 [AAAG]n |
D19S394 [AAAG]n |
D9S242 [AAAG]n |
| HCT116
(MLH1-, MSH3-) |
5/49 (10)† | 22/56 (39)† | 6/48 (13)† | 6/33 (18)† | 6/30 (20)† |
| HCT116+3
(MLH1+, MSH3-) |
0/165 (0)* | 4/178 (2)* | 16/186 (9)† | 5/36 (14)† | 4/32 (13)† |
| HCT116+5
(MLH1-, MSH3+) |
4/54 (7)† | 18/54 (33)† | 6/55 (11)† | 4/32 (13)† | 2/32 (6)N.S. |
| HCT116+3+5
(MLH1+, MSH3+) |
0/169 (0)* | 0/172 (0)* | 0/187 (0)* | 0/35 (0)* | 0/35 (0)* |
Frequency of mutations was significantly different from HCT116 according to Fisher's exact test (Supplementary Table S1)
Frequency of mutations was significantly different from HCT116+3+5 according to Fisher's exact test (Supplementary Table S1)
N.S.: Not significant
Because HCT116 contains homozygous frameshift mutations of the [A]8 repeat in exon 7 of the hMSH3 gene (22), we examined the effects of introduction of a normal copy of hMSH3 into HCT116 and HCT116+3 via chromosome 5 transfer. Human chromosome 5 tagged with a blasticidin-resistant gene (25) was transferred from mouse A9 hybrid cells to HCT116 and HCT116+3 using microcell fusion. Several blasticidin-resistant clones were isolated and analyzed for presence of a wild type-hMSH3 gene by SSCP analysis. As shown in Figure 1A, HCT116+5 and HCT116+3+5 contained the wild-type (W) hMSH3 allele observed in the chromosome donor (A9+5), in addition to a mutated allele (M). In contrast, HCT116 and HCT116+3 contained only the mutated allele. cDNA sequence data for exon 7 from normal human lymphocyte cells, HCT116, HCT116+3, HCT116+5 and HCT116+3+5 revealed that HCT116+5 and HCT116+3+5 expressed wild-type and mutant MSH3 mRNA (Fig. 1B). The expression of MSH3 was detected in WiDr, HCT116+5 and HCT116+3+5 but not in HCT116 or HCT116+3 by Western blotting (Fig. 1C). These results indicate that in HCT116+5 and HCT116+3+5, the transferred hMSH3 is expressed at the mRNA and protein level.
Fig. 1. Expression of hMSH3 in HCT116 derivatives.

A: hMSH3 single stranded conformational polymorphism (SSCP) analysis. DNA from A9+5, HCT116, HCT116+3, HCT116+5, and HCT116+3+5 was subjected to PCR using hMSH3 specific primers, and the PCR products were denatured and separated on an TBE gel. A9+5, HCT116+5, and HCT116+3+5 contain wild-type bands (W) in addition to mutated bands (M).
B: Sequencing of exon 7 containing [A]8 repeats of hMSH3 cDNA. cDNA from normal lymphocytes contains [A]8 whereas cDNA from HCT116+3 contains [A]7. A mixed peak signal (N) at the 3′ end of the [A]7 tract was detected in cDNA from HCT116+5 and HCT116+3+5.
C: Western blot analysis for MSH3 and MLH1 expression using mouse monoclonal anti-MSH3 and anti-MLH1 antibodies. WiDr was used as a positive control for MSH3 and MLH1 expression. No MSH3-specific band was detected in HCT116, HCT116+3, or HCT116+3+5 clone G5, whereas MSH3 was detected in HCT116+5, HCT116+3+5, and HCT116+3+5 clone G5 cultivated under the presence of doxycycline (Dox). MLH1 expression was detected in HCT116+3 and HCT116+3+5 but not in HCT116 and HCT116+5.
We then determined whether expression of MSH3 correlates with stabilization of microsatellite loci in HCT116+5 (MSH3+/MLH1-) and HCT116+3+5 (MSH3+/MLH1+) by performing single clone MSI assays. HCT116+5 exhibited high levels of MSI at all loci examined, suggesting that lack of MLH1 expression results in MSI not only at loci with [A]n and [CA]n repeats, but also at EMAST loci. In contrast, complete stabilization was observed at all microsatellite loci in HCT116+3+5 (Table 1). When HCT116+3+5 was compared with HCT116+3, the presence of MSH3 significantly correlated with stabilization of the EMAST loci MYCL1 (P<0.0001) and D9S242 (P=0.047), and strongly correlated with stabilization of D19S394 (P=0.054) (Table 1; Supplementary Table S1). These results indicate that restoration of the expression of MSH3 by chromosome 5 transfer into HCT116+3 is associated with stabilization of EMAST loci.
To provide direct evidence for a role of MSH3 on instability of EMAST loci, we constructed an HCT116+3+5 cell line whose MSH3 was down-regulated by siRNA expression targeted to its message. To generate this cell line, we constructed an MSH3-siRNA expression vector (pMSH3si) containing 19 coded nucleotides in exon 23 of the hMSH3 locus (26). The cells were co-transfected with pMSH3si and pTet-Off plasmids, and selected with puromycin. Drug-resistant clones were isolated and subjected to fluorescent microscopy to detect expression of GFP. GFP-positive clones were further subjected to Western blot analysis for MSH3 expression. As shown in Figure 1C, clone G5 revealed down-regulated MSH3. Re-expression of MSH3 was seen when G5 cells were cultivated in the presence of Dox (Fig. 1C). Comparing G5 cells with G5 cells exposed to Dox, there was no difference in the expression levels of any of the other MMR proteins, including MLH1 (Fig. 1C), MSH2 and MSH6 (not shown). These results indicate that down-regulation of MSH3 can be specifically controlled by the expression of MSH3-specific siRNA.
We next isolated ∼70 independent clones each from G5 cells and G5 cells exposed to Dox during clonal growth, and performed single clone MSI analysis for five consensus NCI markers (BAT25, BAT26, D2S123, D5S346, D17S250) and 3 EMAST markers (MYCL1, D19S394 and D9S242). As shown in Table 2, the MSI pattern obtained in clones from MSH3 negative G5 cells is similar to that of HCT116+3 clones. Both exhibited complete stability at loci containing mononucleotide repeats, low levels of instability at loci containing dinucleotide repeats and high levels of instability at the EMAST loci (Tables 1 & 2). Average frequencies of mutation at EMAST loci including MYCL1, D19S394 and D9S242 and at dinucleotide repeat loci including D2S123, D5S346 and D17S250 in MSH3-negative cells were 10.3% and 1.9% respectively, suggesting that EMAST loci are nearly five times as unstable as dinucleotide repeat loci when MSH3 is absent. Re-expression of MSH3 in G5 cells by Dox greatly decreased frequency of mutations at all loci with [CA]n repeats and at EMAST loci (Table 2).
Table 2. The effect of down-regulation of MSH3 on stability at various microsatellite loci.
| No. of sub-clones with MSI/No. of sub-clones examined (%) at | ||||||||||
|---|---|---|---|---|---|---|---|---|---|---|
| Cell lines |
BAT25 [A]n |
BAT26 [A]n |
D2S123 [CA]n |
D5S346 [CA]n |
D17S250 [CA]n |
D2S123+D5S346+D17S250 |
MYCL1 [AAAG]n |
D19S394 [AAAG]n |
D9S242 [AAAG]n |
MYCL1+D19S394+D9S242 |
| G5
(MLH1+, MSH3-) |
0/68 | 0/68 | 2/70 (3) | 1/67 (1) | 1/69 (1) | 4/206 (2) | 9/64 (14) | 7/70 (10) | 5/70 (7) | 21/204 (10) |
| G5
plus Dox (MLH1+, MSH3+) |
0/68 | 0/68 | 0/72 | 0/72 | 0/72 | 0/216 | 0/72 | 0/71 | 1/69 (1) | 1/212 (0.5) |
| P* | 0.24 | 0.48 | 0.49 | 0.056 | 0.0008 | 0.006 | 0.21 | <0.00001 | ||
P values were determined according to Fisher's exact test
We found no significant effect of MSH3 deficiency on stability of dinucleotide repeats D2S123, D5S346, and D17S250 when each locus was subjected to Fisher's exact test individually. However, a statistically insignificant but stronger effect was found when all three loci were combined for analysis (P=0.056, Table 2). These results suggest that a larger sample may be needed to detect significant MSI in MSH3-negative cells at [CA] n repeat loci because of the low level of instability at these loci. A significant effect of MSH3-deficiency was detected at MYCL1 (P=0.0008) and D19S394 (P=0.006), and the three EMAST loci combined (P<0.00001). Taken together, the results indicate that loss of MSH3 results in a high degree of instability at EMAST loci, and in a lower degree of instability at microsatellites with [CA]n repeats.
High incidence of EMAST tumors in human CRC
The above results suggest that some MSI-L in CRC may be due to MSH3 deficiency. If this is the case, our results predict that these MSI-L tumors will exhibit MSI at EMAST loci. To test this, we performed experiments to determine whether MSI at EMAST loci is common in clinical CRC specimens, and examined its relationship to MSI-H, MSI-L and MSS status defined by consensus NCI microsatellite markers.
Paired normal and tumor tissues from 117 unselected sporadic CRC cases were collected at the University of California San Diego (UCSD). DNA from these samples was analyzed for MSI using five consensus NCI microsatellite markers (BAT25, BAT26, D2S123, D5S346, D17S250) plus D18S64 and D18S69. Analysis identified 16 MSI-H cases (13.7%), 19 MSI-L cases (16.2%), and 82 MSS cases (70.1%) (Table 3; Supplementary Figure S1). We analyzed all cases for MSI at the 7 EMAST loci including MYCL1, D20S82, D20S85, L17835, D8S321, D9S242 and D19S394. Tumors showing MSI in at least one EMAST locus were categorized as MSI-H/EMAST, MSI-L/EMAST or MSS/EMAST. MSS tumors that did not show MSI at any EMAST markers were defined as MSS/non-EMAST. Seventy of the 117 CRC cases (60%) exhibited mutations in at least one EMAST locus (Table 3). All MSI-H cases (16 cases) and MSI-L cases (19 cases) and 35 of 82 MSS cases were positive for EMAST, indicating that this mutational signature is common in CRC. MSI-L is always associated with EMAST in CRC. This was found to be the case for the MSH3-deficient cell line described above (Tables 1 and 2). These results support the idea that MSI-L may be caused by MSH3-deficiency. It has been reported that many, perhaps most, MSS CRC tumors are MSI-L (29, 30). Therefore, it is possible that the majority of the MSS/EMAST cases found in this study could be identified as MSI-L/EMAST if additional dinucleotide markers were examined. If this is the case, 46% of CRC (19 cases of MSI-L/EMAST and 35 case of MSS/EMAST) could be affected by MSH3-dificiency.
Table 3. High prevalence of EMAST in CRC.
| No. of EMAST cases (%) | No. of non-EMAST cases (%) | Total | |
|---|---|---|---|
| MSI-H | 16 | 0 | 16 (13.7) |
| MSI-L | 19 | 0 | 19 (16.2) |
| MSS | 35 | 47 | 82 (70.1) |
|
| |||
| Total | 70 (59.8) | 47 (40.2) | 117 |
EMAST: a tumor with more than 1 EMAST marker exhibiting mutation
non-EMAST: a tumor with no mutations in any of 7 EMAST markers examined
In MSI-H/EMAST cases, the high frequency of mutations at EMAST loci can be entirely explained by MLH1 deficiency. As all are sporadic CRCs, it is likely that the MSI-H cases contain hypermethylated hMLH1 alleles (27). Moreover, the results of the MSI assay for HCT116+5 and HCT116+3+5 suggest that MLH1 deficiency results in a high frequency of mutations at EMAST markers (Table 1). Thus, our results suggest that the MSI-H/EMAST phenotype may be caused by MLH1-deficiency.
Association of EMAST with down-regulation of MSH3 expression in CRC tissues
To determine whether MSI-L/EMAST and MSS/EMAST tumors exhibit loss or down-regulation of MSH3, we performed IHC staining of 46 CRC tissues for the expression of the MSH3 protein. Because only 19 cases from our UCSD cohort were available for IHC studies, an additional 27 samples were obtained from a second cohort of 88 sporadic CRC cases collected at Toho University, Japan. These 27 cases were analyzed for MSI using the same panel of 7 NCI markers and 7 EMAST markers (Fig. 2). (Details of our analysis of these tumors will be published elsewhere.)
Fig. 2. Association of the EMAST phenotype with down-regulation of MSH3 in CRC.
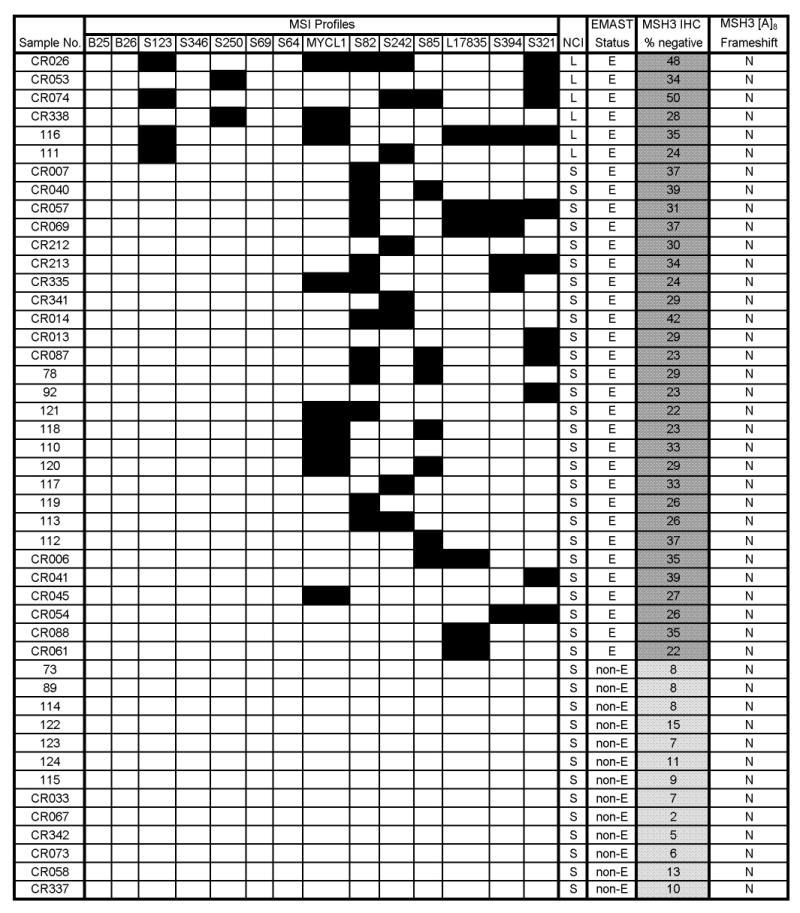
This figure provides detailed data from the 46 CRCs analyzed for expression of MSH3 by IHC. The columns depict the following data: MSI data for 2 markers with mono-A repeats (BAT-25 and -26), 5 markers with CA repeats (S123 through S64), 7 EMAST markers (MYCL1 through S321), MSI status at NCI markers (“NCI”), EMAST status, IHC for MSH3 protein expression, and analysis for frameshift mutations in [A]8 in exon 7 of the hMSH3 locus. For MSI data, a solid box indicates the presence of a mutation. For MSI using the NCI panel, L indicates MSI-L, and S indicates MSS. For EMAST status, E indicates EMAST positive and non-E indicates EMAST negative. For MSH3 IHC, the darker gray boxes represent MSH3-negative with more than 15% of cells down-regulating MSH3, and lighter gray boxes represent MSH3-positive with fewer than 15% of cells down-regulating MSH3. The numbers within the boxes represent the percentage of MSH3-negative cells in each tissue. For MSH3 frameshift mutation, N represents no mutations detected. Abbreviations used for each marker are as follows: B25: BAT25, B26: BAT26, S123: D2S123, S346: D5S346, S250: D17S250, S69: D18S69, S64: D18S64, S82: D20S82, S242: D9S242, S85: D20S85, S394: D19S394, S321: D8S321.
In total, 6 cases of MSI-L/EMAST, 27 cases of MSS/EMAST and 13 cases of MSS/non-EMAST CRCs were stained with a rabbit anti-MSH3 polyclonal antibody (28). As a positive control for MSH3-negativity, we stained CRCs known to be negative for MSH2 expression, because MSH3 is unstable and not detected in these tumors. By immunostaining, we could readily distinguish between MSH3-positive and -negative cells. In the majority of EMAST cases, we observed patchy staining for MSH3. Although MSH3-negative cells tend to be seen in clusters, MSH3-positive cells are found adjacent to MSH3-negative cells (Fig. 3). The sporadic and heterogeneous MSH3 expression in EMAST cases is quite different from what was observed in MSH2-negative cases, where loss of MSH3 is clonal and homogeneous. Because there were obvious differences in the number of MSH3-negative cells among our cases, we determined the percentage of MSH3-negative cells in a given sample by counting ∼6000 tumor cell nuclei. A significant difference in the presence of MSH3-negative cells was found between EMAST and non-EMAST tumors when the average percentage of MSH3-negative cells for EMAST - 31.5% - (95%CI; 29.3 to 33.7), and the average percentage of MSH3-negative cells for non-EMAST - 8.4% - (95%CI; 4.8 to 11.9), were compared using Student's t-test (P<0.0001). This shows that EMAST tumors contain significantly more MSH3-negative cells than do non-EMAST tumors. Based on the above, we defined tumors as MSH3-positive if MSH3-negative cells occupy ≤15% of all tumor cells. If MSH3-negative cells occupy >15% of the cellular population, the tumors were defined as MSH3-negative.
Fig. 3. MSH3 expression in non-EMAST and EMAST CRCs.

A1 (× 100) & A2 (× 400): A non-EMAST CRC with homogenous MSH3 expression.
B1 (× 100) & B2 (× 400): An EMAST CRC with heterogeneous MSH3 expression.
Arrows indicate a MSH3-negative region.
We next analyzed all 163 CRC cases for frameshift mutations at exon 7 of the hMSH3 gene by fragment analysis, and found no evidence of mutations, except in five MSI-H tumors (Figure 2; Supplementary Fig. S1). These results were expected since frameshift mutations in the [A]8 repeat are secondary to a previously occurring defect in the hMLH1 gene (28).
Despite a significant association between the quantity of MSH3-negative cells and the EMAST phenotype, it is not clear how MSH3-negativity relates to EMAST in CRC tissues. As mentioned above, in most EMAST tumors, MSH3-positive and MSH3-negative cells are interspersed (Fig. 3). A possible explanation for this is that MSH3-negativity is a reversible trait. If this is the case, we may find some MSH3-positive cells exhibiting EMAST. To test this possibility, three cases of EMAST/MSH3-negative CRCs (Samples 92, 113 and 118) and four cases of non-EMAST/MSH3-positive CRCs (Samples CR058, CR337, CR067 and 115) were analyzed. EMAST profiles were examined from two to three locations within each tumor. Three EMAST/MSH3-negative tumors were found to contain sub-regions with a high percentage of MSH3-negative cells (31∼79%) as well as a sub-region with a high percentage of MSH3-positive cells (90∼96%) (Supplementary Figure S2). DNA was isolated from each of these regions and subjected to EMAST analysis. In all three cases, MSI was detected in the MSH3-negative regions as well as in the MSH3-positive regions (Supplementary Figure S2). The same or similar loci were affected in both the positive and negative regions, indicating that the tumor cells residing in each region shared the same EMAST ancestor cells.
These results support the concept that down-regulation of MSH3 may be reversible. We also analyzed four cases of non-EMAST/MSH3-positive CRC for the presence of local EMAST. In all cases except CR058, tissues were uniformly occupied by a high level of MSH3-positive cells (90∼99%). Three randomly chosen regions of CR337, CR067 and 115 tumors were analyzed for EMAST. MSI was not detected in any of the sub-regions of these three tumors (Supplementary Figure S2). In contrast, tumor CR058 was found to contain an MSH3-negative sub-region and MSH3–positive regions. MSI was detected in MSH3-negative regions but not in the MSH3-positive regions of this tumor (Supplementary Figure S2). Taken together, these results suggest the following. In EMAST/MSH3-negative tumors, down-regulation of MSH3 expression and its consequence - the appearance of EMAST - may take place in the tumor progenitor cell before or during the latest clonal expansion. This is followed by re-expression of MSH3 in some progeny cells. Thus, MSH3-negative and MSH3-positive progeny have an MSI signature similar to that of their ancestor cells. In non-EMAST/MSH3-positive tumors, a tumor progenitor cell would not have experienced down-regulation of MSH3 before the last clonal expansion. The presence of the local EMAST cells found in CR058 could be explained by down-regulation of MSH3 in local progeny cells.
What might be the mechanistic basis for reversible expression of MSH3? It has been reported that hypoxia down-regulates MMR proteins in human tumor cell lines (31). Our preliminary experiments show that hypoxia down-regulates MSH3 expression and re-oxygenation induces re-expression of MSH3 in tissue cultured cells (data not shown). Furthermore, over-expression of glucose transporter-1, an indicator of hypoxic response (32), correlates with MSH3-negativity and EMAST in the CRC tissues examined in this study. An intensive investigation to determine the exact roles of hypoxia and re-oxygenation for MSH3 expression and EMAST is underway in our laboratory.
Possible impact of MSH3-deficency on CRC
A mouse model of MSH3-deficiency demonstrated that the MSH3-defect might cause late onset MSI-positive GI cancers (33), suggesting that MSH3-deficiency could contribute to tumor initiation. Families of late onset CRC with MSI-L or MSS exist (34). Therefore, it would be interesting to determine whether these families carry MSH3 germline mutations. MSH3-deficiency is also associated with progression of disease (28, 35). MSI-L CRCs have poor clinical outcomes (34, 36, 37, 38), raising the possibility that MSH3-deficiency might contribute to metastasis in CRC. Certain genes containing di-, tri- or tetranucleotide repeats in their 5′ promoter, coding, and/or 3′ untranslated regions could be mutational targets of MSH3-deficiency, whose mutation might contribute to initiation or progression of tumors (38, 39).
MutSβ is involved in repairing interstrand cross-links (40). Our preliminary experiments using the MSH3-positive and -negative cells generated in this study indicate that MSH3-deficient cells are more sensitive to cisplatin treatment. Information obtained from this line of study may contribute to the rationale for platinum-based adjuvant treatment for CRC with and without MSH3-negative tumor cells.
The existence and significance of MSI-L CRCs have been the subject of debate, mainly due to our lack of knowledge of the molecular features which distinguish them from MSI-H or MSS CRCs (2, 12), and the ambiguity of the definition of MSI-L (30). We have found that MSI-L CRCs and a substantial number of MSS CRCs (∼43%) were MSH3-negative EMAST tumors. Therefore, our results raise a possibility that sporadic non-MSI-H CRCs could be recategorized as MSH3-negative EMAST tumors or MSH3-positive non-EMAST tumors. Further studies are needed to establish the validity of this classification.
Overall, our data show that loss of MSH3 is associated with instability at EMAST loci and low levels of instability at microsatellite loci with dinucleotide repeats in both cell lines and CRC tissues. Further studies are needed to determine the pathological significance of MSH3-deficiency on CRC formation.
Supplementary Material
Acknowledgments
Grant support: NIH intramural grant 1Z01ES023016-05 and The Association for International Cancer Research project grant 03-103 (M. Koi). A grant-in-aid for Scientific Research of the Japan Society for the Promotion of Science 16591358 (H. Hemmi). NIH grants R01 CA72851 and funds from Baylor University Medical Center (CR Boland).
References
- 1.Dietmaier W, Wallinger S, Bocker T, Kullmann F, Fishel R, Rüschoff J. Diagnostic microsatellite instability: definition and correlation with mismatch repair protein expression. Cancer Res. 1997;57:4749–56. [PubMed] [Google Scholar]
- 2.Boland CR, Thibodeau SN, Hamilton SR, et al. A National Cancer Institute Workshop on Microsatellite Instability for cancer detection and familial predisposition: development of international criteria for the determination of microsatellite instability in colorectal cancer. Cancer Res. 1998;58:5248–57. [PubMed] [Google Scholar]
- 3.Lagerstedt Robinson L, Liu T, Vandrovcova J, et al. Lynch syndrome (hereditary nonpolyposis colorectal cancer) diagnostics. J Natl Cancer Inst. 2007;99:291–9. doi: 10.1093/jnci/djk051. [DOI] [PubMed] [Google Scholar]
- 4.Herman JG, Umar A, Polyak K, et al. Incidence and functional consequences of hMLH1 promoter hypermethylation in colorectal carcinoma. Proc Natl Acad Sci USA. 1998;95:6870–5. doi: 10.1073/pnas.95.12.6870. [DOI] [PMC free article] [PubMed] [Google Scholar]
- 5.Iino H, Jass JR, Simms LA, et al. DNA microsatellite instability in hyperplastic polyps, serrated adenomas, and mixed polyps: a mild mutator pathway for colorectal cancer? J Clin Pathol. 1999;52:5–9. doi: 10.1136/jcp.52.1.5. [DOI] [PMC free article] [PubMed] [Google Scholar]
- 6.Mao L, Lee DJ, Tockman MS, Erozan YS, Askin F, Sidransky D. Microsatellite alterations as clonal markers for the detection of human cancer. Proc Natl Acad Sci USA. 1994;91:9871–5. doi: 10.1073/pnas.91.21.9871. [DOI] [PMC free article] [PubMed] [Google Scholar]
- 7.Ahrendt SA, Chow JT, Xu LH, et al. Molecular detection of tumor cells in bronchoalveolar lavage fluid from patients with early stage lung cancer. J Natl Cancer Inst. 1999;91:332–9. doi: 10.1093/jnci/91.4.332. [DOI] [PubMed] [Google Scholar]
- 8.Xu L, Chow J, Bonacum J, et al. Microsatellite instability at AAAG repeat sequences in respiratory tract cancers. Int J Cancer. 2001;91:200–4. doi: 10.1002/1097-0215(200002)9999:9999<::aid-ijc1031>3.0.co;2-0. [DOI] [PubMed] [Google Scholar]
- 9.Danaee H, Nelson HH, Karagas MR, et al. Microsatellite instability at tetranucleotide repeats in skin and bladder cancer. Oncogene. 2002;21:4894–9. doi: 10.1038/sj.onc.1205619. [DOI] [PubMed] [Google Scholar]
- 10.Catto JW, Azzouzi AR, Amira N, et al. Distinct patterns of microsatellite instability are seen in tumours of the urinary tract. Oncogene. 2003;22:8699–06. doi: 10.1038/sj.onc.1206964. [DOI] [PubMed] [Google Scholar]
- 11.Singer G, Kallinowski T, Hartmann A, et al. Different types of microsatellite instability in ovarian carcinoma. Int J Cancer. 2004;112:643–6. doi: 10.1002/ijc.20455. [DOI] [PubMed] [Google Scholar]
- 12.Umar A, Boland CR, Terdiman JP, et al. Revised Bethesda Guidelines for hereditary nonpolyposis colorectal cancer (Lynch syndrome) and microsatellite instability. J Natl Cancer Inst. 2004;96:261–8. doi: 10.1093/jnci/djh034. [DOI] [PMC free article] [PubMed] [Google Scholar]
- 13.Lyer RR, Pluciennik A, Burdett V, Modrich P. DNA mismatch repair: Functions and mechanisms. Chem Rev. 2006;106:302–23. doi: 10.1021/cr0404794. [DOI] [PubMed] [Google Scholar]
- 14.Modrich P. Mechanisms in eukaryotic mismatch repair. J Biol Chem. 2006;281:30305–9. doi: 10.1074/jbc.R600022200. [DOI] [PMC free article] [PubMed] [Google Scholar]
- 15.Jiricny J. The multifaceted mismatch-repair system. Nat Rev Mol Cell Biol. 2006;7:335–46. doi: 10.1038/nrm1907. [DOI] [PubMed] [Google Scholar]
- 16.Kolodner RD. Marsischky GT. Eukaryotic DNA mismatch repair. Curr Opin Genet Dev. 1999;9:89–96. doi: 10.1016/s0959-437x(99)80013-6. [DOI] [PubMed] [Google Scholar]
- 17.Marsischky GT, Filosi N, Kane MF, Kolodner R. Redundancy of Saccharomyces cerevisiae MSH3 and MSH6 in MSH2-dependent mismatch repair. Genes Dev. 1996;10:407–20. doi: 10.1101/gad.10.4.407. [DOI] [PubMed] [Google Scholar]
- 18.Genschel J, Littman SJ, Drummond JT, Modrich P. Isolation of MutSβ from human cells and comparison of the mismatch repair specificities of MutSβ and MutSα. J Biol Chem. 1998;273:19895–19901. doi: 10.1074/jbc.273.31.19895. [DOI] [PubMed] [Google Scholar]
- 19.Sia EAS, Kokoska J, Dominska M, Greenwell P, Petes TD. Microsatellite instability in yeast: dependence on repeat unit size and DNA mismatch repair genes. Mol Cell Biol. 1997;17:2851–2858. doi: 10.1128/mcb.17.5.2851. [DOI] [PMC free article] [PubMed] [Google Scholar]
- 20.Acharya S, Wilson T, Gradia S, et al. hMSH2 forms specific mispair-binding complexes with hMSH3 and hMSH6. Proc Natl Acad Sci USA. 1996;93:13629–34. doi: 10.1073/pnas.93.24.13629. [DOI] [PMC free article] [PubMed] [Google Scholar]
- 21.Palombo F, Iaccarino I, Nakajima E, Ikejima M, Shimada T, Jiricny J. hMutSβ, a heterodimer of hMSH2 and hMSH3, binds to insertion/deletion loops in DNA. Curr Biol. 1996;6:1181–4. doi: 10.1016/s0960-9822(02)70685-4. [DOI] [PubMed] [Google Scholar]
- 22.Risinger JI, Umar A, Boyd J, Berchuck A, Kunkel TA, Barrett JC. Mutation of MSH3 in endometrial cancer and evidence for its functional role in heteroduplex repair. Nat Genet. 1996;14:102–5. doi: 10.1038/ng0996-102. [DOI] [PubMed] [Google Scholar]
- 23.Umar A, Risinger JI, Glaab WE, Tindall KR, Barrett JC, Kunkel TA. Functional overlap in mismatch repair by human MSH3 and MSH6. Genetics. 1998;148:1637–1646. doi: 10.1093/genetics/148.4.1637. [DOI] [PMC free article] [PubMed] [Google Scholar]
- 24.Koi M, Umar A, Chauhan DP, et al. Human chromosome 3 corrects mismatch repair deficiency and microsatellite instability and reduces N-methyl-N′-nitro-N-nitrosoguanidine tolerance in colon tumor cells with homozygous hMLH1 mutation. Cancer Res. 1994;54:4308–12. [PubMed] [Google Scholar]
- 25.Kugoh H, Mitsuya K, Shigenami K, Schulz TC, Oshimura M. Mouse A9 cells containing single human chromosomes for analysis of genomic imprinting. DNA Res. 1999;6:165–72. doi: 10.1093/dnares/6.3.165. [DOI] [PubMed] [Google Scholar]
- 26.Lin Y, Dion V, Wilson JH. Transcription promotes contraction of CAG repeat tract in human cells. Nat Struct Mol Biol. 2006;13:179–80. doi: 10.1038/nsmb1042. [DOI] [PubMed] [Google Scholar]
- 27.Goel A, Nagasaka T, Arnold CN, et al. The CpG island methylator phenotype and chromosomal instability are inversely correlated in sporadic colorectal cancer. Gastroenterology. 2007;132:127–138. doi: 10.1053/j.gastro.2006.09.018. [DOI] [PubMed] [Google Scholar]
- 28.Plaschke J, Krüger S, Jeske B, et al. Loss of MSH3 protein expression is frequent in MLH1-deficient colorectal cancer and is associated with disease progression. Cancer Res. 2004;64:864–70. doi: 10.1158/0008-5472.can-03-2807. [DOI] [PubMed] [Google Scholar]
- 29.Halford S, Sasieni P, Rowan A, et al. Low-level microsatellite instability occurs in most colorectal cancers and is a nonrandomly distributed quantitative trait. Cancer Res. 2002;62:53–7. [PubMed] [Google Scholar]
- 30.Laiho P, Launonen V, Lahermo P, et al. Low-level microsatellite instability in most colorectal carcinomas. Cancer Res. 2002;62:1166–70. [PubMed] [Google Scholar]
- 31.Bindra RS, Crosby ME, Glazer PM. Regulation of DNA repair in hypoxic cancer cells. Cancer Metastasis Rev. 2007;26:249–60. doi: 10.1007/s10555-007-9061-3. [DOI] [PubMed] [Google Scholar]
- 32.Koukourakis MI, Giatromanolaki A, Harris A, Sivridis E. Comparison of metabolic pathways between cancer cells and stromal cells in colorectal carcinomas: a metabolic survival role for tumor-associated stroma. Cancer Res. 2006;66:632–7. doi: 10.1158/0008-5472.CAN-05-3260. [DOI] [PubMed] [Google Scholar]
- 33.Edelmann W, Umar A, Yang K, et al. The DNA mismatch repair genes Msh3 and Msh6 cooperate in intestinal tumor suppression. Cancer Res. 2000;60:803–807. [PubMed] [Google Scholar]
- 34.Kets CM, Hoogerbrugge N, Bodmer D, et al. Unfavorable pathological characteristics in familial colorectal cancer with low-level microsatellite instability. Mod Pathol. 2006;19:1624–30. doi: 10.1038/modpathol.3800701. [DOI] [PubMed] [Google Scholar]
- 35.Kawakami T, Shiina H, Igawa M, et al. Inactivation of the hMSH3 mismatch repair gene in bladder cancer. Biochem Biophys Res Commun. 2004;325:934–42. doi: 10.1016/j.bbrc.2004.10.114. [DOI] [PubMed] [Google Scholar]
- 36.Kohonen-Corish MR, Daniel JJ, Chan C, et al. Low microsatellite instability is associated with poor prognosis in stage C colon cancer. J Clin Oncol. 2005;23:2318–24. doi: 10.1200/JCO.2005.00.109. [DOI] [PubMed] [Google Scholar]
- 37.Wright CM, Dent OF, Newland RC, et al. Low level microsatellite instability may be associated with reduced cancer specific survival in sporadic stage C colorectal carcinoma. Gut. 2005;54:103–8. doi: 10.1136/gut.2003.034579. [DOI] [PMC free article] [PubMed] [Google Scholar]
- 38.Iglesias D, Fernandez-Peralta AM, Nejda N, et al. RIS1, a gene with trinucleotide repeats, is a target in the mutator pathway of colorectal carcinogenesis. Cancer Genet Cytogenet. 2006;167:138–44. doi: 10.1016/j.cancergencyto.2005.12.002. [DOI] [PubMed] [Google Scholar]
- 39.Yamashita K, Arimura Y, Kurokawa S, et al. Microsatellite instability in patients with multiple primary cancers of the gastrointestinal tract. Gut. 2000;46:790–4. doi: 10.1136/gut.46.6.790. [DOI] [PMC free article] [PubMed] [Google Scholar]
- 40.Zhang N, Lu X, Zhang X, Peterson CA, Legerski RJ. hMutSbeta is required for the recognition and uncoupling of psoralen interstrand cross-links in vitro. Mol Cell Biol. 2002;22:2388–97. doi: 10.1128/MCB.22.7.2388-2397.2002. [DOI] [PMC free article] [PubMed] [Google Scholar]
Associated Data
This section collects any data citations, data availability statements, or supplementary materials included in this article.