Abstract
The overall goal of the investigation was to examine the role of uncoupling proteins (UCP’s) in regulating late stage events in the chondrocyte maturation pathway. We showed for the first time that epiphyseal chondrocytes expressed UCP3. In hypoxia, UCP3 mediated regulation of the mitochondrial transmembrane potential (Δψm) was dependent on HIF-1α. We also showed for the first time that UCP3 regulated the induction of autophagy. Thus, suppression of UCP3 enhanced the expression of the autophagic phenotype, even in serum-replete media. Predictably, the mature autophagic chondrocytes were susceptible to an apoptogen challenge. Susceptibility was probably associated with a lowered expression of the anti-apoptotic proteins Bcl2 and BCLxL and a raised baseline expression of cytochrome c in the cytosol. We conclude that in concert with HIF-1α, UCP3 regulates the activity of the mitochondrion by modulating the transmembrane potential. In addition, it suppresses induction of the autophagic response. When this occurs, it suppresses sensitivity to agents that promote chondrocyte deletion from the growth plate.
Keywords: Growth plate, UCP3, HIF-1, Chondrocyte, Autophagy, Apoptosis
INTRODUCTION
The epiphyseal growth plate is a complex avascular tissue that mediates long bone growth. The growth process is dependent on the rapid maturation and the subsequent replacement of the embedded chondrocytes by cells of the osteoblastic lineage (Hunziker et al, 1987;Hunziker and Schenk, 1989). Prior to deletion, chondrocyte maturation takes place in a unique oxemic microenvironment which serves to drive energy generation through anaerobic glycolysis (Shapiro and Srinivas, 2007). This ancient conserved pathway maintains adequate levels of ATP in the complete absence of O2 and without the participation of the mitochondrial cytochrome system. In a recent publication, we have shown that the low pO2 in the growth plate is sensed by a family of dioxygenases that hydroxylate specific prolyl residues on the transcription factor HIF-1α (Terkhorn et al, 2007). This protein promotes the expression and synthesis of many of the enzymes required for anerobic glycolysis while inhibiting the activity of pyruvate dehydrogenase kinase, the enzyme that catalyzes utilization of pyruvate by chondrocyte mitochondria (Kim et al, 2006).
Despite a minimal role in energy generation, mitochondria are present in growth plate chondrocytes (Shapiro et al, 1982). While their ultramicroscopic morphology conforms to what has been reported in non-skeletal tissues, these organelles behave as if they are uncoupled (Rajpurohit et al, 1996). That is, while they are capable of generating reactive oxygen species (ROS), their physiological state precludes their utilization of reductive reserves for ATP synthesis through oxidative phosphorylation. One explanation for development of the uncoupled state is that their function is governed by the activity of members of the uncoupler family of proteins (UCP) embedded in the inner mitochondrial membrane. Members of the family serve as protonophores that dissipate the H+ gradient across the inner mitochondrial membrane and thereby prevent ATP synthesis (Boss et al, 1998).
The goal of the current investigation was to examine the expression and function of UCP isoforms in epiphyseal cartilage and in a chondrocyte differentiation system. Since these cells generate energy in a hypoxic environment we asked the following question: was UCP expression dependent on the cell’s oxemic status; was expression in hypoxia governed by HIF? In addition, since UCP can suppress production of ROS and these molecules enhance autophagy, we determined if their expression regulated the development of autophagy? The results of the investigation clearly show that UCP-3 is the major isoform of the growth plate chondrocytes and that its expression is HIF-1α dependent. Finally, we observed that UCP-3 expression regulated the induction of a new stage in the chondrocyte maturation pathway, autophagy. This latter event caused an increase in the sensitivity of the maturing chondrocyte to local apoptogens.
MATERIALS AND METHODS
Reagents
UCP2 and 3 antibodies were purchased from Alpha Diagnostic (San Antonio, TX). Bcl2, Bcl-xL, cytochrome c and tubulin antibodies were obtained from Santa Cruz (Santa Cruz, CA). Cell culture reagents were from Fisher Scientific (Malvern, PA). Alpha Minimal Essential Medium (α-MEM) and transfection reagents were obtained from Invitrogen (Carlsbad, CA). Fetal calf serum was bought from Atlanta Biological (Norcross, GA). Mammalian Protein Extraction Reagent (M-PER) and HRP labeled secondary antibody was obtained through Pierce (Rockford, IL). Immunofluorescence studies were performed with Alexafluor 594-labeled secondary antibody (Southern Biotechnology, Birmingham, AL). Reagents for Western blotting were from Bio-Rad, (Hercules, CA). All other reagents, including etomoxir and MTT were purchase from Sigma-Aldrich (St. Louis, MO). All concentrations are expressed as % (v/v) or (w/v).
Cell culture
N1511 mouse chondrocytes and derived cell lines (see below) were cultured in α-MEM containing 10% fetal bovine serum, 0.2% L-glutamine, 0.2% penicillin/streptomycin, and 0.2% sodium pyruvate. Cells were maintained in culture at 37°C, in 5%, CO2 -95% air. Maturation of the cells was induced by treating the chondrocytes with a single dose of BMP-2 (200 ng/ml) (Terkhorn, Bohensky, Shapiro, Koyama, and Srinivas, 2007). To induce hypoxia, cells were incubated in an inVIVO2 Hypoxia Workstation (Ruskinn Technology, Cincinnati, OH) at 2% O2 tension. In some studies, cells were treated with the UCP3 activator, etomoxir (ethyl-2-[6-(4-chlorophenoxy)hexyl) oxirane-2-carboxylate].
siRNA mediated silencing of UCP3
The pSilencer siRNA construction vector (Ambion, Austin, TX) was utilized to suppress UCP3. The following phosphorylated oligonucleotides were used (Forward [F], Reverse [R]):
F: 5'-gatccgtgcctcccacaacggttgttcaagagacaaccgttgtgggaggcacttttttggaaa
R: 5'-agcttttccaaaaaagtgcctcccacaacggttgtctcttgaacaaccgttgtgggaggcacg
HIF-1 was silenced using oligonucleotide sequences that we have previously published (Terkhorn, Bohensky, Shapiro, Koyama, and Srinivas, 2007). Permanent cell lines were generated using 80% confluent monolayers transfected with the siRNA vector followed by clonal selection using 500 µg/ml of hygromycin B. A cell line with backbone vector containing scrambled sequences served as a control (pSHH).
Western blot analysis
UCP3, Bcl2 and BclxL protein expression in N1511 or siUCP3 cells was evaluated by Western blot analysis. 50 µg of total protein was separated on a 4–20% SDS gradient gel and blotted onto a PVDF membrane. Membranes were blocked in 5% milk TBST (Tris-Borate, SDS, Tween) solution for 1 h at room temperature and incubated with the primary antibody diluted in TBS milk solution (1:500 v/v). After incubation, membranes were washed 3X in TBST buffer for 5 min and probed with the appropriate secondary antibody labeled with HRP and proteins visualized using Lumigen™ TMA (Amersham Biosciences).
RT-PCR analysis
Total RNA was isolated from N1511 and silenced cells using the Qiagen RNeasy® Mini kit. The yield was determined spectrophotometrically and RNA integrity was confirmed by gel electrophoresis. The RNA was reverse-transcribed and then amplified using the Superscript™ One-Step RT-PCR with Plutinum Taq® (Invitrogen) kit. PCR products were analyzed by 1% agarose gel electrophoresis. The following forward [F] and reverse [R] primers were used:
UCP3
(F): 5’-accatcctgactatggtgcg
(R): 5’-cctctgtatttcctctctcc
β-actin
(F): 5’-gtgctatgttgccctggatt
(R): 5’-tgctagggctgtgatctcct
Immunohistochemical localization of UCP3
UCP3 was assessed immunohistochemically in longitudinal sections of the embryonic (E18.5) proximal tibial growth plate. Mice were sacrificed in accordance with ethical guidelines approved by the IACUC of Thomas Jefferson University. The tissue was paraffin-embedded, serially-sectioned (5 µM), permeabilized with proteinase K (10 mg/mL), and fixed in 4.0% paraformaldehyde. Next, serial sections were treated with UCP-3 antibody at a dilution of 1:50 v/v. Following this treatment, sections were incubated with Alexafluor 594-labeled secondary antibodies, counterstained with DAPI, and visualized by fluorescence microscopy.
Immunofluorescence analysis of UCP3
Expression of UCP3 in wild type and silenced chondrocytes was assessed by immunofluorescence analysis. Cells were fixed with 3.7% paraformaldehyde for 10 min and permeabilized with Triton-X100 for 10 min. The samples were then blocked with 10% FBS in PBS and treated overnight with UCP3 primary antibody (1:100). The sections were treated with Alexafluor 594 labeled secondary antibody and examined by confocal microscopy (Olympus Fluoview, Melville, NY).
Cell Viability Challenge Assay
Chondrocytes were plated in 24-well culture dishes at 40,000 cells/mL and grown to 80% confluence. The chondrocytes were treated with 10 µM H2O2 in serum-free DMEM. Viability was determined by the addition of 20 μl MTT reagent [3-(4,5-dimethylthiazol-2-yl)-2,5-diphenyltetrazolium bromide] to the cultures. The reaction was stopped after 3 h and the change in color quantitated using a plate reader at 590 nm (Adams et al, 2001).
Cytochrome c release assay
Cytochrome c release into the cytosol of cells challenged with an apoptogen was performed as described in an earlier publication (Pucci et al, 2007).
Assessment of Mitochondrial Membrane Potential (Δψm)
Cells were plated at a density of 3×10⁴ per well in 24-well plates. After 24 h, chondrocytes was treated with 40 µM etomoxir for 24 h or maintained in hypoxia for 12 h. Following staining with Mitotracker Red, fluorescence was assessed using confocal microscopy (Olympus, Melville, NY).
Statistical analysis
Data was expressed as the mean ± standard deviation (SD) of 24 wells. Analysis of variance and Student's t-test were used to assess significance; values less than 0.05 were considered significant. All experiments were repeated 3 or more times.
RESULTS
Expression of UCP3 in cells of the epiphyseal growth plate and in N1511 chondrocytes
Longitudinal sections of the mouse growth plate were immunostained for UCP3 expression. Figure 1A shows that epiphyseal chondrocytes express UCP3. Noteworthy, while UCP3 stained cells are present throughout the growth plate, the most densely stained cells are localized in the hypertrophic region. In addition, we examined the expression of the protein in N1511 chondrocytes. Western blot analysis indicates that UCP3 is expressed by both immature and mature cultured cells. When the cells are terminally differentiated there is a slight decrease in UCP3 expression (Fig 1B).
Figure 1. Expression of UCP3 in cells of the epiphyseal growth plate and in N1511 chondrocytes.
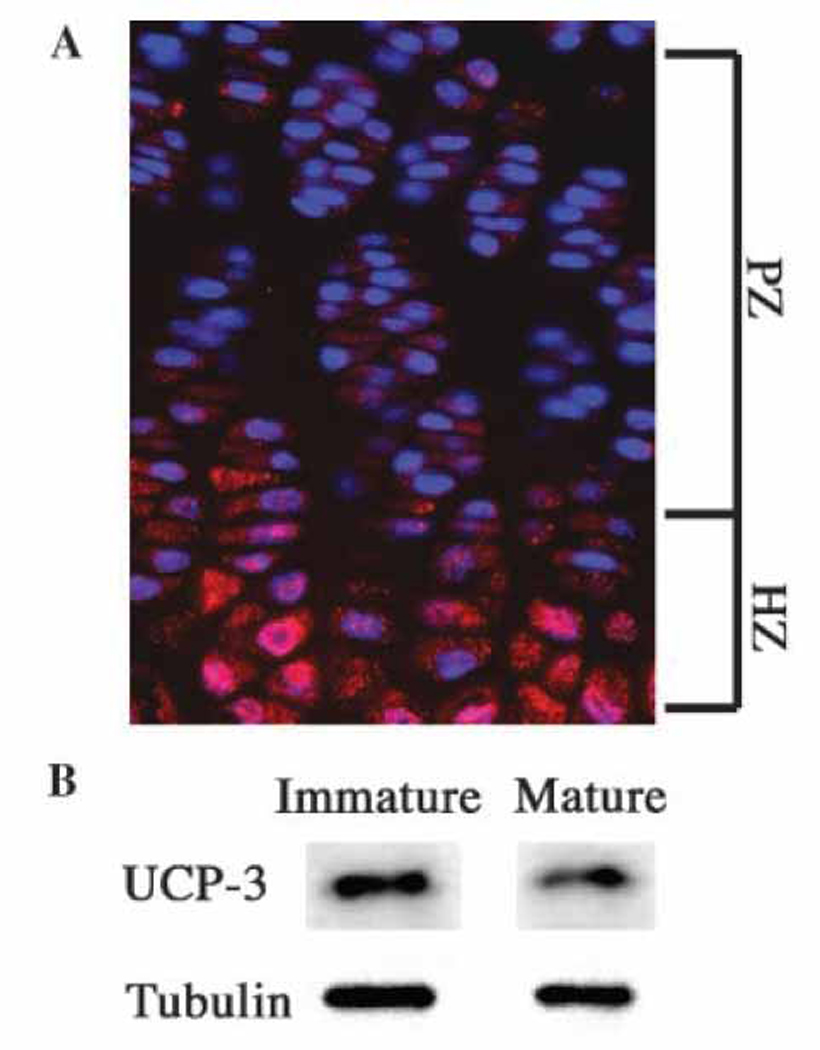
(A) UCP3 expression in a longitudinal section through the mouse growth plate. Paraffin-embedded section of the proximal tibial epiphysis was treated with an antibody against UCP3. Subsequently the section was treated with Alexafluor 594 labeled secondary antibodies and counterstained with DAPI. Rabbit IgG was used as a negative control. Note the robust expression of UCP3 in pre-hypertrophic cells (PHZ) and hypertrophic cells (HZ) (mag.×200). (B) UCP3 expression in N1511 chondrocytes. UCP3expression was assessed by Western blot analysis. There was robust expression of UCP3 in chondrocytes which was decreased when the cells matured. Tubulin served as a loading control.
Induction of UCP3 protein expression in N1511 chondrocytes at low pO2
Since the cells in the central core of the growth plate exist in a hypoxic microenvironment, we next examined the impact of low pO2 on UCP3 expression. Immunofluorescence analysis indicates that hypoxia causes a moderate induction of UCP3 expression in N1511 chondrocytes (Fig 2A). Thus, the increased in vivo expression of UCP3 most probably reflects the impact of a low oxemic microenvironment and not the maturation status of the chondrocytes.
Figure 2. HIF-1 mediated hypoxic induction of UCP3.
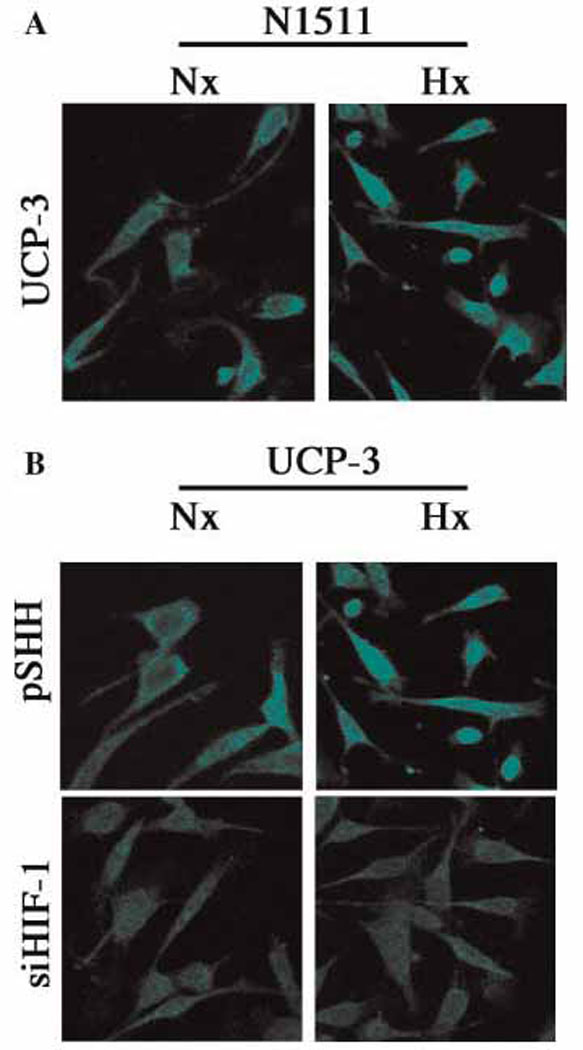
(A) Hypoxic induction of UCP3 expression. N1511 chondrocytes were cultured either under normoxic (20% O2) or hypoxic (2% O2) conditions. Subsequently the cells were fixed and treated with an antibody against UCP3, visualized by treatment with Alexafluor 594 labeled secondary antibodies and examined by confocal microscopy. Note, compared with normoxia (Nx), there is a significant induction of UCP3 in hypoxia (Hx). (B) HIF-1 mediated induction of UCP3. Control (pSHH) cells and HIF-1 silenced cells (siHIF-1) were cultured either in normoxia (Nx) or hypoxia (Hx). Again, note the hypoxic induction of UCP3 in control cells. This induction is lost in HIF-1 silenced chondrocytes.
HIF-1α dependent expression of UCP3
Since HIF-1 is a critical transducers of the hypoxic signal, we examined the expression of UCP3 in the previously characterized HIF-1 silenced chondrocyte line. Figure 2B shows that in normoxia, control (pSHH) cells exhibit constitutive expression of UCP3; expression of UCP3 is increased in hypoxia. In contrast, when HIF-1silenced cells were maintained in hypoxia there is no induction of UCP3 expression (Fig 2B). Thus, expression of the uncoupler protein is regulated by HIF-1.
Effect of etomoxir treatment on the chondrocyte mitochondrial transmembrane potential (Δψm)
To learn if UCP3 regulated the Δψm, N1511 cells were treated with etomoxir and stained with Mitotracker Red, a fluorescent indicator of the membrane potential. Figure 3A shows that etomoxir, a UCP3 inducer, causes a marked decrease in chondrocyte fluorescence. Since UCP3 expression was induced by HIF-1, we next tested the possibility that the Δψm was influenced by this transcription factor. Figure 3B indicates that the fluorescence of the control cells in normoxia is markedly decreased when the chondrocytes are maintained under hypoxic conditions. This decrease in membrane potential is abrogated when the HIF-1 silenced cells are cultured in hypoxia.
Figure 3. UCP3 regulation of chondrocyte mitochondrial membrane potential in HIF-1 suppressed cells.
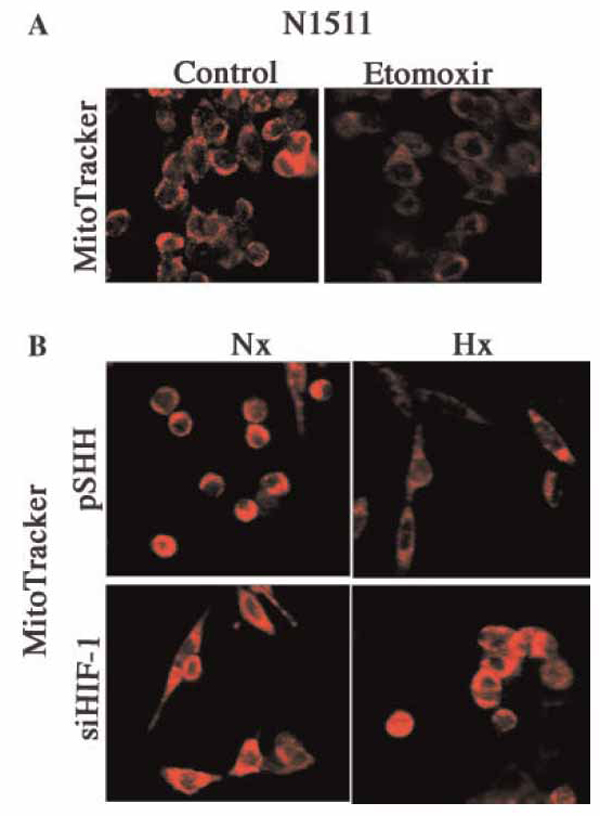
(A) UCP3 activation leads to a reduction in the mitochondrial trans membrane potential. N1511 chondrocytes were cultured under normoxic conditions and UCP3 was activated using etomoxir. The mitochondrial membrane potential was monitored using Mitotracker Red. Note the reduction in Mitotracker fluorescence upon etomoxir treatment. (B) Maintenance of the mitochondrial transmembrane potential by HIF-1 silenced chondrocytes in hypoxia. Control (pSHH) cells and HIF-1 silenced chondrocytes were cultured under either normoxic (20% O2) or hypoxic (2% O2) conditions. Membrane potential was visualized using Mitotracker Red. Note the reduction in fluorescence in control cells in hypoxia. HIF-1 silenced cells do not display the reduction in the transmembrane potential.
The Δψm of UCP3 silenced chondrocytes in hypoxia
To directly determine if UCP3 regulated the Δψm we used siRNA technology to silence expression of the gene. Cells transfected with a scrambled UCP3 sequence (pSHH) served as a control. Compared with the control, UCP3 gene expression and protein levels are dramatically reduced in the transfected chondrocytes (Fig 4A and B). The Δψm of the UCP3 silenced chondrocytes was then examined. Again in normoxia, the pSHH control cells display significant Mitotracker Red fluorescence; in hypoxia, a diminution in fluorescence is seen (Fig 4C). In contrast, UCP3 silenced cells exhibit high Mitotracker Red fluorescence, and fluorescence is maintained even under hypoxic conditions. This result suggests that UCP3 is a major regulator of the chondrocytes transmembrane potential.
Figure 4. UCP3 mediated regulation of the mitochondrial membrane potential.
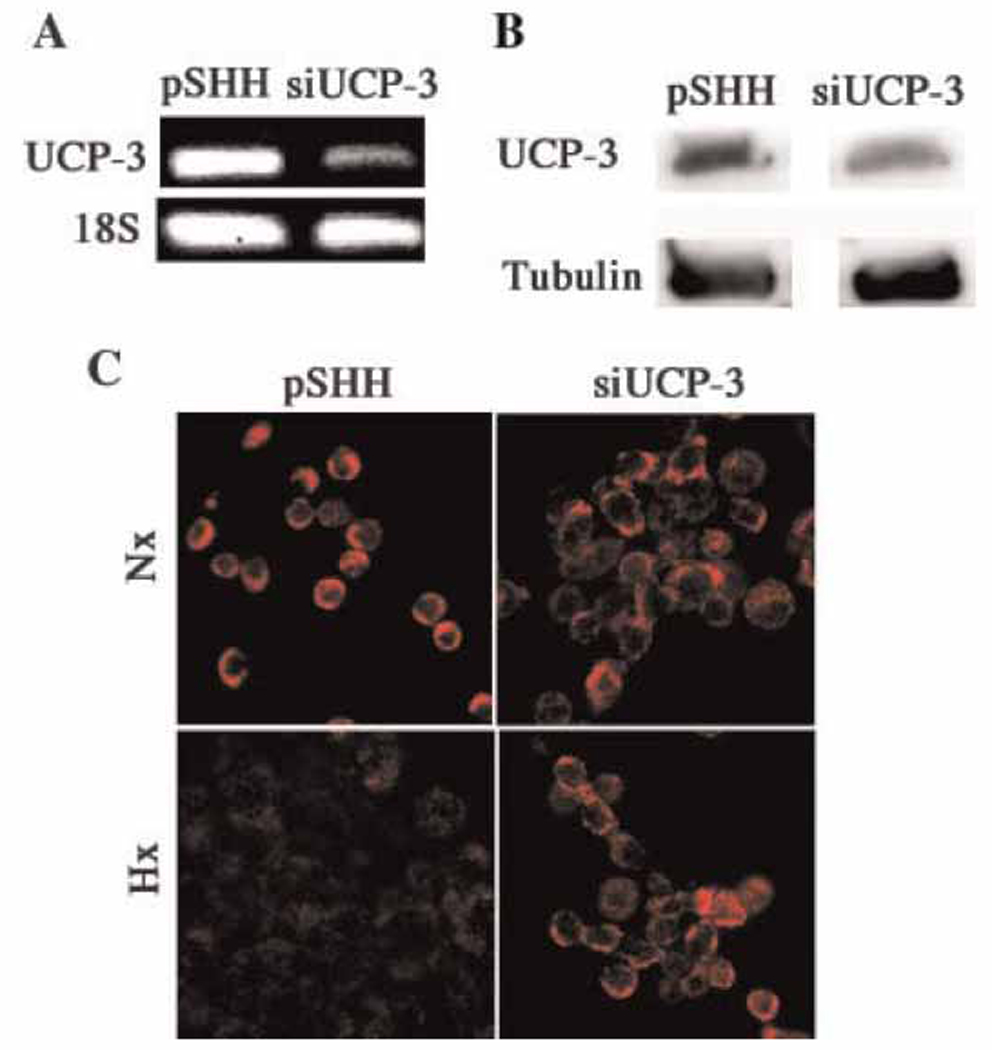
(A and B) Suppression of UCP3 by siRNA technology and Western blot analysis. RT-PCR analysis indicated that there was significant suppression of UCP3 in the silenced cells compared with the pSHH controls (A). There was also suppression of protein expression (B). 18S ribosomal RNA and tubulin served as loading controls. (C) Maintenance of the transmembrane potential in hypoxic UCP3-suppressed chondrocytes. Cells were maintained in either normoxic (20% O2, Nx) or hypoxic (2% O2, Hx) conditions and the membrane potential was determined using Mitotracker Red. Note the reduction in Mitotracker fluorescence when control cells are grown in hypoxia. However this reduction is blocked when UCP3 is silenced.
UCP3 regulation of autophagy and sensitivity to apoptogens in hypoxia
To learn if UCP3 can regulate autophagy, two key indicators of the autophagic state were evaluated in the siUCP-3 chondrocytes. Figure 5A, shows that pSHH cells exhibit diffuse LC3 staining. In contrast, in the UCP3 silenced cells, LC3 is redistributed into speckled structures (autophagosomes) even in serum-rich conditions. In addition, we evaluated lysosomal activity in the knockdown cells using the fluorescent dye, Lysotracker. We found that Lysotracker fluorescence is significantly increased in the siUCP3 chondrocytes (Fig 5B). We next subjected these cells to a challenge with low concentrations of H2O2. Both pSHH (control) and UCP3 silenced cells were equally sensitive to this challenge under normoxic conditions. Furthermore, as previously shown, control cells remain refractory to the apoptogen challenge under hypoxic conditions. However, the hypoxic UCP3 silenced cells are more sensitive to H2O2 than the control cells (Fig 5C). Western blot analysis showed that the expression of the anti-apoptotic proteins Bcl2 and BclxL was significantly reduced in the UCP3 suppressed cells (Fig 5D). Thus, while Bcl2 is suppressed by 60%, BclxL is reduced by 80%. Based on these results it is clear that UCP3 plays a protective role in the hypoxic microenvironment of the growth plate.
Figure 5. UCP3 mediated regulation of autophagy and apoptosis.
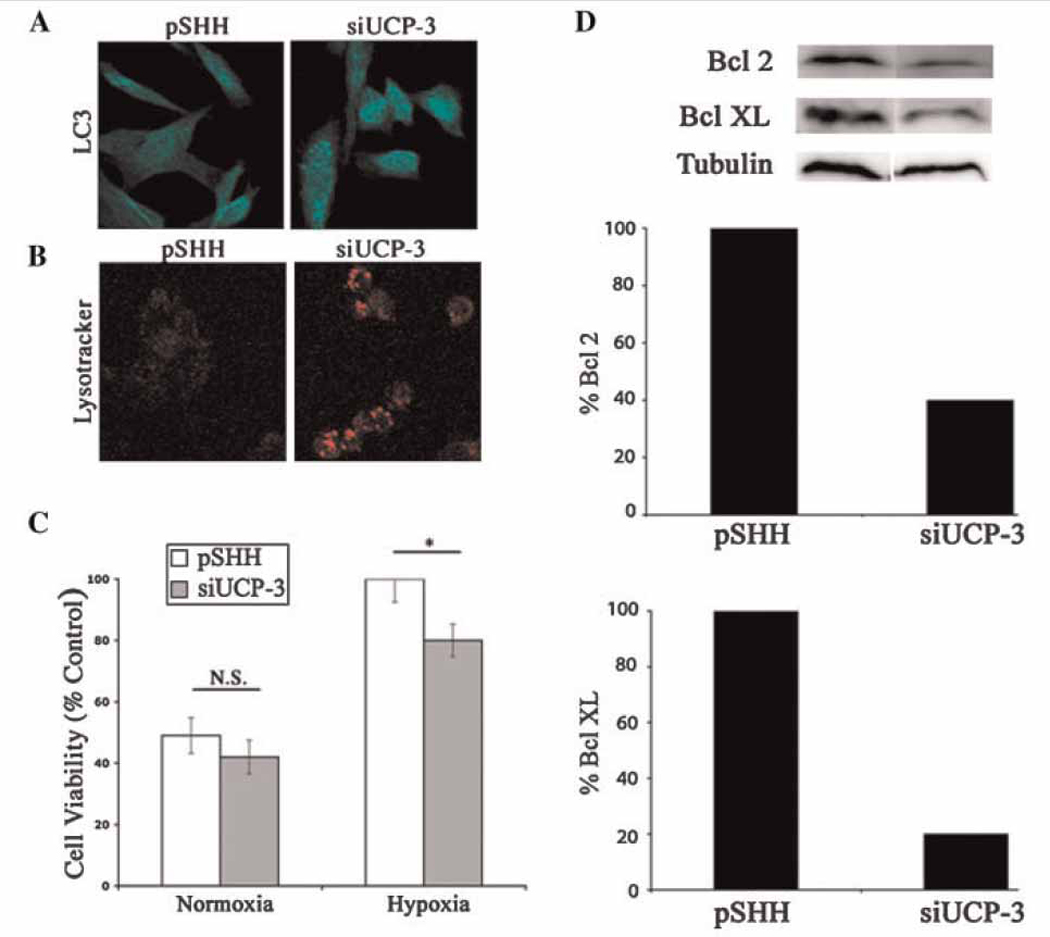
(A and B) UCP3 silencing promotes autophagy. Control cells and UCP3 silenced cells were monitored using antibodies to LC3 for the induction of autophagy. Note the redistribution of LC3 into speckled structures characteristic of autophagosomes (A). In UCP3 silenced cells (siUCP3) under serum replete conditions, there was an increase in Lysotracker fluorescence (B). (C) Sensitization of siUCP3 chondrocytes to an apoptogen challenge in hypoxia. Cells were grown under normoxic or hypoxic conditions and subsequently challenged with a low dose of H2O2. Cell viability was measured by the MTT assay. Note that both control (pSHH) and UCP3 silenced chondrocytes were equally sensitive to the H2O2 challenge under normoxic conditions. However, under hypoxic conditions UCP3 silenced chondrocytes were more sensitive to the challenge. In contrast, the control cells were refractory to the challenge. (D) Anti-apoptotic protein expression in UCP3 silenced cells. Western blot analysis revealed that expression of the anti-apoptotic proteins, Bcl2 and BclXL, were reduced in siUCP3 chondrocytes.
Cytochrome c localization following an apoptogen challenge
To determine if the relationship between autophagy and apoptosis involved the intrinsic pathway, cells were challenged with staurosporine and the distribution of cytochrome c assayed by Western blot analysis. Figure 6 shows that predictably, cytochrome c re-distributes from the mitochondria to the cytosol even following a modest challenge with staurosporine. Surprisingly, in the silenced cells, a significant portion of cytochrome c is localized in the cytosol even before treatment with the apoptogen. Thus, these cells are sensitized to type I apoptosis and primed for death when challenged with staurosporine.
Figure 6. Cytochrome c release following an apoptogen challenge.
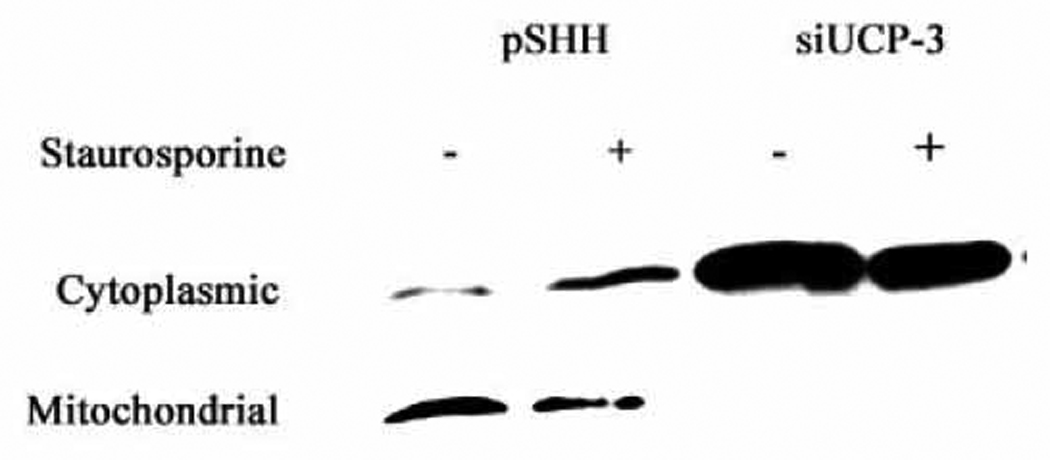
siUCP3 and pSHH (control) cells were challenged with 100 nM staurosporine for 6 h. Cytoplasmic and mitochondrial fractions were collected and subjected to Western blot analysis for cytochrome c localization. Note, the apoptogen caused release of cytochrome c from mitochondria to the cytosol in control cells. Also note the predominant localization of cytochrome c in the cytosolic fraction of the silenced chondrocytes, even in the absence of staurosporine.
DISCUSSION
The overall goal of the investigation was to examine the role of UCP3 in regulating late stage events in the chondrocyte life cycle. We showed for the first time that maturing epiphyseal chondrocytes expressed UCP3. The study indicated that UCP3 expression in chondrocytes was regulated by HIF-1 and that this activity influenced the Δψm. We also showed for the first time that there was a direct linkage between UCP3 expression and autophagy. Thus, suppression of UCP3 enhanced the expression of the autophagic phenotype, even in serum-replete conditions. As might be predicted, the mature autophagic chondrocytes evidenced increased susceptibility to an apoptogen challenge. Susceptibility was probably associated with a lowered expression of the anti-apoptotic proteins Bcl2 and BCLxL and an unusually high level of cytochrome c in the cytosol. Based on these findings, we conclude that UCP3 serves two major physiologic functions in the growth plate. First, in concert with HIF, it regulates the activity of the mitochondrion by modulating the Δψm. Second, it controls development of the autophagic response. This latter state permits chondrocyte to complete their maturational program, prior to deletion from the growth plate.
We examined the growth plate for the expression of the three common UCP isoforms. UCP3 was most highly expressed in the growth plate itself, as well as by N1511 cells. Both cells also expressed low levels of UCP2 (data not shown). This finding was surprising as UCP2 is the most ubiquitous isoform (Sluse et al, 2006), while UCP3 has been reported to be present solely in skeletal muscle and adipose tissue (Ledesma et al, 2002). To explore the relationship between UCP3 expression and cellular energy metabolism, we evaluated the distribution of UCP3 in the growth plate. We found that while UCP3 was expressed throughout the plate, the most densely stained cells were localized to the pre-hypertrophic and hypertrophic regions of the epiphysis. Noteworthy, cells in these two zones were most removed from the vascular supply and would be expected to be hypoxic. We, and others groups, have shown previously that HIF-1α, a critical regulator of the glycolytic pathway, was most highly expressed in the pre-hypertrophic-hypertrophic region (Rajpurohit, Koch, Tao, Teixeira, and Shapiro, 1996;Schipani et al, 2001). From this perspective, it was not surprising to find that the functional role of this protein in cartilage was different from that of tissues that generate metabolic energy through oxidative metabolism. That there was a reduction in the expression of UCP3 in HIF-1 silenced cells lent further strength to the notion that the activities of these two proteins were linked. Based on these findings, we conclude that in cartilage, HIF-1 regulates the expression of UCP3 in maturing chondrocytes. Whether HIF serves as a major regulator of UCP3 expression in tissues such as muscle and fat is not known; more likely, HIF could serve as a default mechanism for survival when there is disruption of the vascular supply.
Since HIF regulated UCP3 expression, we also determined whether this transcription factor controlled the chondrocyte Δψm. In the growth plate, we have previously shown that the Δψm activity was decreased as chondrocytes became terminally differentiated (Rajpurohit et al, 1999). In the current study of HIF-1 silenced chondrocytes, we found that there was no change in the Δψm, even in hypoxia. This finding indicates that through HIF-1, UCP3 regulates mitochondrial membrane activity and ATP synthesis. In support of the latter role for UCP3, etomoxir, an agent that induces UCP3 synthesis, caused a predictable fall in Δψm. Since UCP3 serves as a protonophore, the possibility exists that an elevation in ROS generation, would promote chondrocyte autophagy (Krauss et al, 2005). In that case, there should be an increase in Lysotracker fluorescence and a re-distribution of the microtubule-associated protein LC3. Indeed, immunofluorescence imaging of the distribution of LC3 in UCP3 silenced cells showed that the protein was present as punctate particles that are characteristic of autophagosomes. This type of LC3 organization was evident in cells maintained in serum-replete media, a condition which would not normally favor autophagosome formation. That UCP3 silencing induces autophagy was further confirmed by the elevated level of lysosomal activity. Thus, while control cells displayed low Lysotracker fluorescence, UCP3 suppressed cells displayed a significant levels of fluorescence, indicative of induction of autophagy. While the notion that chondrocytes in the growth plate exhibit an autophagic phase is new, we have suggested that this survival activity preserves cell function until conditions are appropriate for deletion from the plate by apoptosis (Bohensky et al, 2007d;Bohensky et al, 2007b;Shapiro et al, 2005). Related to this point, in an earlier publication we reported that regulation of autophagy was controlled by HIF-1. The results presented in the current study, point to HIF-1 regulating the extent of the autophagic response through the mitochondrial uncoupling protein, UCP3. Whether this function is mediated by the generation of ROS awaits further investigation.
While the induction of autophagy promoted chondrocyte survival, at the same time it sensitized cells to an apoptogen challenge. As we have shown herein, when mature UCP3 silenced cells were treated with H2O2, in hypoxia, there was a small but significant elevation in the percentage of cells killed. Increased susceptibility to H2O2 was probably associated with a lowered expression of Bcl2 and BCLxL and a raised level of cytochrome c in the cytosolic fraction. The decrease in levels of both these anti-apoptotic proteins would serve to promote mitochondrial dysfunction and enhance the activities of executioner proteins that are required for activation of the apoptotic cascade. In context of other studies of the sensitivity of maturing chondrocytes to apoptogens, these results are of particular importance, as we have shown that once the cells become mature in a hypoxic environment they become especially refractory to killing with H2O2, and other apoptogens (Terkhorn, Bohensky, Shapiro, Koyama, and Srinivas, 2007;Bohensky et al, 2007c;Bohensky et al, 2007a). From this perspective, UCP3 serves to enhance maturation by regulating the level of autophagic activity as well as the subsequent deletion of hypertrophic chondrocytes from the growth plate.
Acknowledgments
Contract grant sponsor: NIH; contract grant number:DE 015694 and DE 016383 (to VS) And DE 010875 and DE 013319 (to IMS).
Abbreviations
- HIF
Hypoxia Inducible Factor
- UCP
Uncoupling Protein
- ROS
Reactive Oxygen Species
- Δψm
mitochondrial transmembrane potential
Reference List
- Adams CS, Mansfield K, Perlot RL, Shapiro IM. Matrix regulation of skeletal cell apoptosis. Role of calcium and phosphate ions. J Biol Chem. 2001;276:20316–20322. doi: 10.1074/jbc.M006492200. [DOI] [PubMed] [Google Scholar]
- Bohensky J, Shapiro IM, Leshinsky S, Terkhon SP, Adams CS, Srinivas V. HIF-1 Regulation of Chondrocyte Apoptosis: Induction of the Autophagic Pathway. Autophagy. 2007a;3:207–214. doi: 10.4161/auto.3708. [DOI] [PubMed] [Google Scholar]
- Bohensky J, Shapiro IM, Leshinsky S, Terkhorn SP, Adams CS, Srinivas V. HIF-1 Regulation of Chondrocyte Apoptosis: Induction of the Autophagic Pathway. Autophagy. 2007b;3:207–214. doi: 10.4161/auto.3708. [DOI] [PubMed] [Google Scholar]
- Bohensky J, Shapiro IM, Leshinsky S, Watanabe H, Srinivas V. PIM-2 is an independent regulator of chondrocyte survival and autophagy in the epiphyseal growth plate. J.Cell Physiol. 2007c doi: 10.1002/jcp.21117. [DOI] [PubMed] [Google Scholar]
- Bohensky J, Shapiro IM, Leshinsky S, Watanabe H, Srinivas V. PIM-2 is an independent regulator of chondrocyte survival and autophagy in the epiphyseal growth plate. J.Cell Physiol. 2007d doi: 10.1002/jcp.21117. [DOI] [PubMed] [Google Scholar]
- Boss O, Bobbioni-Harsch E, Assimacopoulos-Jeannet F, Muzzin P, Munger R, Giacobino JP, Golay A. Uncoupling protein-3 expression in skeletal muscle and free fatty acids in obesity 28. Lancet. 1998;351:1933. doi: 10.1016/S0140-6736(05)78617-7. [DOI] [PubMed] [Google Scholar]
- Hunziker EB, Schenk RK. Physiological mechanisms adopted by chondrocytes in regulating longitudinal bone growth in rats. J.Physiol. 1989;414:55–71. doi: 10.1113/jphysiol.1989.sp017676. [DOI] [PMC free article] [PubMed] [Google Scholar]
- Hunziker EB, Schenk RK, Cruz-Orive LM. Quantitation of chondrocyte performance in growth-plate cartilage during longitudinal bone growth. J.Bone Joint Surg.Am. 1987;69:162–173. [PubMed] [Google Scholar]
- Kim JW, Tchernyshyov I, Semenza GL, Dang CV. HIF-1-mediated expression of pyruvate dehydrogenase kinase: a metabolic switch required for cellular adaptation to hypoxia. Cell Metab. 2006;3:177–185. doi: 10.1016/j.cmet.2006.02.002. [DOI] [PubMed] [Google Scholar]
- Krauss S, Zhang CY, Lowell BB. The mitochondrial uncoupling-protein homologues. Nat.Rev.Mol.Cell Biol. 2005;6:248–261. doi: 10.1038/nrm1592. [DOI] [PubMed] [Google Scholar]
- Ledesma A, de Lacoba MG, Rial E. The mitochondrial uncoupling proteins. Genome Biol. 2002;3:3015. doi: 10.1186/gb-2002-3-12-reviews3015. [DOI] [PMC free article] [PubMed] [Google Scholar]
- Pucci B, Adams CS, Fertala J, Snyder BC, Mansfield KD, Tafani M, Freeman T, Shapiro IM. Development of the terminally differentiated state sensitizes epiphyseal chondrocytes to apoptosis through caspase-3 activation. J.Cell Physiol. 2007;210:609–615. doi: 10.1002/jcp.20857. [DOI] [PubMed] [Google Scholar]
- Rajpurohit R, Koch CJ, Tao Z, Teixeira CM, Shapiro IM. Adaptation of chondrocytes to low oxygen tension: relationship between hypoxia and cellular metabolism. J Cell Physiol. 1996;168:424–432. doi: 10.1002/(SICI)1097-4652(199608)168:2<424::AID-JCP21>3.0.CO;2-1. [DOI] [PubMed] [Google Scholar]
- Rajpurohit R, Mansfield K, Ohyama K, Ewert D, Shapiro IM. Chondrocyte death is linked to development of a mitochondrial membrane permeability transition in the growth plate. J Cell Physiol. 1999;179:287–296. doi: 10.1002/(SICI)1097-4652(199906)179:3<287::AID-JCP6>3.0.CO;2-T. [DOI] [PubMed] [Google Scholar]
- Schipani E, Ryan HE, Didrickson S, Kobayashi T, Knight M, Johnson RS. Hypoxia in cartilage: HIF-1alpha is essential for chondrocyte growth arrest and survival. Genes Dev. 2001;15:2865–2876. doi: 10.1101/gad.934301. [DOI] [PMC free article] [PubMed] [Google Scholar]
- Shapiro IM, Adams CS, Freeman T, Srinivas V. Fate of the hypertrophic chondrocyte: microenvironmental perspectives on apoptosis and survival in the epiphyseal growth plate. Birth Defects Res.C.Embryo.Today. 2005;75:330–339. doi: 10.1002/bdrc.20057. [DOI] [PubMed] [Google Scholar]
- Shapiro IM, Golub EE, Kakuta S, Hazelgrove J, Havery J, Chance B, Frasca P. Initiation of endochondral calcification is related to changes in the redox state of hypertrophic chondrocytes. Science. 1982;217:950–952. doi: 10.1126/science.7112108. [DOI] [PubMed] [Google Scholar]
- Shapiro IM, Srinivas V. Metabolic consideration of epiphyseal growth: survival responses in a taxing environment. Bone. 2007;40:561–567. doi: 10.1016/j.bone.2006.09.030. [DOI] [PMC free article] [PubMed] [Google Scholar]
- Sluse FE, Jarmuszkiewicz W, Navet R, Douette P, Mathy G, Sluse-Goffart CM. Mitochondrial UCPs: new insights into regulation and impact. Biochim.Biophys.Acta. 2006;1757:480–485. doi: 10.1016/j.bbabio.2006.02.004. [DOI] [PubMed] [Google Scholar]
- Terkhorn SP, Bohensky J, Shapiro IM, Koyama E, Srinivas V. Expression of HIF prolyl hydroxylase isozymes in growth plate chondrocytes: Relationship between maturation and apoptotic sensitivity. J.Cell Physiol. 2007;210:257–265. doi: 10.1002/jcp.20873. [DOI] [PubMed] [Google Scholar]


