

Abstract
The disorganized symptoms of schizophrenia, including severely disordered thought patterns, may be indicative of a problem with the construction and maintenance of cell assemblies during sensory processing and attention. The gamma and beta frequency bands (15–70 Hz) are believed relevant to such processing. This paper addresses the results of an experimental examination of the cortical response of 12 schizophrenia patients and 12 control subjects when presented with auditory click-train stimuli in the gamma/beta frequency band during measurement using magnetoencephalography (MEG), as well as earlier work by Kwon et al. These data indicate that control subjects show an increased 40-Hz response to both 20- and 40-Hz stimulation as compared with patients, whereas schizophrenic subjects show a preference for 20-Hz response to the same driving frequencies. In this work, two computational models of the auditory cortex are constructed based on postmortem studies that indicate cortical interneurons in schizophrenic subjects have decreased GAT-1 (a GABA transporter) and GAD67 (1 of 2 enzymes responsible for GABA synthesis). The models transition from control to schizophrenic frequency response when an extended inhibitory decay time is introduced; this change captures a possible effect of these GABA alterations. Modeling gamma/beta range auditory entrainment in schizophrenia provides insight into how biophysical mechanisms can impact cognitive function. In addition, the study of dynamics that underlie auditory entrainment in schizophrenia may contribute to the understanding of how gamma and beta rhythms impact cognition in general.
Introduction
Schizophrenia is a heterogeneous mental illness considered to have three classes of symptoms: positive (hallucinations, psychotic thought patterns), negative (decreased emotional capacity, flat affect), and disorganized (severely disordered thought patterns). It has been suggested that the disorganized symptoms of schizophrenia may indicate impaired binding during sensory processing and attention (Haig et al. 2000; Phillips and Silverstein 2003; Spencer et al. 2003; Strelets et al. 2002), which in turn implicates problems with the construction and maintenance of cell assemblies. The gamma (30–70 Hz) and beta (15–30 Hz) frequency bands are believed to be relevant to such processing (Farmer 1998; Kopell 2000; Kopell et al. 2000; Roelfsema et al. 1997). There are many theories regarding the etiology of schizophrenia, including N-methyl-d-aspartate (NMDA) hypofunction (Coyle et al. 2003), excessive pruning during development (McGlashan and Hoffman 2000), an excess of dopamine (Seeman et al. 1976), and problems with myelination (Davis et al. 2003) as well as many observed physical alterations, including deficits in numbers of interneurons in many brain areas (Benes et al. 1991, 1998), and alterations to the size and shape of several brain structures (Shenton et al. 2001). However, results linking such alterations to clinical manifestation have been extremely limited. In this paper, we seek to use cellular modeling to help connect physiology with cortical function, linking synaptic abnormalities in inhibitory interneurons to impaired gamma and beta range auditory entrainment.
Gamma activity has been found to be important for forming coherent percepts in a given sensory modality. This has been shown for somatosensory tasks (Desmedt and Tomberg 1994), auditory detection tasks (Jokeit and Makeig 1994), and many visual activities (Engel et al. 1991; Engel and Singer 2001). Moreover, research has suggested that lower frequency beta rhythms may be responsible for binding multi-modal ensembles of neurons at a longer-range, whole-cortex level (Kopell et al. 2000; Roelfsema et al. 1997). Abnormalities in gamma and beta synchronization are implicated in many brain disorders involving cognitive dysfunction, including schizophrenia, Parkinson's, autism, and Alzheimer's disease (Uhlhaas and Singer 2006).
In general, gamma activity in people with schizophrenia appears to have less amplitude and less synchronization (Cho et al. 2006; Green et al. 2003; Haig et al. 2000; Spencer et al. 2003; Strelets et al. 2002). The few studies that have examined the relationship between schizophrenic symptom profile and oscillatory activity in the gamma range have tended to find positive symptoms, such as reality distortion (Gordon et al. 2001) or hallucinatory activity (Baldeweg et al. 1998) associated with increased gamma activity, and negative symptoms, such as psychomotor poverty, associated with decreased gamma (Gordon et al. 2001; Lee et al. 2003). Moreover, some studies have shown generalized abnormal increases in beta activity (Kissler et al. 2000) and beta synchrony (Nagase et al. 1992; Wada et al. 1998). There is some indication that an increase in beta activity may be cognitively important for gestalt perception (Spencer et al. 2004). However, there is also recent evidence for decreased long-range beta synchrony during gestalt perception (Uhlhaas et al. 2006). In general, gamma band activity appears to be altered in experiments examining both evoked and induced rhythms and tasks involving both attention and distraction.
We have examined the response of the auditory cortex of patients with schizophrenia when given periodic click train stimuli at 20, 30, and 40 Hz as measured using magnetoencephalography (MEG). Control subjects respond to 20-Hz click trains with a mixed mode signal containing both 20- and 40-Hz components. In contrast, the schizophrenia patients have a dominant 20-Hz response to 20-Hz drive and only minimal 40-Hz activity. We also find that in response to 40-Hz drive, schizophrenic subjects have a decreased 40-Hz component and an increased 20-Hz component to their response compared with the normal controls, who show an extremely strong 40-Hz response. A decrease in 40-Hz response to 40-Hz drive in the schizophrenic population has been well established (Kwon et al. 1999; Light et al. 2006), but little work has been done on a possible increase in 20-Hz click train response to either 20- or 40-Hz drive.
We use computational modeling to argue that changes to neural inhibition, in particular an increase in IPSC decay time, may be sufficient to explain these experimental results. Previous work indicates that Parvalbumin positive (PV+) interneurons my be preferentially affected in many brain regions including cortex (Lewis et al. 2005) and hippocampus (Zhang and Reynolds 2002). Post mortem studies on prefrontal cortex in schizophrenia (Lewis et al. 2005) have shown that PV + interneurons have decreased GAT-1, a GABA transporter thought to control spillover between neighboring release sites. Recent work indicates these changes may be generalized in the cortex (Hashimoto et al. 2006; Konopaske et al. 2006). We model this alteration as an extended inhibitory postsynaptic current (IPSC) decay time based on experimental evidence indicating that with sufficient density of synapses or repeated activation, GAT-1 blockade can lead to extended IPSCs (Overstreet and Westbrook 2003). We hypothesize that a reduction in GAT-1, as opposed to a full blockade, may lead to a similar extension, particularly in the case of repeated activation in the gamma/beta range that we consider here. In addition, a reduction in GAD67, one of two enzymes responsible for GABA synthesis is quite widely replicated (Akbarian et al. 1995; Lewis et al. 2005; Straub et al. 2007) and likely indicates less available GABA, which can be modeled as a decrease in the strength of inhibition. There is evidence to suggest that alterations to both GAD67 and GAT-1 occur primarily in chandelier cells, fast-spiking PV+ interneurons that synapse onto the axon initial segment (AIS) of pyramidal cells (Lewis et al. 2005; Pierri et al. 1999; Woo et al. 1998). However, this conclusion may be primarily due to the relative ease with which chandelier cell cartridges can be located in postmortem tissue and may not indicate a truly selective change.
We have simulated auditory cortex to examine the network effects of an extended decay time and decreased amplitude of IPSCs. We determine that extended IPSC decay time is sufficient to replicate the important features of the frequency profiles observed in auditory entrainment. The effect of reduced available GABA is secondary and was unnecessary to replicate the desired effects in our final model. In modeling results from our click train experiment based on physiological observations, we propose a mechanism for the changes seen in auditory cortex entrainment and at the same time demonstrate a possible functional effect of such interneuron abnormalities.
Methods
Experimental methods
The experimental work considered in this paper included 12 chronic medicated schizophrenic (SZ) subjects and 12 control (NC) right-handed male subjects, both with normal hearing, using MEG. The 12 right-handed male schizophrenic patients were recruited from the Brockton Veterans Affairs Medical Center, Brockton, MA, and from the Freedom Trail Clinic at Massachusetts General Hospital (MGH). The patients met Diagnostic and Statistical Manual of Mental Disorders, Fourth Ed. (DSM-IV) criteria 16 for schizophrenia on the basis of interviews conducted using the Structured Clinical Interview for DSM-IV and medical chart review and met the following inclusion criteria: age between 18 and 55 yr because in those >55 yr, there are significant age-related event-related potential (ERP) and electroencepholography (\EEG) changes; no history of neurological illness; no history of alcohol or drug dependence (DSM-IV criteria); no present medication for medical disorders that would have known deleterious EEG, neurological, and/or cognitive functioning consequences (e.g., reserpine or barbiturates for hypertension); no hearing impairments as determined by patient's medical history and as assessed by our portable audiometry test (important for the auditory ERP protocol); no alcohol use in the 24 h prior to testing; and an ability and desire to cooperate with our experimental procedures as evinced by giving informed consent. Three patients were receiving conventional neuroleptics; nine patients were receiving novel antipsychotics. No patient had had electroconvulsive therapy, neurologic illness, major head trauma, or alcohol or other drug abuse within the previous 5 yr (DSM-IV criteria). Mean duration of illness was 26.2 ± 8.2 (SD) yr with near continuous administration of antipsychotics during that period. This study did not specifically control for medications although the MEG analysis was performed blind to medications.
Each subject was presented with 20-, 30-, and 40-Hz click trains of 500-ms duration binaurally at 65–70 dB SL with a fixed interspike interval (ISI) of 1.5 s. MEG acquisition was performed with Elekta-Neuromag Vectorview 306-channel MEG with a sampling rate of 600 Hz (hardware band-passed filtered 1.0–200 Hz). The MEG was co-registration with anatomic magnetic resonance imaging (MRI) using fiduciary head points. Equivalent current dipoles (ECD) using a spherical head conductivity model were fitted with the maximal goodness of fit (GOF) from sequential single dipole fitting over the time range of 150–600 ms after the first click and a time step of 1 ms. Left and right hemispheres were evaluated separately, using a two-dipole solution that was subsequently used for spatial filters. Grand-averaged waveforms were calculated using the right and left spatial filters. Power spectral density was calculated from the grand averaged waveforms using a Welch technique (128-point overlap, 256-point Blackman window) (Stufflebeam et al. 2006).
Computational modeling methods
We have developed two models of auditory cortex to examine the network effects of an extended decay time and decreased amplitude of IPSCs. The first is a biophysical model constructed using GENESIS (the GEneral NEural SImulation System) (Bower and Beeman 1998). The second is a highly simplified model that shows behaviors similar to those of the GENESIS model. The more biophysical model closely correlates with experimental MEG results and permits us to examine possible effects of alterations in separate classes of interneurons, whereas the simplified model allows selective examination of synaptic decay and synaptic strength in a straightforward way. That the models behave similarly is an indication that the simplified model is meaningful in this context.
Although the models do differ in their level of direct biophysical relevance, both are in fact quite simplified. Thus for both models, it is unreasonable to claim too much biological realism in our parameter selection. Instead we first selected network parameters to generate the control network model behavior, with its preference for 40-Hz response to both 20- and 40-Hz drive and then tested whether or not an extension in time constant would be sufficient to generate the schizophrenic model behavior. We will show that for each model, there is a range of inhibitory synaptic decay values such that schizophrenic entrainment behavior is observed. The existence of this range of appropriate decay times may predict that it is possible for our proposed mechanism to exist in actual tissue and is not a strict result of our model tuning to a particular range of parameter space. Details of each model's construction and parameter selection are given in the following text.
GENESIS model methods
The GENESIS model consists of 160 pyramidal cells, 40 basket cells, and 40 chandelier cells. The basket cells and chandelier cells are both inhibitory and are distinguished by their connectivity and synaptic decay time constants. The interneurons are divided into two populations to examine possible implications of selective changes to the chandelier subclass of interneurons that synapses exclusively onto the AIS. Each neuron is modeled with two compartments, one representing the soma and AIS in a single compartment, and one representing the dendrites. They are based on the single neuron models described by Sharon Crook as part of her central pattern generator (CPG) neural network simulation (Bower and Beeman 1998), although the parameters used are chosen to replicate properties of cortical neurons and are not specific to CPG cells. Connectivity between the cells is random and is described in greater detail in the following text.
The equations for each compartment of the GENESIS model are as follows, where Vm is the transmembrane potential and V′m is the transmembrane potential of the adjacent compartment (Note that we adopt the convention that the inside potential is 0 mV)
and cellular parameters are given in Table 1. The equations for voltage gated channels are
Table 1. Cellular parameters for GENESIS model.
| Parameter | Definition | Value |
|---|---|---|
| Em | Leak potential | −59.4 mV |
| ENa | Equilibrium potential, Na | 45 mV |
| EK | Equilibrium potential, K | −82 mV |
| GNa | Maximal Na conductance | 80 pS |
| gK | Maximal K conductance | 40 pS |
| CM | Specific membrane capacitance | 1 μF/cm2 |
| RM | Specific membrane resistance | 10 KΩcm2 |
| RA | Specific axial resistance | 0.05 KΩcm2 |
| ls | Compartment length, soma | 30 × 10−4 cm |
| ds | Compartment diameter, soma | 30 × 10−4 cm |
| ld | Compartment length, dendrite | 100 × 10−4 cm |
| dd | Compartment diameter, dendrite | 2 × 10⁻⁴ cm |
| Ra | Axial Resistance | Ra = 4lRA/(πd2) |
| Cm | Membrane capacitance | Cm = πldCM |
| Rm | Membrane resistance | Rm = RM/πld |
For x = m, n, h we take
Where
Synaptic activation is modeled as a channel conductance change that proceeds with a specific time course when activated by the presynaptic cell. We take
where b indicates the GABAA type inhibition generated by basket cells, ch indicates the GABAA type inhibition generated by chandelier cells, exc indicates fast AMPA type excitation generated by the pyramidal cells and background noise, and d indicates excitation from the drive at the modeled frequency (20, 30, or 40 Hz). The time course of synaptic conductance change for a spike the presynaptic cell at time tn is defined for s = exc, d, b, ch by
where H(t) is the Heaviside function. Note that A is a constant chosen such that max of Gs(t) is gmax,s.
The synaptic decay time for excitation τ2,exc = 3 ms is chosen to represent AMPA excitatory kinetics. In cortical pyramidal cells and interneurons, decay times between 1 and 4 ms are reported (Häuser and Roth 1997; Zhou and Hablitz 1998). In the control network, the IPSC decay time τ2,b = τ2,ch = 8 ± 5 ms chosen with a uniform distribution and is selected to be representative of GABAA decay kinetics (Salin and Prince 1996a,b; Whittington et al. 1995). There is some debate about the biophysically relevant decay times for GABAA in cortex with both fairly short (3.71 ms) and extremely long (33.2 ms) decay times reported (Galaretta and Hestrin 1997; Hefti and Smith 2002) although there is agreement that GABAA decay is generally longer than AMPA type excitatory currents. We choose 8 ms as the mean decay time both because it is an intermediate value in the range of reported values and because decay times in the 6- to 10-ms range are traditionally used in the modeling literature (Börgers et al. 2005; Börgers and Kopell 2003; Cunningham et al. 2004; Whittington et al. 1995). We believe that what is of primary importance for the dynamic mechanisms presented here is that inhibitory decay be longer than excitatory decay in the control for which there is some experimental agreement. We choose to incorporate some variability in decay time to represent heterogeneity among cells. In the schizophrenic network, IPSC decay times are distinct between the two inhibitory populations. We take τ2,b = 8 ± 5 ms in the basket cell population and τ2,ch = 25 ± 15 ms for the chandelier cells. It is important to note that this decay time for chandelier cells is not chosen precisely based on experimental evidence of actual decay times. Although there is evidence of extended decay times due to reduced GAT-1 (Overstreet and Westbrook 2003), this is in the presence of GAT-1 blockade as opposed the partial reduction in GAT-1 we consider here, so it is impossible to infer biophysically reasonable values for an extended decay time. As will be discussed in the following text, the model is not dependent on the exact selection of this parameter, but rather the desired model behavior is present for a range of possible decay times. This extension of IPSC time course is restricted to the chandelier cell population, which models the possible preferential changes to GAT-1 in chandelier cells. The difference between the τ2,ch parameters is the only distinction between the control and schizophrenic networks. Although we tested the model behavior using decreased gmax,ch to model reduced available GABA, the impact of these changes was minimal and did not produce the desired frequency effects, as will be discussed in RESULTS. All synaptic parameters are given in Table 2.
Table 2. Synaptic parameters for GENESIS model.
| Parameter | Definition | Value |
|---|---|---|
| Eexc, Ec | Excitatory reversal potential for E cells and drive | 45 mV |
| Eb, Ech | Inhibitory reversal potential for basket cells and chandelier cells | −82 mV |
| gmax,exc, gmax,d | Peak channel conductance for excitatory synapses (E cells and drive) | 80 pS |
| gmax,b, gmax,ch | Peak channel conductance for inhibitory synapses (basket and chandelier cells) | 40 pS |
| τl,exc, τl,d | Rise time constant for excitatory synapses (E cells and drive) | 3 ms |
| τ2,exc, τ2,d | Decay time constant for excitatory synapses (E cells and drive) | 3 ms |
| τl,b, τ1,ch | Rise time constant for basket and chandelier synapses | 3 ms |
| τ2,b | Decay time constant for basket cells | 8 ms |
| τ2,ch | Decay time constant for chandelier cells | 8 ± 5 ms (control) |
| 25 ± 15 ms (schizophrenia) |
As in other computational modeling studies (Börgers et al. 2005; Traub and Bibbig 2000), we include Poisson noise input to network cells to represent background activity in the cortex. Noise is included in the excitatory component of the Isyn term with all pyramidal cells receiving a Poisson train of excitatory postsynaptic currents (EPSCs) at an average rate of 4 Hz. There is much research and debate regarding the precise source and structure of noise in cortex (Destexhe et al. 2001, 2004; Softky and Koch 1993; Stevens and Zador 1998), but there is agreement that cortical neurons fire at relatively high rates during wakefulness in vivo in the absence of direct stimulation (10–25 Hz) (Evarts 1964; Steriade et al. 2001). With this level of noise input, in the absence of click train drive, pyramidal cells in the GENESIS model fire at an average rate of 29 Hz, which is reasonably close to the reported range of rates for spontaneous in vivo activity. As will be discussed in RESULTS precise structure of noise is not an important factor in the modeling presented here. Rather noise provides a general background level of spiking activity important for certain model features. The model Poisson train is chosen independently for each cell, and the EPSCs are strong enough to trigger firing in a resting cell.
Drive input is also included in the Isyn term. The model receives excitatory stimulation at 20, 30, and 40 Hz to model each experimental click train frequency, modeling input mediated via thalamocortical projections. Drive was applied to proportionately fewer interneurons based on evidence of preferential thalamic inputs to cortical pyramidal cells compared with interneurons in cat visual cortex (Binzegger et al. 2004). Input drive was applied via projections from a simulated rhythm generator that sent synapses to all pyramidal cell dendrites and 65% of interneuron dendrites. The model was somewhat sensitive to the proportion of interneurons receiving periodic drive in that a subpopulation of interneurons needs to have weak enough drive to be dominated by pyramidal cell activity as will be discussed in RESULTS. In addition, when averaging across trials (as in Fig. 3), the first pulse from the drive was two times stronger (using a higher gmax) than the remaining pulses, roughly modeling a greater sensitivity to signal onset prior to any habituation of the network to the stimulus.
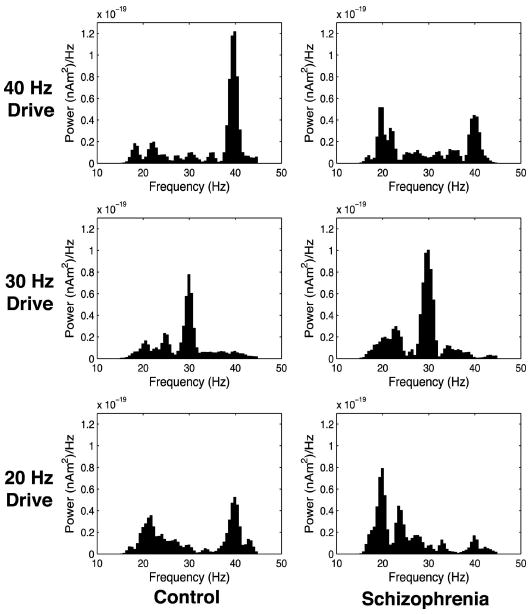
Fig. 3.
Frequency transform of grand average of GENESIS model simulations.
Connectivity between cell populations in the model is random. Precise patterns of neural connectivity in auditory cortex in particular are not yet precisely known, thus we arrived at the model values by based on observations in other brain areas. All synaptic connections are made from the soma/AIS compartment of the presynaptic cell onto the dendritic compartment of the postsynaptic cell unless otherwise indicated.
Each pyramidal cell projects to 2% of all other pyramidal cells. This is consistent with work indicating relatively sparse PC to PC connectivity (Deuchars and Thomson 1996). Pyramidal cells project to 10% of all basket cells and 10% of all chandelier cells. Basket cells project to 80% of all other basket cells and 80% of all chandelier cells based on evidence that cortical basket cells innervate other GABAergic interneurons (Gibson et al. 1999; Somogyi et al. 1998). Each PC receives projections from 10% of chandelier cells. Chandelier cells project only to the soma/AIS compartment of modeled pyramidal cells. These cells are known to send strings of boutons to the initial segments (IS) of pyramidal cells, and do not synapse onto other cellular regions (Somogyi 1977). Each PC receives projections from 10% of all basket cells. Basket cells send projections equally to soma and dendrites of a given cell. This models the dense basket-like plexus of synapses these cells form around somata and proximal dendrites (Lewis and Lund 1990).
Each simulation trial is 600 ms long with a time step of 0.1 ms although only the final 4,096 time points (or 409 ms) were used in the frequency analysis. As in previous computational work, we model the MEG signal by averaging EPSCs received by pyramidal cells in the network (Jensen et al. 2005) because it is thought that the MEG signal is dominated by excitatory synaptic current in the apical dendrites of cortical pyramidal cells (Hämäläinen et al. 1993). We rescale this averaged EPSC value by a factor of 100, noting that the units (other than time) in our modeling do not correlate with the experimental data because our networks are not of comparable size to the true active cortical network. Because we seek only to model relative frequency content, this is not a concern, and it is reasonable to re-scale the frequency transform.
In the GENESIS model, it is possible to model individual subjects by selecting a random connectivity and then leaving that network connectivity fixed through some number of trials and averaging the results as in the experimental analysis. Some individual trials are used to more closely examine model mechanisms as well. How many subjects and trials are used in any individual case will be clarified when results are presented. In either case (averaged or single trials), frequency analysis is performed on the modeled MEG signal via fast Fourier transform (FFT) using an algorithm presented by Press et al. (1992). The FFT algorithm operates on a vector numbers with a length that is a power of two. The simulated 600-ms trial had a total of 6,000 time points, and the final 4,096 (or 400 ms) were used in the signal processing. Data from initial time steps were ignored because each simulation has a transient period before developing into a regular rhythm.
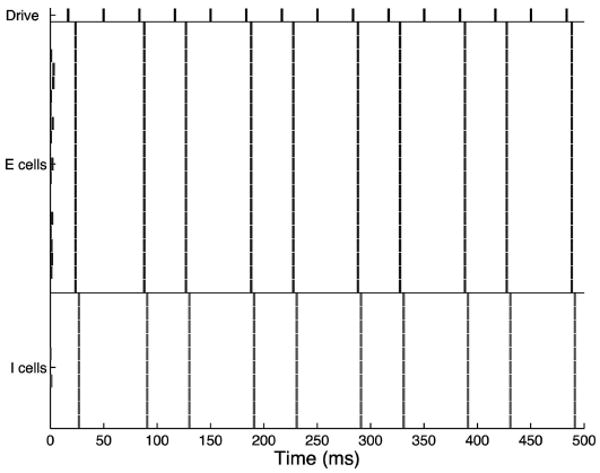
Simplified model
The simplified cortical model is a network of 20 excitatory and 10 inhibitory cells. The inhibitory cells represent PV+ fast-spiking interneurons. In contrast to the GENESIS model, there is no distinction between subclasses of interneurons and connectivity is all-to-all between populations as indicated in Fig. 1. Every cell receives Poisson noise input as well as drive input at the frequency of the modeled click train. For each neuron, we use a one-dimensional theta model in a manner similar to that described in Börgers and Kopell (2003). This canonical model can be attained by a change of variables from a quadratic integrate-and-fire model (Börgers et al. 2005) or from a Hodgkin-Huxley type I neuron (Ermentrout and Kopell 1986). In this model, the cell is represented by a point traveling along a circle. This is in contrast to the Hodgkin-Huxley model where the cell travels along a four-dimensional limit cycle. The dynamic variable that governs cell behavior is the angle θ designating position on the circle.
Fig. 1.
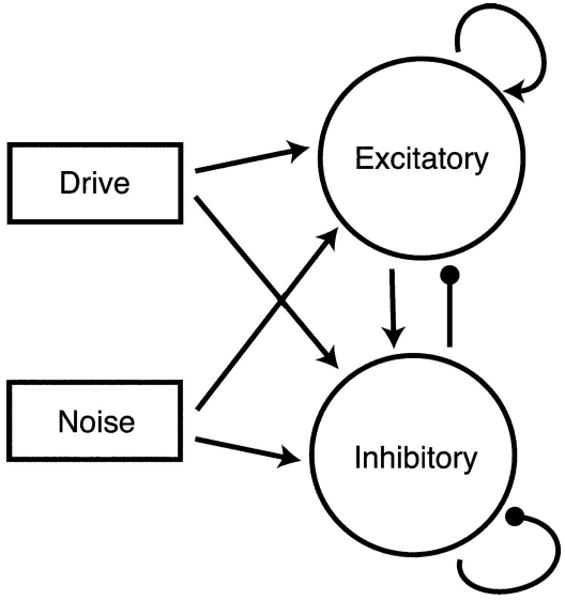
Network diagram for simplified model. Connectivity between populations is all-to-all.
The equation for cell k in the network is as follows
where bk is analogous to an applied current, Sk is the synaptic input, and Nk(t) is the Poisson noise input into cell k and time is in milliseconds.
First consider cell behavior in the absence of synaptic input or noise; that is, assume that Sk = 0 and Nk(t) = 0. For bk < 0, there are exactly two fixed points at
where θ_ is stable and θ+ is unstable. Thus for bk <0 in the absence of input, the cell approaches the fixed point at θ_ regardless of initial conditions. As bk is varied, the system moves through a saddle node bifurcation at bk = 0, and there are no fixed points for bk >0. Solutions move repeatedly around the circle with period , moving slowly near θ = 0 and very rapidly near θ = π. We define a spike as occurring when θ = π. All cells in the simplified network have bk = −0.01 and thus must have excitatory input to fire.
We define the synaptic input term as follows
Each term in the sum represents synaptic input from an individual cell j in the network.
The synaptic weight gjk represents the strength of the synapse from cell j to cell k and is analogous to the maximal conductance gmax in the Hodgkin-Huxley model. We have the following gjk parameters: gie = 0.015, gei = 0.025, gee = 0.015, gii = 0.02, gde = 0.3, and gdi = 0.08, where i indicates an inhibitory cell, e indicates and excitatory cell, and d indicates the pacemaking drive cell. The αj term controls excitation and inhibition with
The synaptic gating variable sjk is defined by
with η = 5 and τR = 0.1, where τR is analogous to a synaptic rise time. The synaptic gating variable takes on values between 0 and 1, moving very rapidly toward sjk = 1 when θj = π and then decaying exponentially back to zero at a rate controlled by τj. Thus τj controls the decay time of EPSCs (if cell j is excitatory) and IPSCs (if cell j is inhibitory). If cell j is excitatory we take τj = τexc = 2, representative of AMPA synaptic kinetics. This decay time is slightly faster than that used for the GENESIS model, but all that is important for the network dynamic presented here is that excitation is faster than inhibition. Both values are within the experimentally observed range for AMPA decay in mammalian cortical cells (1- to 4-ms decay) (Häuser and Roth 1997; Zhou and Hablitz 1998). In the control network for cell j inhibitory, we take τj = τinh = 8; as described in the preceding text for the GENESIS model, this value is selected to be representative of GABAA synaptic decay, although here the decay times are chosen uniformly. Any heterogeneity in decay time would be irrelevant in this case due to uniform connectivity. In the schizophrenic network, we take τj = τinh = 28, and this is the only distinction between the control and schizophrenic models. Again, this value is not chosen to represent or predict a precise extension in decay due to reduced GAT-1. Rather we will show that there is a range of values of τinh such that schizophrenic entrainment behavior is observed.
The drive is represented by a single excitatory pacemaker cell firing at the modeled click train frequency and providing input to every network cell with strong input to E cells and weak input to I cells. We are modeling here only the cells that receive direct input due to the auditory click train. Omission of cells not receiving drive does not impact the behavior of the modeled network. The synaptic input from this drive cell is incorporated into the Sj term. The noisy input, Nk(t) is a Poisson train of EPSCs chosen independently for each cell at spike times tn. Each EPSC is of the form
where H(t) is the Heaviside function. The scaling factor Agmax is set at 0.5, which results in a maximum value for each individual EPSC of gmax = 0.1281. We take τ1 = 0.1, τ2 = 2. We chose these parameters so that noise EPSCs are approximately equal in strength and time course to those produced by the network E cells. EPSCs occur with an average waiting time of 30 ms. With this level of noise input, in the absence of drive, the average firing rate of network cells is 23.4 Hz, which is within the reported range for in vivo recordings of the firing rate of mammalian cortical cells during wakefulness in the absence of direct stimulation (10–25 Hz) (Evarts 1963; Steriade et al. 2001). As in the experimental work, each simulation trial is 500 ms long.
As described for the GENESIS model, we average EPSCs received by excitatory cells to model the MEG signal. To compare with the averaged MEG experimental results, we average over multiple trials each with distinct background noise, though in our analysis of model mechanisms, individual trials are used for illustration. In either case, the modeled MEG signal is filtered for the frequency component <100 Hz using a Butterworth filter. The signal is then windowed using a single Tukey window that is equal to 1 in the center 80% of the window and decays smoothly to zero at the window edges. After filtering and windowing, the Fast Fourier Transform is performed. Simulations are run such that 8,192 (213) data points are taken during a 500-ms trial and all data points are included in the frequency analysis. All modeling and frequency analysis is performed using MATLAB for the simplified model.
Results
Experimental results
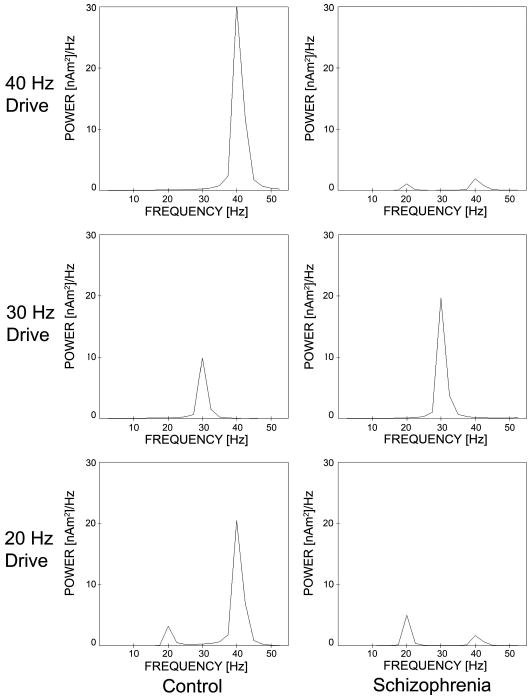
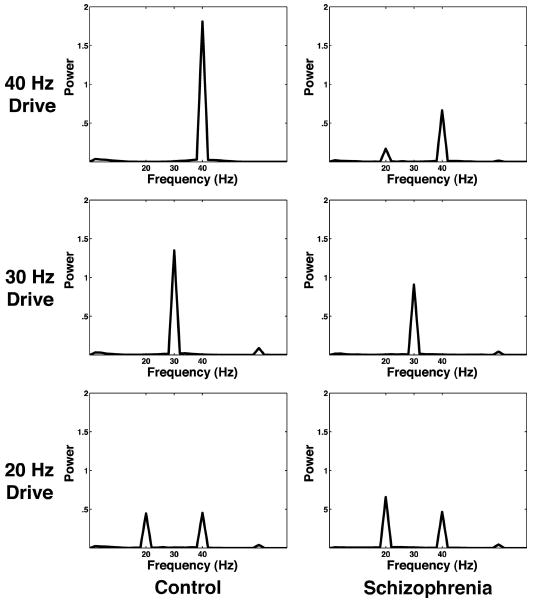
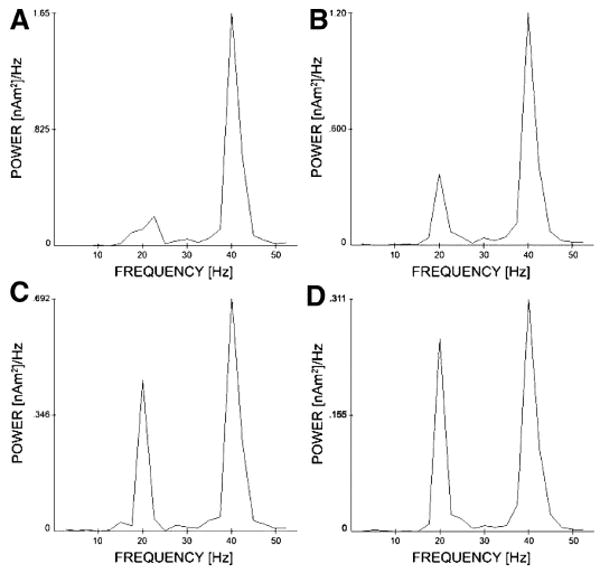
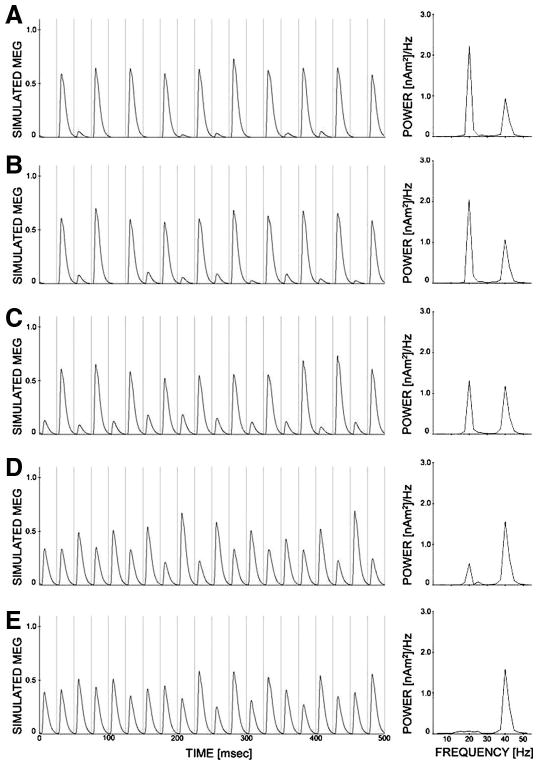
We focus here on the frequency content of cortical activity in the left hemisphere because schizophrenia is thought to preferentially affect that hemisphere (Heidrich and Strik 1997; McCarley et al. 2002; Shenton et al. 2001). Figure 2 shows the spectral power of the grand averaged experimental signal (Stufflebeam et al. 2006). As in previous work on auditory entrainment in schizophrenia (Kwon et al. 1999; Light et al. 2006), we focus on stimulus-locked evoked activity by averaging all click train trials from all subjects in time prior to frequency analysis. This method does not permit analysis of spontaneous or nonstimulus locked activity, but we are primarily interested in the relationship of cortical activity to a time-locked drive. In this grand averaged signal (Fig. 2), control subjects exhibit a strong 40-Hz response to 40-Hz drive. In addition, control subjects exhibit a mixed mode response to 20-Hz drive containing 20- and 40-Hz components. In contrast, schizophrenic subjects respond primarily at 20 Hz to 20-Hz drive and have a mixed mode response to 40-Hz drive that contains both 20- and 40-Hz components. For the 40-Hz drive, there is less power at 40 Hz in the schizophrenic (SZ) compared with normal controls NC (P < 0.001, with a mean difference of 0.81 nAm2/Hz using a permutation-derived bootstrap statistic with 10,000 resamples of the mean difference between SZ and NC), and the spectral power at 20 Hz is greater for SZ than NC (P < 0.05, mean difference = −0.1). For the 20-Hz drive, the 20-Hz response is also increased in SZ compared with NC (P < 0.025, mean difference = 0.4) and the 40-Hz power is lower (P < 0.05, mean difference = 0.1). Both the schizophrenic and control subjects show equivalent 30-Hz response to 30-Hz drive (P > 0.6, mean difference = 0.18). Statistical analysis is performed as described by Lv et al. (2007).
Fig. 2.
Power spectral density for grand averaged magnetoencephalography (MEG) click train experimental data. Note that the schizophrenic subjects appear to have <40-Hz power and >20-Hz power in response to both 20- and 40-Hz drive when compared with controls.
Both the GENESIS model and the simplified model replicate important features of the experimental results
Both models replicate important features of these frequency results. In particular, for both computational models, the control network shows a greater 40-Hz response to both 20- and 40-Hz drive than the schizophrenic network, whereas the schizophrenic network favors a 20-Hz response to both of these drives. Both computational models entrain to 30 Hz in both the control and schizophrenic configurations. We first examine the behavior of the GENESIS model.
GENESIS Model
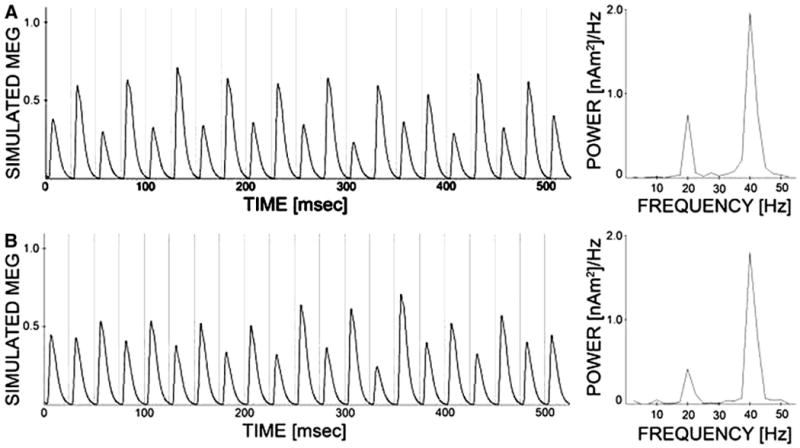
Figure 3 shows GENESIS model frequency content when several subjects are simulated and results are analyzed analogously to the experimental work shown in Fig. 2. Ten simulated patients are created for each cohort by selecting a random connectivity and fixing that connectivity for 10 trials where background noise is distinct trial to trial. Network behavior is stable enough in the control case that additional trials would not greatly impact the averaged result. The grand average in time over all subjects and trials is taken for each cohort and then the frequency transform is performed. In the control condition, the GENESIS model shows clear entrainment to 40-Hz input drive. In contrast, when the time constant of inhibition from chandelier cells to pyramidal cells is extended, the schizophrenic model exhibits a mixed mode response to 40-Hz drive that includes both 20- and 40-Hz components. This is consistent with our experimental data.
The GENESIS model also shows entrainment to 30-Hz input drive in both the control and schizophrenic networks, which is in agreement with the MEG results. As can be seen in Fig. 3, the GENESIS model responds primarily at 40 Hz to 20-Hz drive in the control condition. In the schizophrenic condition, the model responds more strongly at 20 Hz to 20-Hz drive, which is consistent with the experimental results.
Simplified Model
Like the GENESIS model, the simplified theta model replicates important features of the frequency profiles observed in our experimental data. Figures 4 and 5 are generated by running the 500-ms simulation 20 times for each of the six cases, then averaging all 20 simulated MEG signals in time to generate an averaged MEG signal (Fig. 4). Note that the modeled MEG signal shown here is not filtered. The noise input for each trial is generated independently. Frequency analysis is then performed on this averaged signal, as described in METHODS, and is shown in Fig. 5.
Fig. 4.
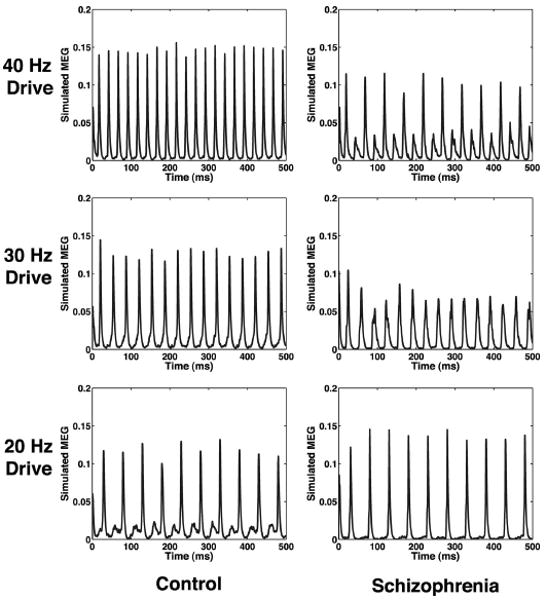
Average of modeled MEG signal for 20 trials of simplified model.
Fig. 5.
Frequency transform of time averaged signal from 20 trials of simplified model.
The simplified network shows extremely strong entrainment to 40-Hz drive in the control condition. In comparison, when the time constant of inhibition is extended, the schizophrenic network shows weakened 40-Hz response and increased 20-Hz response, which agrees with the experimental results. Note also that in the case of 20-Hz drive, the control network shows a 40-Hz component to the response, and the schizophrenic network shows primarily a 20-Hz response (see MEG trace in Fig. 4). In looking at the frequency analysis for the schizophrenic case of 20-Hz drive, note that the 40-Hz component present in the frequency analysis in Fig. 5 is a harmonic and that no evidence of 40-Hz activity is present in the MEG trace in Fig. 4. In contrast, for the control response to 20-Hz drive, we know that the 40-Hz component cannot be exclusively a harmonic because its power is greater than that for the 20-Hz peak. The results for 20-Hz drive agree with our experimental data in that the control has a greater 40-Hz component than the schizophrenic network and the schizophrenic network clearly favors a 20-Hz response. Both the schizophrenic and control network models entrain to 30 Hz as in the experimental data.
The behavior of the simplified model is more transparent, hence the raster plots for the small model are more revealing, so for the duration of this section analysis of the effects of parameters is done for the simplified model unless otherwise stated.
Basic model mechanism: the impact of extended inhibition
In the Case of 40-Hz Drive, Extended IPSCs Generate the 20-Hz Component of the Schizophrenic Mixed Mode Response
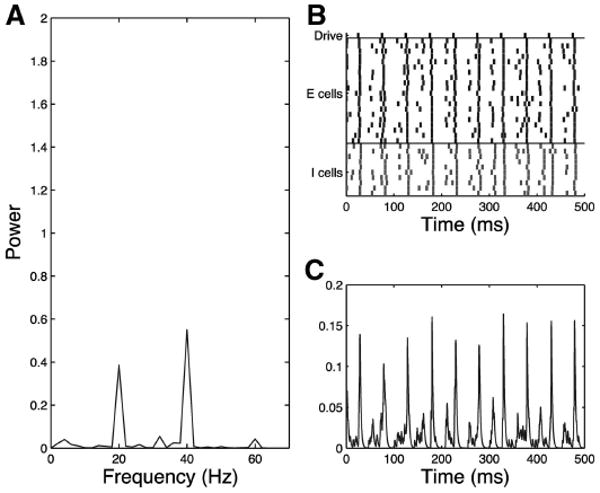
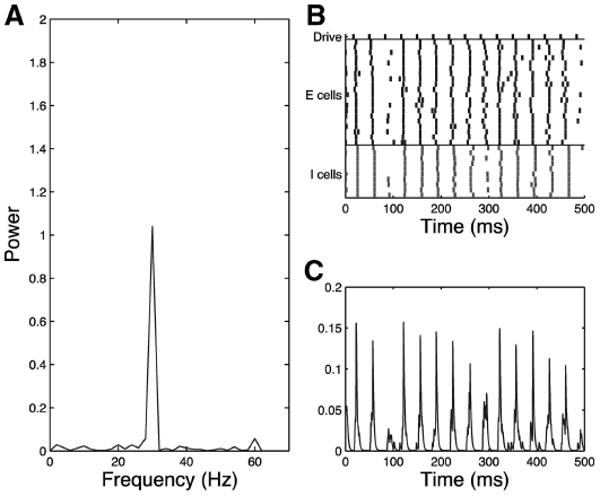
In the control network, 40-Hz response to 40-Hz drive is extremely strong as can be seen clearly in the rasterplot, MEG trace and frequency analysis for a single trial in Fig. 6. With τinh = 8 for synapses, the timing is such that inhibition decays sufficiently between pulses to permit all E cells to respond to every drive input. This behavior is extremely robust.
Fig. 6.
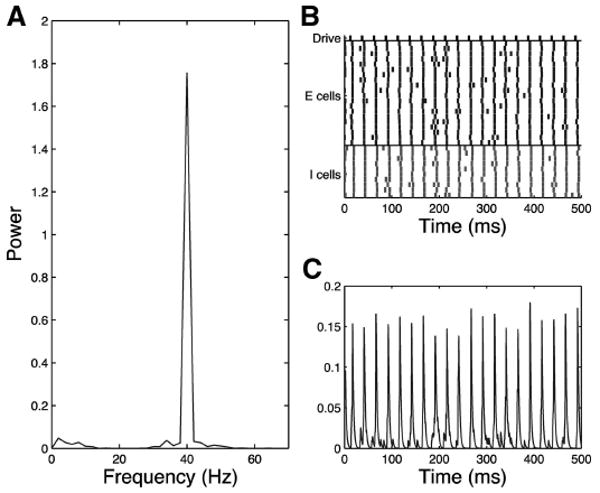
Simplified model trial, control 40-Hz drive case, τinh = 8, noise input to all cells. Control network responds with pure 40 Hz to 40-Hz drive as shown in the frequency diagram (A), raster plot (B), and simulated MEG trace (C).
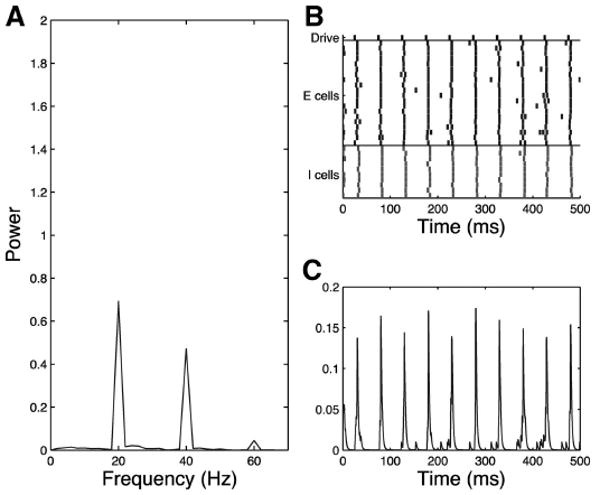
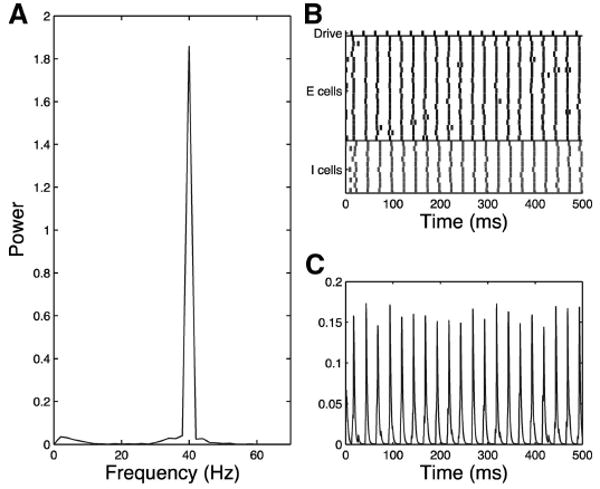
When the time constant of inhibition is extended to generate the schizophrenic network, a strong 20-Hz component is introduced to the signal as can be seen in the single trial of the schizophrenic network shown in Fig. 7. Because of the extended length of the IPSCs, the E cells are not free to respond to every pulse from the drive. Instead the population responds predominantly to alternate pulses from the drive, resulting in a substantial 20-Hz component to the response. Even in the presence of extended inhibition, some 40-Hz component of the response remains. In both models, this introduction of 20-Hz activity is robust to changes in decay time and is present for τinh between 26 and 42. In the GENESIS model, this 20-Hz activity is present for τ2,ch between 21 and 28 ms. In the simplified model, noise input to network cells contributes to this mixed mode response and will be discussed in more detail in the following text.
Fig. 7.
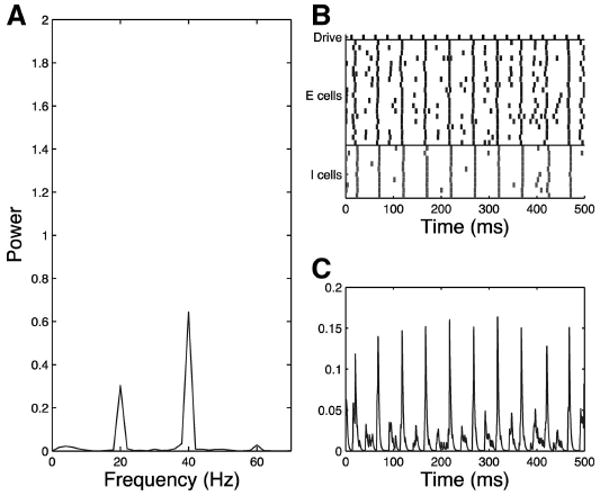
Simplified model trial, schizophrenic 40-Hz drive case, τinh = 28, noise input to all cells. Schizophrenic network responds with mixed mode (20 Hz and 40 Hz) to 40-Hz drive in the presence of noise as shown in the frequency diagram (A), raster plot (B), and simulated MEG trace (C).
Extended Time Course at all Inhibitory Synapses Contributes to the 20-Hz Component of Response to 40-Hz Drive in the Schizophrenic Network
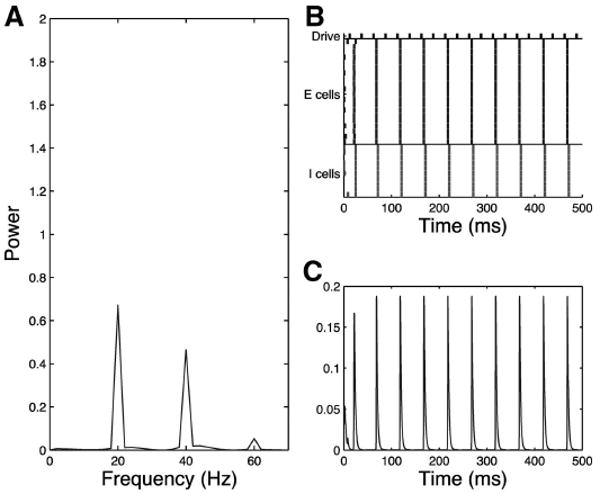
In the simplified model schizophrenic network with 40-Hz drive, the E cells must receive synchronous extended inhibition at 20 Hz to respond to alternate pulses from the drive as a population. To generate this inhibition, a sufficient subpopulation of the inhibitory cells must fire at 20 Hz. In the simplified model, the I cells are suppressed during alternate pulses from the drive by extended inhibition through I-to-I synapses. When these I-to-I synapses are removed the 20/40 mixed mode response to 40-Hz drive is lost (Fig. 8).
Fig. 8.
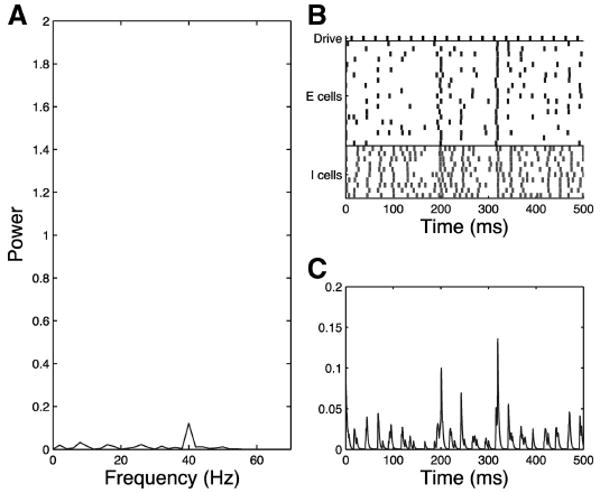
Simplified model trial, schizophrenic 40-Hz drive case, I-to-I synapses eliminated, noise input to all cells, τinh = 28. Network fails to respond with mixed mode (20 Hz and 40 Hz) to 40-Hz drive when I-to-I synapses are eliminated as shown in the frequency diagram (A), raster plot (B), and simulated MEG trace (C).
Extended time constants for all inhibitory synapses, including those between I cells, were necessary in the simplified model; however, 20-Hz response to 40-Hz drive in the schizophrenic condition is seen in the GENESIS model without extended I-to-I synapses. The dependence of the simplified model on extended I-to-I synapses strongly suggested that applying extended inhibition more broadly in the GENESIS model might strengthen the 20 Hz relative to the 40-Hz response, and indeed this is the case.
Recall that in the GENESIS model, only the chandelier population has extended IPSCs of τ2,ch = 25 ± 15 ms while the inhibitory basket cell population has τ2,b = 8 ms, which models the possible preferential change to inhibition in the cortical chandelier cell population. Because the chandelier cells project only to the soma/AIS compartment of the pyramidal cells, they provide none of the extended I-to-I synapses that lead to the 20-Hz response in the simplified model. To model this possible broader network change in inhibitory time course, the mean time constant for all basket cell projections was systematically increased in the model from 8 to 20 ms. As is illustrated in the frequency plots of single trials shown in Fig. 9, this resulted in an increased prevalence of 20-Hz activity as compared with 40-Hz activity. Power spectrum values shown in the figure are normalized relative to the maximum of the 40-Hz peak to better illustrate the relative levels of 20- and 40-Hz activity. The dependence of the simplified model on extended I-to-I synapses may indicate that the most important effect of extended inhibition in the basket cells is the introduction of extended inhibition to the basket and chandelier populations as opposed to increasing the presence of extended inhibition to pyramidal cells.
Fig. 9.
Activity of the schizophrenic GENESIS model for single trials stimulated at 40 Hz as τ2,b, the inhibitory decay constant of basket cell projections, is increased. The figure shows the power spectra of model oscillatory activity for basket cell τ2,b of 8 ± 4 ms (A), 10 ± 5 ms (B), 15 ± 7.5 ms (C), and 20 ± 10 ms (D) where values are chosen from a uniform distribution. Graphs are plotted normalized to the 40-Hz peak.
For the Schizophrenic Case with 40-Hz Drive, A Subpopulation of I Cells Needs to Receive Drive Weak Enough to Permit E cell Behavior to Dominate
In the GENESIS model, 35% of I cells do not receive excitatory drive, modeling preferential thalamic drive to pyramidal cell populations. This subpopulation of cells is important for maintaining 20-Hz inhibitory activity in the presence of 40-Hz drive because their behavior is dominated by the excitatory input from pyramidal cells, as opposed to the 40-Hz drive input. The model does not depend precisely on the exact proportion of inhibitory cells receiving drive, only on there existing a sufficient subpopulation with weak enough drive that pyramidal excitation dominates their behavior. The model loses the 20-Hz rhythmicity when excitatory drive input is received by upward of 90% of inhibitory cells and the 20-Hz component is stronger when fewer cells get excitatory drive input. In this simplified model, drive to all I cells is very weak, and the entire population serves the same dynamic function as the cells that do not receive excitatory drive in the GENESIS model. Thus drive must be sufficiently weak in a subpopulation of inhibitory cells to generate a 20-Hz response to 40-Hz drive with extended inhibition.
With 20-Hz Drive, Extended IPSCs Transform the Control Response into the Schizophrenic Response
In the control network, the inhibition onto excitatory cells gates the excitatory background noise. Once inhibition is released from the E cells between pulses from the drive, a single cell responding to noise input can trigger other E cells to fire through E to E synapses. The time constant of inhibition is such that this activity occurs midway between drive inputs and contributes to a 40-Hz component of the network response. When EPSCs are summed to generate the simulated MEG signal for single trial, some 40-Hz component to the response to 20-Hz drive is present (Fig. 10). Although present in this single trial, it is easier to visually distinguish the presence of the 40-Hz response in the averaged MEG signal where many trials are summed (Fig. 4). Note that although some portion of the 40-Hz activity in Fig. 10 is likely due to a harmonic from the 20-Hz component, there is true 40-Hz activity present because the 40-Hz peak (0.4534) is higher than the 20-Hz peak (0.4462). The role of the excitatory noise input in this case is to provide a background level of activity that is gated by inhibition between drive inputs, leading to a 40-Hz response. The precise structure of the noise is not critically important, and we believe that any form of generalized excitation in the system would suffice, provided it was of a strength and frequency to respond to gating by inhibition. In our modeling, if the strength or frequency of the noise input is increased, the 40-Hz component of the signal initially strengthens. However, if the level is increased excessively (doubled or more), then the noise overcomes any gating by the inhibition and the 40-Hz component of the signal is lost while the 20-Hz component is reduced.
Fig. 10.
Simplified model trial control 20-Hz drive case noise input to all cells, τinh = 8. Control network shows some 40-Hz response to 20-Hz drive as shown in the frequency diagram (A), raster plot (B), and simulated MEG trace (C).
In the schizophrenic network, extended IPSCs result in pure 20-Hz response to 20-Hz drive, as can be seen in the single trial shown in Fig. 11. When the time constant of inhibition is sufficiently extended there is no synchronous gating of excitatory cells between drive pulses and the network fires at 20 Hz in response to 20-Hz drive. Note that the 40-Hz component that can be seen in the frequency analysis for the schizophrenic case of 20-Hz drive is entirely a harmonic due to the nature of the signal and the signal processing. This can be discerned by noting that the network clearly entrains only to 20 Hz in the rasterplot. In both models, schizophrenic network entrainment at 20 Hz under 20-Hz drive is extremely robust to changes in decay time and is present for decay times between 16 and 44 ms in the simplified model and decay times between 23 and 45 ms in the GENESIS model.
Fig. 11.
Simplified model trial, schizophrenic 20-Hz drive case, noise input to all cells, τinh = 28. Schizophrenic network shows pure 20-Hz response to 20-Hz drive as shown in the frequency diagram (A), raster plot (B), and simulated MEG trace (C).
Decrease in strength of inhibition is not sufficient to generate schizophrenic network behavior for both 20- and 40-Hz drive
In the simplified model, when the strength of both I-to-I and I-to-E synapses is reduced by half but IPSC decays remain at the control value of 8 ms, modeling only a decrease in available GABA, it is possible to replicate the reduction of 40-Hz power in response to 40-Hz drive in the schizophrenic network. In this case, 40-Hz power reduces from 1.8106 in the control to 1.3971 when strength of inhibition is reduced. However, no 20-Hz response component is introduced to the signal. In addition, a reduction in the strength of inhibition in the absence of extended IPSCs still permits 40-Hz response to 20-Hz drive. For the control, 20-Hz power is 0.4462 and 40-Hz power is 0.4534 with a ratio of 40 Hz to 20-Hz power of 1.0184. When the strength of inhibition is reduced, 20-Hz power is 0.3677 and 40-Hz power is 0.3772, which is a ratio of 40 Hz to 20-Hz power of 1.0258, nearly identical to the control ratio. Thus our modeling indicates that a simple reduction in GABA may lead to reduced 40-Hz response to 40-Hz drive but is not sufficient to generate the enhancement in 20-Hz entrainment activity observed experimentally. The GENESIS model showed a similar lack of sensitivity to a reduction of inhibitory strength by 50%.
Impact of noise and heterogeneity
With 40-Hz Drive Noise Input Contributes to the 40-Hz Component of the Schizophrenic 40-Hz Response in the Simplified Model
As discussed in the preceding text, an extended IPSC introduces a 20-Hz component to the response of the schizophrenic network to 40-Hz drive. However, our modeling indicates that noise input is important for maintaining a mixed mode response (as opposed to a purely 20-Hz response). Note that in the absence of noise input, the schizophrenic network responds with pure 20 Hz to 40-Hz drive (Fig. 12) but that when noise is added, a 40-Hz component is reintroduced to the signal (Fig. 7). When the noise is added, a few cells receive sufficiently synchronous drive and noise input to fire even in the presence of the heavy inhibition resulting from extended IPSCs. When EPSCs between E cells are summed over the network to generate the simulated MEG signal, this results in a mixed mode response to 40-Hz drive.
Fig. 12.
Simplified model trial, schizophrenic 40-Hz drive case, no noise input, τinh = 28. Schizophrenic network responds with pure 20 Hz to 40-Hz drive as shown in the frequency diagram (A), raster plot (B), and simulated MEG trace (C). Note that the 40-Hz component in A is a harmonic.
It is not necessarily a particular form of noise per se that leads to this mixed mode response, but rather the noise input is a mechanism by which some, but not all, cells will receive enough input to overcome inhibition on the more silent drive cycles. Indeed there are other ways to generate similar behavior. For instance, if the structure of the network is changed, and instead of noise input, heterogeneity in the number of inhibitory inputs to E cells is added, we find a similar mixed mode response, with cells that are more heavily inhibited responding to alternate inputs, while the less heavily inhibited cells fire at 40 Hz. However, this particular mechanism is not effective in generating the noise-dependent control 40-Hz response to 20-Hz drive described in the preceding text or the noise-dependent schizophrenic entrainment to 30-Hz drive that will be discussed in the following text. In general, there is some sensitivity of this mixed mode response to the level and frequency of noise input. If the strength of the noise is increased by ∼20% from the level set here, then the beat skipping behavior is overcome on some cycles, and the 20-Hz component of the signal is lost. If the strength of the noise input is decreased, the 20-Hz component of the signal is enhanced and the 40-Hz component is decreased, but the fundamental mechanism of skipping alternate drive inputs due to extended inhibition remains intact. As is to be expected, the sensitivity to this parameter changes if the time constant of inhibition is shortened or extended with greater noise needed to introduce a 40-Hz component to the response for longer IPSCs.
Heterogeneity in IPSC Decay Time Can Control the Level of Mixed Mode Response in Schizophrenic GENESIS Model in Response to 40-Hz Drive
The larger size of the GENESIS model permits exploration of heterogeneity in inhibitory timing that is not possible in the smaller simplified model. Figure 13 shows the results of several single trials of the schizophrenic GENESIS model in which the IPSC decay rate of the chandelier cells (τ2,ch) is chosen from several uniform distributions under 40-Hz drive. Note that for the more homogeneous trials (top), 20-Hz behavior dominates, whereas in the most heterogeneous trials (bottom), 40-Hz behavior dominates. To achieve the mixed mode response that contains both 20- and 40-Hz components, some level of heterogeneity is necessary. However, more extreme heterogeneity in combination with extended decay times leads to 40-Hz entrainment with weak power. We believe this sensitivity in the GENESIS model is in some ways similar to the sensitivity of the mixed mode response to noise input in the simplified model. In this case, instead of the random noise process controlling which cells can fire on more silent drive cycles, it is heterogeneity in the level of inhibition that introduces the mixed mode behavior.
Fig. 13.
Behavior of GENESIS model as heterogeneity of τ2,ch is increased. The most homogeneous trial with τ2,ch = 25 ± 5 ms is shown in A. The most heterogeneous trial with τ2,ch =25 ± 25 ms is shown in E. Heterogeneity is increased by ±5 ms for each figure below, with the most heterogeneous trial (τ2,ch = 25 ± 25 ms) shown in E.
Noise Input Enhances 30-Hz Entrainment in the Schizophrenic Network
In the absence of noise input in the simplified model, the schizophrenic network fails to respond to every third pulse of the drive (Fig. 14). However, when the background noise is reintroduced to the model, only a 30-Hz component is present (Fig. 15), although entrainment is somewhat ragged in single trials. For decay times between 8 and 36 ms, the averaged signal shows the desired 30-Hz entrainment. For longer decay times in this range, the network will fail to respond to some cycles of the drive, but because of the presence of noise in the system and the underlying dynamics (see DISCUSSION), the pattern of skipping is not consistent and thus no frequency <30 Hz is introduced to the response. For decay times >36, the system skips alternate beats from the drive in a stable fashion, and a 15-Hz component is introduced to the signal. In the GENESIS model, 30-Hz entrainment is present for decay times between 8 and 33 ms. At values >33 ms, a 15-Hz component is introduced.
Fig. 14.
Raster plot for the simplified model, schizophrenic 30-Hz drive case, no noise input, τinh = 28. In the absence of noise, the schizophrenic network responds to every 3rd drive input.
Fig. 15.
Simplified model trial, schizophrenic 30-Hz drive case noise input and τinh = 28. Schizophrenic network responds at 30 Hz to 30-Hz drive in the presence of noise. Entrainment is somewhat ragged, but no low frequency is present as shown in the frequency diagram (A), raster plot (B), and simulated MEG trace (C).
For the case of the schizophrenic response to 30-Hz drive, although noise is important for the response, it is important for a different reason than in the case of the schizophrenic 40-Hz drive. Here it serves to provide unpredictable excitation that undermines underlying dynamics that lead to the skipping of every third drive input (Fig. 14). This is an interesting mechanism for which we have developed some level of dynamic understanding, but it is beyond the scope of the work presented here. For this case, if the strength of noise is sufficiently weakened (by ∼40%), then a low-frequency component can be introduced to the signal. However, the response is not at all sensitive to increased noise levels.
Modeling suggests reasons that schizophrenic enhanced 20-Hz activity not detected in other studies
Previous studies using a similar click train paradigms (Hong et al. 2004; Kwon et al. 1999; Light et al. 2006) do not confirm an increase in 20-Hz response to 40-Hz drive in the schizophrenic subjects, although Kwon et al. does seem to show presence of such a signal but without statistical significance. Our modeling points to several reasons that this may be the case.
Even in the Presence of Extended IPSCs, Strong Drive Can Eradicate 20-Hz Component of Response to 40 Hz Drive in the Schizophrenic Network
In the schizophrenic network, if drive to the excitatory cells is too strong, it can overcome any effects of extended inhibition and cause the network to respond at 40 Hz (Fig. 16). This may indicate that lower volume click trains will be more apt to expose 20-Hz behavior. Indeed one previous study (Light et al. 2006) that does not indicate any alteration schizophrenic 20-Hz behavior in response to 40-Hz drive used much louder click trains than the experimental work modeled here. (93 vs. 65–70 dB). Unfortunately Kwon et al. (1999) does not report click train volume.
Fig. 16.
Simplified model trial, schizophrenic 40-Hz drive case, noise input to all cells, increased drive to excitatory cells (gde = 0.4, increased from gde = 0.3), τinh = 28. Schizophrenic network loses 20-Hz response to 40-Hz drive when strength of drive is increased as shown in the frequency diagram (A), raster plot (B), and simulated MEG trace (C).
Averaging in Time Prior to Frequency Transform May Decrease Visibility of 20-Hz Response to 40-Hz Drive in the schizophrenic Network
Figure 17 shows two individual trials of the GENESIS schizophrenic network with 40-Hz drive for a fixed connectivity. The top trace shows a network that has a decreased response to first, third, fifth, etc pulses from the drive, whereas the bottom trace shows a response that is instead least responsive to the second, fourth, sixth, etc inputs. Because the experimental data are averaged in time prior to frequency analysis, two such signals averaged together would have decreased 20-Hz component even though each individual signal contains 20-Hz behavior. If the beat-skipping mechanism that we have described here is indeed present in the true biological system, such an averaging effect combined with possible impact of loud stimulus described in the preceding text, could mask a tendency toward beta activity. Averaging in time as we do here, which is necessary to study the evoked response, may also disguise a 20-Hz increase even if 20 signal is truly present. The simplified model shows a similar averaging effect, although for both models, there is enough of a preference for one pattern of beat skipping that the 20-Hz activity is present even after averaging (see Figs. 3 and 5). This preference for one pattern is due to a synchronizing effect of the initial drive input.
Fig. 17.
Two representative traces from a single modeled schizophrenic subject with 40-Hz drive, GENESIS model. Note that beta peaks occur on even cycles in A and on odd cycles in B.
Discussion
The MEG experimental results indicate that in response to auditory click trains in the gamma and beta frequency bands, schizophrenic subjects favor a 20-Hz cortical response, while the control response is dominated by 40-Hz activity. Both the GENESIS model and the simplified model show enhanced 20-Hz activity in the schizophrenic networks in response to both 20- and 40-Hz drive and the presence of 40-Hz response to 20-Hz drive in the control networks. We have identified a possible mechanism contributing to this enhanced 20-Hz activity in schizophrenia, namely an increase in the time course of IPSCs, which we hypothesize may occur due to a decrease in available GAT-1 as described in Lewis et al. (2005).
Results implicating GAD67 reduction in schizophrenia have been widely replicated and accepted (Akbarian et al. 1995; Lewis et al. 2005; Straub et al. 2007). A reduction in GAD67 can be expected to lead to a decrease in GABA activity. Computational experiments with a decrease in overall strength of GABA synaptic transmission showed that such alterations were not sufficient to generate enhanced 20-Hz activity in the schizophrenic network. It is possible that an extension of inhibitory timing, through a reduction in GAT-1, may come about as compensation for a primary deficit in available GABA. Whether or not an alteration to GAT-1 is a primary or secondary effect, our modeling indicates an extension of IPSCs is critically important in generating the frequency profiles modeled here.
The schizophrenic response for each of the three drives we tested is not sensitively dependent on the exact selection of decay time. Not only are each three individual schizophrenic drive responses present for a range of inhibitory decay parameter values, all three are present for inhibitory τinh between 26 and 36 in the simplified model and τ2,ch between 23 and 28 in the GENESIS model. Ongoing mathematical work has provided an initial understanding of the dynamic basis of this lack of sensitivity. Analysis of the simplified model leads to the development of a one-dimensional family of discontinuous discrete maps, parameterized with respect to the drive period. This map exposes the robust dynamics that form the basis of the beat skipping seen in the schizophrenic case of 40-Hz drive as well as providing insights into the role of noise for the schizophrenic case of 30-Hz drive. Detailed discussion of the underlying mathematics is beyond the scope of the work presented here. It is important to note that we do not take model inhibitory decay times to be predictive of true physiological values present in schizophrenia. Neither of our models is of sufficient biophysical detail to claim to be predictive to such a high level of accuracy, and the interval of IPSC decay times for which this entrainment behavior is seen is certainly dependent on the region of parameter space where we have tuned our model. However, the robust presence of schizophrenic entrainment behavior for a range of inhibitory decay times lends weight to our assertion that the dynamic mechanisms we describe here may indeed underlie the observed experimental entrainment behavior.
In addition to the importance of inhibitory timing, it is interesting to note the importance of heterogeneity (in the GENESIS model) and noise (in the simplified model) in achieving the mixed mode response to 40-Hz drive in the schizophrenic network models. In addition to the important direct functional effects of alterations to inhibitory interneurons, perhaps an equally important feature of these physiological changes is an increase in heterogeneity in cortical networks. Presumably not every cell or every synapse in the schizophrenic brain is affected equally by changes to inhibition. The modeling suggests such an inconsistency in physiological effects may contribute to the observed features of auditory entrainment in schizophrenia.
Another important feature of the schizophrenic response to 40-Hz drive is the contribution of the 20-Hz rhythmicity of the inhibitory cells to network maintenance of the 20-Hz component of the drive response. To maintain this 20-Hz activity, a subpopulation of I cells needs to receive weak enough drive that their behavior is dominated by excitatory cell activity as opposed to the periodic drive. In the simplified model, 20-Hz activity in inhibitory cells is controlled by extended IPSCs to inhibitory cells. In the GENESIS model, extending the time constant of inhibition on the basket cells in addition to chandelier cells, enhances 20-Hz behavior in the inhibitory cell populations, which in turn enhances the 20-Hz response in the pyramidal cell population.
This contribution of broadly applied extended inhibition leads us to predict that inhibitory changes in schizophrenia may not be restricted to chandelier cells, which synapse exclusively onto the AIS of pyramidal cells, and do not form synaptic contacts with other interneurons. Although the postmortem evidence indicates that the GAT-1 reduction in schizophrenia preferentially affects chandelier cells (Lewis et al. 2005), it may instead be the case that the change is more easily visualized in postmortem tissue for chandelier cells due to their linear array of dense synaptic cartridges onto the AIS. As discussed in this same review (Lewis et al. 2005), some experimental work exists indicating possible alteration to synaptic kinetics of cortical basket cells. Upregulation in postsynaptic GABA receptors in schizophrenia has been localized in cortical pyramidal cell bodies, where basket cells are known to form synaptic contact (Benes et al. 1996) and a significant reduction in parvalbumin immunoreactive varicosities, which may correspond to the axon terminals of basket cells, has been found in the middle cortical layers in prefrontal cortex (Lewis et al. 2001).
Experimental work indicates that high synapse density contributes to any extended inhibition due to GAT-1 reduction (Overstreet and Westbrook 2003), and it is not immediately clear that synapse density would be sufficient in nonchandelier interneurons to generate an extension of inhibitory decay time, even if a reduction of GAT-1 is present. However, the same experimental work showed repetitive activation in the presence of GAT-1 blockade was also sufficient to lead to an extension of the time course of inhibition. This may be the more relevant finding of the work by Overstreet and Westbrook (2003) because we consider a system driven in the gamma/beta range.
The contribution of the I-to-I connectivity to model frequency is consistent with modeling and experimental work showing mutually inhibitory interneuronal networks are well suited to synchronize pyramidal cells both locally and across long distances (Buszáki and Chrobak 1995; Buszáki et al. 2004; Whittington et al. 2000) and provides insight into how changes to inhibitory timing could have broad impact on cortical synchrony and function.
As mentioned in the preceding text, it is important to note that though we have statistical evidence for an increase in 20-Hz response for schizophrenic subjects to 40-Hz drive, this increase has not been consistently described in other similar studies (Kwon et al. 1999; Light et al. 2006). The modeling exposes two possible reasons for this lack of confirmation. The presence of 20-Hz response to 40-Hz drive in the schizophrenic network is dependent on the strength of drive input to the network. If the drive is too strong, then it overpowers any extended inhibition. The volume of the experimental stimulus used in (Light et al. 2006), which did not indicate any enhancement of 20-Hz response to 40-Hz drive in the schizophrenic population, is 93 dB. In contrast, the experimental work we model here used a click train of only 65–70 dB. High volume stimuli have been shown to induce a greater fMRI blood-oxygen-level-dependent (BOLD) response in auditory cortex, likely indicating activity in a larger recruited cortical neuron population and may reflect encoding for stimulus intensity (Jänke et al. 1998). It may be that a loud experimental stimulus induces sufficient excitation in the auditory cortex to overpower the effects of extended inhibition. This leads us to predict that low-volume stimuli may be more suited for eliciting the 20-Hz response in schizophrenic subjects, and we will take this into consideration in future experimental work.
An additional potential confound is that in the case of the schizophrenic network under 40-Hz drive, depending on connectivity and initial conditions, two distinct trials may skip different pulses from the drive. That is, in one trial the network may fire predominantly in response to the first, third, and fifth pulses, whereas in another trial, response will be primarily to the second, fourth, and sixth pulses. When these two trials are averaged in time, the 40-Hz component is enhanced and the 20-Hz component is decreased. For the data analysis to expose the 20-Hz rhythm, there must be a sufficient subpopulation of schizophrenic subjects that fire in response to the same pulses from the drive, and indeed, each subject must be somewhat consistent in their own response trial to trial as well. In our modeling, the initial drive input provides enough synchronization to weight the simulations toward one preferred phase and thus a 20-Hz component is visible, and a similar initial synchronization may also be present the experimental data.
In many studies of cortical rhythms in humans, particularly those where oscillatory activity is not so directly stimulus locked and is thus not expected to be consistent in phase from trial to trial, averaging is performed after frequency analysis in single trials (Jensen et al. 2002; Spencer et al. 2004). In this work, however, we have focused on the stimulus-locked evoked rhythmic activity, and it is thus appropriate to average in time prior to frequency analysis. Because data analysis is performed in this manner, any 20-Hz activity present after averaging must be located at the same phase location in the original signals. The beat skipping mechanism we propose here could lead to such locking from trial to trial.
The experimental work modeled here did not specifically control for medications, although the MEG analysis was performed blind to medication. In one previous EEG study (Hong et al. 2004), there was a correlation between an increase in the 40-Hz power in response to 40-Hz drive for schizophrenia patients on atypical antipsychotic medications. This effect was not seen in the results modeled here. Because most patients were on atypical anti-psychotic medications, any medication effect might be expected to increase the 40-Hz power, not decrease it. Still a medication effect cannot be ruled out, particularly for the increased 20-Hz response. Further study using medication naive subjects would be necessary to completely rule out this possibility.
We have used small-scale low-dimensional cellular-based networks to model MEG data, and in so doing, potentially important aspects of MEG signal generation have not modeled explicitly. For example, we have not considered the impact of cortical cell geometry on signal generation, which has been the subject of recent modeling work (Jones et al. 2007). Instead we have based our modeling on the assumption that the MEG data modeled represents collective cell activity localized to the auditory cortex and that summed excitatory synaptic activity in our models is a sufficient approximation of the MEG signal. This method has been used in previous work (Jensen et al. 2005) and is based on indications MEG signal is dominated by excitatory synaptic current in the apical dendrites of cortical pyramidal cells (Hämäläinen et al. 1993). Because the behavior of excitatory and inhibitory cell populations are tightly linked, analysis that includes inhibitory synaptic activity in the modeled MEG signal does not markedly change the results and actually mildly accentuates 20-Hz behavior in the schizophrenic networks.
Our models make a link between biophysical alteration and cortical function, via changes in gamma and beta frequency neural activity. Because activity in these frequency bands is implicated in cognitive impairment, the dynamics that underlie model behavior may be of cognitive importance beyond the context of schizophrenia.
Acknowledgments
Thanks to R. McCarley, M. Whittington, and M. Cunningham for guidance and helpful discussions and to S. Kunec and M. Kramer for assistance with coding and computational issues.
Grants: Funding was provided by National Science Foundation Grant DMS0211502, National Institutes of Health Grants R01 HD-040712, 5K08MH-067966, P41 RR-14075, P50 MH-060450, the National Alliance for Research on Schizophrenia and Depression, the MIND Institute, and the Athinoula A. Martinos Center for Biomedical Imaging.
References
- Akbarian S, Kim JJ, Potkin SG, Hagman JO, Tafazzoli A, Bunney WE, Jr, Jones EG. Gene expression for glutamic acid decarboxylase is reduced without loss of neurons in prefrontal cortex of schizophrenics. Arch Gen Psychiatry. 1995;52:258–266. doi: 10.1001/archpsyc.1995.03950160008002. [DOI] [PubMed] [Google Scholar]
- Baldeweg T, Spence S, Hirsch SR, Gruzelier J. Gamma-band electroencephalographic oscillations in a patient with somatic hallucinations. Lancet. 1998;352:620–621. doi: 10.1016/S0140-6736(05)79575-1. [DOI] [PubMed] [Google Scholar]
- Benes FM, McSparren J, Bird ED, Sangiovanni JP, Vincent SL. Deficits in small interneurons in prefrontal and cingulate cortices of schizophrenic and schizoaffective patients. Arch Gen Psychiatry. 1991;48:996–1001. doi: 10.1001/archpsyc.1991.01810350036005. [DOI] [PubMed] [Google Scholar]
- Benes FM, Vincent SL, Marie A, Khan Y. Up-regulation of GABAA receptor binding on neurons of the prefrontal cortex in schizophrenic subjects. Neuroscience. 1996;75:1021–1031. doi: 10.1016/0306-4522(96)00328-4. [DOI] [PubMed] [Google Scholar]
- Benes FM, Kwok EW, Vincent SL, Todenkopf MS. A reduction of nonpyramidal cells in sector CA2 of schizophrenics and manic depressives. Biol Psychiatry. 1998;44:88–97. doi: 10.1016/s0006-3223(98)00138-3. [DOI] [PubMed] [Google Scholar]
- Binzegger T, Douglas RJ, Martin KAC. A quantitative map of the circuit of cat primary visual cortex. J Neurosci. 2004;24:8441–8453. doi: 10.1523/JNEUROSCI.1400-04.2004. [DOI] [PMC free article] [PubMed] [Google Scholar]
- Borgers C, Epstein S, Kopell N. Background gamma rhythmicity and attention in cortical local circuits: a computational study. Proc Natl Acad Sci USA. 2005;102:7002–7007. doi: 10.1073/pnas.0502366102. [DOI] [PMC free article] [PubMed] [Google Scholar]
- Borgers C, Kopell N. Synchronization in networks of excitatory and inhibitory neurons with sparse, random connectivity. Neural Comput. 2003;15:509–538. doi: 10.1162/089976603321192059. [DOI] [PubMed] [Google Scholar]
- Bower JM, Beeman D. The Book of GENESIS: Exploring Realistic Neural Models With the General Neural Simulation System. 2nd. Santa Clara, CA: TELOS; 1998. pp. 131–147. [Google Scholar]
- Buzsáki G, Chrobak JJ. Temporal structure in spatially organized neuronal ensembles: a role for interneuronal networks. Curr Opin Neurobiol. 1995;5:504–510. doi: 10.1016/0959-4388(95)80012-3. [DOI] [PubMed] [Google Scholar]
- Buzsáki G, Geisler C, Henze DA, Wang XJ. Interneuron Diversity Series: Circuit complexity and axon wiring economy of cortical interneurons. Trends Neurosci. 2004;27:186–193. doi: 10.1016/j.tins.2004.02.007. [DOI] [PubMed] [Google Scholar]
- Cho RY, Konecky RO, Carter CS. Impairments in frontal cortical γ synchrony and cognitive control in schizophrenia. Proc Natl Acad Sci USA. 2006;103:19878–19883. doi: 10.1073/pnas.0609440103. [DOI] [PMC free article] [PubMed] [Google Scholar]
- Coyle JT, Tsai G, Goff D. Converging evidence of NMDA receptor hypofunction in the pathophysiology of schizophrenia. Ann NY Acad Sci. 2003;1003:318–327. doi: 10.1196/annals.1300.020. [DOI] [PubMed] [Google Scholar]
- Cunningham MO, Whittington MA, Bibbig A, Roopun A, LeBeau FEN, Vogt A, Monyer H, Buhl EH, Traub RD. A role for fast rhythmic bursting neurons in cortical gamma oscillations in vitro. Proc Natl Acad Sci USA. 2004;101:7152–7157. doi: 10.1073/pnas.0402060101. [DOI] [PMC free article] [PubMed] [Google Scholar]
- Davis KL, Stewart DG, Friedman JI, Buchsbaum M, Havey PD, Hof PR, Buxbaum J, Haroutunian V. White matter changes in schizophrenia: evidence for myelin-related dysfunction. Arch Gen Psychiatry. 2003;60:443–456. doi: 10.1001/archpsyc.60.5.443. [DOI] [PubMed] [Google Scholar]
- Desmedt JE, Tomberg C. Transient phase-locking of 40 Hz electrical oscillations in prefrontal and parietal human cortex reflects the process of conscious so matic perception. Neurosci Lett. 1994;168:126–129. doi: 10.1016/0304-3940(94)90432-4. [DOI] [PubMed] [Google Scholar]
- Destexhe A, Badoual M, Piwkowska Z, Thierry Bal, Rudolph M. A novel method for characterizing synaptic noise in cortical neurons. Neurocomputing. 2004;58:191–196. [Google Scholar]
- Destexhe A, Rudolph M, Fellous JM, Sejnowski TJ. Fluctuating synaptic conductances recreate in-vivo like activity in neocortical neurons. Neuroscience. 2001;107:13–24. doi: 10.1016/s0306-4522(01)00344-x. [DOI] [PMC free article] [PubMed] [Google Scholar]
- Deuchars J, Thomson AM. CA1 pyramid-pyramid connections in rat hippocampus in vitro: dual intracellular recordings with biocytin filling. Neuroscience. 1996;74:1009–1018. doi: 10.1016/0306-4522(96)00251-5. [DOI] [PubMed] [Google Scholar]
- Engel AK, Kreiter AK, Konig P, Singer W. Synchronization of oscillatory neuronal responses between striate and extrastriate visual cortical areas of the cat. Proc Natl Acad Sci USA. 1991;88:6048–6052. doi: 10.1073/pnas.88.14.6048. [DOI] [PMC free article] [PubMed] [Google Scholar]
- Engel AK, Singer W. Temporal binding and the neural correlates of sensory awareness. Trends Cogn Sci. 2001;5:16–25. doi: 10.1016/s1364-6613(00)01568-0. [DOI] [PubMed] [Google Scholar]
- Ermentrout GB, Kopell N. Parabolic bursting in an excitable system coupled with a slow oscillation. SIAM J Appl Math. 1986;46:233–253. [Google Scholar]
- Evarts EV. Temporal pattern of discharge of pyramidal tract neurons during sleep and waking in the monkey. J Neurophysiol. 1964;27:152–171. doi: 10.1152/jn.1964.27.2.152. [DOI] [PubMed] [Google Scholar]
- Farmer SF. Rhythmicity, synchronization and binding in human and primate motor systems. J Physiol. 1998;509:3–14. doi: 10.1111/j.1469-7793.1998.003bo.x. [DOI] [PMC free article] [PubMed] [Google Scholar]
- Galaretta M, Hestrin S. Properties of GABAA receptors underlying inhibitory synaptic currents in neocortical pyramidal neurons. J Neurosci. 1997;17:7220–7227. doi: 10.1523/JNEUROSCI.17-19-07220.1997. [DOI] [PMC free article] [PubMed] [Google Scholar]
- Gibson JR, Beierlein M, Connors BW. Two networks of electrically coupled inhibitory neurons in neocortex. Nature. 1999;402:75–79. doi: 10.1038/47035. [DOI] [PubMed] [Google Scholar]
- Gordon E, Williams L, Haig AR, Wright Jim, Meares RA. Symptom profile and “gamma” processing in schizophrenia. Cognit Neuropsychiatry. 2001;6:7–19. [Google Scholar]
- Green MF, Mintz J, Salveson D, Nuechterlein KH, Breitmeyer B, Light GA, Braff DL. Visual masking as a probe for abnormal gamma range activity in schizophrenia. Biol Psychiatry. 2003;53:1113–1119. doi: 10.1016/s0006-3223(02)01813-9. [DOI] [PubMed] [Google Scholar]
- Haig AR, Gordon E, DePascalis V, Meares RA, Bahramali H, Harris A. Gamma activity in schizophrenia: evidence of impaired network binding? Clin Neurophysiol. 2000;111:1461–1468. doi: 10.1016/s1388-2457(00)00347-3. [DOI] [PubMed] [Google Scholar]
- Hämäläinen M, Hari R, Ilmoniemi RJ, Knuutila J, Lounasmaa OV. Magnetoencephalography—theory, instrumentation, and applications to noninvasive studies of the working human brain. Rev Mod Phys. 1993;65:413–497. [Google Scholar]
- Hashimoto T, Bazmi HH, Mirnics K, Lewis DA. Expression of GABA-related transcripts across cortical regions in subjects with schiozphrenia (Poster). Society for Neuroscience Conference; Atlanta, GA. 2006. [Google Scholar]
- Häuser M, Roth A. Estimating the time course of the excitatory synaptic conductance in neocortical pyramidal cells using a novel voltage jump method. J Neurosci. 1997;17:7606–7625. doi: 10.1523/JNEUROSCI.17-20-07606.1997. [DOI] [PMC free article] [PubMed] [Google Scholar]
- Hefti BJ, Smith PH. Distribution and kinetic properties of GABAergic inputs to layer V pyramidal cells in rat auditory cortex. J Assoc Res Otolaryngol. 2002;4:106–121. doi: 10.1007/s10162-002-3012-z. [DOI] [PMC free article] [PubMed] [Google Scholar]
- Heidrich A, Strik VK. Auditory p300 topography and neuropsychological test performance: evidence for left hemispheric dysfunction in schizophrenia. Biol Psychiatry. 1997;41:327–335. doi: 10.1016/s0006-3223(96)00030-3. [DOI] [PubMed] [Google Scholar]
- Hong LE, Summerfelt A, McMahon R, Adami H, Francis G, Amie Elliott, Buchanan RW, Thaker GK. Evoked gamma band synchronization and liability for schizophrenia. Schizophr Res. 2004;70:293–302. doi: 10.1016/j.schres.2003.12.011. [DOI] [PubMed] [Google Scholar]
- Jänke L, Shah NJ, Pose S, Grosse-Ryuken M, Müller-Gärtner HW. Intensity coding of auditory stimuli: an fMRI study. Neuropsychologia. 1998;36:875–883. doi: 10.1016/s0028-3932(98)00019-0. [DOI] [PubMed] [Google Scholar]
- Jensen O, Gelfand J, Kounios J, Lisman JE. Oscillations in the alpha band(9–12 Hz) increase with memory load during retention in a short-termmemory task. Cereb Cortex. 2002;12:877–882. doi: 10.1093/cercor/12.8.877. [DOI] [PubMed] [Google Scholar]
- Jensen O, Goel P, Kopell N, Pohja M, Hari R, Ermentrout B. On the human sensorimotor-cortex beta rhythm: sources and modeling. Neuroimage. 2005;26:347–355. doi: 10.1016/j.neuroimage.2005.02.008. [DOI] [PubMed] [Google Scholar]
- Jokeit H, Makeig S. Different event-related patterns of gamma-band power in brain waves of fast- and and slow-reacting subjects. Proc Natl Acad Sci USA. 1994;91:6339–6343. doi: 10.1073/pnas.91.14.6339. [DOI] [PMC free article] [PubMed] [Google Scholar]
- Jones SR, Pritchett DL, Stufflebeam SM, Hämäläinen M, Moore CI. Neural correlates of tactile detection: a combined magnetoencephalography and biophysically based computational modeling study. J Neurosci. 2007;27:10751–10764. doi: 10.1523/JNEUROSCI.0482-07.2007. [DOI] [PMC free article] [PubMed] [Google Scholar]
- Kissler J, Müller MM, Fehr T, Rockstroh B, Elbert T. MEG gamma band activity in schizophrenia patients and healthy subjects in a mental arithmetictask and at rest. Clin Neurophysiol. 2000;111:2079–2087. doi: 10.1016/s1388-2457(00)00425-9. [DOI] [PubMed] [Google Scholar]
- Konopaske GT, Sweet RA, Wu Q, Sampson A, Lewis DA. Regional Specificity of chandelier neuron axon terminal alterations in schizophrenia. Neuroscience. 2006;138:189–196. doi: 10.1016/j.neuroscience.2005.10.070. [DOI] [PubMed] [Google Scholar]
- Kopell N. We got rhythm: dynamical systems of the nervous system. Notices of the AMS. 2000;47:6–16. [Google Scholar]
- Kopell N, Ermntrout GB, Whittington MA, Traub RD. Gamma rhythms and beta rhythms have different synchronization properties. Proc Natl Acad Sci USA. 2000;97:1867–1872. doi: 10.1073/pnas.97.4.1867. [DOI] [PMC free article] [PubMed] [Google Scholar]
- Kwon JS, O'Donnel BF, Wallenstein GV, Greene RW, Hirayasu Y, Nestor PG, Hasselmo ME, Potts GF, Shenton ME, McCarley RW. Gamma frequency-range abnormalities to auditory stimulation in schizophrenia. Arch Gen Psychiatry. 1999;56:1001–1005. doi: 10.1001/archpsyc.56.11.1001. [DOI] [PMC free article] [PubMed] [Google Scholar]
- Lee K, Williams LM, Haig A, Gordon E. “Gamma (40 Hz) phase synchronicity” and symptom dimensions in schizophrenia. Cognit Neuropsychiatry. 2003;8:57–71. doi: 10.1080/713752240. [DOI] [PubMed] [Google Scholar]
- Lewis DA, Cruz DA, Melchitzky DS, Pierri JN. Lamina-specific deficits in parvalbumin immunoreactive varicosities in the prefrontal cortex of subjects with schizophrenia: evidence for fewer projections from the thalamus. Am J Psychiatry. 2001;158:1411–1422. doi: 10.1176/appi.ajp.158.9.1411. [DOI] [PubMed] [Google Scholar]
- Lewis DA, Hashimoto T, Volk DW. Cortical inhibitory interneurons and schizophrenia. Nat Rev Neurosci. 2005;6:312–324. doi: 10.1038/nrn1648. [DOI] [PubMed] [Google Scholar]
- Lewis DA, Lund JS. Heterogeneity of chandelier neurons in monkey neocortex: corticotropin-releasing factor and parvalbumin immunoreactive populations. J Comp Neurol. 1990;293:599–615. doi: 10.1002/cne.902930406. [DOI] [PubMed] [Google Scholar]
- Light GA, Hsu JL, Hsieh MH, Meyer-Gomes K, Sprock J, Swerdlow NR, Braff DL. Gamma band oscillations reveal neural network cortical coherence dysfunction in schizophrenia patients. Biol Psychiatry. 2006;60:1231–1240. doi: 10.1016/j.biopsych.2006.03.055. [DOI] [PubMed] [Google Scholar]
- Lv J, Simpson DM, Bell SL. Objective detection of evoked potentials using a bootstrap technique. Med Eng Phys. 2007;29:191–198. doi: 10.1016/j.medengphy.2006.03.001. [DOI] [PubMed] [Google Scholar]
- McCarley RW, Salisbury DF, Hirayasu Y, Yurgelun-Todd DA, Tohen M, Zarate C, Kikinis R, Jolesz F, Shenton ME. Association between smaller left posterior superior temporal gyrus volume on magnetic resonance imaging and smaller left temporal p300 amplitude in first-episode schizophrenia. Arch Gen Psychiatry. 2002;59:321–331. doi: 10.1001/archpsyc.59.4.321. [DOI] [PubMed] [Google Scholar]
- McGlashan TH, Hoffman RE. Schizophrenia as a disorder of developmentally reduced synaptic connectivity. Arch Gen Psychiatry. 2000;57:637–648. doi: 10.1001/archpsyc.57.7.637. [DOI] [PubMed] [Google Scholar]
- Nagase Y, Okudo Y, Matsuura M, Kojima T, Toru M. EEG coherence inunmedicated schizophrenic patients: topographical study of predominantly never medicated cases. Biol Psychiatry. 1992;32:1028–1034. doi: 10.1016/0006-3223(92)90064-7. [DOI] [PubMed] [Google Scholar]
- Overstreet LS, Westbrook GL. Synapse density regulates independence at unitary inhibitory synapses. J Neurosci. 2003;23:2618–2626. doi: 10.1523/JNEUROSCI.23-07-02618.2003. [DOI] [PMC free article] [PubMed] [Google Scholar]
- Phillips WA, Silverstein SM. Convergence of biological and psychological perspectives on cognitive coordination in schizophrenia. Behav Brain Sci. 2003;26:65–137. doi: 10.1017/s0140525x03000025. [DOI] [PubMed] [Google Scholar]
- Pierri JN, Chaudry AS, Woo TW, Lewis DA. Alterations in chandelier neuron axon terminals in the prefrontal cortex of schizophrenic subjects. Am J Psychiatry. 1999;156:1709–1719. doi: 10.1176/ajp.156.11.1709. [DOI] [PubMed] [Google Scholar]
- Press WH, Flannery BP, Teukolsky SA, Vetterling WT. Numerical Recipes in C: The Art of Scientific Computing. 2nd. Cambridge, UK: Cambridge Univ. Press; 1992. pp. 504–514. [Google Scholar]
- Roelfsema PR, Engel AK, König P, Singer W. Visuomotor integration is associated with zero time-lag synchronization among cortical areas. Nature. 1997;385:157–161. doi: 10.1038/385157a0. [DOI] [PubMed] [Google Scholar]
- Salin PA, Prince DA. Spontaneous GABAA receptor-mediated inhibitory currents in adult rat somatosensory cortex. J Neurophysiol. 1996a;75:1573–1588. doi: 10.1152/jn.1996.75.4.1573. [DOI] [PubMed] [Google Scholar]
- Salin PA, Prince DA. Electrophysiological mapping of GABAA receptor mediated inhibition in adult rat somatosensory cortex. J Neurophysiol. 1996b;75:1589–1600. doi: 10.1152/jn.1996.75.4.1589. [DOI] [PubMed] [Google Scholar]
- Seeman P, Lee T, Chau-Wong M, Wong K. Antipsychotic drug doses and neuroleptic/dopamine receptors. Nature. 1976;261:717–719. doi: 10.1038/261717a0. [DOI] [PubMed] [Google Scholar]
- Shenton ME, Dickey CC, Frumin M, McCarley RW. A review of MRI findings in schizophrenia. Schizophr Res. 2001;49:1–52. doi: 10.1016/s0920-9964(01)00163-3. [DOI] [PMC free article] [PubMed] [Google Scholar]
- Softy WR, Koch C. The highly irregular firing of cortical cells is inconsistent with temporal integration of random EPSPs. J Neurosci. 1993;13:334–350. doi: 10.1523/JNEUROSCI.13-01-00334.1993. [DOI] [PMC free article] [PubMed] [Google Scholar]
- Somogyi PA. Specific axo-axonal interneuron in the visual cortex of the rat. Brain Res. 1977;136:345–350. doi: 10.1016/0006-8993(77)90808-3. [DOI] [PubMed] [Google Scholar]
- Somogyi P, Tamás G, Lujan R, Eberhard HB. Salient features of synaptic organization in the cerebral cortex. Brain Res Rev. 1998;26:113–135. doi: 10.1016/s0165-0173(97)00061-1. [DOI] [PubMed] [Google Scholar]
- Spencer KM, Nestor PG, Niznikiewicz MA, Salisbury DF, Shenton ME, McCarley RW. Abnormal neural synchrony in schizophrenia. J Neurosci. 2003;23:7407–7411. doi: 10.1523/JNEUROSCI.23-19-07407.2003. [DOI] [PMC free article] [PubMed] [Google Scholar]
- Spencer KM, Nestor PG, Perlmutter R, Niznikiewicz MA, Klump MC, Frumin M, Shenton ME, McCarley RW. Neural synchrony indexes disordered perception and cognition in schizophrenia. Proc Natl Acad Sci USA. 2004;101:17288–17293. doi: 10.1073/pnas.0406074101. [DOI] [PMC free article] [PubMed] [Google Scholar]
- Steriade M, Timofeev I, Grenier F. Natural waking and sleep states: a view from inside neocortical neurons. J Neurophysol. 2001;85:1969–1985. doi: 10.1152/jn.2001.85.5.1969. [DOI] [PubMed] [Google Scholar]
- Stevens CF, Zador AM. Input synchrony and the irregular firing of cortical neurons. Nat Neurosci. 1998;1:210–217. doi: 10.1038/659. [DOI] [PubMed] [Google Scholar]
- Straub RE, Lipska BK, Egan MF, Goldberg TE, Callicott JH, Mayhew MB, Vakkalanka RK, Kolachana BS, Kleinman JE, Weinberger DR. Allelic variation in GAD1 (GAD67) is associated with schizophrenia and influences cortical function and gene expression. Mol Psychiatry. 2007;12:854–869. doi: 10.1038/sj.mp.4001988. [DOI] [PubMed] [Google Scholar]
- Strelets VB, Novototsky-Vlasov VY, Golikova JV. Cortical connectivity in high frequency beta-rhythm in schizophrenics with positive and negative symptoms. Int J Psychophysiol. 2002;44:101–115. doi: 10.1016/s0167-8760(01)00196-9. [DOI] [PubMed] [Google Scholar]
- Stufflebeam S, Vierling-Claassen D, Lin FH, Siekmeier P, Hämäläinen M, Kopell N, McCarley R. Altered GABA receptor dynamics explains abnormal rhythmic auditory neuromagetic response in schizophrenia. Proceedings of the 15th International Conference on Biomagnetism; Vancouver, British Columbia, Canada. 2006. [Google Scholar]
- Traub R, Bibbig A. A model of high-frequency ripples in the hippocamput based on synaptic coupling plus axon-axon gap junctions between pyramical neurons. J Neurosci. 2000;20:2086–2093. doi: 10.1523/JNEUROSCI.20-06-02086.2000. [DOI] [PMC free article] [PubMed] [Google Scholar]
- Uhlhaas PJ, Linden DE, Singer W, Haenschel C, Lindner M, Maurer K, Rodriquez E. Dysfunctional long-range coordination of neural activity during gestalt perception in schizophrenia. J Neurosci. 2006;26:8168–8175. doi: 10.1523/JNEUROSCI.2002-06.2006. [DOI] [PMC free article] [PubMed] [Google Scholar]
- Uhlhaas P, Singer W. Neural synchrony in brain disorders: relevance for cognitive dysfunctions and pathophysiology. Neuron. 2006;52:155–168. doi: 10.1016/j.neuron.2006.09.020. [DOI] [PubMed] [Google Scholar]
- Wada Y, Nanbu Y, Jiang ZY, Koshino Y, Hashimoto T. Interhemispheric EEG coherence in never-medicated patients with paranoid schizophrenia: analysis at rest and during photic stimulation. Clin Electroencephalogr. 1998;29:170–176. doi: 10.1177/155005949802900408. [DOI] [PubMed] [Google Scholar]
- Whittington MA, Traub RD, Jefferys JGR. Synchronized oscillations in interneuron networks driven by metabotropic glutamate receptor activation. Nature. 1995;373:612–615. doi: 10.1038/373612a0. [DOI] [PubMed] [Google Scholar]
- Whittington MA, Traub RD, Kopell N, Ermentrout B, Buhl EH. Inhibition-based rhythms: experimental and mathematical observations on network dynamics. Int J Psychophysiol. 2000;38:315–336. doi: 10.1016/s0167-8760(00)00173-2. [DOI] [PubMed] [Google Scholar]
- Woo TU, Whitehead RE, Melchitzky DS, Lewis DA. A subclass of prefrontal GABA axon terminals are selectively altered in schizophrenia. Proc Natl Acad Sci USA. 1998;95:5341–5346. doi: 10.1073/pnas.95.9.5341. [DOI] [PMC free article] [PubMed] [Google Scholar]
- Zhang ZJ, Reynolds GP. A selective decrease in the relative density of parvalbumin-immunoreactive neurons in the hippocampus in schizophrenia. Schizophr Res. 2002;55:1–10. doi: 10.1016/s0920-9964(01)00188-8. [DOI] [PubMed] [Google Scholar]
- Zhou FM, Hablitz JJ. AMPA receptor-mediated EPSCs in rat neocortical layer II/III interneurons have rapid kinetics. Brain Res. 1998;780:166–169. doi: 10.1016/s0006-8993(97)01311-5. [DOI] [PubMed] [Google Scholar]