

Summary
Cells within tissues are surrounded by fibrillar extracellular matrix (ECM) that supports cell adhesion via integrin receptors. The strength of cell interactions with fibrillar matrix and the effects of force on these interactions have not been quantified. To this end, we used a spinning disc device to apply radially increasing shear to human HT1080 fibrosarcoma cells attached to a cell-derived fibrillar fibronectin (FN) matrix. The shear required to detach 50% of HT1080 cells was eight times greater on a FN-coated, rigid glass substrate than on fibrillar FN matrix. Covalent crosslinking of the FN matrix increased its stiffness tenfold and produced a modest increase in shear detachment force for these cells. On FN-coated surfaces, cells detach by releasing interactions between α5β1 integrin and FN. By contrast, cell detachment from fibrillar matrix occurred through a novel mechanism of fibril breakage, which left holes in the matrix visible by fluorescence microscopy. These results show that cells require less force to detach from fibrillar matrix than from FN adsorbed on glass and that detachment occurs through breaking fibrils instead of by release of integrin-matrix bonds. Thus, ECM fibril breakage is another molecular feature to consider when understanding cell and tissue homeostasis.
Keywords: Fibronectin, Adhesion, Fibroblast, Shear, Detachment, Fibrillar matrix
Introduction
The extracellular matrix (ECM), an interconnected fibrous network of proteins and carbohydrates, serves to organize cells into functional units by providing a structural framework to position and anchor cells, as well as present environmental information to control cellular activities. The ubiquitous ECM protein fibronectin (FN) is an essential part of this fibrillar network in most tissues (Hynes, 1990; Mao and Schwarzbauer, 2005a). Cell interactions with FN fibrils occur via integrin cell-surface receptors that promote adhesion, migration and other cell processes (Hynes, 2002).
In vivo tissues are subject to considerable forces that can impact cell-ECM interactions and affect cell activities. Some of these forces are generated by the cells themselves, as in the contractile forces of muscle cells. Others are applied external forces, including tension-relaxation cycles, compression forces from weight or gravity, and shear forces from blood and fluid flow. How tissues withstand these forces depends in a large part on the type and density of the cells, the composition of the ECM and the strength of the interactions between the cells and the ECM. The effects of externally applied shear have been used to determine the cell adhesion strengths for cells attached to ECM protein-coated surfaces (Boettiger, 2007; Garcia et al., 1997; Griffin et al., 2004; LaMack and Friedman, 2007; Orr et al., 2006; Shi and Boettiger, 2003). One approach to measure cell detachment under shear uses a position-dependent shear assay that exposes cells to a range of forces using a spinning disc device (Boettiger, 2007). From these measurements, the strength of adhesion – the amount of shear stress required to detach 50% of the adherent cells – has been shown to be directly proportional to the number of α5β1 integrin to FN bonds (Shi and Boettiger, 2003). In contrast to cells attached to FN-coated planar surfaces, cells within tissues interact with more complex, three-dimensional fibrillar matrices. The presence of other ECM components, the opportunity for interactions between ECM proteins, as well as integrin-mediated and non-integrin interactions between cells and ECM all might affect the adhesion strength and the mechanisms of cell detachment. As a result, measurements obtained with protein-coated surfaces might not fully reflect the effects of external shear on cell-ECM interactions.
To address this question, the adhesion strength of cells attached to a fibrillar matrix was measured using externally applied shear. The fibrillar matrix used here is a cell-derived three-dimensional network composed primarily of FN fibrils and has been shown to support cell adhesion, migration and signaling (Cukierman et al., 2001; Mao and Schwarzbauer, 2005b; Mao and Schwarzbauer, 2006; Smith et al., 2007). It is clear that cell detachment from FN-coated surfaces requires relatively high shear and is mediated by breaking integrin-FN bonds (Garcia et al., 1998). As we report here, however, presenting ECM in a fibrillar state dramatically reduced the shear stress required to detach cells, suggesting that detachment occurs by a different mechanism. Indeed, our results support a model of cell detachment from fibrillar FN matrix via a novel mechanism of fibril breakage whereby FN interactions within the matrix fail, releasing cells and matrix.
Results
Cell adhesion strength on fibrillar fibronectin matrix
The strength of adhesion of HT1080 fibrosarcoma cells on a FN-coated planar coverslip versus a three-dimensional fibrillar FN matrix was measured using a spinning disc device. A constant angular velocity, ω, was applied to calcein-green-labeled HT1080 cells attached to these substrates. The resulting fluid flow across the sample creates a shear profile that scales with a cell's distance from the center (r in Eqn 1). After spinning, the highest number of cells remained attached at the center, where shear approaches zero, τ0 (r=0 in Eqn 1) (Fig. 1A,Bi). Cell numbers were quantified at specific positions emanating radially outward to the edge, where few cells were attached on either substrate after spinning (Fig. 1Biii), normalized to the cell number at τ0, and plotted as a function of shear. The adhesion strength, which is defined as the point where 50% of the cell population remains attached (τ50) and is dependent on the number of integrin-FN bonds, was determined from these plots (Garcia et al., 1998; Shi and Boettiger, 2003). For cells on FN-coated surfaces, τ50 was 730±30 dynes/cm2. By contrast, τ50 for cells attached to fibrillar FN matrix was significantly lower at 52±7 dynes/cm2.
Fig. 1.

Cell detachment under shear. (A) HT1080 cells were allowed to attach to a FN-coated glass coverslip (circles) or to fibrillar FN matrix on a coverslip (squares) for 1 hour before applying shear with the spinning disc device. After spinning, attached cells were counted at various distances from the center, and the fraction of cells attached was normalized to the number at the center of the sample where shear approaches zero. Attached fraction was plotted versus the shear and fit by a sigmoidal curve. The shear needed to detach 50% of the cells was determined from this plot. (B) Low-magnification fluorescence images were captured after spinning. i, ii and iii show cells attached at low, moderate and maximal shear, respectively, for both FN-coated glass and fibrillar FN matrix, as indicated in A.
Since cell adhesion is a dynamic process, a time course was performed to elucidate whether adhesion strength develops over time on the fibrillar FN matrix. As shown in Fig. 2A, adhesion strength (τ50) for cells on both FN-coated surfaces and fibrillar FN matrix increased with time. However, maximal values for cells on FN-coated surfaces plateaued at values eight times greater than those on FN matrix (750±35 versus 90±20 dynes/cm2), confirming that adhesion strength on FN matrix is less than on FN-coated substrates. These time-course data were fit to a exponential function, y=A(1–e–bt), where A represents the saturation value and b is the time constant that indicates how quickly adhesion strength develops. For FN-coated surfaces, the time constant is 0.045 min–1 and is similar to previous reports (Shi and Boettiger, 2003). By contrast, the time constant for fibrillar FN matrix was only 0.012 min–1, indicating that the rate of increase in adhesive bonds developed more slowly on the FN matrix than on FN-coated surfaces. We also compared the relative amounts of accessible cell binding sites on FN-coated surfaces and FN matrices by ELISA using monoclonal antibody HFN7.1, which binds near the RGD sequence in FN. Somewhat more HFN7.1 binding was detected on the FN-coated substrate, which showed an ELISA signal that was twice as strong as that observed with the three-dimensional matrix, similarly to our previous report (Mao and Schwarzbauer, 2005b) (and data not shown). These results show that ligand densities are not sufficiently different between coated surfaces and matrix to explain the eightfold difference in adhesion strength.
Fig. 2.
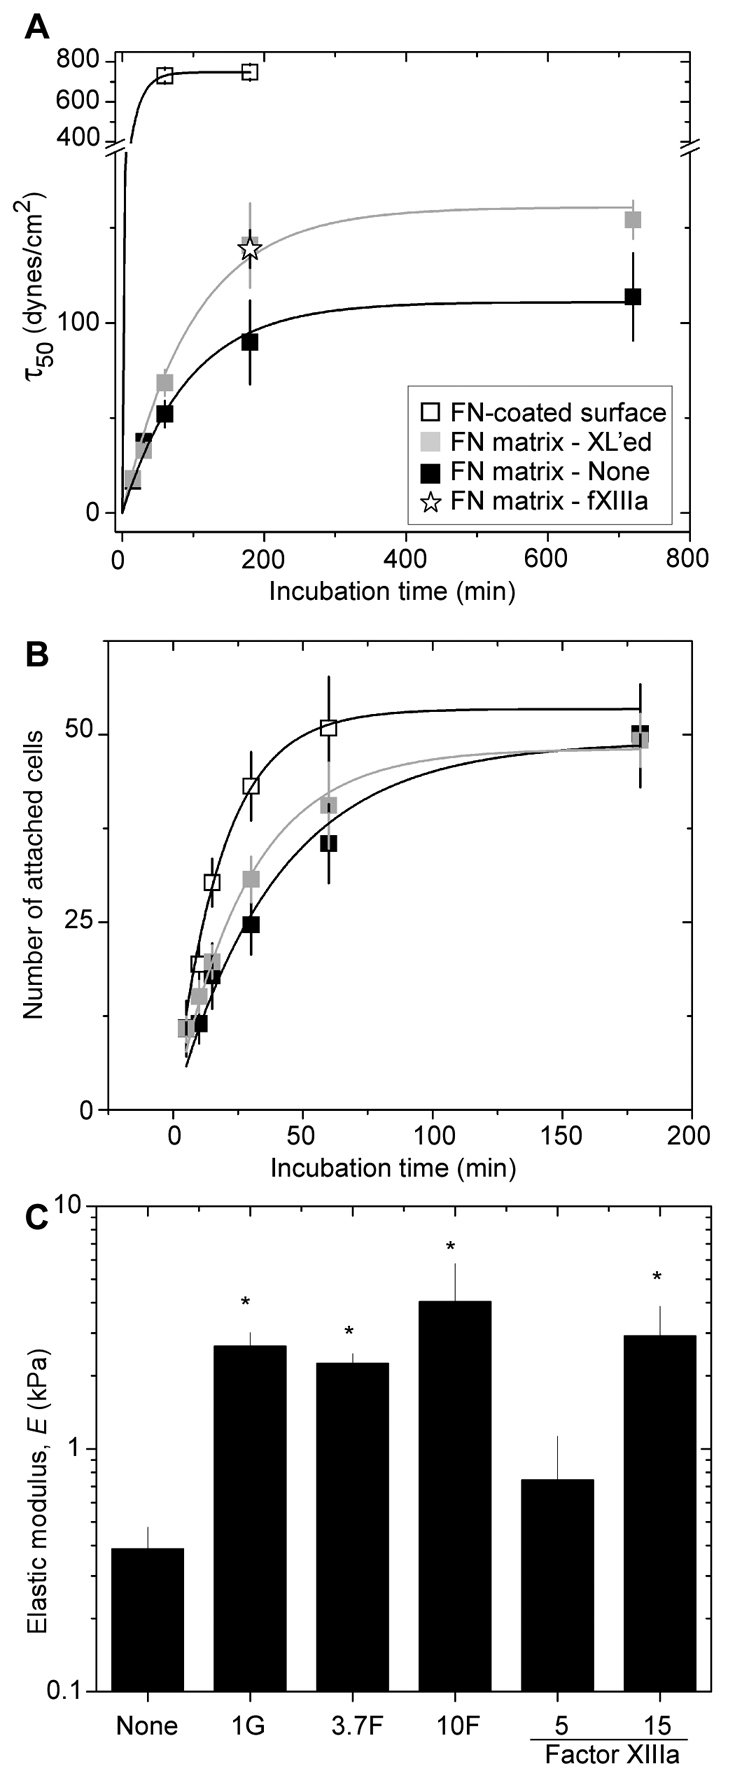
Effects of adhesion time and matrix stiffness on adhesion strength. (A) Cells were allowed to adhere to substrates for increasing times before spinning. Adhesion strengths (τ50) determined from data as in Fig. 1 were plotted as a function of cell adhesion time. Substrates included FN-coated glass (open squares), fibrillar FN matrix (gray squares) and fibrillar FN matrix crosslinked (XL'ed) with 10% formaldehyde (10F, black squares) or with factor XIIIa transglutaminase (fXIIIa, star). (B) A cell attachment assay was used to measure the number of cells bound per image (∼3×105 μm2) over time on substrates as indicated in A. Exponential fits in both panels were used to measure adhesion strength or attachment time constants. (C) Atomic force microscopy was used to determine the stiffness of untreated fibrillar FN matrix (none) and those treated with 1% glutaraldehyde (1G), 3.7% or 10% formaldehyde (3.7F or 10F, respectively), or coagulation Factor XIIIa at 5 or 15 μg/ml. *P<0.0001 compared with untreated control. Error bars for all plots represent the mean ± s.d. of triplicate measurements.
To understand whether adhesion strength was influenced by the amount of cell adhesion to FN substrates, a cell-attachment time course was performed. HT1080 cells bound to the FN-coated surface at a faster rate than to fibrillar FN matrix (Fig. 2B) with time constants of 0.054 and 0.025 min–1, respectively. However, the number of cells attached to the substrates was equivalent at 3 hours. Moreover, little difference was detected in the number or size distribution of adhesion complexes formed on various substrates or after exposure to shear (supplementary material Fig. S1). Thus, variations in cell attachment or focal adhesions do not account for the eightfold adhesion strength differential.
The FN matrix used here is a heterogeneous fibrillar network that contrasts with the homogeneous coating of FN adsorbed onto glass coverslips. The fibrillar matrix is approximately 10-12 μm thick (Mao and Schwarzbauer, 2005b), with each fibril containing multiple FN dimers organized in staggered arrays. In addition, there are significant differences in stiffness between the fibrillar FN matrix and FN on a rigid surface, which could affect how the matrix responds to forces and thus influence adhesion strength. To increase matrix stiffness, matrices were treated with organic fixatives for 15 minutes, and stiffness was measured by atomic force microscopy (AFM). Untreated matrix was soft, 0.4 kiloPascal (kPa), whereas those treated with 1% glutaraldehyde, 3.7% formaldehyde or 10% formaldehyde were stiffened to 2.4, 2.0 and 4.5 kPa, respectively (Fig. 2C). When plated on 4.5 kPa fibrillar matrix, which was produced by treatment with 10% formaldehyde, HT1080 cell adhesion strength plateaued at a level 38% higher than that of cells on untreated 0.4 kPa fibrillar FN matrix (Fig. 2A). However, the rate of increase in adhesion strength was similar between the 0.4 and 4.5 kPa matrices (0.012 versus 0.010 min–1, respectively). This was also the case for cell attachment, where the time constants were 0.025 and 0.033 min–1 for 0.4 and 4.5 kPa matrices, respectively (Fig. 2B). Furthermore, no differences in focal adhesions (supplementary material Fig. S1) or in accessible cell-binding sites determined by ELISA (data not shown) were detected between uncrosslinked and crosslinked matrix. Similar rates for initial attachment and for the increases in adhesive bonds between crosslinked and uncrosslinked matrices suggest that stiffness itself does not alter either the rate, or probably the extent, of bond formation. Without any dramatic differences in ligand density, focal adhesions or cell attachment, we conclude that the mechanism of detachment probably accounts for the change in cell adhesion strength between FN-coated and fibrillar substrates.
In vivo, FN matrix is stabilized by enzymatic crosslinking via transglutaminases (Mosher et al., 1992). We found that treatment of fibrillar matrix by coagulation factor XIII transglutaminase increased stiffness in a dose-dependent manner up to 2.9 kPa (Fig. 2C). Accordingly, adhesion strength for factor-XIII-treated matrix mirrored that of 10% formaldehyde treatment with a similar τ50 value at 3 hours of attachment (Fig. 2A), similar numbers of attached cells (not shown) and a similar time constant for attachment (0.035 min–1). Thus, equivalent results are obtained with enzymatic and chemical crosslinking.
Cells detach from FN matrix by fibril breakage
Cell detachment from FN-coated surfaces occurs by breaking integrin-FN bonds (Garcia et al., 1998; Shi and Boettiger, 2003). However, the large decrease in adhesion strength of cells plated on fibrillar FN matrix compared with a FN-coated surface suggests that cells use distinct mechanisms to detach from these two substrates. To examine the state of the matrix following shear-stress-induced cell detachment, immunofluorescence staining of FN fibrils was performed. Owing to the fibrillar nature of the matrix, a significant number of pores were visible, whether subjected to shear or not, and regardless of stiffness (Fig. 3Bi,ii). These pores ranged in size from ∼100 μm2 to 300 μm2 and are generally smaller than unspread HT1080 cells (Fig. 4). After shear at 100 dynes/cm2, larger features between 500 and 1000 μm2, termed holes, were observed in the fibrillar matrix, and the number of holes increased with shear (Fig. 3A, arrows). Pores and holes can be distinguished by image thresholding (Fig. 3Bii,iv,vi). From these binary images, hole sizes in unspun matrix with HT1080 cells, as well as in matrices exposed to 0 or 250 dynes/cm2 in the presence of cells and matrices exposed to 250 dynes/cm2 without cells, were quantified and plotted in histograms (Fig. 4). Little change in the total number of pores was observed before and after shear. By contrast, the frequency of holes in the 0.4 kPa matrix was significantly higher at 250 dynes/cm2 (28.6%) than for unspun (8.5%) or 0 dynes/cm2 (5.7%) (Fig. 4A). Crosslinking of the matrix reduced the frequency of holes to 10.5% for a 4.5 kPa matrix spun at 250 dynes/cm2 (Fig. 4B). To estimate the percentage of cells that created holes, the total number of holes at 250 dynes/cm2 was divided by the number of cells that originally occupied that space as estimated from the total cell number at the sample center where τ is minimal. At 250 dynes/cm2, 40-50% of all cells on 0.4 kPa matrix produced holes compared with less than 10% on 4.5 kPa matrix. These data show that cell detachment from fibrillar matrix under high shear results in loss of matrix fibrils, and the extent of this loss was reduced by matrix crosslinking.
Fig. 3.

Fluorescence imaging of fibrillar matrices after shear. After spinning, FN fibrils were visualized by staining with anti-FN antibodies and rhodamine-labeled secondary antibodies (red). Attached HT1080 cells are labeled with calcein green. (A) Samples from three areas of the coverslip corresponding to 0, 100 and 250 dynes/cm2 are shown. White arrows indicate putative holes in the matrix. (B) Enlarged fluorescence images at known radial positions (i, iii and v) and corresponding thresholded representations (ii, iv and vi) where bright fluorescence from the matrix is shown in white and dark areas are black. Filled arrowheads denote pores in the matrix found throughout all samples while open arrowheads indicate larger features called holes in the matrix. Note the increased number of open arrowheads as a function of shear stress.
Fig. 4.

Quantitative comparison of hole formation. Features of various sizes identified in thresholded images (as in Fig. 3B) were counted and averaged from triplicate samples, then plotted as histograms. Matrix spun without cells (black line), matrix before spinning with cells (light gray region), matrix after spinning but at an area of minimal shear (gray region) and matrix after high shear spinning (dark gray region) are shown for (A) 0.4 and (B) 4.5 kPa (10% formaldehyde) fibrillar FN matrix. Pores are ∼100-300 μm2 and holes are 500-1000 μm2.
To eliminate the possibility that formation of holes is due to a redistribution of fibrils, confocal images were examined. No major changes in FN fibril architecture as a function of shear were visible (Fig. 5A). To further confirm this, line plots were generated from the summed confocal image to display fibril fluorescent intensities. Using previous thresholding limits (Fig. 3Bii,iv,vi), regions three times brighter than a pore or hole were colored for visualization (Fig. 5B). Average fibril intensity in a confocal section was approximately 62 a.u. By counting the number of intensity peaks and the estimated number of fibrils in each peak (Fig. 5B), a total fibril number was obtained and then divided by the line-plot's length and matrix depth to yield a fibril density of 0.08±0.04/μm2 at 0 dynes/cm2 and 0.07±0.03/μm2 for 250 dynes/cm2. Thus it appears that the application of shear did not affect the density of fibrils.
Fig. 5.

Fibril distribution after shear. (A) Summed confocal images of matrix stained with anti-FN antibodies taken in areas of shear corresponding to 0 and 250 dynes/cm2. Note the hole (outlined in red) in the matrix spun at 250 dynes/cm2. (B) Fluorescence intensities under the lines in panel A are plotted versus distance along the line, with red regions indicating areas threefold brighter than the average hole intensity. Assuming that fibril fluorescence intensity is additive, the average peak intensity of single fibrils, 62±15 a.u., was used to establish the scale to the right of the lower plot. Using this scale and the indicated peaks (open arrowheads), we calculated that lines from matrices exposed to 0 and 250 dynes/cm2 shear stress contained 65 and 49 fibrils, respectively. The cross-sectional area under the line was calculated by multiplying 10 μm matrix thickness by the distance along the line (x-axis in panel B, excluding the hole area for the 250 dynes/cm2 line). Fibril density was then calculated by dividing the total number of fibrils by the cross-sectional area, which gave similar fibril densities: 0.08±0.04/μm2 and 0.07±0.03/μm2 for 0 and 250 dynes/cm2, respectively.
Fibril breakage depends on binding of α5β1 integrin
HT1080 cells express two integrin receptors for FN: α5β1 integrin and αvβ3 integrin. Attachment to FN-coated substrates has previously been shown to depend on α5β1 integrin (Shi and Boettiger, 2003). However, in some circumstances, cells can use αvβ3 integrin for binding to fibrillar FN matrix (Mao and Schwarzbauer, 2006). To determine which integrins were primarily responsible for attachment to fibrillar matrix, the effects of integrin function-blocking antibodies on adhesion were tested. Addition of the anti-αvβ3-integrin antibody LM609 did not alter attachment of HT1080 cells to fibrillar matrix, regardless of crosslinking (Fig. 6A). However, treatment with the anti-α5β1-integrin antibody BIIG2, alone or in combination with LM609, induced a marked decrease in cell attachment, indicating that α5β1 integrin is the major receptor for attachment to fibrillar FN matrix.
Fig. 6.
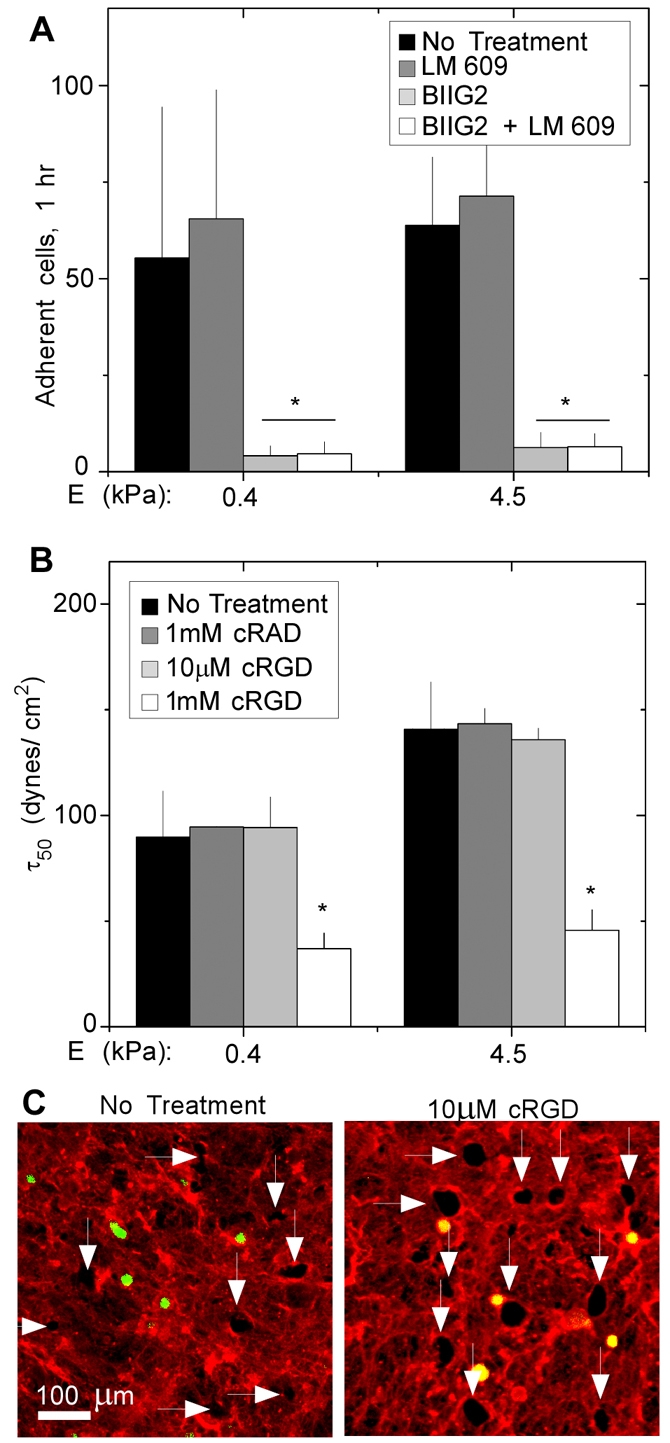
Adhesion strength depends on α5β1 integrin. (A) HT1080 cells were untreated or pretreated with function-blocking antibodies LM609 and BIIG2 against αvβ3 and α5β1 integrins, respectively, then allowed to attach to fibrillar matrix for 3 hours. The number of attached cells per image (∼3×105 μm2) after washing was measured. Blocking α5β1 integrin via BIIG2 or a combination of both antibodies resulted in reduced cell binding. Error bars represent the s.d. of triplicate experiments. *P<0.005. (B) Cells were plated on 0.4 or 4.5 kPa matrix in the absence or presence of the indicated concentrations of cyclic RGD or RAD peptides. Adhesion strength, τ50, was determined after 3 hours of adhesion. Error bars represent the s.d. of triplicate experiments. *P<0.01. (C) Cells were plated on 0.4 kPa fibrillar matrix in the presence and absence of 10 μM cRGD. Immunofluorescence staining with anti-FN antiserum was performed after spinning. White arrows identify holes in matrix at 250 dynes/cm2.
To further test whether αvβ3 contributes to adhesion strength, cells were plated on fibrillar FN matrix in the presence of 10 μM cyclic RGD peptide, a concentration that blocks αvβ3 but not α5β1 binding to FN (Corbett and Schwarzbauer, 1999). Regardless of stiffness, treatment with 10 μM cyclic RGD did not affect τ50 compared with untreated cells and cells treated with inactive cyclic RAD peptide (Fig. 6B). Similar extents of fibril breakage were observed after spinning in the presence and absence of 10 μM cyclic RGD (Fig. 6C). Treatment with 1 mM cyclic RGD, which blocks α5β1 binding, dramatically reduced cell adhesion to the fibrillar FN matrix (not shown), produced three to five times lower τ50 values on 0.4 and 4.5 kPa matrices (Fig. 6B) and inhibited hole formation in the matrix (not shown). Therefore, α5β1 integrin appears primarily responsible for development of adhesion strength on fibrillar FN matrix.
Discussion
Fibrillar FN matrix shows a dramatic difference in its ability to withstand shear compared with FN-coated surfaces. Significantly lower shear stress was required to remove HT1080 cells from fibrillar FN matrix than from FN adsorbed onto a rigid surface. Cell detachment occurred via breakage of matrix fibrils rather than by release of α5β1-integrin-FN bonds, as occurs on FN-coated substrates. Covalent crosslinking of FN fibrils increased matrix stiffness and reduced matrix hole formation but did not significantly alter adhesion strength rates. Based on these results, we propose a novel mechanism of cell detachment in which shear stress applied to matrix-bound cells disrupts protein interactions within ECM fibrils, thus releasing cells through fibril breakage.
To allow cell detachment from FN-coated surfaces, a shear in excess of 700 dynes/cm2 is required, a finding that has been linked to release of α5β1-integrin-FN bonds (Shi and Boettiger, 2003). We observed that significantly lower shear was needed to detach cells from fibrillar FN matrix, where τ50 even after 3 hours was only 90 dynes/cm2. The reduced detachment force could not be explained by cell area, attachment, focal adhesion formation or ligand density. Therefore, this difference suggests that cell detachment from these two substrates occurs by distinct mechanisms. The appearance of holes in the fibrillar matrix with increasing shear force indicates that when cells detach, they take FN fibrils with them. This must occur by disruption of FN-FN interactions within fibrils adjacent to the cell surface rather than release of integrin-FN bonds.
In order for fibril breakage to release cells, FN interactions within the matrix must be less resistant to shear stress than the integrin-FN bonds; therefore, integrins do not release from the matrix but instead the fibrils fracture in the vicinity of the cell, creating a hole. To relate the adhesion strength of a given population to the force needed for detachment from the matrix (F50), we performed a simple mathematical analysis of detachment forces and FN bond strength using a mechanical model for cell detachment (Truskey and Proulx, 1993). This model treats cells as hemispherical caps attached to a surface, an assumption that appears to fit with how the cells adhere to the fibrillar matrix. Others have proposed a sequential detachment model for release of cells under shear (Gallant et al., 2005). Using this model, we calculate a somewhat higher detachment force for cells on FN-coated substrate; however, cells were not as well spread in this model as we observed on our substrates, or as described by a hemispherical cap. Moreover, integrin reinforcement under force (Choquet et al., 1997) suggests that, under shear, bonds at the front of the cell would be strengthened and could resist peeling. Regardless of the mechanism, the detachment forces calculated here are useful for the comparison of different substrates and to approximate fibril forces.
Using Eqn 2, we calculated a detachment force of 606 nN for HT1080 cells on FN-coated coverslips. By contrast, the calculated detachment force for cells attached to fibrillar FN matrix was 74 nN, eight times lower than on FN-coated substrates. A slightly higher average detachment force of 113 nN was observed for cells on crosslinked fibrillar FN matrix. To determine how many fibrils are affected by these detachment forces, we estimated the number of fibrils within the volume of a hole, NFibril, by multiplying the surface area of the side of a hole (∼1130 μm2 based on average hole area in Fig. 4A) by the fibril density per cross-sectional area counted in confocal sections (∼0.08 fibrils/μm2) (Fig. 5). Thus an approximate number of fibrils broken during the formation of a hole is NFibril=90. The force per fibril then becomes FFibril=FDetachment/NFibril, assuming that all the fibrils act in parallel, and equals 0.82 nN.
We next calculated the number of integrin bonds that would be needed to resist detachment from a FN-coated surface using the detachment force of 606 nN. The force required to break an α5β1 integrin-FN bond is about 40 pN (Sun et al., 2005); thus a cell would need to engage ∼1.5×10⁴ integrins on a FN-coated surface in order to resist 606 nN. However, ∼21 integrins bound to an individual fibril would be needed to resist the 0.82 nN required to break that fibril. The number of α5β1 integrins on a fibroblast surface has been estimated at 2×10⁵ (D.B., unpublished observations) with approximately 900 integrins clustered in 1 μm2 adhesion complexes (Wiseman et al., 2004). Therefore, it is likely that many more than 21 integrins are bound to each fibril, and fibrils with more than 21 integrins bound would break under forces that the integrin-FN bonds can withstand.
Covalent crosslinking of FN fibrils increased matrix stiffness and increased the force needed to detach cells. Hole formation in crosslinked matrix was much less pronounced. The low τ50 values for cells on the crosslinked matrices relative to FN-coated glass are indicative of a detachment mechanism that is similar to uncrosslinked fibrillar matrix. The increased covalent interactions within the matrix might secure the fibrillar network to the point that the load is distributed to a greater number of fibrils over a larger area. As a result, large-scale failure, including hole formation, is minimized, and cells are able withstand slightly higher shear stress before detachment. Since fibrils are not likely to be completely or uniformly crosslinked by our treatments, crosslinking would not prevent individual fibrils from breaking. However, the fibrils that break appear to be well spaced and not concentrated in the vicinity of the cells, so their removal is not readily apparent by immunofluorescence imaging. Measurements showing equivalent detachment forces for cells bound to soft versus stiff FN-coated polyacrylamide gels (Paszek et al., 2005) further support the idea that the fibrillar nature rather than the stiffness of the substrate is a crucial part of this detachment mechanism.
In summary, our data show that cell adhesion strength is dramatically different for cells cultured on protein-coated surfaces relative to fibrillar matrix. This difference manifests through a distinct detachment mechanism: breakage of matrix fibrils, which creates holes in the matrix. These results support a novel model for the effects of shear stress on tissues, which includes disruption of the protein interactions within ECM fibrils.
Materials and Methods
Cell culture and reagents
NIH 3T3 fibroblasts and HT1080 human fibrosarcoma cells were cultured in Dulbecco's minimum essential medium (DMEM) and supplemented by 10% bovine calf or fetal bovine serum, respectively, and 1% antimycotic/antibiotic solution. HT1080 cells were serum-starved for 24 hours and then incubated with Cell Trace Calcein Green (Invitrogen) for 15 minutes for visualization by fluorescence microscopy. Cells were removed from the culture dish with 0.1 mM EDTA in PBS, and plated on 25 mm diameter coverslips at 105 cells per coverslip in adhesion buffer: PBS supplemented with 2 mM glucose. In some experiments, pre-treatment for 30 minutes with integrin function blocking antibodies LM609 (Sigma) and BIIG2 (gift from Caroline Damsky, University of California, San Francisco, CA) or cyclic RGD and cyclic RAD peptides (Peptide Institute, Louisville, KY) was performed at indicated concentrations.
Fibrillar fibronectin matrix and substrate preparation
NIH 3T3 fibroblasts were cultured on potassium hydroxide-cleaned 25mm glass coverslips (Bellco, Vineland, NJ) in six-well plates until highly confluent. Fibrillar FN matrix was prepared from these cultures as previously described (Mao and Schwarzbauer, 2005b). Long-term storage in PBS at 4°C for several weeks did not influence the experimental results. Organization of the cell-free fibrillar FN matrix was confirmed by immunofluorescence staining with anti-FN antibodies. For fibrillar FN matrix crosslinking, samples were exposed to solutions of 1% glutaraldehyde or to 3.7% or 10% formaldehyde in PBS for 15 minutes at room temperature followed by extensive rinsing. Matrix crosslinking was also achieved through addition of coagulation factor XIII (Calbiochem, La Jolla, CA) diluted in 150 mM NaCl, 10 mM Tris, pH 7.4, for 30 minutes at 37°C.
For surface coatings of FN, ethanol-cleaned 25 mm glass coverslips in six-well plates were incubated with 1 mL of 10 μg FN/ml in PBS for 30 minutes at room temperature. Coverslips were washed and incubated in 1 mg/ml bovine serum albumin (BSA) in PBS for 30 minutes to block non-specific binding and stored in PBS until cell seeding.
Atomic force microscopy (AFM)
AFM was used to measure the elastic modulus at the nano-scale of various matrices. Samples were placed on an Asylum 1-D AFM (Asylum Research, Santa Barbara, CA) and probed with a pyramid-tipped cantilever (Veeco, Santa Barbara, CA) having a nominal spring constant of ∼60 pN/nm as determined from thermal calibration. Samples were indented by the probe to yield force-indentation curves from which the elastic modulus, E, was obtained using a Hertz cone model (Domke and Radmacher, 1998; Rotsch et al., 1999; Rotsch and Radmacher, 2000), fit up to 2 μm indentation. Samples were randomly indented hundreds of times over their surface to ensure values reflect the average elastic modulus of the entire sample.
Shear stress and attachment assays
Cells were allowed to adhere for a specified time (3 hours unless otherwise indicated) before being subjected to shear for 5 minutes at room temperature. Cells do not assemble an endogenous FN matrix in the 3 hour time period used in these experiments (Mao and Schwarzbauer, 2005b). Shear stress, τ, was applied by a spinning disc device (Boettiger, 2007) that subjects cells to a radially-dependent stress caused by radial fluid motion over the surface of the disc such that:
 |
(1) |
where r is the radial position from the center of the disk, ρ is the buffer density, μ is the buffer viscosity and ω is the rotational speed. After spinning, samples were fixed with 3.7% formaldehyde in PBS and mounted on slides for microscopy. Cell Trace Calcein Green-stained cells were counted at known radial positions using a Nikon diaphot microscope with a programmable stage. Data were normalized to the cell number at the center of the disc where τ is minimal. A sigmoidal curve fit to the data determined the the adhesion strength, τ50, the shear stress required to detach 50% of the attached cells. The detachment forces required to remove cells from the matrix can also be calculated using a hemispherical cap adhesion model (Truskey and Proulx, 1993). Solving the system of equations shows that the detachment force can be approximated as:
 |
(2) |
where
 |
(3) |
 |
(4) |
and where rcell and hcell are the projected cell radius and height, respectively, determined by assuming constant volume between the suspended and spreading cells (over the short experimental time course examined here). Using the adhesion strength, τ50, for τ, the detachment force is represented as F50 or the force required to detach 50% of the cells.
To determine initial cell attachment to each substrate, cells were allowed to attach to a given substrate for a defined time period in PBS supplemented with 2 mM glucose. Samples were washed gently three times with PBS prior to fixation in 3.7% formaldehyde. Images were captured on a Nikon Eclipse TE2000-U microscope using IP Lab and ImageJ software (NIH) to count adherent cells.
FN immunofluorescence and confocal microscopy
After spinning, samples were fixed with 3.7% formaldehyde in PBS and stained with R457 rabbit anti-FN polyclonal antiserum followed by rhodamine-conjugated goat anti-rabbit IgG using established protocols (Mao and Schwarzbauer, 2005b). Images were captured using either a Nikon Optiphot or a CARV spinning disk confocal unit (Becton Dickinson, Franklin Lakes, NJ) attached to a Nikon Eclipse TE2000-U microscope with IP Lab software. Image J software (NIH) was used to determine fluorescence intensities for analysis of FN matrix and holes after spinning. To distinguish holes from matrix, a fluorescence intensity threshold was established by measuring the average intensity across squares placed within holes in images from areas spun at 250 dynes/cm2. At least ten holes were measured in each of four images and gave an average intensity of 12 a.u. An arbitrary threshold threefold higher than the hole intensity, i.e. 36 a.u., was defined as the minimum intensity for a matrix fibril and was used to generate the black and white representations in Fig. 3. To calculate the average intensity of a single FN fibril, individual 2 μm confocal sections were analyzed. A line plot drawn across an individual section was used to identify fluorescence intensity peaks, and each peak was assumed to represent a single fibril. Using four representative images, this approach gave an average fibril intensity of 62±15 a.u. Assuming that the fluorescent intensity is additive, this value was used to determine fibril number along the line plot is indicated in Fig. 5B. The total number of fibrils along the line plot was counted using data as in Fig. 5B, divided by the area under the line (i.e. length of the line plot multiplied by the thickness of the matrix, 10 μm) to yield the density per unit cross-sectional area.
Supplementary Material
Supplementary material available online at http://jcs.biologists.org/cgi/content/full/122/10/1647/DC1
The authors would like to thank Caroline Damsky for the BIIG2 antibody. A.J.E. is supported by a NIH Postdoctoral Traineeship (T32 CA009528). This research was funded by NIH R01 GM057388 and CA044627 (to D.B. and J.E.S., respectively). Deposited in PMC for release after 12 months.
References
- Boettiger, D. (2007). Quantitative measurements of integrin-mediated adhesion to extracellular matrix. Methods Enzymol. 426, 1-25. [DOI] [PubMed] [Google Scholar]
- Choquet, D., Felsenfeld, D. P. and Sheetz, M. P. (1997). Extracellular matrix rigidity causes strengthening of integrin-cytoskeleton linkages. Cell 88, 39-48. [DOI] [PubMed] [Google Scholar]
- Corbett, S. A. and Schwarzbauer, J. E. (1999). Beta3 integrin activation improves alphavbeta3-mediated retraction of fibrin matrices. J. Surg. Res. 83, 27-31. [DOI] [PubMed] [Google Scholar]
- Cukierman, E., Pankov, R., Stevens, D. R. and Yamada, K. M. (2001). Taking cell-matrix adhesions to the third dimension. Science 294, 1708-1712. [DOI] [PubMed] [Google Scholar]
- Domke, J. and Radmacher, M. (1998). Measuring the elastic properties of thin polymer films with the atomic force microscope. Langmuir 14, 3320-3325. [Google Scholar]
- Gallant, N. D., Michael, K. E. and Garcia, A. J. (2005). Cell adhesion strengthening: contributions of adhesive area, integrin binding, and focal adhesion assembly. Mol. Biol. Cell 16, 4329-4340. [DOI] [PMC free article] [PubMed] [Google Scholar]
- Garcia, A. J., Ducheyne, P. and Boettiger, D. (1997). Quantification of cell adhesion using a spinning disc device and application to surface-reactive materials. Biomaterials 18, 1091-1098. [DOI] [PubMed] [Google Scholar]
- Garcia, A. J., Huber, F. and Boettiger, D. (1998). Force required to break alpha5beta1 integrin-fibronectin bonds in intact adherent cells is sensitive to integrin activation state. J. Biol. Chem. 273, 10988-10993. [DOI] [PubMed] [Google Scholar]
- Griffin, M. A., Engler, A. J., Barber, T. A., Healy, K. E., Sweeney, H. L. and Discher, D. E. (2004). Patterning, prestress, and peeling dynamics of myocytes. Biophys. J. 86, 1209-1222. [DOI] [PMC free article] [PubMed] [Google Scholar]
- Hynes, R. O. (1990). Fibronectins. New York: Springer-Verlag.
- Hynes, R. O. (2002). Integrins: bidirectional, allosteric signaling machines. Cell 110, 673-687. [DOI] [PubMed] [Google Scholar]
- LaMack, J. A. and Friedman, M. H. (2007). Individual and combined effects of shear stress magnitude and spatial gradient on endothelial cell gene expression. Am. J. Physiol. Heart Circ. Physiol. 293, H2853-H2859. [DOI] [PubMed] [Google Scholar]
- Mao, Y. and Schwarzbauer, J. E. (2005a). Fibronectin fibrillogenesis, a cell-mediated matrix assembly process. Matrix Biol. 24, 389-399. [DOI] [PubMed] [Google Scholar]
- Mao, Y. and Schwarzbauer, J. E. (2005b). Stimulatory effects of a three-dimensional microenvironment on cell-mediated fibronectin fibrillogenesis. J. Cell Sci. 118, 4427-4436. [DOI] [PubMed] [Google Scholar]
- Mao, Y. and Schwarzbauer, J. E. (2006). Accessibility to the fibronectin synergy site in a 3D matrix regulates engagement of alpha5beta1 versus alphavbeta3 integrin receptors. Cell Commun. Adhes. 13, 267-277. [DOI] [PubMed] [Google Scholar]
- Mosher, D. F., Sottile, J., Wu, C. and McDonald, J. A. (1992). Assembly of extracellular matrix. Curr. Opin. Cell Biol. 4, 810-818. [DOI] [PubMed] [Google Scholar]
- Orr, A. W., Ginsberg, M. H., Shattil, S. J., Deckmyn, H. and Schwartz, M. A. (2006). Matrix-specific suppression of integrin activation in shear stress signaling. Mol. Biol. Cell 17, 4686-4697. [DOI] [PMC free article] [PubMed] [Google Scholar]
- Paszek, M. J., Zahir, N., Johnson, K. R., Lakins, J. N., Rozenberg, G. I., Gefen, A., Reinhart-King, C. A., Margulies, S. S., Dembo, M., Boettiger, D. et al. (2005). Tensional homeostasis and the malignant phenotype. Cancer Cell 8, 241-254. [DOI] [PubMed] [Google Scholar]
- Rotsch, C. and Radmacher, M. (2000). Drug-induced changes of cytoskeletal structure and mechanics in fibroblasts: an atomic force microscopy study. Biophys. J. 78, 520-535. [DOI] [PMC free article] [PubMed] [Google Scholar]
- Rotsch, C., Jacobson, K. and Radmacher, M. (1999). Dimensional and mechanical dynamics of active and stable edges in motile fibroblasts investigated by using atomic force microscopy. Proc. Natl. Acad. Sci. USA 96, 921-926. [DOI] [PMC free article] [PubMed] [Google Scholar]
- Shi, Q. and Boettiger, D. (2003). A novel mode for integrin-mediated signaling: tethering is required for phosphorylation of FAK Y397. Mol. Biol. Cell 14, 4306-4315. [DOI] [PMC free article] [PubMed] [Google Scholar]
- Smith, M. L., Gourdon, D., Little, W. C., Kubow, K. E., Eguiluz, R. A., Luna-Morris, S. and Vogel, V. (2007). Force-induced unfolding of fibronectin in the extracellular matrix of living cells. PLoS Biol. 5, 2243-2254. [DOI] [PMC free article] [PubMed] [Google Scholar]
- Sun, Z., Martinez-Lemus, L. A., Trache, A., Trzeciakowski, J. P., Davis, G. E., Pohl, U. and Meininger, G. A. (2005) Mechanical properties of the interaction between fibronectin and alpha5beta1-integrin on vascular smooth muscle cells studied using atomic force microscopy. Am. J. Physiol. Heart Circ. Physiol. 289, H2526-H2535. [DOI] [PubMed] [Google Scholar]
- Truskey, G. A. and Proulx, T. L. (1993). Relationship between 3T3 cell spreading and the strength of adhesion on glass and silane surfaces. Biomaterials 14, 243-254. [DOI] [PubMed] [Google Scholar]
- Wiseman, P. W., Brown, C. M., Webb, D. J., Hebert, B., Johnson, N. L., Squier, J. A., Ellisman, M. H. and Horwitz, A. F. (2004). Spatial mapping of integrin interactions and dynamics during cell migration by image correlation microscopy. J. Cell Sci. 117, 5521-5534. [DOI] [PubMed] [Google Scholar]
Associated Data
This section collects any data citations, data availability statements, or supplementary materials included in this article.