Abstract
Purpose
To determine the effect of transforming growth factor (TGF)-β2 treatment on intraocular pressure (IOP), outflow facility, and cochlin expression in vitro in monkey and pig organ-cultured anterior segments (MOCAS and POCAS).
Methods
MOCAS (rhesus and cynomolgus) or POCAS were infused with media containing 10 ng/mL TGFβ2 to one segment of each pair and 0.1% BSA (vehicle) to the contralateral segment for up to 14 days at a constant rate. Cochlin expression was determined by immunohistochemical study, ELISA, and Western blot analysis using chicken polyclonal antibodies against different regions of cochlin.
Results
TGFβ2 infusion produced elevated IOP in MOCAS (usually after 5 days), that was approximately 45% greater than baseline and compared to control segments. Outflow facility (OF) was decreased by ~40% compared with pretreatment baseline (n = 5). In POCAS (n = 7), IOP was increased (~3 days) by ~75% compared with baseline and contralateral changes. The IOP elevation subsided thereafter. Cochlin levels increased with duration of TGFβ2 treatment in the media and in the region of the trabecular meshwork in both species.
Conclusions
TGFβ2-induced IOP elevation was associated with an increase in cochlin secretion into the media and expression in the tissue of MOCAS and POCAS. Whether cochlin overexpression contributes to elevated IOP or is a consequence of other changes relevant to IOP elevation remains to be determined.
Glaucomas are a group of multifactorial eye diseases that lead to irreversible blindness. The underlying characteristic of these diseases, which have various etiologies, is damage to the optic nerve (glaucomatous neuropathy).1 Primary open-angle glaucoma (POAG) is one of the most common forms of glaucoma, often characterized by elevated intraocular pressure (IOP), and it results in permanent damage to the optic nerve. POAG is the leading cause of irreversible vision loss and affects more than 70 million people worldwide.2 In the anterior segment of the eye, aqueous humor is actively produced by the ciliary epithelium and plays an important role in providing nutrition and removal of excretory products. Elevated IOP occurs due to an imbalance between aqueous production and outflow. In POAG, obstruction to aqueous outflow frequently leads to elevated IOP.3 Aqueous outflow experiences most resistance at the trabecular meshwork (TM),4 where changes in the TM extracellular matrix (ECM) have been linked to either the cause or result of the pathologic effects of glaucoma.4,5
Recent proteomic investigations6,7 have revealed the presence of cochlin, a protein of poorly understood function,8 in the TM of patients with POAG but not controls.6 Cochlin, a product of the coagulation factor C homology gene,9,10 possesses a signal peptide sequence that is cleaved and the mature protein is secreted into the ECM.8,11,12 Expression of cochlin has also been detected in glaucomatous DBA/2J mice, but not in normal mice.13 In DBA/2J mice, cochlin expression occurs early, and a considerable increase in cochlin expression occurs before 8 months of age, when elevated IOP and optic nerve damage become prominent.6,13
Transforming growth factor (TGF)-β2 is a member of the TGF family and is one of the three β isoforms (β1, β2, and β3). TGFβ2 is thought to contribute to POAG pathogenesis.14 It influences ECM production in the TM and has been implicated in the elevation of IOP.14,15 Elevated ECM components have been shown to reduce the outflow of aqueous through the TM in organ-cultured anterior segments.15 In vitro treatment of cultured TM cells with TGFβ2 resulted in elevated production of ECM proteins such as fibronectin and plasminogen activator inhibitor (PAI)-1.14
We have investigated the effects of TGFβ2 treatment on IOP, outflow facility, and cochlin expression using the in vitro models of monkey and porcine organ-cultured anterior segments (MOCAS and POCAS).
Materials and Methods
Organ Culture of Monkey and Porcine Eye Anterior Segments
All animals were managed according to the ARVO Statement for the Use of Animals in Ophthalmic and Vision Research. Fresh eyes were obtained from rhesus (Macaca mulatta) and cynomolgus (Macaca fascicularis) monkeys that were euthanatized as part of ongoing studies (but not specifically for the present studies) at the Wisconsin National Primate Research Center or from Dr. Kaufman’s colony at the University of Wisconsin. Four of the five monkeys had no prior ocular treatments or procedures. One monkey (OCM-07-04) had been used over the course of several years for IOP and fluorophotometry studies after topical and, on one occasion, intracameral, drug administration. No experiments had been conducted for 3 months before the final, terminal experiment in which prostaglandin was administered topically twice daily for 4 days in the right eye (used as the vehicle-treated segment in the present study). The eyes from this monkey were free of cells and flare, as determined by slit lamp biomicroscopic examination on the day of euthanatization.
The tissues were collected, usually within 15 minutes after euthanatization; maintained for less than 2 to 3 hours in a moist chamber on ice before being placed in organ culture; and dissected according to published protocols.16 The anterior segments were mounted with cyanoacrylate tissue adhesive (Nexaband; Abbott, Chicago, IL) in organ culture dishes modified for the dimensions of the monkey eye. The O-rings were lined with a bead of aquarium silicone. These measures assured that there were no leaks around the O-ring as a result of the thin sclera of the monkey anterior segments. The organ-cultured tissues were placed in an incubator (37°C, 5% CO2) and perfused at 2 to 2.5 μL/min with Dulbecco’s modified Eagle’s medium (DMEM, containing 4500 mg glucose, 1 mg glutamine, NaHCO3 and pyridoxine HCl per liter; Sigma-Aldrich, St. Louis, MO), gentamicin (15 mg/L; Sigma-Aldrich), and antibiotic/antimycotic solution (penicillin G, 100 U/mL; streptomycin sulfate, 100 μg/mL; amphotericin B, 0.25 μg/mL; Sigma-Aldrich) as reported previously.16
Fresh porcine eyes were obtained at the time of euthanatization from a local abattoir (two pairs) or from ongoing studies (six pairs) by other investigators at the University of Wisconsin under approved protocols. No eyes were scalded before enucleation. Porcine eyes were also stored in a moist container on ice until they were mounted in organ culture, usually less than 2 to 6 hours after euthanatization. We used a previously published dissection protocol, with slight modification.17 Anterior segments were then mounted on dishes adapted for the size of the pig anterior segment and attached with tissue adhesive. The tissue was clamped down with an O-ring lined with silicone. The medium was infused at 4.5 μL/min.
Pressure and Outflow Facility Measurement in Organ Culture
Pressure within the organ culture was monitored with pressure transducers (Isotec; Harvard Apparatus, Holliston, MA) connected to amplifiers (HSE Tam-D; Harvard Apparatus) and the resulting data transferred to a computer. In MOCAS, outflow facility was also measured at baseline before any treatment and at the conclusion of the experiment by two-level constant pressure perfusion, as described previously.16 These outflow facility results were also compared with those obtained by the calculation of infusion rate divided by IOP.
Treatments and Tissue Collection
After baseline equilibration (~1 day for MOCAS, 2–3 days for POCAS), anterior segments were exchanged with 10 ng/mL recombinant human TGFβ2 (R&D Systems, Inc., Minneapolis, MN) in media containing 0.1% BSA to prevent sticking to the tubing and other surfaces. IOP was maintained during the exchange by opening the pressure port to an elevated reservoir. The solution was infused via the inflow port. MOCAS were typically exchanged with 3 to 4 mL and POCAS were exchanged with 4 to 5 mL at 200 μL/min. After the exchange, infusion of the corresponding segments was resumed with TGFβ2 or vehicle-containing medium. Medium containing fresh TGFβ2 was added every 1 to 2 days. At the conclusion of the studies, anterior segments were removed from the dishes and cut into quadrants, then into smaller pieces. Pieces from each quadrant were either fixed in 4% paraformaldehyde or frozen at −80°C until further analysis. Fixed and frozen tissues were subjected to immunohistochemical and Western analyses, respectively. At least two quadrants were subjected to analyses for each immunohistochemistry.
Generation of Cochlin Antibodies
For detection of cochlin, custom peptide antibodies against cochlin peptides were generated by using the commercial services of Aves Laboratory Inc. (Portland, OR), as described previously.8 The following peptide sequences were used: KR LKK TPE KKT GNK DC (147–162; hCochlin-1); ZCZ TYD QRT EFS FTD YST KEN (412–429; hCochin-2); and, CZ DDL KDM ASK PKE SH (358–371; hCochlin-3). The numbers in parentheses refer to the position of the peptides in the human cochlin sequence (Swiss-Prot accession number: O43405; http://www.expasy.org; provided in the public domain by Swiss Institute of Bioinformatics, Geneva, Switzerland), and the designated name of each peptide antibody is indicated. Antibody generation was performed according to established protocols recommended by the vendor. Each HPLC-purified synthesized peptide conjugated with KLH was used to immunize hens. Immune eggs were collected and IgY fractions were purified. The pooled volumes of purified antibody from the hens were 105, 88, and 112 mL, with an IgY concentration of 25.2, 28.7, and 27.8 mg/mL (by Bradford assay), for hCochlin-1, -2, and -3, respectively. The preparation was affinity purified with a final concentration of affinity-purified antibody of 0.9 to 1.4 mg/mL.
The antibodies were subjected to ELISA analysis. The ovalbumin-conjugated peptides were absorbed onto ELISA plates at a concentration of 1 μg/mL in PBS. After an overnight incubation at 4°C, a 1:100 dilution of a blocking agent diluted in PBS (BlockHen; Aves Labs, Tigard, OR) was added to each well and incubated for 2 hours at room temperature to block nonspecific sites. After thorough washing, wells on the plate were incubated overnight at 4°C with various concentrations of either purified immune IgY, purified preimmune IgY and affinity-purified IgY, and then incubated with horseradish peroxidase (HRP)–labeled goat anti-chicken IgY (1: 5000) for another hour at room temperature. The HRP activity bound to the plate was estimated after thorough washing using ortho-phenylenediamine and stable peroxide substrate buffer, by measuring the absorbance at 450 nm. Levels of preimmune antibodies, antibodies (IgY fraction) after peptide injection, and the affinity-purified antibodies from these IgY fractions were compared. Negligible amounts of antibodies against the peptide sequences were present in the preimmune fractions and comparisons of the shift in IgY and affinity-purified antibody preparations was approximately 100-fold, indicating successful affinity purification.
Immunohistochemical Analyses
Immunohistochemical analyses to localize cochlin in the trabecular meshwork were performed with MOCAS and POCAS fixed with 4% paraformaldehyde. To ensure identical processing and uniform exposure, control and TGFβ2-treated sections were examined side by side on the same slide. For immunohistochemistry, 10-μm paraffin-embedded sections were labeled with antibodies specific to cochlin8 and with a secondary antibody coupled to Alexa 594 (red) or Alexa 488 (green) (Invitrogen-Molecular Probes, Eugene, OR) then analyzed with a laser scanning confocal microscope (TCS-SP5; Leica, Exton, PA). A series of 1 μm x–y (en face) images were collected and summed for an image representing a three-dimensional projection of the entire 10-μm section. Confocal microscopic panels were composed in image-management software (Photoshop 8.0; Adobe Systems, San Jose, CA).
Western and ELISA Analyses
Western analyses used suitable modification of previously published protocols.6,13 Briefly, media were collected and soluble protein was quantified by the Bradford assay.18 Insoluble material was removed by centrifugation (8000g for 5 minutes). The media were mixed with a buffer. The composition of 2× buffer added to the media was 250 mM Tris-Cl (pH 7.0), 200 mM NaCl, and 1% SDS. Equal amounts (10 μg) of samples were fractionated on a 4% to 20% gradient polyacrylamide gel (Invitrogen Inc., Carlsbad, CA). After transfer to a polyvinylidene difluoride (PVDF) membrane, chicken polyclonal antibody against human cochlin8 (at ~5μg/mL) was added, and chemiluminescence (ECL kit; Pierce Biotechnology, Rockford, IL) was used for image development.
An ELISA was performed with 1 μg total media protein. The medium for each sample was placed (triplicate for each sample) in a plate (Costar 9018 plate; Corning, Corning, NY) and incubated for 20 minutes at room temperature. The supernatant was discarded, and the plate was washed with PBS. The plates were blocked with 1% ovalbumin for 1 hour, washed with PBS, and incubated for an additional hour with chicken polyclonal antibody against human cochlin and subsequently with the secondary antibody coupled with alkaline phosphatase for 1 hour. The plates were washed with PBS and incubated with phosphatase substrate (100 μL/well) in diethanolamine buffer (pH 7.5) and the absorbance measured at 405 nm on a plate reader. Recombinant cochlin expressed and purified in HEK cells and DMEM with 10% fetal bovine serum were used as the positive and negative controls, respectively.
Data and Analysis
IOP, outflow facility, and ELISA results are expressed as the mean ± SEM. IOP differences were compared to 0.0 by the two-tailed paired or unpaired t-test. Outflow facility ratios were compared to 1.0 by the two-tailed paired or unpaired t-test. Comparisons in the organ-culture literature16 are usually normalized to the baseline for that given segment, to take into account differences resulting from dissection and manipulations. For the ELISA, statistical analysis was performed within each day and compared to 0.0 by two-tailed, one-sample t-test.
Results
IOP and Outflow Facility in MOCAS after TGFβ2 Treatment
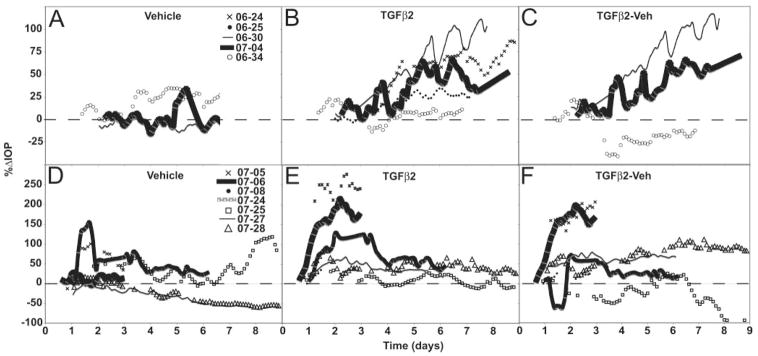
Typically, IOP in MOCAS gradually decreased with time over several days, possibly due to washout and/or increased permeability of the thin sclera with time.16,19 To illustrate the effect of TGFβ2, the IOP tracings are shown relative to the trough typically reached approximately 2 days after the exchange. Prolonged treatment with TGFβ2 produced a gradual elevation in IOP after 3 to 5 days compared with vehicle controls in four of five MOCAS (Fig. 1A–C). In the fifth pair (OCM-06-34), there was no apparent increase in IOP after TGFβ2 treatment. In this study, only three control samples were used for baseline determination; the other samples developed leaks and were discarded. When all samples (n = 5) were considered, IOP was significantly elevated in TGFβ2-treated segments (+47%; P < 0.005) at 5 to 9 days from the start of treatment, compared with the postex-change trough baseline. The corresponding change in vehicle controls (n = 3) was an increase of 2% (Table 1).
Figure 1.
IOP profiles. (A–C) MOCAS and (D–F) POCAS after TGFβ2 treatment. IOP expressed as the percentage change from a stable baseline reached after 10 ng/mL TGFβ2 or vehicle (0.1% BSA) exchange. TGFβ2 or vehicle was present in the media for the duration of the studies (A). (D) IOP with vehicle alone; (B, E) results for TGFβ2; (C, F) the difference in IOP (TGFβ2-Veh) for paired segments only (two MOCAS did not have the contralateral control segments because of leaking and are therefore omitted from the difference graph).
Table 1.
IOP and Cochlin Levels in MOCAS in Response to TGFβ2 Treatment
| Initial Baseline IOP (mm Hg) |
Baseline IOP Post TGFβ2 (mm Hg)† |
%ΔIOP vs. Baseline Post TGFβ2 (Mean ± SEM) |
||||||||||
|---|---|---|---|---|---|---|---|---|---|---|---|---|
| MOCAS | Species, Sex, Age |
TGFβ2 | Vehicle | TGFβ2 | Vehicle | TGFβ2 | Vehicle | Interval in Days of Maximum IOP Response (n = Time-Points) |
Relative Cochlin Level (IHC) in Tissue (hCochlin-1) |
Relative Cochlin Level (IHC) in Tissue (hCochlin-3) |
Relative Cochlin Level (Western Analysis) |
ELISA |
| OCM-06-24-OS | Cy, F, 5 y | 2.6 | 4.1 | 65.5 ± 0.5 | 4.5–8.9 (374) | + + (d12) | + + + | + + + | + + + + (d12) | |||
| OCM-06-25-OD | Rh, M, 6 y | 6.8 | 3.9 | 28.3 ± 0.4 | 5.0–7.1 (208) | + (d10) | + | + + + | + + + (d8) | |||
| OCM-06-30-OD | Rh, M, 14 y | 4 | 13.6 | 4.5 | 9 | 85.9 ± 1.03 | −8.1 ± 0.2 | 5.1–7.8 (264) | + + + (d8) | + + + + | + + + + | + + + + (d8) |
| OCM-07-04-OS | Cy, M, 8 y | 6.1 | 7.54 | 5.1 | 4.5 | 45.4 ± 0.9 | −10.2 ± 0.6 | 5.9–8.7 (168) | N/D (d9) | + | + + + | + + + (d9) |
| OCM-06-34-OD | Rh, F, 10 y | 4.1 | 4.8 | 4.5 | 3.5 | 7.3 ± 0.3 | 24.5 ± 0.4 | 5.0–6.9 (174) | + + (d7) | + + | + + | + + (d8) |
| Mean ± SEM | 4.7 ± 0.8* | 8.6 ± 2.6 | 4.4 ± 0.2 | 5.7 ± 1.7 | 46.5 ± 13.8‡§ | 2.1 ± 11.2 | ||||||
Different from vehicle by the two-sample, unpaired t-test compared to 0.0:
P < 0.05;
P < 0.005.
Different from baseline post TGFβ2 by the two-tailed paired t-test compared to 0.0:
P < 0.05.
See Results text for further explanation. + + + +, strong; +, weak; N/D, not detected; IHC, immunohistochemistry; Cy, cynomolgus; Rh, rhesus.
Outflow facility, measured before exchange and at the conclusion of the experiment, correlated with the IOP data. After prolonged treatment with TGFβ2, outflow facility was decreased relative to baseline (−40%; Table 2, A and C) and was also decreased relative to vehicle controls when present (Table 2, B and D). The MOCAS that showed no change in IOP (OCM-06-34) showed a 15% reduction in outflow facility when compared with baseline and corrected for vehicle control changes (not shown). Similar conclusions could be made regardless of whether outflow facility was measured by two-level constant-pressure perfusion (Table 2, A and B) or calculated from constant-rate infusion and IOP (Table 2, C and D). However, variability is less with the two-level method, especially if IOP levels are low.16
Table 2.
Outflow Facility in MOCAS after TGFβ2 Treatment
| TGFβ2 (μl/min/mm Hg) |
Vehicle (μl/min/mm Hg) |
TGFβ2/Vehicle | TGFβ2/Baseline preRx | Vehicle/Baseline preRx | (TGFβ2/Baseline)/ (Vehicle/Baseline) |
|
|---|---|---|---|---|---|---|
| Outflow Facility by Two-Level Constant Pressure | ||||||
| A. Unpaired | (n = 5) | (n = 3) | ||||
| Baseline preRx | 0.429 ± 0.061 | 0.446 ± 0.254 | ||||
| TGFβ2 (days 5–9) | 0.269 ± 0.051 | 0.429 ± 0.171 | 0.620 ± 0.061*† | 1.279 ± 0.401 | ||
| B. Paired | (n = 3) | (n = 3) | ||||
| Baseline preRx | 0.449 ± 0.103 | 0.446 ± 0.254 | 1.571 ± 0.598 | |||
| TGFβ2 (days 7–9) | 0.270 ± 0.093 | 0.429 ± 0.171 | 0.657 ± 0.062 | 0.575 ± 0.075‡ | 1.279 ± 0.401 | 0.533 ± 0.167 |
| Outflow Facility by Infusion Rate/IOP | ||||||
| C. Unpaired | (n = 5) | (n = 3) | ||||
| Baseline preRx | 0.477 ± 0.084 | 0.325 ± 0.089 | ||||
| Baseline post Rx | 0.476 ± 0.014 | 0.450 ± 0.114 | ||||
| TGFβ2 (days 5–9) | 0.333 ± 0.035 | 0.459 ± 0.127 | 0.811 ± 0.189§ | 1.454 ± 0.168 | ||
| D. Paired | (n = 3) | (n = 3) | ||||
| Baseline preRx | 0.440 ± 0.053 | 0.325 ± 0.089 | 1.798 ± 0.816 | |||
| Baseline postRx | 0.460 ± 0.015 | 0.450 ± 0.114 | 1.220 ± 0.391 | |||
| TGFβ2 (days 7–9) | 0.317 ± 0.052 | 0.459 ± 0.127 | 0.764 ± 0.141 | 0.751 ± 0.161 | 1.454 ± 0.168 | 0.538 ± 0.137 |
Different from vehicle/baseline by the unpaired t-test for ratios:
P < 0.005;
P < 0.001.
Different from 1.0 by the two-tailed paired t-test for ratios:
P < 0.01,
P < 0.05. Data are mean ± SEM. Baseline preRx, baseline pretreatment; baseline postRx, baseline postreatment. Comparisons are to the pretreatment baseline in all cases to be consistent between two-level constant pressure and constant rate methods of outflow facility determination.
IOP in POCAS after TGFβ2 Treatment
IOP in POCAS was shown relative to baseline within 1 day after TGFβ2 exchange (Figs. 1D, 1E) to be consistent with that in the MOCAS (Figs. 1A, 1B). IOP after TGFβ2 treatment increased much more rapidly in POCAS than in MOCAS (Figs. 1B, 1C compared with Figs. 1E, 1F). After 3 days, IOP was approximately 76% ± 27% (P < 0.05, n = 7) greater in treated than in control POCAS (Table 3). The IOP elevation was not sustained by continued TGFβ2 infusion but returned to near baseline levels in samples that were tested for more than 3 days.
Table 3.
IOP and Cochlin Levels in POCAS after TGFβ2 Treatment
| Initial Baseline IOP (mm Hg) |
Baseline IOP Post TGFβ 2 (mm Hg) |
%ΔIOP vs Baseline Post TGFβ2* |
Corneal Swelling or Defect (at Recorded Time Point) |
|||||||||
|---|---|---|---|---|---|---|---|---|---|---|---|---|
| POCAS | TGFβ2 | Vehicle | TGFβ2 | Vehicle | TGFβ2 | Vehicle | TGFβ2 | Vehicle | Interval in Days for Maximum IOP effect (n = Time-Points) |
Relative Cochlin Level (IHC) in Tissue (Days Post Treatment) |
Relative Cochlin Level (Western Analysis) in Media (Days same as in IHC) |
ELISA |
| OCP-07-05 | 7.9 | 5.7 | 6.6 | 6.7 | 246.8 ± 2.0 | 72.0 ± 1.7 | d2 | N/D | 1.3–3.0 (146) | + (d3) | + | + (d3) |
| OCP-07-06 | 13 | 14.7 | 7.5 | 14.1 | 182.1 ± 1.7 | 11.7 ± 0.6 | N/D | N/D | 1.8–3.0 (107) | + (d3) | + | + (d3) |
| OCP-07-08 | 10 | 10.1 | 13 | 10.7 | 33.5 ± 0.8 | 12.9 ± 0.3 | N/D | N/D | 1.4–2.7 (58) | N/D (d3) | + | + (d3) |
| OCP-07-24 | 10.9 | 10.7 | 13.5 | 9.7 | 116.6 ± 1.3 | 63.6 ± 1.4 | N/D | N/D | 2.0–3.5 (72) | + + + (d6) | + + + | + + + (d6) |
| OCP-07-25 | 15.1 | 15.8 | 19.5 | 11.6 | 30.4 ± 0.7 | 45.3 ± 2.5 | d9 | N/D | 1.1–2.1 (35) | +++ (d9) | + + + + | + + + + (d9) |
| OCP-07-27 | 15.6 | 19.8 | 11.5 | 20.3 | 56.5 ± 0.6 | −15.1 ± 0.6 | N/D | N/D | 2.1–3.2 (107) | N/D (d6) | + + + | + + + (d6) |
| OCP-07-28 | 9.6 | 14.3 | 10.6 | 11.2 | 73.6 ± 1.5 | 15.3 ± 0.2 | N/D | N/D | 1.4–2.0 (57) | + + + (d9) | + + + | + + + + (d9) |
| Mean ± SEM | 11.7 ± 1.1 | 13.0 ± 1.7 | 11.7 ± 1.6 | 12.0 ± 1.6 | 105.7 ± 30.9† | 29.4 ± 112.0 | ||||||
Different from vehicle by the two-tailed paired t-test compared to 0.0.
P < 0.05; + + + +, strongest +, weakest; N/D, not detected. Data are mean ± SEM. IHC, immunohistochemistry;
See Results text for further explanation.
IOP data collected before and after the exchange with TGFβ2 or vehicle and up to the time of the baseline after exchange illustrated the stability of the preparation (see Supplementary Figs. S1 [MOCAS] and S2 [POCAS], online at http://www.iovs.org/cgi/content/full/50/2/551/DC1).
Cochlin Expression in MOCAS after TGFβ2 Treatment
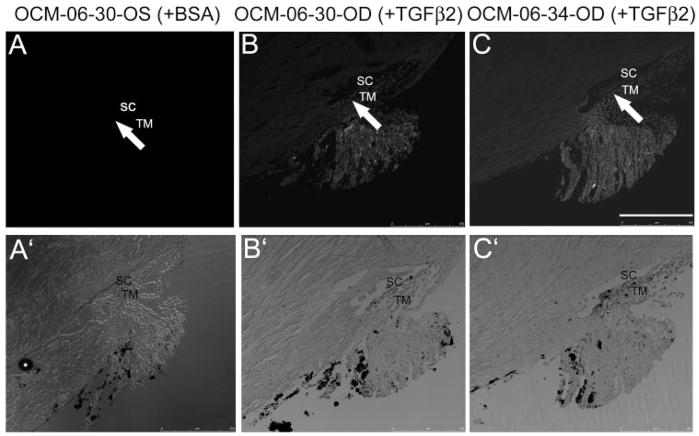
Probing the MOCAS anterior segment sections with chicken polyclonal antibodies to human cochlin revealed antibody-specific fluorescence in the region of the TM (Fig. 2B). Controls, treated with BSA alone, lacked fluorescence in the TM (Fig. 2A) compared with the TGFβ2-treated segments (Fig. 2B). The baseline (no signal) adjustment was performed on the first slide of all serial sections subjected to immunostaining after incubation without primary antibody; therefore, the observed fluorescence is specific to cochlin. All MOCAS showed some degree of nonspecific fluorescence in their ciliary body remnant. However, the nonspecific fluorescence was confined to the ciliary body and was absent in the TM. The bright-field images demonstrated the integrity of the anterior segments (Figs. 2A′, 2B′). A segment (OCM-06-30-OD) that showed an increase in IOP and a decrease in outflow facility on TGFβ2 treatment showed similar cochlin expression in the TM (Fig. 2B), compared with a segment (OCM-06-34-OD, Fig. 2C) that showed little or no increase in IOP and a slight decrease in outflow facility. However, the TGFβ2 treated OCM-06-30-OD medium (day 8) showed much more relative cochlin immuno-reactivity than that in OCM-06-34-OD medium (see Fig. 4). In contrast, anterior segments subject to BSA treatment did not show any cochlin in the TM (Fig. 2A).
Figure 2.
Cochlin immunohisto-chemical analysis in MOCAS. Paraffin-embedded sections (10 μm) of (A) control MOCAS (OCM-06-30-OS) treated with BSA; (B) MOCAS (OCM-06-30-OD); and (C) MOCAS (OCM-06-34-OD) treated with TGFβ2 for 8 days were probed with hCochlin-3 primary antibody. Adjacent control sections for the right or left eye incubated with preimmune antibodies (but without primary antibody) were used for adjustment of baseline fluorescence. Arrows: fluorescence, present in (B) and (C) but not in the corresponding region of (A). The treated segment (OCM-06-30-OD) showed an increase in IOP (Fig. 1, Table 1) and a decrease in outflow facility of 40% compared with baseline (decrease of 70% when corrected for changes in the contralateral control segment). (A′–C′) Bright-field images demonstrate the cellularity and integrity of the sections. Bar, 100 μm.
Figure 4.
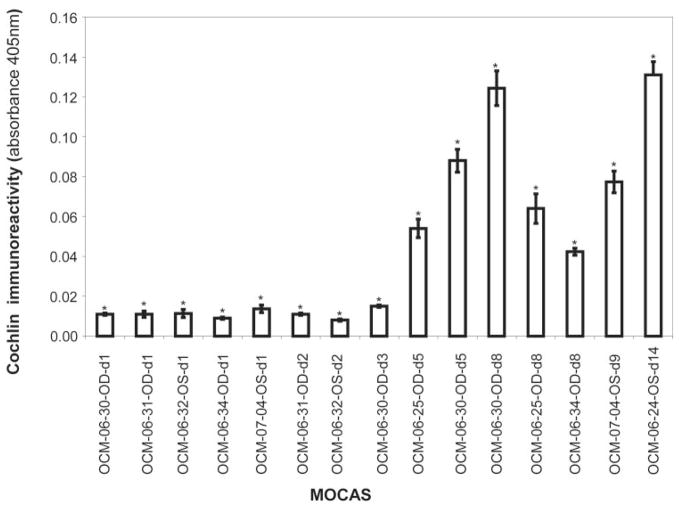
ELISA analysis for cochlin immunoreactivity. ELISA analysis using MOCAS medium from the indicated samples at the indicated time points was performed with 1 μg of protein and hCochlin-3 antibody. Co-chlin secretion into the medium after TGFβ2 treatment was at a low level for 2 to 3 days and then increased with time of incubation. Control (without TGFβ2 treatment) samples showed absorbance values similar to those at baseline and are not depicted. Each bar represents the mean ± SEM from three independent experimental readings and was found to be significantly different from 0.0 at each time point by the one-sample t-test (*P < 0.05).
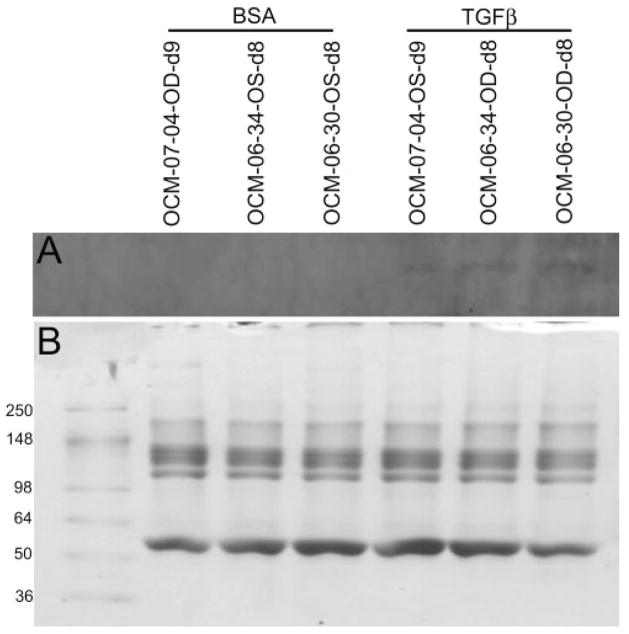
Cochlin was detected by Western blot in the medium of MOCAS treated with TGFβ2 but not control samples treated with BSA (Fig. 3A). Relatively low or undetectable levels of cochlin were found in the medium of MOCAS treated for short periods (2 days or less, not shown). The medium of MOCAS treated for longer periods (7 days or more) had higher levels of cochlin (Fig. 3A).
Figure 3.
Western blot analysis for cochlin in media from MOCAS after TGFβ2 treatment. The results from three anterior segment cultures (OCM-07-04, OCM-06-34, and OCM-06-30; BSA and TGFβ2 treatment as indicated) are shown. (A) Approximately 10 βg of protein from media treated with TGFβ2 or BSA was loaded and probed with the anti-cochlin antibody hCochlin-1. Cochlin secretion into the media was detected in each of the TGFβ2-treated but not the vehicle-treated cultures. (B) Coomassie blue staining of the gel after partial transfer.
ELISA analysis was performed to obtain quantitative estimations of cochlin levels in the media (Table 1, Fig. 4). In general, longer exposure to TGFβ2 resulted in higher levels of cochlin detection. ELISA analysis of media from OCM-06-34-OD after 8 days of treatment had relatively lower levels of cochlin compared with other anterior segments subjected to TGFβ2 treatment.
Cochlin in POCAS after TGFβ Treatment
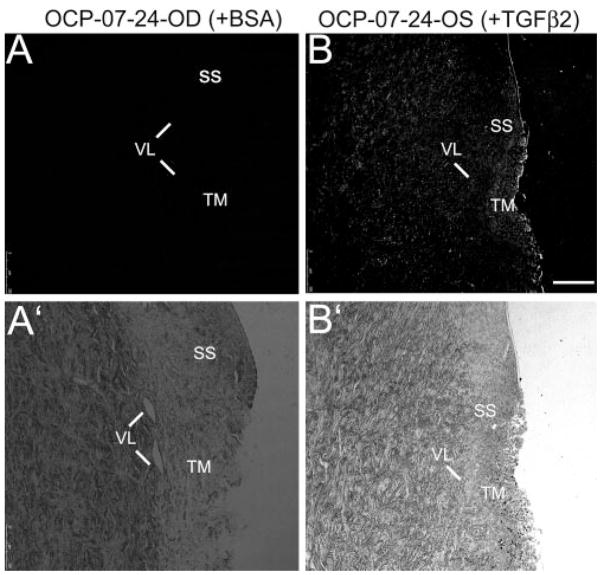
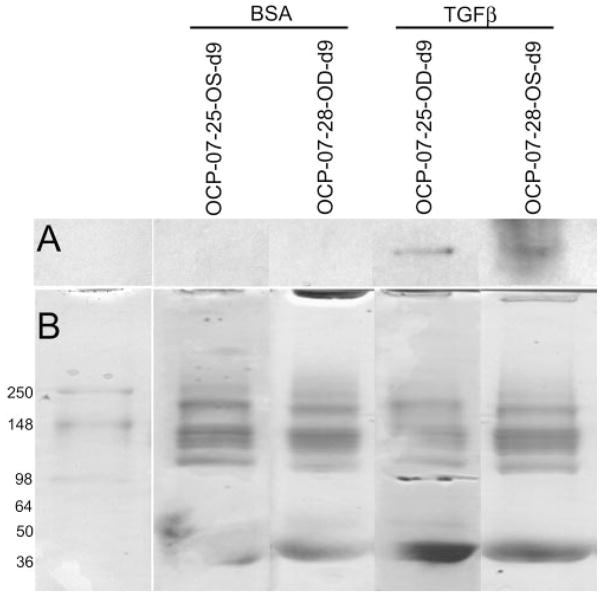
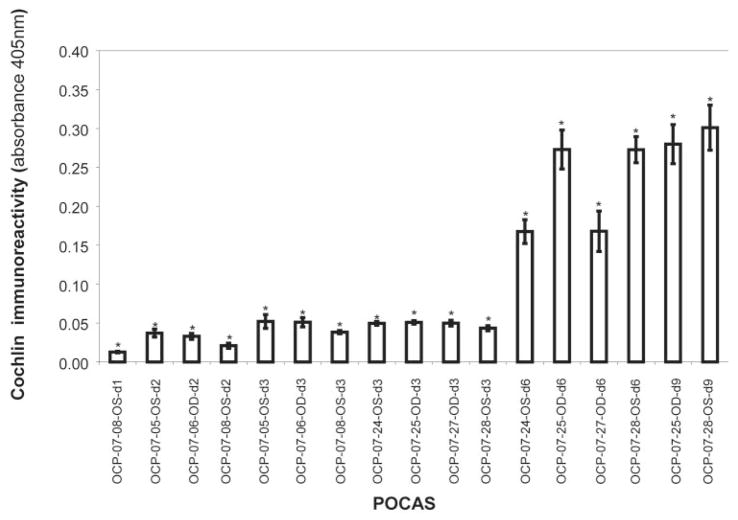
Tissue from POCAS probed with chicken polyclonal cochlin antibodies revealed fluorescence in the TGFβ2-treated segments but not in BSA-treated control samples (Fig. 5). Cochlin levels in the tissue and media seemed to correlate better with duration of exposure to TGFβ2 than with IOP elevation (Table 3). Cochlin secretion was detected by Western blot in the media of POCAS after 6 to 9 days of treatment with TGFβ2 but not in control subjects (Fig. 6A; see Supplementary Fig. S3, http://www.iovs.org/cgi/content/full/50/2/551/DC1, for a representative figure showing the entire blot with a recombinant cochlin control). In some POCAS, very low levels of cochlin were detected by ELISA in the media after only 2 days of TGFβ2 treatment. ELISA also showed that the cochlin levels in the media correlated with time of exposure to TGFβ2 and seemed to reach a plateau after 6 to 9 days (Fig. 7; Table 3).
Figure 5.
Cochlin immunohistochemical analysis in POCAS. Paraffin-embedded sections (10 μm) of (A) OCP-07-24-OD treated with BSA and (B) OCP-07-24-OS treated with TGFβ2, as indicated for 6 days, were probed with hCochlin-3 primary antibody. Identical control sections without primary antibody were used for adjustment of baseline fluorescence. OCP-07-24-OS showed an increase in IOP compared with OD. The bright-field images (A′, B′) demonstrated cellularity and integrity of the sections. SS, scleral spur; VL, vessel loops; TM, trabecular meshwork. Bar, 100 μm.
Figure 6.
Western blot analysis for cochlin in medium samples from POCAS after TGFβ2 treatment. The results obtained from two anterior segment cultures are shown (OCP-07-25 and OCP-07-28, with days in culture as indicated) (A) Approximately 10 μg of protein from the media treated with 0.1% BSA (first lane in each pair of lanes) or 10 ng/mL TGFβ2 (second lane in each pair of lanes) was loaded and probed with anti-cochlin antibody (hCochlin-1). Cochlin secretion into the media was detected in each of the TGFβ2-treated but not the vehicle-treated cultures. (B) The gel was stained with Coomassie blue after partial transfer.
Figure 7.
ELISA for cochlin immunoreactivity. ELISA of medium from POCAS at the indicated time points was performed using 1 μg medium and hCochlin-3 antibody. Cochlin secretion into the medium increased with time of exposure to TGFβ2. Control (without TGFb2 treatment) showed absorbance values similar to those at baseline (not depicted). Each bar represents the mean ± SEM from four independent experimental readings. *Significantly different from 0.0 at each time point by the one-sample t-test (P < 0.05).
Discussion
Cochlin is an ECM protein of poorly understood function8 that was detected in glaucomatous eyes by using the unbiased approach of proteomics.6 POAG is a late-onset, progressive disease that is often characterized by elevated IOP and in most cases is IOP related, even at normal IOP levels.20 Diseases of several sensorineural organs such as ear, eye, and brain are often of late-onset and associated with elevation of fluid pressure circulating in them. Increases in inner ear pressure, increases in intracranial pressure, and increases in IOP are associated with progressive hearing loss disorders, brain damage, and progressive blinding eye disorders, respectively. Cochlin mutations and cochlear cochlin deposits are associated with the autosomal dominant nonsyndromic auditory and vestibular disorder DFNA9, which is a late-onset, progressive hearing loss disorder with underlying changes in fluid flow dynamics.11,21,22 Cochlin deposits have also been associated with other late-onset, progressive ear diseases such as Ménière’s disease (characterized by progressive hearing loss marked by repeated episodic rotational vertigo), and presbyacusis, a progressive age-related hearing loss.23–25
TGFβ2 treatment has been shown to increase ECM components both in vivo and in vitro.14,15 However, all specific ECM components that undergo upregulation are not known. In the present study, TGFβ2 treatment led to increased cochlin levels in the tissue and media from MOCAS (Figs. 2, 3, 4) and POCAS (Figs. 5, 6, 7). Cochlin levels in the media increased with time of exposure to TGFβ2 in both MOCAS and POCAS, and with the magnitude of IOP elevation or outflow facility reduction in MOCAS, but not necessarily POCAS. Tissue levels of cochlin in POCAS did not correlate with the degree of IOP elevation but did increase with duration of TGFβ2 treatment. In MOCAS the correlations were less clear cut (i.e., tissue levels of cochlin seemed to correlate with IOP but the duration of TGFβ2 treatment required to elevate IOP was also much longer than in POCAS). Also, the variability of the response in the different monkey species (rhesus versus cynomolgus) is not known. The sample size in the present study was too small to make this determination.
IOP elevation required at least 4 to 5 days after the initial TGFβ2 treatment to develop in MOCAS, with the maximum effect not occurring until 5 to 7 days of treatment. This approaches the maximum lifetime for these types of cultures. This, along with the relative lack of availability of monkey eyes, may delay further mechanism studies. Therefore, we opted to determine whether POCAS were also capable of expressing cochlin in response to TGFβ2 treatment, since porcine eyes are much more readily available and POCAS have already been shown to produce characteristic changes in ECM molecules and IOP elevation in response to TGFβ2.17 In our study, cochlin expression was also markedly increased in the medium of POCAS after 6 to 9 days of TGFβ2 treatment. However, IOP elevation was not maintained with continued treatment. The reason for the more rapid rise in IOP in POCAS than in MOCAS is not clear. Differences in other molecules that are secreted in response to TGFβ2 treatment that might contribute to IOP elevation need to be determined. Also, the TM of POCAS may be different in molecular composition and more variable by quadrant17 than in primate eyes. This could contribute to the enhanced response to elevated ECM components after TGFβ2 treatment.
Probing the monkey/porcine anterior segment sections with chicken polyclonal antibodies to human cochlin revealed fluorescence in the region of the TM in the TGFβ2-treated segments (Figs. 2B, 5B) but not in BSA-treated control specimens (Figs. 2A, 5A). Cochlin is highly conserved among mammals, and therefore the antibodies used in our study, which were raised against human cochlin peptides, are expected to cross-react with cochlin of other mammalian species. Their specificity of detection26 has been extensively determined (data not shown); however, the absence of signal when the primary antibody was omitted (or when preimmune antibodies were used) demonstrates that the signal observed with cochlin was specific for cochlin. The fluorescence in the ciliary body was nonspecific, because ciliary body fluorescence was observed with preimmune antibodies and in more than one channel. The lack of detection of cochlin the in the medium of control segments by Western and ELISA analyses demonstrates the specificity of the antibodies.
Cochlin accumulation has been found in the TM of patients with glaucoma6 and also in the TM of DBA/2J mice with elevated IOP and optic nerve damage.13 It is important to note that in contrast to large cochlin aggregates detected in human POAG tissue,6 a more uniform distribution of cochlin is observed in MOCAS and POCAS. The conditions necessary for cochlin deposit formation are not yet known. However, the duration of cochlin expression may not be long enough in MOCAS and POCAS to produce cochlin aggregates. There may also be differences in the presence of other molecules with which cochlin interacts in MOCAS and POCAS, compared with POAG tissue that may contribute to the formation of aggregates. It is unclear whether the observed increased presence of cochlin is due to overexpression or decreased degradation. The increase in cochlin in TGFβ2-treated MOCAS and POCAS is consistent with over-expression that has been found in coupled transcription translation assays of glaucomatous and normal TM extracts (unpublished observation). It is not known whether cochlin overexpression alone is sufficient to elevate IOP in these cultures, although it is sufficient to cause aggregation of human TM cells in culture.6 – 8 Experiments in a mouse model to determine whether overexpression of cochlin results in IOP elevation are in progress. In addition, experiments are necessary to determine whether the addition of exogenous cochlin to the organ culture model results in IOP elevation. The latter is limited by the ability to purify cochlin in the native nontagged form and to determine hemodynamic properties to verify proper folding of the protein for each batch of cochlin. Also, it is not known whether interfering with cochlin expression affects IOP elevation after TGFβ2 treatment. Additional organ-culture experiments will help determine the answer to these questions. MOCAS and POCAS with elevated cochlin levels in response to TGFβ2 treatment could also be used to characterize protein expression and degradation mechanisms that may be further developed as glaucoma therapeutic approaches.
Supplementary Material
Acknowledgments
Supported by NIH grants R01 EY002698, P30 EY016665, P51 RR000167, S10 RR019382, P30 EY01480, R03 EY15266, and R01 EY16112 and unrestricted grants from Research to Prevent Blindness (RPB); an RPB career award (SKB); and the Ocular Physiology Research and Education Foundation.
Footnotes
Disclosure: S.K. Bhattacharya, None; B.T. Gabelt, None; J.Ruiz, None; R. Picciani, None; P.L. Kaufman, None
References
- 1.Coleman AL. Epidemiology of Glaucoma. In: Morrison JC, Pollack IP, editors. Glaucoma Science and Practice. New York: Thieme Medical Publishers Inc; 2003. pp. 2–11. [Google Scholar]
- 2.Quigley HA. Number of people with glaucoma worldwide. Br J Ophthalmol. 1996;80:389–393. doi: 10.1136/bjo.80.5.389. [DOI] [PMC free article] [PubMed] [Google Scholar]
- 3.Morrison JC, Acott TS. Anatomy and physiology of aqueous humor outflow. In: Morrison JC, Pollack IP, editors. Glaucoma Science and Practice. New York: Thieme Medical Publishers Inc; 2003. pp. 34–41. [Google Scholar]
- 4.Lütjen-Drecoll E. Functional morphology of the trabecular mesh-work in primate eyes. Prog Retin Eye Res. 1999;18:91–119. doi: 10.1016/s1350-9462(98)00011-1. [DOI] [PubMed] [Google Scholar]
- 5.Lütjen-Drecoll E. Importance of trabecular meshwork changes in the pathogenesis of primary open-angle glaucoma. J Glaucoma. 2000;9:417–418. doi: 10.1097/00061198-200012000-00001. [DOI] [PubMed] [Google Scholar]
- 6.Bhattacharya SK, Rockwood EJ, Smith SD, et al. Proteomics reveals cochlin deposits associated with glaucomatous trabecular mesh-work. J Biol Chem. 2005;280:6080–6084. doi: 10.1074/jbc.M411233200. [DOI] [PMC free article] [PubMed] [Google Scholar]
- 7.Bhattacharya SK, Peachey NS, Crabb JW. Cochlin and glaucoma: a mini-review. Vis Neurosci. 2005;22:605–613. doi: 10.1017/S0952523805225099. [DOI] [PMC free article] [PubMed] [Google Scholar]
- 8.Picciani R, Desai K, Guduric-Fuchs J, Cogliati T, Morton CC, Bhattacharya SK. Cochlin in the eye: functional implications. Prog Retin Eye Res. 2007;26(5):453–469. doi: 10.1016/j.preteyeres.2007.06.002. [DOI] [PMC free article] [PubMed] [Google Scholar]
- 9.Robertson NG, Khetarpal U, Gutierrez-Espeleta GA, Bieber FR, Morton CC. Isolation of novel and known genes from a human fetal cochlear cDNA library using subtractive hybridization and differential screening. Genomics. 1994;23:42–50. doi: 10.1006/geno.1994.1457. [DOI] [PubMed] [Google Scholar]
- 10.Robertson NG, Skvorak AB, Yin Y, et al. Mapping and characterization of a novel cochlear gene in human and in mouse: a positional candidate gene for a deafness disorder, DFNA9. Genomics. 1997;46:345–354. doi: 10.1006/geno.1997.5067. [DOI] [PubMed] [Google Scholar]
- 11.Robertson NG, Hamaker SA, Patriub V, Aster JC, Morton CC. Subcellular localisation, secretion, and post-translational processing of normal cochlin, and of mutants causing the sensorineural deafness and vestibular disorder, DFNA9. J Med Genet. 2003;40:479–486. doi: 10.1136/jmg.40.7.479. [DOI] [PMC free article] [PubMed] [Google Scholar]
- 12.Grabski R, Szul T, Sasaki T, et al. Mutations in COCH that result in non-syndromic autosomal dominant deafness (DFNA9) affect matrix deposition of cochlin. Hum Genet. 2003;113:406–416. doi: 10.1007/s00439-003-0992-7. [DOI] [PubMed] [Google Scholar]
- 13.Bhattacharya SK, Annangudi SP, Salomon RG, Kuchtey RW, Peachey NS, Crabb JW. Cochlin deposits in the trabecular mesh-work of the glaucomatous DBA/2J mouse. Exp Eye Res. 2005;80:741–744. doi: 10.1016/j.exer.2005.01.028. [DOI] [PubMed] [Google Scholar]
- 14.Fleenor DL, Shepard AR, Hellberg PE, Jacobson N, Pang IH, Clark AF. TGFbeta2-induced changes in human trabecular meshwork: implications for intraocular pressure. Invest Ophthalmol Vis Sci. 2006;47:226–234. doi: 10.1167/iovs.05-1060. [DOI] [PubMed] [Google Scholar]
- 15.Gottanka J, Chan D, Eichhorn M, Lütjen-Drecoll E, Ethier CR. Effects of TGF-beta2 in perfused human eyes. Invest Ophthalmol Vis Sci. 2004;45:153–158. doi: 10.1167/iovs.03-0796. [DOI] [PubMed] [Google Scholar]
- 16.Hu Y, Gabelt BT, Kaufman PL. Monkey organ-cultured anterior segments: technique and response to H-7. Exp Eye Res. 2006;82:1100–1108. doi: 10.1016/j.exer.2005.12.004. [DOI] [PubMed] [Google Scholar]
- 17.Bachmann B, Birke M, Kook D, Eichhorn M, Lütjen-Drecoll E. Ultrastructural and biochemical evaluation of the porcine anterior chamber perfusion model. Invest Ophthalmol Vis Sci. 2006;47:2011–2020. doi: 10.1167/iovs.05-1393. [DOI] [PubMed] [Google Scholar]
- 18.Bradford MM. A rapid and sensitive method for the quantitation of microgram quantities of protein utilizing the principle of protein-dye binding. Anal Biochem. 1976;72:248–254. doi: 10.1016/0003-2697(76)90527-3. [DOI] [PubMed] [Google Scholar]
- 19.Tian B, Hu Y, Gabelt BT, Kaufman PL. Factors affecting outflow facility calculations. Exp Eye Res. 2006;83:1515–1520. doi: 10.1016/j.exer.2006.08.008. [DOI] [PMC free article] [PubMed] [Google Scholar]
- 20.Anderson DR. Collaborative normal tension glaucoma study. Curr Opin Ophthalmol. 2003;14:86–90. doi: 10.1097/00055735-200304000-00006. [DOI] [PubMed] [Google Scholar]
- 21.Kamarinos M, McGill J, Lynch M, Dahl H. Identification of a novel COCH mutation, I109N, highlights the similar clinical features observed in DFNA9 families. Hum Mutat. 2001;17:351. doi: 10.1002/humu.37. [DOI] [PubMed] [Google Scholar]
- 22.Robertson NG, Cremers CW, Huygen PL, et al. Cochlin immunostaining of inner ear pathologic deposits and proteomic analysis in DFNA9 deafness and vestibular dysfunction. Hum Mol Genet. 2006;15:1071–1085. doi: 10.1093/hmg/ddl022. [DOI] [PubMed] [Google Scholar]
- 23.Robertson NG, Lu L, Heller S, et al. Mutations in a novel cochlear gene cause DFNA9, a human nonsyndromic deafness with vestibular dysfunction. Nat Genet. 1998;20:299–303. doi: 10.1038/3118. [DOI] [PubMed] [Google Scholar]
- 24.Ikezono T, Shindo S, Ishizaki M, et al. Expression of cochlin in the vestibular organ of rats. ORL J Otorhinolaryngol Relat Spec. 2005;67:252–258. doi: 10.1159/000089404. [DOI] [PubMed] [Google Scholar]
- 25.Cremers CW, Kemperman MH, Bom SJ, Huygen PL, Verhagen WI, Kremer JM. From gene to disease; a progressive cochlear-vestibular dysfunction with onset in middle-age (DFNA9) (in Dutch) Ned Tijdschr Geneeskd. 2005;149:2619–2621. [PubMed] [Google Scholar]
- 26.Picciani R, Desai K, Guduric-Fuchs J, Cogliati T, Morton CC, Bhattacharya SK. Cochlin in the eye: functional implications. Prog Retin Eye Res. 2007;26:453–469. doi: 10.1016/j.preteyeres.2007.06.002. [DOI] [PMC free article] [PubMed] [Google Scholar]
Associated Data
This section collects any data citations, data availability statements, or supplementary materials included in this article.


