

Abstract
Cell shrinkage, or apoptotic volume decrease (AVD), is a ubiquitous characteristic of programmed cell death that is independent of the death stimulus and occurs in all examples of apoptosis. Here we distinguished two specific stages of AVD based on cell size and a unique early reversal of intracellular ions that occurs in response to activation of both intrinsic and extrinsic cell death signal pathways. The primary stage of AVD is characterized by an early exchange of the normal intracellular ion distribution for sodium from 12 to 113.6 mm and potassium from 139.5 to 30 mm. This early ionic reversal is associated with a 20–40% decrease in cell volume, externalization of phosphatidylserine, loss of mitochondrial membrane potential, and caspase activation and activity along with nuclear condensation that occurs independent of actin cytoskeleton disruption. Disruption of the actin cytoskeleton, however, prevents a secondary stage of AVD in apoptotic cells, characterized by a loss of both potassium and sodium that results in an 80–85% loss in cell volume, DNA degradation, and apoptotic body formation. Together these studies demonstrate that AVD occurs in two distinct stages with the earliest stage reflecting a cellular cationic gradient reversal.
Apoptosis, or programmed cell death, is a fundamental process in which activation of specific biochemical and morphological events results in death. Cell volume loss, chromatin condensation, and internucleosomal DNA fragmentation are all defining characteristics of this mode of cell death (1, 2). Externalization of phosphatidylserine, depolarization of the mitochondrial membrane potential along with release of various mitochondrial components, and caspase activity have also been used to identify apoptosis (3-5). The interplay of these catabolic events in the cell death program in relation to the loss of cell volume is not well understood.
Apoptotic volume decrease (AVD2 (6)) or the loss of cell volume during apoptosis is thought to result primarily from changes in the intracellular ionic environment. The movement of monovalent ions, particularly sodium and potassium, has been shown to play a pivotal role in both the activation and execution of apoptosis (7-9). Loss of intracellular sodium and potassium has been shown to occur in the shrunken population of apoptotic cells as part of AVD (6, 10, 11). However, earlier studies have shown that an increase in intracellular sodium also occurs during apoptosis (12, 13). Studies with sodium-substituted media revealed that sodium influx is a necessary requirement for AVD during apoptosis in cells treated with Fas ligand, since apoptotic stimulation in the absence of extracellular sodium resulted in cellular swelling rather than shrinkage (13). Despite this swelling of cells, other well defined characteristics of apoptosis including chromatin condensation, externalization of the phosphatidylserine, caspase activity, and DNA degradation persisted. Furthermore, maintenance of normal physiologic intracellular ion concentrations has been shown to inhibit caspase activation and apoptotic nuclease activity during programmed cell death (14-17).
The actin cytoskeleton is well recognized to regulate the activity of ion channels and transporters involved in maintaining cellular homeostasis and cell volume (18, 19). The importance of ion redistribution during apoptosis has, thus, led us to consider the potential role of the actin cytoskeleton in the cell death program during AVD. Disruption of the actin cytoskeleton has been reported to impede the progression of apoptosis and prevent the formation of apoptotic bodies in response to apoptotic stimuli in a cell-type and stimulus-dependent manner (20, 21). Reorganization of various cytoskeletal proteins occurs during apoptosis, suggesting a necessary role for the cytoskeleton in the formation of apoptotic bodies (20, 22-26).
We have now examined the effect of cytoskeletal disruption on Fas ligand (FasL)- and UV-stimulated Jurkat T-cells, well studied models of apoptosis that are amenable to single cell analysis of cell death via flow cytometry and microscopy and show that AVD during apoptosis occurs in two distinct stages. Importantly, we observed an early, previously undescribed ionic imbalance of intracellular potassium and sodium that occurs during the primary stage of AVD. Direct measurements of intracellular sodium and potassium during this primary stage of AVD suggest a reversal of the intracellular cationic gradient resulting in an overall loss of intracellular ionic strength. The decrease of intracellular potassium concentration coupled to an increase in intracellular sodium concentration coincides with early molecular characteristics of apoptotic cells, where disruption of the actin cytoskeleton does not play a major role. In turn, disruption of the actin cytoskeleton prevents the subsequent loss of cellular ions and a secondary stage of AVD, including the later features (DNA degradation, apoptotic body formation) of the program cell death program.
EXPERIMENTAL PROCEDURES
Cell Culture and Reagents
Jurkat cells, E6.1 (human lymphoma), and HL-60 cells (human promyelocytic leukemia) were cultured in RPMI 1640 medium, 10% heat-inactivated fetal calf serum, 4 mm glutamine, 50 units/ml penicillin, and 50 μg/ml streptomycin at 37 °C, 7% or 5% CO2 atmosphere, respectively. Ramos cells (human Burkitt’s lymphoma) were cultured similar to the HL-60 cells, with the exception of using Invitrogen heat-inactivated calf serum. Induction of apoptosis in these various cells (5 × 10⁵ cells per ml) was accomplished using Fas Ligand (Kamiya Biomedical) or UV-C irradiation using a Stratalinker (Stratagene) at the doses described. All incubations were at 37 °C, 7% or 5% CO2 atmosphere for Jurket or for Ramos and HL-60 cells, respectively. Cytochalasin B, cytochalasin D, and cytochalasin E were purchased from Sigma and used at 5 μm final concentration (2.5 μm final for Ramos cells). Latrunculin-A was purchased from Molecular Probes and used at 2.5 μm final concentration.
Staining Jurkat Cells with Phalloidin, Deoxyribonuclease I, and Hoechst 33342
Chromatin condensation of live cells was examined by Hoechst 33342 (10 μg/ml final) staining for 30 min before apoptotic stimulation. Changes in F- and G-actin were examined by confocal microscopy by staining control and treated Jurkat cells with Alexa Fluor 488 phalliodin and Alexa Fluor 594 deoxyribonuclease I, respectively. Coverslips were cleaned (100% acetone for 15 min), washed in distilled water, and air-dried. Cleaned coverslips were treated with 200 μg/ml poly-d-lysine for 30 min, drained, and air-dried. Jurkat cells (5 ml at 5 × 10⁵ cells per ml) were harvested, washed in 1× PBS, and then resuspended in 5 ml of 3.7% paraformaldehyde, PBS for 20 min at room temperature. The cells were then harvested, washed in 5 ml of 1× PBS, and resuspended in 100 μl of PBS, and then 30 μl of each sample were placed on the pre-cleaned, poly-d-lysine-coated coverslips for 30 min. After 30 min, the coverslips were gently washed twice in PBS and drained. Each cell-laden coverslip was then treated with 300 μl of 0.1% Triton X for 5 min at room temperature. The coverslips were gently washed 3 times in 1× PBS. Each coverslip was then treated with 30 μl of 1% bovine serum albumin, PBS for 20 min at room temperature. The coverslips were drained and incubated with 30 μl of the antibody mixture that contained 1 unit of Alexa Fluor 488 phalloidin (for F-actin), 10 μg/ml Alexa Fluor 594 deoxyribonuclease I (for G-actin), and 12.5 μg/ml Hoechst 33342 in bovine serum albumin, PBS for 20 min at room temperature. Finally, the coverslips were drained, washed twice in 1× PBS, and mounted onto a slide using Gel/Mount (Biomeda, Foster City, CA) for confocal examination.
Microscopy
A laser-scanning confocal microscope (LSM 510 NLO mounted on Axiovert 100 m microscope, Carl Zeiss, Inc.) was used to obtain fluorescent and differential interference contrast images. The images were obtained simultaneously using the 364-nm line from the included Enterprise ion laser (Coherent Laser, Auburn, CA) for the Hoechst dye, a 488-nm argon laser for the Alexa Fluor 488 phalloidin, and a 543-nm HeNe laser for the Alexa Fluor 594 deoxyribonuclease I using a Zeiss Plan-Apo 63× oil N.A. = 1.4 objective lens. Hoechst, phalloidin, and deoxyribonuclease I fluorescence was collected with a 435–485 BP, a 505LP, and a 560LP filter, respectively. The software used for acquisition and analysis was Zeiss LSM510 Version 3.2 for Windows NT and LSM Image Examiner (licensed) Version 3.2 for Windows NT, respectively.
Analysis of Cell Size by Flow Cytometry and Flow Analyzer
Cell size was examined by flow cytometry using a BD BD Biosciences FACSort flow cytometer with CellQuest software. Changes in the forward-light-scattering properties of the cells were used to indicate a change in cell size. Electronic sizing of cells to determine changes in cell diameter and cell volume were accomplished using an NPE Quanta Flow Analyzer equipped with a mercury arc lamp and a 365-nm exciter. The electronic volume channel was calibrated using 6-μm UV beads (Molecular Probes) by positioning this size bead in channel 95 on the volume scale.
Analysis of Cellular Membrane Lipid Symmetry by Flow Cytometry
Phosphatidylserine symmetry was determined using annexin-V conjugated to fluorescein isothiocyanate (Trevigen, Gaithersburg, MD) according to the manufacture’s instructions. Analysis was carried out using a BD Biosciences FACSort flow cytometer with CellQuest software. 10,000 cells were excited at 488 nm and examined at 530 and 585 nm for Annexin-fluorescein isothiocyanate and propidium iodide (PI) fluorescence, respectively.
Analysis of Mitochondrial Membrane Potential by Flow Cytometry
Changes in the mitochondrial membrane potential were measured by flow cytometry using JC-1 (Molecular Probes). Thirty minutes before cytometric analysis, JC-1 was added to 1 ml of cells to a final concentration of 10 μm and incubated at 37 °C, 7% CO2 atmosphere. At the designated time, 10,000 cells were examined for each sample on a FL-1 (530 nm) versus FL-2 (585 nm) dot plot on a BD Biosciences FAC-Sort equipped with CellQuest software. JC-1 has dual emission depending on the state of the mitochondrial membrane potential. JC-1 forms aggregates in cells with a high FL-2 fluorescence, indicating a normal mitochondrial membrane potential. Loss of the mitochondrial membrane potential results in a reduction in FL-2 fluorescence with a concurrent gain in FL-1 fluorescence as the dye shifts from an aggregate to monomeric state. Therefore, retention of the dye in the cell can be monitored through the increase in FL-1 fluorescence. The data were converted to density plots using CellQuest software for presentation.
Analysis of Active Caspase-3 by Flow Cytometry
Caspase activity for caspase-3/7-like enzymes was accomplished using a CaspaTag in situ assay kit (Chemicon) according to the manufacture’s instructions. Briefly, 1 h before cytometric analysis, 300 μl of cells was added to 10 μl of a 30× CaspaTag reagent working stock. Immediately before cytometric analysis, the cells were washed in 2 ml of CaspaTag wash buffer and then resuspended in 500 μl of PBS. Two μl of PI (supplied in the kit) was added to each sample, and the cells were examined using a BD Biosciences FACSort equipped with CellQuest software. For each sample, 10,000 cells were examined at 530 and 585 nm for CaspaTag and PI fluorescence, respectively.
Western Blot Analysis
Western blot analysis for poly(A)DP-ribose polymerase (PARP) cleavage was accomplished by running 50 μg/sample of protein extract on a 4–20% polyacrylamide gel (Novex/ Invitrogen) and transferring the samples to nitrocellulose. The membrane was incubated with primary anti-PARP antibody (BD Transduction Laboratories) overnight at a concentration of 500 ng/ml, then subsequently incubated with an anti-mouse secondary antibody (Amersham Biosciences) following the manufacturer’s recommended protocol. Visualization was achieved on film with the ECL chemiluminescent system (Amersham Biosciences).
DNA Analysis by Flow Cytometry
The DNA content for each sample was determined by flow cytometry as previously described (16). Analysis was carried out using a BD Biosciences FACSort, gating on a PI area versus width dot plot to exclude cell debris and cell aggregates. The percentage of degraded DNA was determined by the number of cells with subdiploid DNA divided by the total number of cells examined under each experimental condition.
Intracellular Sodium and Potassium by Flow Cytometry
For intracellular sodium and potassium measurements, 2 μl of 2.5 mm CoroNa Green-AM (Na+) or PBFI-AM (K+) (Molecular Probes) stock were added to 1 ml of cells for a final concentration of 5 μm 1 h before the time of examination. Incubation was continued at 37 °C, 7% CO2 atmosphere. Immediately before flow cytometric examination, PI (Sigma) was added to a final concentration of 10 μg/ml. 10,000 cells were analyzed by sequential excitation of the cells containing PBFI-AM (K+) or CoroNa Green-AM and PI at 340–350 or 488 nm, respectively, using a FACS-Vantage SE flow cytometer (BD Biosciences) and CellQuest software.
Determination of Intracellular Potassium, Annexin-V Binding, and Electronic Cell Volume by Flow Analysis
Analysis of intracellular potassium, annexin-V binding, and electronic sizing of cells was accomplished using the NPE Quanta Flow Analyzer. Calibration of the electronic volume channel was accomplished as described above. Cells stained with PBFI at 37 °C, 7% CO2 atmosphere for 1 h were tagged with annexin-biotin (Trevigen) as described by the manufacturer. Cells were resuspended in 100 μl of 1× annexin-V binding buffer then stained with 3 μl of 655 streptavidin-conjugated Q-dots (Quantum Dot Corp., Hayward, CA). The samples were incubated for 15 min at room temperature, then 400 μl of 1× annexin-V binding buffer was added to each sample. The cells were immediately examined on the NPE Quanta Flow Analyzer equipped with a mercury arc lamp using a 365-nm exciter. PBFI fluorescence and the 655 streptavidin-conjugated Q-dots were detected using a 450/55 bandpass filter and a 610SP splitter in front of a 640LP filter, respectively. 10,000 cells were examined for each sample, and the data were analyzed using the NPE Quanta software.
Cell Sorting and Determination of Intracellular Potassium by Atomic Absorption
Physical sorting of various cell populations was accomplished using a FACSVantage SE flow cytometer (BD Biosciences) equipped with digital electronics and FACSDiVa software. Sorted cells were collected into chilled 12 × 75 Falcon tubes, previously coated overnight with RPMI 1640 media containing 10% heat-inactivated fetal calf serum. Sorted cells were allowed to recover for ~15 min before pelleting the cells. Cell pellets were resuspended in 0.5 ml of 1× PBS or 170 mm choline chloride, then layered onto 0.5 ml of oil (3 parts 1-bromodecane:7 parts 1-bromododecane), which was layer on top of 200 μl of 15% trichloroacetic acid in a 1.5-ml Eppendorf tube. The tubes were centrifuged horizontally for 30 s in a Beckman Microfuge. After centrifugation, the top aqueous layer and some of the oil layer was removed. The bottom trichloroacetic acid layer containing the contents of the lysed cells was removed with a 1-ml syringe/22-guage needle and saved for atomic absorption analysis. The remaining oil and trichloroacetic acid was removed, and the lysed cell pellet was resuspended in 1 ml of distilled H2O overnight at room temperature before DNA analysis. Analysis of the potassium and sodium content in the trichloroacetic acid fraction was accomplished using a PerkinElmer Life Sciences AA800 flame spectrophotometer. A five-point potassium or sodium standard calibration protocol with standards of known value was used to optimize the instrument. For potassium measurements, each experimental sample was diluted 1:50 in distilled H2O and analyzed twice in triplicate. For sodium measurements, each experimental sample was diluted 1:10 in distilled H2O and analyzed once in triplicate. DNA analysis was accomplished by reading 900 μl of each sample using a Beckman Coulter DU 800 Spectrophotometer. A ratio of potassium or sodium content to DNA was used to calculate a change in intracellular potassium and sodium.
Statistics
Tukey’s multiple comparison tests were accomplished to evaluate the statistical relevance of the control and experimental samples for all apoptotic parameters studied. Tukey’s multiple comparison tests were also done for the FasL- and UV-treated samples in the absence of CB in determining mean cell volume, comparing the high potassium/ high annexin (primary stage) and the low potassium (secondary stage) population of cells to the high potassium/low annexin (normal) population for each sample. Samples treated with CB (high potassium/low annexin (normal) versus high potassium/high annexin (primary stage)) were compared using an unpaired t test.
RESULTS
A Role for the Cytoskeleton in the Morphological Properties of Jurkat T Cells Undergoing Apoptosis
Changes in cellular morphology were determined alone or in combination with cytochalasin B (CB) treatment in Jurkat cells treated with either an extrinsic apoptotic stimulus (FasL) or an intrinsic apoptotic stimulus (UV irradiation). Hoechst 33342-stained Jurkat cells treated with either 50 ng/ml FasL or 60 mJ/cm2 UV in the absence of 5 μm CB for 4 h showed classical apoptotic morphology of cell shrinkage, nuclear condensation, and membrane blebbing characteristic of apoptotic body formation as assessed by differential interference contrast microscopy (Fig. 1A). In the presence of CB, FasL- or UV-treated Jurkat cells also exhibited nuclear condensation similar to apoptotic cells in the absence of CB; however, there was a marked absence of membrane blebbing (Fig. 1A). To verify the disruption of microfilaments after CB treatment, we examined Jurkat cells with an Alexa Fluor 488 phalloidin antibody (for F-actin) and an Alexa Fluor 594 deoxyribonuclease I antibody (for G-actin, see Fig. 1B). Reduced staining for F-actin along with the occurrence of actin aggregates characteristic of microfilament disruption was evident in cells treated with CB alone (21, 22). Furthermore, a complete loss of F-actin staining was observed in cells with condensed nuclei after treatment with an apoptotic stimulus in combination with CB (Fig. 1B). Together, these data indicate that microfilament disruption with CB prevents membrane blebbing and resultant apoptotic body formation but not nuclear condensation in apoptotic Jurkat T cells.
FIGURE 1. Treatment of Jurkat cells with CB prevents apoptotic body formation and show disruption of the actin cytoskeleton during Fas ligand- and UV-induced apoptosis.
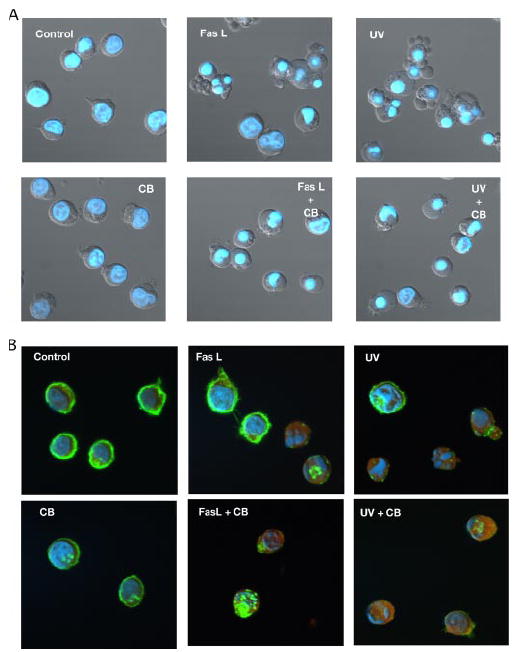
A, Jurkat cells treated with either 50 ng/ml FasL or 60 mJ/cm2 UV in the presence or absence of 5 μm CB for 4 h examined for morphological changes using differential interference contrast microscopy and Hoechst 33342. In the absence of CB, FasL- and UV-treated Jurkat cells showed the classical apoptotic morphology of shrunken cells, nuclear condensation, membrane blebbing, and apoptotic body formation. In contrast, the presence of CB resulted in only the occurrence of shrunken cells and nuclear condensation with the absence of membrane blebbing and apoptotic body formation. B, Jurkat cells treated as above were examined by confocal microscopy in the presence of Alexa Fluor 488 phalloidin (F-actin, green), Alexa Fluor 594 deoxyribonuclease I (G-actin, red), and Hoechst 333421 (blue). In the presence of CB only, Jurkat cells showed a reduced staining for F-actin along with punctate actin aggregates characteristic of microfilament disruption. Induction of apoptosis resulted in the virtual loss of F-actin staining in cells with condensed nuclei.
Disruption of the Actin Cytoskeleton Reveals AVD as a Two-step Process
We also examined FasL- and UV-treated Jurkat cells by flow cytometry to determine whether changes in their light-scattering properties result from microfilament disruption. Light scatter is detected in the forward direction (forward scatter (FSC)) or at a 90° angle (side scatter (SSC)) as a direct measure of cell size or granularity, respectively. In the forward direction, smaller cells have a lower FSC, whereas larger cells have a higher FSC. Analysis of apoptotic stimulation of Jurkat cells with either FasL or UV on a fetal calf serum versus a SSC three-dimensional plot showed a dramatic decrease in forward-scattered light indicative of a loss in cell size (Fig. 2A). In contrast, induction of apoptosis in the presence of CB resulted in a marked reduction in the shrunken population of cells (Fig. 2A, red circles). Similar results were observed when CB was replaced with other actin cytoskeleton-disrupting agents such as cytochalasin D, cytochalasin E, or latrunculin A (data not shown). Interestingly, a distinct intermediate-sized population of cells characterized by a decrease in FSC and an increase in SSC was clearly apparent after apoptotic induction in the presence of CB (Fig. 2A). Changes in cell size during apoptosis were also determined in the presence or absence of CB by examining control and apoptotic Jurkat cells on FSC histograms (Fig. 2B). Margins were drawn on these FSC histograms to distinguish the different populations of cells apparent on the FSC versus SSC three-dimensional plots. This quantitative analysis clearly resolved the presence of two distinct stages of cell shrinkage; that is, a primary stage resulting from an initial loss of cell size not affected by disruption of the cytoskeleton and a secondary stage resulting from a pronounced loss of cell size in cells that is dependent on an intact actin cytoskeleton.
FIGURE 2. Treatment of Jurkat cells with CB unmasks two distinct stages of AVD during FasL- and UV-induced apoptosis.
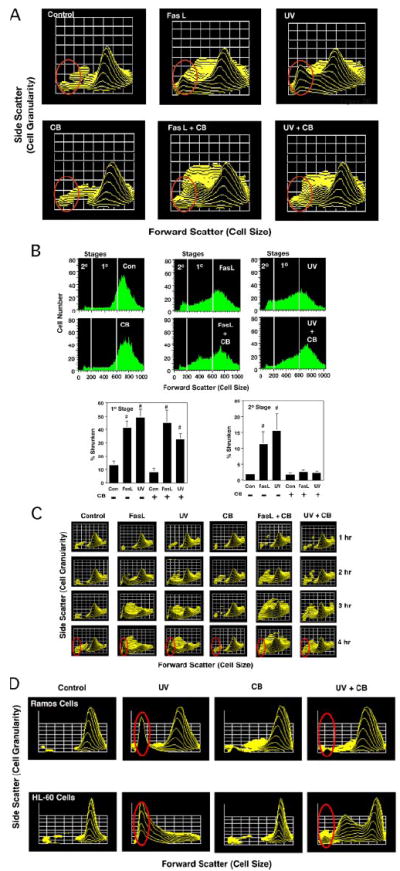
Jurkat cells treated with 50 ng/ml Fas ligand or 60 mJ/cm2 UV in the presence or absence of 5 μm CB for 4 h were examined for changes in cell size by flow cytometry. A, Jurkat cells were initially analyzed on a FSC (cell size) versus SSC (cell granularity) three-dimensional plot. A decrease in FSC indicates a loss in cell size. The red circle denotes the location of a shrunken population in apoptotic-stimulated cells in these three-dimensional plots that is markedly absent in the presence of CB. B, FSC histograms of control (Con) and apoptotic-stimulated Jurkat cells in the presence and absence of CB. The white lines on the plots denote the various stages of cell shrinkage. The bar graphs show the percentage of cells that comprise the various stages of AVD as determined from the FSC histograms and are the average of at least three individual experiments (#, p < 0.05). C, Jurkat cells analyzed over time on a FSC versus SSC three-dimensional plot for the occurrence of stages of AVD. The presence of the secondary stage of AVD occurs as early as 2 h post-treatment and continues to increase over the course of the study. D, Ramos cells and HL-60 cells after a 4-h treatment with 120 or 20 mJ/cm2 UV, respectively, in the presence and absence of CB, analyzed for the occurrence of stages of AVD. Similar to the Jurkat cells, CB prevents the secondary stage of AVD.
We also examined Jurket cells for the presence of both these stages of AVD over time in response to FasL or UV alone or in the presence of CB (Fig. 2C). Our data show a time-dependent increase in the secondary stage of AVD upon apoptotic stimulation with either agent beginning around 2 h after treatment, which is prevented by CB. Additionally, we examined other cell types for these stages of AVD. Both Ramos cells (a human B-lymphocyte) and HL-60 cells (human promyelocytic leukemia) also showed two distinct stages of AVD upon induction of apoptosis in the absence of CB (Fig. 2D). Interestingly, inclusion of CB prevented the secondary stage of AVD, suggesting that the occurrence of AVD stages is not cell type-specific.
AVD Stage-specific Characteristics of Apoptosis
Various other characteristics of apoptosis were also evaluated in regard to the primary and secondary stage of AVD. Examination of phosphatidylserine externalization showed a significant change in the percentage of apoptotic Jurkat cells compared with control cells regardless of the presence or absence of CB (Fig. 3A). Interestingly, the effects of microfilament disruption on changes in the mitochondrial membrane potential were similar to the results shown for phosphatidylserine externalization since a loss of mitochondrial membrane potential was also observed in response to apoptotic stimulation in the presence of CB (Fig. 3B). We also examined caspase-3-like activity in these cells and observed that this enzyme activity was also independent of CB (Fig. 3C), suggesting that caspase activity is associated with the primary stage of AVD. These effects are likely not cell type-specific as both Ramos and HL-60 cells also showed enhanced phosphatidylserine externalization and caspase activity in the presence of CB (Tables 1 and 2). Note, however, that in contrast to Jurkat and Ramos cells, the percentage of caspase-positive cells in UV-treated HL-60 cells was initially low. This observation likely reflects the loss of detectable caspase-3-like activity in these cells unless CB is present to inhibit progression to the secondary stage of AVD (see Fig. 2D). Thus, caspase-positive cells accumulate in HL-60 cells in the presence of CB during the primary stage of AVD (Table 2). Furthermore, the caspases in Jurkat cells were shown to be functional since they cleave their respective substrates as measured by the cleavage of PARP during FasL- or UV-induced apoptosis in the presence or absence of CB (Fig. 3D). In contrast, DNA degradation was significantly inhibited in the presence of CB upon induction of apoptosis by either the intrinsic or extrinsic pathway (Fig. 3E). Together these data show that several classical characteristics of apoptosis occur in conjunction with a cytoskeleton-independent, primary stage of AVD during the programmed cell death program, whereas DNA degradation and apoptotic body formation are restricted to the secondary stage of AVD that relies on an intact actin cytoskeleton network.
FIGURE 3. Externalization of phosphatidylserine, loss of mitochondrial membrane potential, caspase activity, and PARP cleavage but not DNA degradation occurs in FasL- or UV-treated Jurkat cells in the presence of CB.
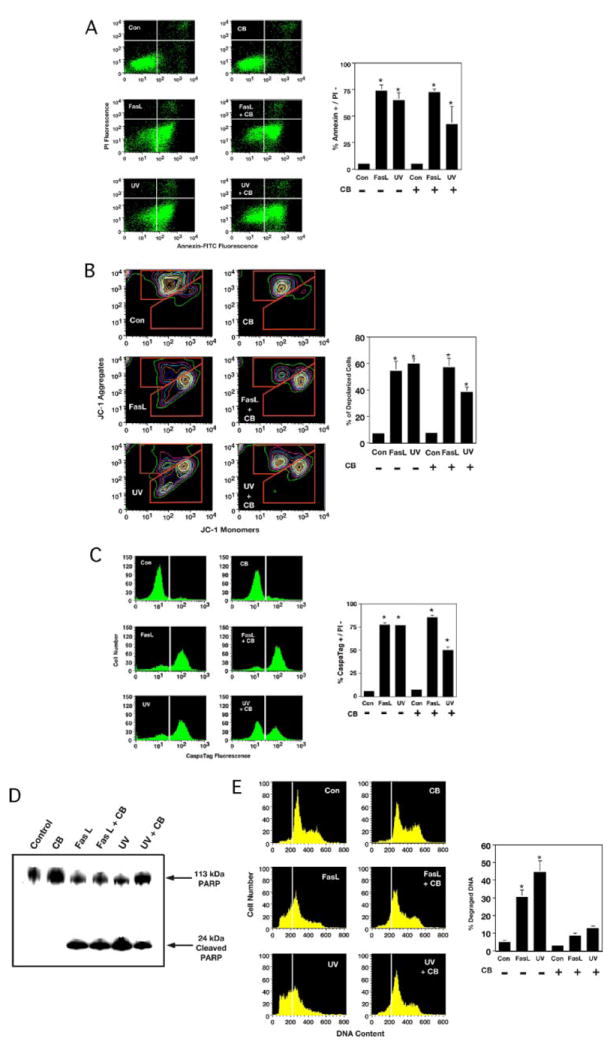
Jurkat cells treated with 50 ng/ml Fas ligand or 60 mJ/cm2 UV in the presence or absence of 5 μm CB for 4 h were examined for various apoptotic characteristics. A, externalization of phosphatidylserine using annexin-V-fluorescein isothiocyanate and flow cytometry. An increase in the number of cells that had an increased annexin-V-fluorescein isothiocyanate fluorescence before the loss of membrane integrity (lower right-hand quadrant) occurred independent of CB. The dot plots represent a single experiment, and percents on the graph are the average from three independent experiments. B, changes in the mitochondrial membrane potential were examined by flow cytometry using JC-1. Cells that have a depolarized mitochondrial membrane have an increased monomeric fluorescence while having a simultaneous decreased aggregate fluorescence. FasL- or UV-treated Jurkat cell in the presence of CB showed a similar loss of mitochondrial membrane potential compared with analogous samples in the absence of CB. The contour plots represent a single experiment, and the percents on the graph are the average number of depolarized cells from three independent experiments. C, caspase-3-like activity measured using a fluorescent caspase substrate. An increase in the number of cells that are caspase-positive occurred independent of CD. The histograms represent a single experiment, and percents on the graph are the average of three independent experiments. D, Western blot analysis for PARP cleavage. Protein extracts from FasL- or UV-treated Jurkat cells in the presence or absence of CB showed a similar cleavage of PARP resulting in the occurrence of a 24-kDa protein band. E, examination of DNA content by flow cytometry. The occurrence of degraded DNA is shown below the G1 DNA peak (white line). The histograms represent a single experiment, and the percents on the graph are the average number of cells with subdiploid DNA from three independent experiments (*, p < 0.001).
TABLE 1.
Changes in phosphatidylserine externalization, caspase-3-like activity, and intracellular potassium in UV-treated Ramos cells
| Ramos cells | % Annexin+/PI− | % CaspaTag+ | % Low K+ |
|---|---|---|---|
| Control | 3.67 ± 0.84 | 7.03 ± 1.36 | 5.70 ± 0.56 |
| 120 mJ/cm2 UV | 55.70 ± 3.27 | 67.50 ± 4.39 | 24.83 ± 2.81 |
| 2.5 μm CB | 14.13 ± 2.15 | 11.20 ± 0.69 | 13.20 ± 2.03 |
| UV + CB | 64.83 ± 7.21 | 70.20 ± 4.15 | 11.80 ± 0.78 |
TABLE 2.
Changes in phosphatidylserine externalization, caspase-3-like activity, and intracellular potassium in UV-treated HL-60 cells
| HL-60 cells | % Annexin+/PI− | % CaspaTag+ | % Low K+ |
|---|---|---|---|
| Control | 1.93 ± 0.22 | 10.77 ± 1.58 | 7.27 ± 1.84 |
| 20 mJ/cm2 UV | 29.27 ± 2.19 | 13.16 ± 2.58 | 46.93 ± 1.29 |
| 5 μm CB | 2.33 ± 0.34 | 6.45 ± 0.30 | 5.57 ± 0.61 |
| UV + CB | 31.00 ± 1.22 | 47.46 ± 5.11 | 6.90 ± 0.83 |
Reversal of Intracellular Sodium and Potassium Occurs during the Primary Stage of AVD
The loss of cell volume during apoptosis (AVD) has been suggested to reflect a loss of intracellular ions, specifically potassium and sodium. Having identified two stages of AVD, we tested the hypothesis that changes in intracellular ions would occur selectively during these two stages. Jurkat cells treated with FasL or UV in the presence or absence of CB were initially examined for changes in intracellular ions using fluorescent ionic dyes and flow cytometry. Analysis of intracellular sodium by flow cytometry showed an increase in CoroNa Green-AM (Na+) fluorescence after FasL or UV treatment regardless of the presence or absence of CB, indicating the increase in intracellular sodium is independent of actin cytoskeleton disruption (Fig. 4A). Interestingly, the number of cells with increased intracellular sodium was enhanced in the presence of CB, indicating that the disruption of the actin cytoskeleton prevents the eventual loss of intracellular sodium during the late stage of apoptosis. In contrast, CB inhibited the dramatic loss of PBFI-AM fluorescence after apoptotic stimulation (Fig. 4B), suggesting that the major loss of intracellular potassium is dependent on a functional actin cytoskeleton network. The inhibition of intracellular potassium loss in the presence of CB was also observed for both Ramos (Table 1) and HL-60 (Table 2) cells undergoing apoptosis. These data support the conclusion that the loss on intracellular potassium is dependent on a functional actin cytoskeleton network.
FIGURE 4. Stages of AVD are reflected in the response of CoroNa Green-AM (Na+) and PBFI-AM (K+) to measure changes in intracellular sodium and potassium in apoptotic Jurkat cells.
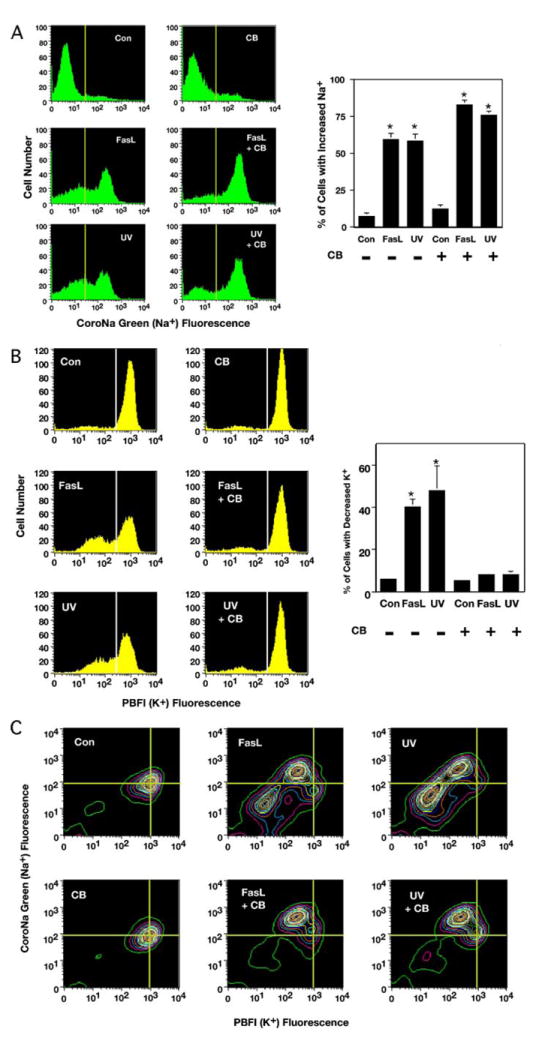
Jurkat cells treated with 50 ng/ml FasL or 60 mJ/cm2 UV in the presence or absence of 5 μm CB for 4 h were examined for changes in intracellular ions by flow cytometry. A, analysis of sodium using CoroNa Green-AM (Na+) showed an increase in intracellular sodium in apoptotic-stimulated cells regardless of the presence or absence of CB. Interestingly, this increase in intracellular sodium upon apoptotic stimulation was enhanced in the presence of CB. The histograms represent a single experiment, and the percents on the graph are the average number of three independent experiments (*, p < 0.001). B, analysis of potassium using PBFI-AM (K+) showed an efflux of intracellular potassium in the absence of CB. In contrast, cells treated with CB had a marked inhibition of intracellular potassium efflux upon induction of apoptosis (*, p < 0.001). C, simultaneous analysis of potassium and sodium using PBFI-AM (K+) and CoroNa Green-AM (Na+), respectively. Treated Jurkat cells that had an increase in intracellular sodium and a concurrent decrease in intracellular potassium regardless of the presence or absence of CB. The presence of CB prevented the continual loss of intracellular ions.
To examine the precise relationship between intracellular potassium and intracellular sodium, we examined apoptotic cells in the presence of both PBFI-AM and CoroNa Green-AM. Simultaneous analysis of both sodium and potassium in Jurkat cells treated with FasL or UV unmasked a population of cells with an increase in intracellular sodium that had a concurrent decrease in intracellular potassium independent of CB (Fig. 4C), not previously recognized by single parameter analysis (Fig. 4, A and B). This movement of ions preceded the eventual decrease in intracellular concentration of both cations that was dependent on the actin cytoskeleton (Fig. 4C). The unique initial decrease of intracellular potassium coupled with an increase in intracellular sodium suggests a reversal of the normal cationic gradients that occurs at an early stage of apoptosis; thus, during the primary stage of AVD. These data support the notion that the loss of intracellular potassium occurs in two stages, an initial stage independent of the actin cytoskeleton and a second stage requiring a functional cytoskeleton network identical to the defined stages of AVD.
Direct Measurements of Changes in Cell Volume for the Primary and Secondary Stage of AVD during Apoptosis
Precise changes in cell volume were determined during both primary and secondary stages of AVD by simultaneously analyzing changes in the externalization of the phosphatidylserine and PBFI-AM fluorescence to isolate cells before and during the various stages of AVD using a flow cytometer with electronic cell sizing. Treatment of Jurkat cells with FasL or UV in the presence or absence of CB resulted in the appearance of a population of cells with increased annexin-V fluorescence (Fig. 5A, shown in green), representing the primary stage of apoptosis. In the absence of CB, a second population of cells was evident that had increased annexin-V fluorescence along with the major loss of PBFI-AM (K+) fluorescence (Fig. 5A, shown in blue), representing the secondary stage of apoptosis. A change in MCV was determined for cells representing these stages of AVD by individually gating the various cell populations. Fig. 5B shows the annexin-V positive/high PBFI cells (primary stage; green bars) have a significant decrease in mean cell volume compared with their respective control cells regardless of CB treatment. In the absence of CB, the annexin-V-positive/low PBFI cells (secondary stage; blue bars) show a further decrease in mean cell volume (Fig. 5B). The percentage of change in MCV was calculated for each of these populations of cells and is shown in Fig. 5C. Cells in the primary stage of AVD in the absence of CB have a 40–45% decrease in MCV in response to either FasL or UV, whereas primary stage cells in the presence of CB had a MCV decrease of ~20% that was independent of the stimulus used to induce apoptosis. Finally, cells in the secondary stage of AVD showed a consistent decrease in MCV that was also independent of the apoptotic stimulus (Fig. 5C).
FIGURE 5. Determination of mean cell volume and percentage of change in mean cell volume by the simultaneous examination of intracellular potassium and externalization of phosphatidylserine in apoptotic-stimulated Jurkat cells in the presence and absence of CB.
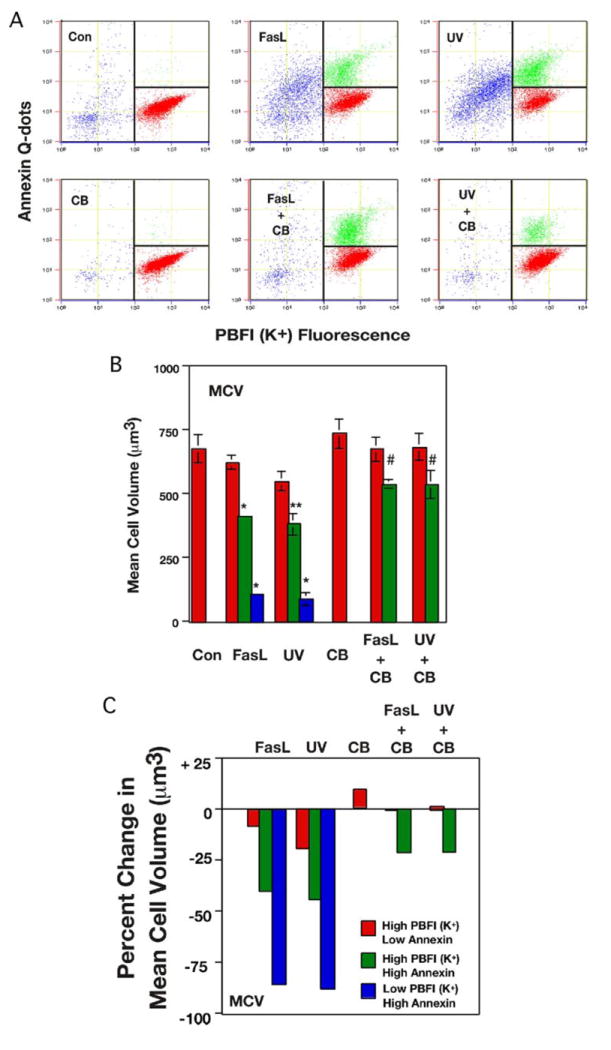
A, Jurkat cells treated with 25 ng/ml Fas ligand or 30 mJ/cm2 UV in the presence or absence of 5 μm CB for 4 h were examined for changes in intracellular potassium using PBFI-AM and externalization of phosphatidylserine using biotinylated annexin-V and streptavidin Q dots by NPE cell analysis. In the absence of CB, three distinct populations of cells are observed corresponding to the normal cells (red), the primary stage of AVD (green), and the secondary stage of AVD (blue). In the presence of CB, only the normal (red) and primary stage of AVD (green) cells were observed. The dot plots represent a single experiment of three independent experiments. B, distinct populations of cells were analyzed for changes in their MCV (μm3) using a calibrated scale for the electronic cell size. For each experimental condition, the high potassium/low annexin population is shown in red, the high potassium/high annexin populations is shown in green, and the population of cells with a major loss of intracellular potassium is shown in blue. A clear decrease in MCV was observed based on both the externalization of the phosphatidylserine and the loss of intracellular potassium for each population of cells. The bars represent the average number of three independent experiments (*, p < 0.001; **, p < 0.01; #, p < 0.05). C, percentage of change in MCV for the various stages of AVD in the presence and absence of CB. The control untreated Jurkat cells were used as the standard to which all other populations of cells were compared.
Direct Measurements of Intracellular Potassium and Sodium during the Primary Stage of AVD
Knowing a cationic reversal of intracellular sodium and potassium occurs during the primary stage of AVD, our interest was to determine the extent of this unprecedented ionic exchange using an independent approach that does not rely on the use of dye binding. Thus, we physically sorted various populations of apoptotic cells and directly measured the intracellular potassium and sodium concentration using atomic absorption spectroscopy, taking advantage of the inability of the cells to degrade their DNA in the presence of CB to normalize the recovered population of sorted cells. As shown in Table 1, the high PBFI-AM/annexin-positive population of cells (Fig. 5A, green cells) representing apoptotic cells during the primary stage of AVD had an intracellular potassium and sodium concentration of 30.0 and 113.6 mm, respectively. These ionic concentrations for Jurkat cells exposed to an apoptotic stimulus reflect a previously undescribed cationic imbalance that occurs during this early stage of apoptosis. The high PBFI-AM/annexin negative population that represents treated but pre-apoptotic cells (Fig. 5A, red cells) also had a slight decrease in intracellular potassium concentration while having a slight increase in intracellular sodium concentration (133.8 and 26.2 mm, respectively, Table 1). These data suggest that the redistribution of ions may begin to occur before any previously known defined characteristic of apoptosis. Together these data show an early reversal of the intracellular ionic gradients during apoptosis that is both initiated and sustained during the primary stage of AVD.
DISCUSSION
Apoptosis is a dynamic energy requiring process in which a cascade of events leads to destruction of single cells without eliciting an immunological response. Because of the stochastic nature of the cell death program and the lack of understanding of the interrelationship among various apoptotic characteristics, separation of one apoptotic event from another has been difficult using mass cell culture and biochemical approaches. The loss of cell volume during apoptosis or AVD is a classical feature of programmed cell death that has been thought to reflect a redistribution of intracellular ions. Here we show that the loss of cell volume or AVD during apoptosis takes place in stages and occurs in concert with other identifiable characteristics of programmed cell death through both the intrinsic (mitochondrial) or extrinsic (death receptor) pathway. Additionally, we demonstrate for the first time an early cationic imbalance resulting in a reversal of intracellular ions as a novel event during a primary stage of AVD. This event is independent of an early disruption of the cytoskeleton. In contrast, actin cytoskeleton interference results in the absence of the secondary stage of AVD along with the latter loss of both intracellular sodium and potassium.
The primary stage of AVD showed a distinct loss of cell volume (20–40%) coupled to a unique reversal of intracellular cationic concentrations. Direct analysis of intracellular ion concentrations during this primary stage of AVD revealed an ionic imbalance with a decrease in intracellular potassium (30 mm) coupled to an increase in intracellular sodium (113 mm). This finding indicates that during the initial stage of apoptosis, the loss of one ion (potassium) may be compensated by the gain of another ion (sodium) in perhaps the attempt of the cells to maintain viability. Interestingly, this apparent type of a potential survival response during an early stage of apoptosis appears to differ significantly from inherent volume regulatory mechanisms that results from cell shrinkage upon exposure to a hypertonic environment (27-29). Cell shrinkage induced by a hypertonic condition is initially compensated by the activation of various sodium transport mechanisms to regain a near normal cell size. Over time, the intracellular sodium is exchanged for potassium through the activation of the Na+/K+-ATPase that in turn restores the normal, homeostatic intracellular ionic balance. However, we report here that during the early stage of apoptosis, a simultaneous exchange of intracellular potassium and sodium occurs.
Although the precise ionic transport mechanisms responsible for these unique ion fluxes are not known, we and others have suggested a role for the Na+/K+-ATPase during apoptosis. Inhibition of the Na+/K+-ATPase during apoptosis may account in part for this reversal of intracellular ions (12, 30, 31). Impairing the function of this energy-dependent ionic transport mechanism (that exchanges three intracellular Na+ ions for two external K+ ions) would result in an increase in intracellular sodium along with a simultaneous decrease in intracellular potassium. Interestingly, inhibition of the Na+/K+-ATPase with ouabain significantly enhances anti-Fas induced apoptosis in Jurkat cells (12).
Our data also suggest that this early imbalance of ions may occur before any detectable characteristic of apoptosis. Cells treated with an apoptotic stimulus that have not yet externalized their phosphatidylserine have a slight decrease in intracellular potassium concentration along with a concomitant increase in intracellular sodium concentration (Table 3). Given the stochastic nature of apoptosis, this ion redistribution in these pre-apoptotic cells likely reflects a small subset of cells that have completely reversed their intracellular ions at this time rather than a general, gradual change in intracellular ions in the entire population of pre-apoptotic cells.
TABLE 3.
Determination of the intracellular potassium and sodium concentrations in control and treated (apoptotic) Jurkat cells
| Sorted populations | K+ concentrationa | Na+ concentrationa |
|---|---|---|
| Untreated control | 139.5 mm | 12.0 mm |
| Treated pre-apoptotic | 95.9 ± 8.2 mmb (n = 4) | 26.2 ± 5.8 mm (n = 5) |
| Treated apoptotic | 30.0 ± 6.4 mmb (n = 6) | 113.6 ± 28.9 mmb (n = 5) |
The mean of the untreated control DNA divided by the mean of the treated pre-apoptotic or treated apoptotic DNA was used to normalize for variations in the number of cells examined for each sample. The measured ionic values were multiplied by this normalization factor, and the percent change in ions from the untreated control was determined for each sample. Calculated ion concentrations assume 139.5 or 12 mm intracellular potassium or sodium, respectively, with an average cell diameter of 12 μm. Thus, the total number of K+ or Na+ molecules per cell equals 7.602 × 10¹⁰ or 6.54 × 10⁹ molecules, respectively, with a single cell volume of 9.05 × 10⁻¹³ liters. For each sample the molecules of each ion were determined by multiplying the total number of ion molecules in an average cell by the % change in ions from the measured values. The cell volume was determined by multiplying the single cell volume by the % original MCV (from Fig. 5) for each population of cells. The following equation was then used to calculate the intracellular K+ or Na+ concentration: molecules K+ (or Na+)/1 cell × 1 mol/6.02 × 1023 molecules × 1 cell/cell volume (liters) = K+ or N+ (m).
Significant at p < 0.05 using a one-sample t test versus the untreated control.
Although our data suggest that compensatory ionic transport mechanisms may be activated at an early stage in an attempt to maintain a near normal cell size during the cell death program, an overall decrease in total intracellular ionic strength occurs (151.5 mm total Na+/K+ concentration in normal cells versus 143.6 mm total Na+/K+ concentration during the primary stage of AVD). Interestingly, the activation of caspases has been shown to be inquisitively sensitive to the intracellular ionic strength (14, 15, 17). Thus, a decrease in total intracellular ionic strength of this magnitude would likely permit the activation of the caspase cascade as we observed during the primary stage of AVD. Once activated, caspase activity is independent of the overall intracellular ionic strength (17), suggesting that a continual decrease in intracellular ionic strength would not be required to sustain the apoptotic death cascade. Therefore, an initial decrease in intracellular ionic strength as observed during the primary stage of AVD may be sufficient to trigger the entire caspase cascade during apoptosis. Furthermore, other characteristics of apoptosis such as chromatin condensation, externalization of phosphatidylserine, loss of mitochondrial membrane potential, and PARP cleavage might also be expected to occur during the primary stage of AVD, since as we show, they are independent of actin cytoskeleton disruption in a variety of cell types.
In contrast, other characteristics of apoptosis such as apoptotic body formation and DNA degradation were a characteristic of the secondary stage of AVD and were dependent on an ordered cytoskeleton. This secondary stage of volume loss is marked by an additional decrease in cell volume linked to the major loss of potassium and sodium despite an intact plasma membrane. Apoptotic nuclease activity has also been shown to be directly dependent on ionic strength (17) and would require a more extensive loss of intracellular ions than reported here during the primary stage of AVD. Our data support the idea DNA degradation would only occur with a further decrease in ionic strength resulting from the loss of both sodium and potassium as observed during the secondary stage of AVD. Our data also support the premise that the ionic fluxes observed during apoptosis, particularly the loss of intracellular potassium, does not result via a single ionic transport mechanism but, rather, multiple pathways that cooperate to achieve the ionic imbalance we have identified.
Our initial hypothesis was that the actin cytoskeleton would play a major role in all the ionic pathways associated with AVD; thus, our disruption of the actin cytoskeleton unmasked an early or primary stage of apoptosis that was not previously identifiable and was clearly independent of an intact cytoskeleton. This discovery allowed the identification of individual ion fluxes associated with either the primary or secondary stage of AVD. Our direct measurement of intracellular potassium concentration during the primary stage of apoptosis reported in this study (30 mm) is consistent with previous reports for an apoptotic concentration of intracellular potassium (16, 17, 32, 33). Here we now directly measured the intracellular sodium concentration in cells during the primary stage of AVD and observed that this ion reaches a level of ~113 mm inside the cell that, concomitant with the decrease in intracellular potassium concentration, reverses the normal intracellular ionic gradient of these cations. Thus, our studies have identified two discrete stages of AVD that are characterized by distinct morphological and biochemical features of apoptosis. The normal tight control of cationic ion fluxes in regard to changes in cell volume is loss, resulting in improper regulation and the eventual decrease in intracellular ionic strength, decrease in cell volume, and cell death.
Footnotes
This research was supported by the Intramural Research Program of the NIEHS, National Institutes of Health.
The abbreviations used are: AVD, apoptotic volume decrease; PBS, phosphate-buffered saline; FasL, Fas ligand; PI, propidium iodide; CB, cytochalasin B; FSC, forward scatter; SSC, side scatter; PARP, poly(A)DP-ribose polymerase; PBFI, potassium binding benzofuran isophthalate.
References
- 1.Kerr JF, Wyllie AH, Currie AR. Br J Cancer. 1972;26:239–257. doi: 10.1038/bjc.1972.33. [DOI] [PMC free article] [PubMed] [Google Scholar]
- 2.Hengartner MO. Nature. 2000;407:770–776. doi: 10.1038/35037710. [DOI] [PubMed] [Google Scholar]
- 3.Jiang X, Wang X. Annu Rev Biochem. 2004;73:87–106. doi: 10.1146/annurev.biochem.73.011303.073706. [DOI] [PubMed] [Google Scholar]
- 4.Riedl SJ, Shi Y. Nat Rev Mol Cell Biol. 2004;5:897–907. doi: 10.1038/nrm1496. [DOI] [PubMed] [Google Scholar]
- 5.Lauber K, Bllumenthal SG, Waibel M, Wesselborg S. Mol Cell. 2004;14:277–287. doi: 10.1016/s1097-2765(04)00237-0. [DOI] [PubMed] [Google Scholar]
- 6.Maeno E, Ishizaki Y, Kanaseki T, Hazama A, Okada Y. Proc Natl Acad Sci U S A. 2000;97:9487–9492. doi: 10.1073/pnas.140216197. [DOI] [PMC free article] [PubMed] [Google Scholar]
- 7.Bortner CD, Cidlowski JA. Pfluegers Arch Eur J Physiol. 2004;448:313–318. doi: 10.1007/s00424-004-1266-5. [DOI] [PubMed] [Google Scholar]
- 8.Barros LF, Castro J, Bittner CX. Biol Res. 2002;35:209–214. doi: 10.4067/s0716-97602002000200012. [DOI] [PubMed] [Google Scholar]
- 9.Bortner CD, Cidlowski JA. Annu Rev Pharmacol Toxicol. 2002;42:259–281. doi: 10.1146/annurev.pharmtox.42.083101.143836. [DOI] [PubMed] [Google Scholar]
- 10.Yu SP, Choi DW. Proc Natl Acad Sci U S A. 2000;97:9360–9362. doi: 10.1073/pnas.97.17.9360. [DOI] [PMC free article] [PubMed] [Google Scholar]
- 11.Bortner CD, Cidlowski JA. Biochem Pharmocol. 1998;56:1549–1559. doi: 10.1016/s0006-2952(98)00225-1. [DOI] [PubMed] [Google Scholar]
- 12.Bortner CD, Gomez-Angelats M, Cidlowski JA. J Biol Chem. 2001;276:4304–4314. doi: 10.1074/jbc.M005171200. [DOI] [PubMed] [Google Scholar]
- 13.Bortner CD, Cidlowski JA. J Biol Chem. 2003;278:39176–39184. doi: 10.1074/jbc.M303516200. [DOI] [PubMed] [Google Scholar]
- 14.Cain K, Langlais C, Sun XM, Brown DG, Cohen GM. J Biol Chem. 2001;276:41985–41990. doi: 10.1074/jbc.M107419200. [DOI] [PubMed] [Google Scholar]
- 15.Thompson GJ, Langlais C, Cain K, Conley EC, Cohen GM. Biochem J. 2001;357:137–145. doi: 10.1042/0264-6021:3570137. [DOI] [PMC free article] [PubMed] [Google Scholar]
- 16.Bortner CD, Hughes FM, Jr, Cidlowski JA. J Biol Chem. 1997;272:32436–32442. doi: 10.1074/jbc.272.51.32436. [DOI] [PubMed] [Google Scholar]
- 17.Hughes FM, Jr, Bortner CD, Purdy GD, Cidlowski JA. J Biol Chem. 1997;272:30567–30576. doi: 10.1074/jbc.272.48.30567. [DOI] [PubMed] [Google Scholar]
- 18.Papakonstanti EV, Vardaki EA, Stournaras C. Cell Physiol Biochem. 2000;10:257–264. doi: 10.1159/000016366. [DOI] [PubMed] [Google Scholar]
- 19.Sheng M, Pak DT. Annu Rev Physiol. 2000;62:79–109. doi: 10.1146/annurev.physiol.62.1.755. [DOI] [PubMed] [Google Scholar]
- 20.Cotter TG, Lennon SV, Glynn JM, Green DR. Cancer Res. 1992;52:997–1005. [PubMed] [Google Scholar]
- 21.Morley SC, Sun GP, Bierer BE. J Cell Biochem. 2003;88:1066–1076. doi: 10.1002/jcb.10449. [DOI] [PubMed] [Google Scholar]
- 22.Levee MG, Dabrowska MI, Lelli JL, Hinshaw DB. Am J Physiol. 1996;271:C1981–C1992. doi: 10.1152/ajpcell.1996.271.6.C1981. [DOI] [PubMed] [Google Scholar]
- 23.Maruyama W, Irie S, Sato TA. Histochem J. 2000;32:495–503. doi: 10.1023/a:1004104619154. [DOI] [PubMed] [Google Scholar]
- 24.Yamazaki Y, Tsuruga M, Zhou D, Fujita Y, Shang X, Dang Y, Ka-wasaki K, Oka S. Exp Cell Res. 2000;259:64–78. doi: 10.1006/excr.2000.4970. [DOI] [PubMed] [Google Scholar]
- 25.Grzanka A, Grzanka D, Orlikowska M. Biochem Pharmacol. 2003;66:1611–1617. doi: 10.1016/s0006-2952(03)00532-x. [DOI] [PubMed] [Google Scholar]
- 26.Domnina LV, Ivanova OY, Pletjushkina OY, Fetisova EK, Chernyak BV, Skulachev VP, Vasiliev JM. Cell Biol Int. 2004;28:471–475. doi: 10.1016/j.cellbi.2004.03.017. [DOI] [PubMed] [Google Scholar]
- 27.Lang F, Ritter M, Gamper N, Huber S, Fillon S, Tanneur V, Lepple-Wienhues A, Szabo I, Gulbins E. Cell Physiol Biochem. 2000;10:417–428. doi: 10.1159/000016367. [DOI] [PubMed] [Google Scholar]
- 28.Gomez-Angelats M, Bortner CD, Cidlowski JA. Cell Tissue Res. 2000;301:33–42. doi: 10.1007/s004410000216. [DOI] [PubMed] [Google Scholar]
- 29.Hoffmann EK, Dunham PB. Int Rev Cytol. 1995;161:173–262. doi: 10.1016/s0074-7696(08)62498-5. [DOI] [PubMed] [Google Scholar]
- 30.Mann CL, Bortner CD, Jewell CM, Cidlowski JA. Endocrinology. 2001;142:5059–5068. doi: 10.1210/endo.142.12.8516. [DOI] [PubMed] [Google Scholar]
- 31.Nobel CS, Aronson JK, van den Dobbelsteen DJ, Slater AF. Apoptosis. 2000;5:153–163. doi: 10.1023/a:1009684713784. [DOI] [PubMed] [Google Scholar]
- 32.Barbiero G, Duranti F, Bonelli G, Amenta JS, Baccino FM. Exp Cell Res. 1995;217:410–418. doi: 10.1006/excr.1995.1104. [DOI] [PubMed] [Google Scholar]
- 33.Benson RS, Heer S, Dive C, Watson AJ. Am J Physiol. 1996;270:C1190–C1203. doi: 10.1152/ajpcell.1996.270.4.C1190. [DOI] [PubMed] [Google Scholar]