Abstract
We report here the synthesis and characterization of polydiacetylene (PDA) films and nanotubes using layer-by-layer (LBL) chemistry. 10,12-Docosadiyndioic acid (DCDA) monomer was self-assembled on flat surfaces and inside of nanoporous alumina templates. UV irradiation of DCDA provided polymerized-DCDA (PDCDA) films and nanotubes. We have used zirconium-carboxylate interlayer chemistry to synthesize PDCDA multilayers on flat surfaces and in nanoporous template. PDCDA multilayers were characterized using optical (UV–vis, fluorescence, ellipsometry, FTIR) spectroscopies, ionic current–voltage (I–V) analysis, and scanning electron microscopy. Ellipsometry, FTIR, electronic absorption and emission spectroscopies showed a uniform DCDA deposition at each deposition cycle. Our optical spectroscopic analysis indicates that carboxylate-zirconium interlinking chemistry is robust. To explain the disorganization in the alkyl portion of PDCDA multilayer films, we propose carboxylate-zirconium interlinkages act as “locks” in between PDCDA layers which restrict the movement of alkyl portion in the films. Because of this locking, the induced-stresses in the polymer chains can not be efficiently relieved. Our ionic resistance data from I–V analysis correlate well with calculated resistance at smaller number of PDCDA layers but significantly deviated for thicker PDCDA nanotubes. These differences were attributed to ion-blocking because some of the PDCDA nanotubes were totally closed and the nonohmic and permselective ionic behaviors when the diameter of the pores approaches the double-layer thickness of the solution inside of the nanotubes.
Introduction
The large-scale one-dimensional nanoscale template-assisted materials synthesis with control over diameter and length of the synthesized nanomaterials is a simple and powerful method.1–3 This synthetic method has found applications in many technological areas including bioseparation, sensing, lithography, and alternative energy applications.4–20 The most commonly used templates are nanoporous alumina, polymeric, and glass membranes because they are commercially available with a range of pore diameters. Depending on the deposition method used, the template-synthesized nanomaterials inside of the templates can be hollow tubes or solid wires or rods.1 In general, the use of electroless-metal deposition inside of a template can provide hollow nanotubes whereas the electro-deposition method yields solid nanowires or nanorods.1 The thickness and the inner pore diameter of the template dictate the length and the outer diameter of the synthesized nanoparticles respectively. The control over inner nanopore diameter is crucial for many applications such as chemical and biochemical separation and biosensing; nanomaterials synthesis using nanopores as templates; and in nanoelectronics and -optics. It is shown that the inner diameter of the synthesized nanoparticles can be tuned to <1 nm by controlling the electroless plating time of gold.1a Other methods such as LBL deposition of small molecules and proteins in nanoporous templates have also been used to control the inner diameter of the nanoparticles.21–25 LBL deposition is a very simple method for the synthesis of ultrathin films with control over film thickness by controlling the chemical structure of the molecules and number of deposited layers.26 The interactions between layers can be ionic, covalent, hydrogen-bonding, and charge-transfer depending upon the nature of the molecules (and polymer) used in the preparation.26 The interactions between metal ions (such as zirconium, hafnium, copper, cadmium, silver, nickel) and acid groups (such as phosphonate, phosphate, carboxylate, and sulfonate) have been extensively used as the interlayer linking chemistry for the synthesis of highly stable multilayered films.27–34 For example, because of very low solubility products and high stability, [Zr4+][PO32−] and [Zr4+][CO3–] have been used for the synthesis of LBL multilayers.32–39 By controlling the number of zirconium-α,ω-bisorganophosphonate layers, Martin’s group demonstrated the control over inner pore diameter with high precision (±1.7 nm).21 Similarly, the nanotubes of protein, nucleic acids, polyelectrolytes (PE), and protein/PE were synthesized using LBL deposition method inside of a nanoporous template.22–25 Here, we report the synthesis and characterization of self-assembled DCDA nanotubes (see Scheme 1 for the chemical structure of DCDA). The diacetylene monomers were self-assembled on the inner walls of the template nanopores and zirconium-carboxylate interlayer chemistry was used to synthesize the multilayers. The photoirradiation of the DCDA yielded PDCDA nanotubes and films. The characterization of multilayers was performed on flat surfaces (such as gold, glass and quartz) and inside of alumina templates. Ellipsometry, UV–vis, and emission spectroscopic analysis were performed on flat surfaces to investigate if the deposition of molecules was uniform from one layer to another. The PDCDA nanotube size and morphology were also characterized using scanning electron microscopy and ionic current–voltage (I–V) analysis. The PDCDA nanotubes synthesized here have potential applications in sensing and photovoltaic applications.
Scheme 1.
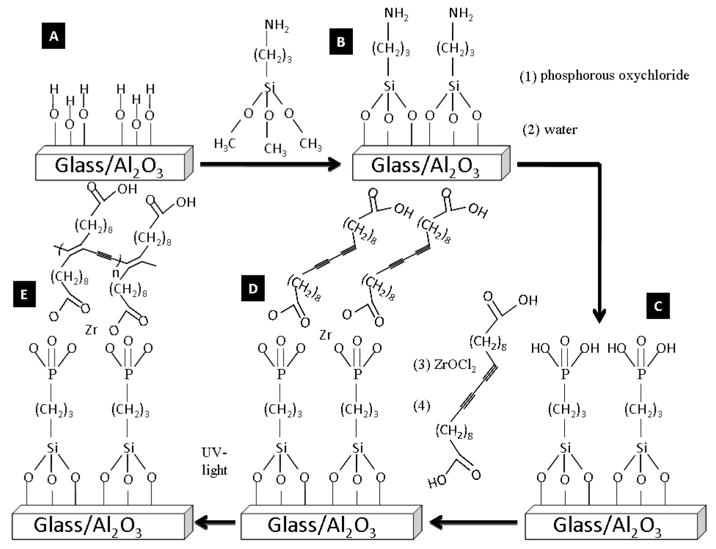
Scheme for the Formation of PDCDA Nanotubes in a Nanoporous Alumina Template and Multilayer Films on Flat Surfaces
Experimental Section
Layer-by-Layer Deposition Procedure
The diacetylene monomer DCDA (95%) was purchased from GFS chemicals. All other chemicals were purchased from Aldrich and were used as received. Commercially available alumina Anodisc templates (pore diameter 100–300 nm, Anodisc is a registered trademark of Whatman Inc.) were purchased from Whatman International. Scheme 1 shows various steps used for the synthesis of PDCDA multilayers. The glass, quartz, and gold substrates were cleaned of organic contaminants by soaking them in piranha solution prepared by mixing 3:1 concentrated sulfuric acid with hydrogen peroxide (30%) for 20 min. Caution: The piranha solution is a highly energetic oxidizer. It reacts very violently with organic materials, and all precautions must be taken when using it. The substrates (glass and quartz) were then rinsed with nanopure water and hydrolyzed with 2 M HCl for 5 min to provide them with silanol groups on their surface. The cleaned substrates showed a contact angle of ~0° with water. The substrates were again rinsed with nanopure water and dried under argon gas. Alumina templates were not cleaned with piranha solution because it is unstable in strong acids. The hydrolyzed substrates were then functionalized with amino groups by soaking in a solution consisting of 95 mL ethanol, 1 mL acetic acid and 4 mL 3-amino-propyltriethoxysilane for 1 h. The cross-linking of the 3-amino-propylsilanol groups with silanol groups on the glass/alumina substrates was accomplished by baking them for 10 h at 90 °C (Scheme 1A). The amine-functionalized glass was then phosphorylated using a solution containing 0.2 M POCl3 and 0.2 M 2,4,6-collidine in dry acetonitrile under argon atmosphere for 20 min.31–36 The substrates were then rinsed with acetonitrile and water to generate phosphoric acid on the surface (Scheme 1B). The zirconation was performed by soaking the substrates in 5 mM ZrOCl2 (in 50:50 ethanol/water) solution for 20 min (Scheme 1C). The zirconated surfaces were soaked in DCDA monomers and were allowed to self-assemble overnight (Scheme 1D). A freshly prepared solution was used for each deposition cycle. The DCDA solution was prepared by dissolving 14.4 mg of DCDA in 40 mL of chloroform. This solution was filtered through a paper filter to discard any polymer aggregates formed due to thermal- or photopolymerization of DCDA. The collected filtrate was an optically clear solution without any polymer particles in it and was covered with aluminum foil to avoid photopolymerization. Because of nature of the chemistry used in the synthesis, each deposition cycle will add only one DCDA layer at a time. Thus, the number of deposition cycles will control the inner pore wall thickness. The photopolymerization of DCDA monomers was performed after every deposition step by irradiating the surfaces with 254 nm wavelength light source for 2 min (UV intensity was 4.5 mW at a distance of 1 cm) (Scheme 1E). The procedures in Scheme 1C–E were repeated to synthesize multilayers.
The cleaned gold substrates for FTIR and ellipsometric measurements were functionalized slightly differently: First they were soaked for 18 h at room temperature in 1 mM 16-mercaptohexadecanoic acid (MHDA) solution prepared in chloroform. This treatment yielded carboxylic acids on the gold surfaces. The rest of the procedure was the same as according to Scheme 1C–E.
Characterization of the Multilayers
The measurement of absorption spectra for the multilayered PDCDA films was accomplished with a Perkin-Elmer Lambda 25 instrument (slit width of 2 nm and scanning speed 500 nm/s). The substrates were kept in a quartz cuvette, and the absorbance was measured from 300–800 nm range. The background was corrected using a cleaned non-functionalized glass/quartz substrate. The emission spectroscopic measurements were performed using Perkin-Elmer LS 55 with an excitation wavelength of 470 nm. Both the excitation and emission slit widths were set at 5 nm and the scanning speed was 500 nm/s.
Spectroscopic ellipsometry measurements were collected after the deposition of each layer of DCDA on a zirconated surface. The measurements were taken using a J.A. Woollam Co. M-2000 variable angle spectroscopic ellipsometer, and the results were analyzed with the WVASE software. The two fundamental quantities that were measured using ellipsometry are Δ and Ψ. Here Δ and Ψ are the ratio of phase difference and amplitude of p and s polarized light, respectively, upon reflection from the surface. As a result, the experimental complex reflectance ratio ρ defined by
| (1) |
is computed. From the experimental value of ρ, the pseudodielectric function for the entire material is derived. The pseudodielectric function is then simulated using a two-layer model that consists of a thick gold substrate with a DCDA overlayer of unknown thickness. The dielectric function of the overlayer is simulated using a Lorentz oscillator model given by
| (2) |
where, e(E) is the dimensionless complex dielectric function, e1i is the real part of dielectric function, N is refers to the total number of oscillators and each oscillator is further defined by three parameters: Ak, Ek and Bk, which are referred to amplitude, broadening and peak energy of the ith oscillator, respectively. The values for these parameters were previously reported for PDA films40 which were then optimized to fit our system. These parameters in conjunction with the thickness were optimized to obtain a good fit between the experimental and generated ellipsometric data (Figure 1S).
External reflection FTIR spectra of the multilayers on gold substrates were measured with Nicolet Nexus 670 FT-IR fitted with nitrogen cooled MCT-B detector and a Velma II variable-angle specular-reflectance accessory operating at a beam incidence angle of 80° with respect to surface normal. The samples were averaged at 1000 scans and 2 cm−1 resolution against a background of a bare gold substrate. The spectrometer was purged continuously with dry nitrogen gas to minimize water vapor in the sample chamber.
Scanning electron microscopy (SEM) was carried out on a Hitachi S570 SEM with an accelerating voltage of 20 kV. The samples were prepared by destruction of the alumina substrate through either grinding and crushing of the anodizc or dissolving the alumina in aqueous 1 M NaOH solution. A thin layer (~5 nm) of Pd–Au alloy coating (using Denton III) was applied to make the nanotubes conductive. Even under harsh sample preparation conditions, the samples with lengths in excess of ~20 μm are still observed.
To investigate the changes in the inner diameter of the PDCDA multilayered nanotubes still embedded inside of the template, we used ionic-current measurements as a function of different applied potential. With increase in the number of PDCDA layers, the inner diameter of the nanotubes decreased and the ionic resistance to the flow of ions increased.21 PDCDA nanotubes embedded in the nanoporous alumina templates were placed between two U-half-tubes setup as shown in Figure 1. The two half-cells with PDCDA nanotube membranes in-between were filled with a 0.5 M KCl solution. Ag/AgCl reference electrodes were immersed in each U-half-tube permeation cell. The applied potential difference between the two reference electrodes was scanned from −1 to +1 V with a sweep rate of 100 mVs−1 using a Keithley 6487 picoammeter/voltage source. The inverse of the slope of a line between I–V curve provided the ionic resistance of the membrane (Rm) for a given PDCDA membrane:21
Figure 1.
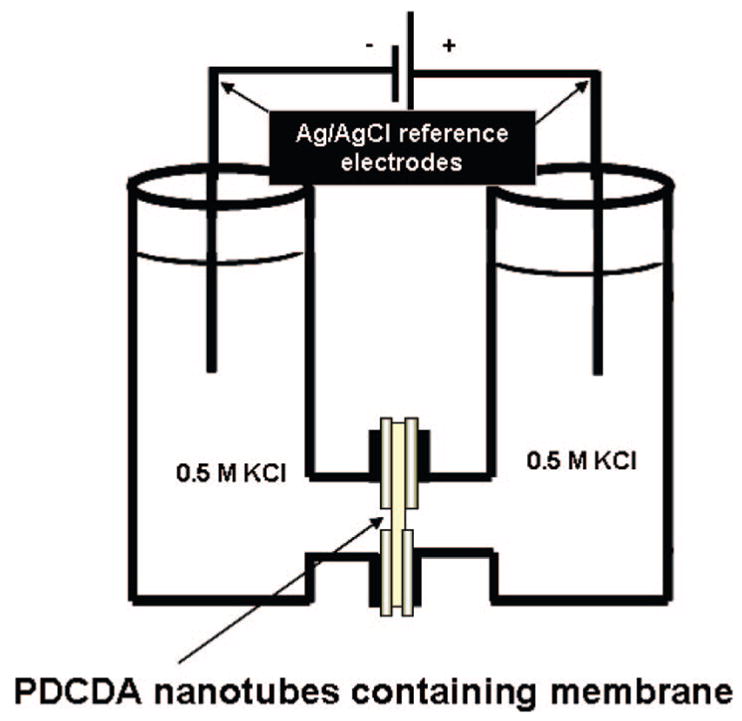
U-tube permeation cell setup used for the ionic current–voltage (I–V) measurements.
| (3) |
where Iion and Vapplied are ionic current and applied voltage values, respectively, for a given nanotube membrane.
Molecular Modeling
The molecular modeling of DCDA and PDCDA were performed on Gaussian 03 with ZDO basis set. The length of DCDA molecule was then obtained after energy minimization of the molecule.
Results and Discussion
In the present work, we report the synthesis of PDCDA nanotubes. We control the thickness of the coatings through LBL and template-assisted synthesis techniques. We have utilized ionic O2−CRCO2−–Zr4+–CO2−RCO2− interlayer linking chemistry, where R is a diacetylene containing functional group (here DCDA molecule is represented as O2−CRCO2−). With one deposition cycle only one monolayer of DCDA is formed, for example, DCDA molecules only formed one monolayer on the surface if the surface was activated with positively charged zirconium ions, and this procedure is self-terminated.
We have utilized the optical null elliposometry to investigate the growth of PDCDA multilayers on gold substrates. Ellipsometry is a very convenient characterization tool to gain thickness information on planar substrates with high resolution and accuracy. A linear increase in the ellipsometry thickness with an increase in the number of PDCDA layers clearly suggests a uniform deposition of PDCDA at every deposition cycle (Figure 2) and is consistent with electronic absorption and emission data (vide infra). We obtained an average thickness of ~2.3 nm/PDCDA layer from the slope of the line between layer thickness-versus-number of layers (Figure 2). The estimated length of a DCDA molecule (unpolymerized) using molecular modeling is 2.7 nm. This indicates that either our surface coverage is incomplete or the PDCDA layers are tilted from the normal of the surface. Assuming that the conformation of DCDA molecules remained the same after polymerization and that the coverage is ~100%, we estimate a tilt angle of ~32° which is within the range (30–60°) of other self-assembled monolayers (SAMs).29 In our case, it is also possible that there are some conformational changes following the polymerization of DCDA monomer40 which will change the observed elliposometric thickness values. Our ability to grow multilayers is not limited to a few layers, in fact, we have grown more than 20 PDCDA layers on glass and quartz substrates. This fact demonstrates that carboxylate-Zr chemistry is suitable for uniform polymeric multilayer synthesis, and these results are consistent with previous reports.35,36
Figure 2.
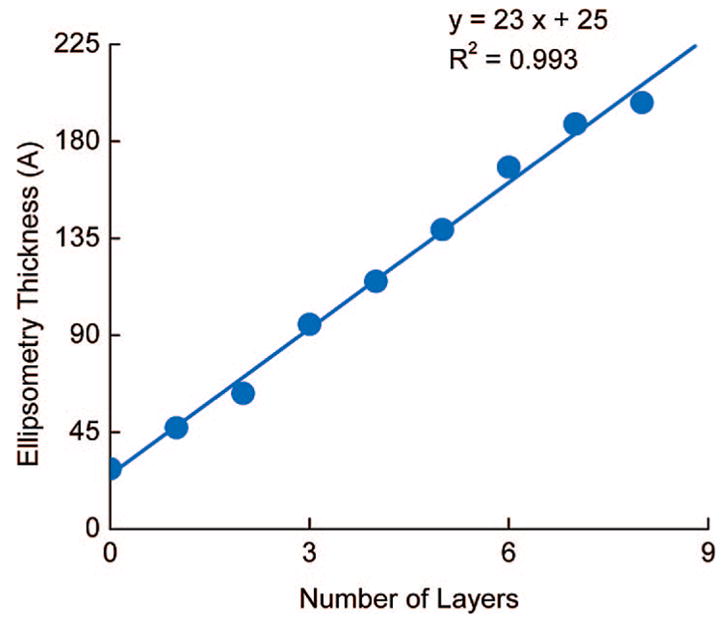
PDCDA layer thickness versus number of layers on the gold substrate. The linear increase in the layer thickness suggests uniform deposition of DCDA for each deposition cycle. The slope of the line is (23 ± 1) Å, and the intercept corresponds to layer 0 (of 16-mercaptohexadecanoic acid on gold) is (25 ± 3) Å.
To gain information about microscopic organization of the multilayer assemblies, we have performed FTIR and Raman analysis on the PDCDA multilayer films. FTIR spectroscopy is a very useful characterization technique to gain better understanding of the molecular orientation of the alkyl portion of DCDA and interlayer bonding nature of the multilayer assemblies. The stretching vibration bands of alkyl chains with all-trans conformations (with little/no defects) appears at a different frequency than those have gauche-conformations (with significant defects).41a Similarly, the peak frequencies of the free and metal-complexed carbonyl groups occur at different frequencies in the IR spectrum. For example, the symmetric and asymmetric stretching trans-CH2 bands of an alkane in the crystalline form shows bands at 2848 and 2915 cm−1 whereas liquid n-alkane with significant gauche-CH2 shows symmetric and asymmetric bands at 2856 and 2924 cm−1.31,41a Figure 3 shows the FTIR spectra of the PDCDA multilayer films prepared at room temperature. The strong absorption peaks at 2935 and 2856 cm−1 are attributed to CH asymmetric (vas) and symmetric (vs) stretching vibrations respectively. Full width at half-maxima (fwhm) of these peaks is ~70 and 60 cm−1, respectively. The CH2 stretching band positions and fwhm of the PDCDA films in the IR spectrum suggests that the CH2 in the alkyl chains of the multilayers are highly disorganized and that they are predominantly in the gauche-conformations. Although CH stretching vibration peaks increase with layer, we do not emphasize it as a quantitative analysis because the external reflectance IR spectroscopy is less reproducible compared to electronic absorption spectroscopy for quantitative analysis (vide infra). The broad peak in 3100–3600 cm−1 in the IR spectrum is attributed to hydrogen-bonded OH groups with carboxylate groups and zirconium ions. Important information on the interlayer chemistry was also obtained from carbonyl stretching peaks in the multilayers. FTIR spectra of multilayers showed vC=O peaks at 1690, 1550 and 1456 cm−1 which are assigned hydrogen-bonded carboxyl, asymmetric and symmetric stretching respectively.38,47 The peak at 1690 cm−1 is assigned to hydrogen-bonded carboxylic acids of the topmost layer in the multilayer assembly that was not zirconated (see FTIR spectrum of Layer 5). The asymmetric and symmetric Zr-carboxylic acid complex vibrations showed peaks at 1540–1560 and 1455 cm−1, respectively.38,47 Layer 5 showed a strong peak at 1690 cm−1 and a weaker peak at 1560 cm−1 whereas layers 8, 9, and 14 showed a stronger peak at 1560 cm−1 and a weaker peak at 1690 cm−1. This is because the FTIR spectrum of the layer 5 was taken before zirconation step. The layer 5 film contained the free carboxyl acid group that is not complexed with zirconium and thus, it showed a stronger 1690 cm−1 peak. We have also performed the IR difference analysis of spectrum before and after zirconation steps. The absence of peak in the 1740–1700 cm−1 region (corresponding to free carboxylic acid) and the presence of 1540–1560 and 1455 cm−1 peaks in the FTIR spectra clearly indicates that Zr-carboxylic acid complex formation in the multilayer films. Finally, our Raman spectrum of PDCDA showed peaks at 2117 and 713 cm−1 which are assigned to C≡C stretching and bending modes, respectively, of the polymer backbone.41b These peaks confirm the presence of polydiacetylene in the films.
Figure 3.
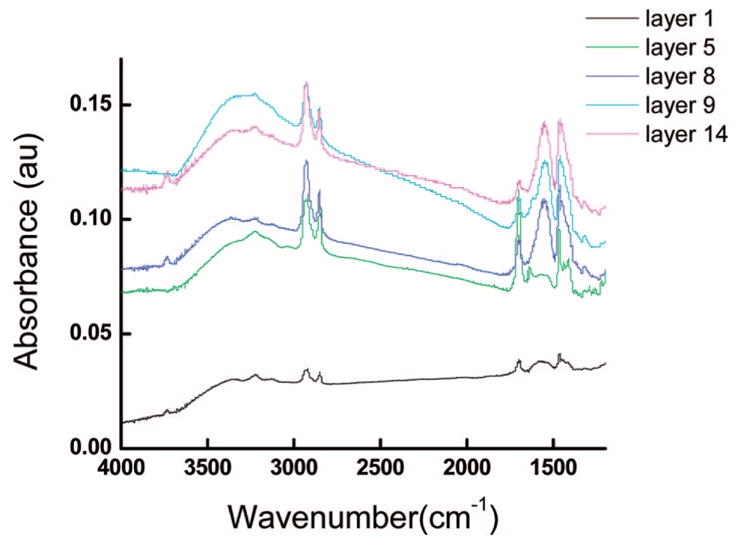
FTIR spectra of the PDCDA multilayer films on gold. The spectra were taken in reflection–absorption mode with IR beam at a angle of ~80° from the normal.
PDAs are known for stress-induced chromatic properties, i.e.; they show color change from blue color (blue-form) to red color (red-form) after an induced applied stress on the polymer backbone.42–45 It should be noted that the blue-form of polydiacetylene is metastable and can be annealed to a more stable red-form through heating of the liposome solution.43 Our data showed that the heating of the multilayer assemblies led to red shift in vas and vs stretching peaks at 2926 and 2853 cm−1, and the CH stretching peaks also became narrower after heating the films. fwhm of these peaks were 46 and 36 cm−1, respectively. Generally speaking, the narrowing of the CH stretching bands means a decrease in the distribution of conformations present in the alkyl chains whereas the red shift of the CH stretching implies a reorganization of the alkyl chains with reduced number of gauche conformers in them. These observations clearly suggest that the alkyl portions of the assemblies were still disorganized and have gauche conformations after heating the films, however, they were more ordered compared to the alkyl side chains of the as-prepared PDCDA films. Apparently, the heating of the films led to increase in the interchain aliphatic interactions (annealing of the polymer chains) that resulted in the red-shift and narrowing of the CH resonance vibration stretching peaks in the FTIR spectra. These observations are in agreement with a recent report where the authors found the alkyl portion of the PDA liposomes were more ordered in the red-PDA phase than in the blue-PDA phase after pH-treatment to liposomes.46
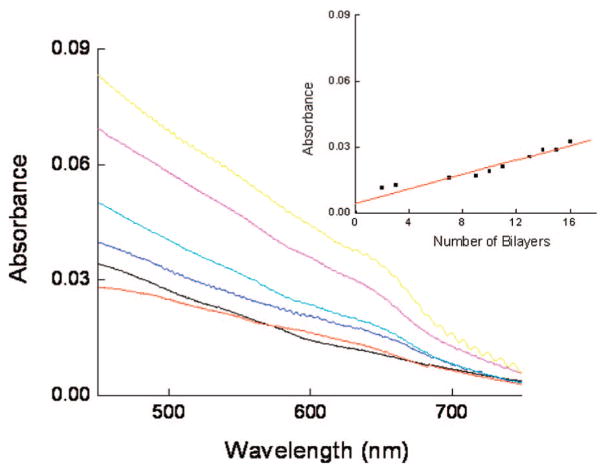
The evidence of uniform multilayer growth of PDCDA was also observed from electronic absorption spectroscopy. Figure 4 shows UV–vis absorption spectra of PDCDA multilayers. The stronger peak centered at ~640 nm represents π–π* electronic transition in the blue-PDCDA form and was used to monitor LBL adsorption of PDCDA.48 The peak centered at 540 nm is attributed to π-π* electronic transition of the red-PDA form.48 The baseline in the absorption spectrum was elevated probably due to light scattering from the films which is more prominent at shorter wavelengths than at longer wavelengths. The consequence of this is that 540 nm peak appeared as a small shoulder in the absorption spectrum. We believe that this peak is stronger in intensity but is obscured by light scattering (400–600 nm region) in the spectrum. A linear increase in the graph between the number of PDCDA bilayers and absorbance (Figure 4) is consistent with ellipsometric and emission data (vide-infra) and suggests a uniform deposition of DCDA monomers in each deposition cycle. By assuming an extinction coefficient of 5000 L/mol cm for PDCDA42b and an absorbance of 0.00083/layer (obtained from the slope of the line between 640 nm absorbance-versus-number of bilayers, Figure 4), we obtained PDCDA chromophore density of 9.9 × 10¹³ chromophores/cm2 (for blue-PDCDA form). Further, assuming that the conjugation number (i.e., the number of conjugated bonds) in the blue PDA form is ~5049 and that the PDCDA chains are cylindrical in shape with cross-section of 6 nm × 0.39 nm (see Supporting Information for more details, Figure 2S), we estimate there are roughly 4.2 × 10¹³ chromophores/cm2. The estimated chromophore density is in close agreement with experimental values estimated from UV–vis experimental data. The differences between estimated and experimental data are possibly due to some assumptions made here. For example, the exact extinction coefficient of PDCDA is dependent on polymerization conditions and monomer composition,42b,43 and the dimensions and conformation of conjugated PDCDA units are not precisely known. The variations in these values will affect the estimated chromophore density. Moreover, the films also contained some red-PDCDA form which will effectively reduce the concentration of blue-PCDA form in the multilayers. We do not know the degree of conversion of monomer to PDCDA since it is difficult to estimate the degree of polymerization on nanotubes and films. However, our data on FTIR, UV–vis, and emission spectroscopies clearly suggests that the films consisted of conjugated polymers.
Figure 4.
Absorbance (at 630 nm) versus wavelength of PDCDA on activated glass substrates. The layers are deposited on the glass or quartz substrates according to a procedure described in the text. The inset shows that the electronic absorbance at 630 nm peak increases linearly with increase in the deposition cycles. The reference beam for the measurements contained a glass (or quartz) substrate without PDCDA films on it.
To see whether these films exhibit thermo-chromatic reversibility between blue- and red-forms, we investigated heating and cooling of our films. The films were heated with a heat gun (~90–100 °C) for two minutes and were then allowed to cool to room temperature before UV–vis measurements were repeated. The relative increase in the absorbance of 540 nm peak with respect to 630 nm peak in the electronic absorption spectrum suggests that some of the blue-form changed to red-form (Figure 2S). We also found that the cooling of the films did not result in any changes in the absorption spectrum of the films. Similar results were obtained for in situ heating and cooling studies where the UV–vis spectra of the films were obtained at a given temperature without cooling the films to room temperature. These results indicate that our PDCDA films are thermochromatic irreversibility and that the red-phase PDCDA is thermodynamically more stable than blue-phase PDCDA.42,43 These results are consistent with previous studies which reported that the blue-phase PDA is metastable, and that after partial conversion to red-phase has taken place, the energy barrier to more stable red-phase decreases.43
Figure 5 shows the emission spectra of as-prepared PDCDA multilayer assemblies grown on quartz substrates. The fluorescence spectra of the films showed a peak at 610 nm and a less intense peak at 560 nm. The inset of Figure 5 shows that the emission intensity of 610 nm peak increases linearly with the number of PDCDA layers. This was at first surprising since as-prepared blue-PDCDA multilayers were expected to show no or very little emission because the quantum yield (Qy) of blue-form PDA is very low (~10−4) but it increases dramatically (many orders of magnitudes) in red-PDA form.50 The emission data is also consistent with our UV–vis data which also showed an absorption peak at 540 nm representing red-PDCDA form. Clearly, some of the blue-PDCDA was converted into red-phase PDCDA during the deposition of DCDA monomers from chloroform solution because the polydiacetylenes are known for solvatochromic effects, and they change color from blue to red when expose to solvents.43
Figure 5.
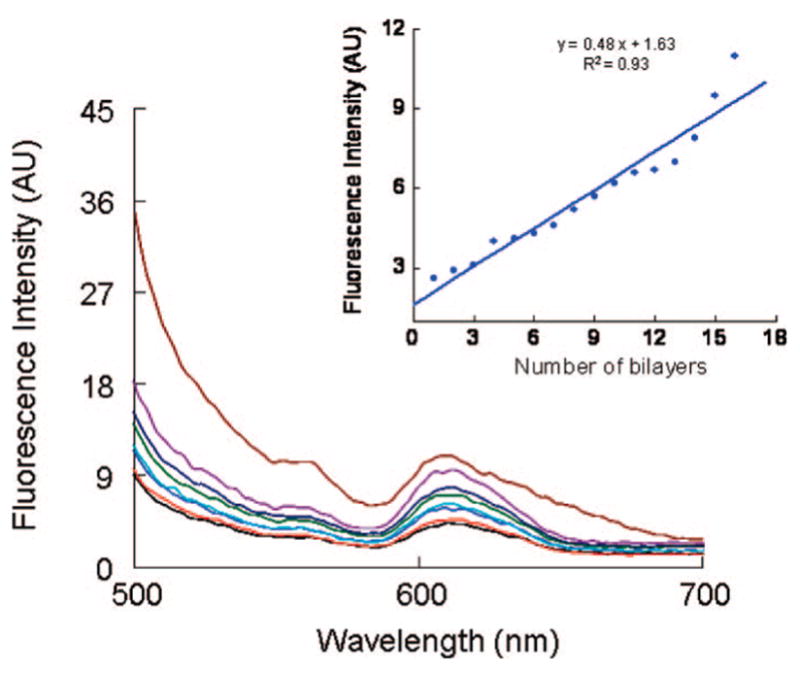
Emission spectra from PDCDA films grown on quartz substrates (excitation wavelength was 470 nm). (Inset) Emission intensity at 610 nm of polydiacetylene films grown on quartz as a function of number of bilayers. The slope of the best fitting line is (0.48 ± 0.3) and intercept is (1.6 ± 0.1).
We propose that each PDCDA layer is “locked” (Figure 6) at both of its ends through strong Zr-carboxylate bonds. The alkyl part of PDCDA is not in a crystalline-like state but is disorganized and has many defects and kinks in it. It is well-known that the thiol-SAMs absorbed on gold with alkyl-portion less than (CH2)9 are less organized, and they exhibit some defect in the monolayers.41a In our case, the alkyl-portion below and above of the PDCDA portion is (CH2)8, and it may contribute to disorganization in the alkyl portion of the film. Furthermore, our molecular modeling studies suggest that the polymerization of DCDA monomer leads to some conformational changes in the alkyl chains which, in turn, would affect the conformation of the conjugated portion of PDCDA. It is also possible that the “locking” of multilayers may lower the degree of freedom for the organic portion of PDCDA, and the reorganization stress after polymerization may not get dissipated efficiently due to “locking” Zr-carboxylate bonds. Consequently, this contribution along with solvatochromic effect discussed earlier led to increase in the stress on the conjugated portion of PDCDA, and some blue-PDCDA portion of the films was converted into red-PDCDA form. These results are consistent with our UV–vis and emission data where we observed absorption peak at 540 nm and emission peaks centered at 560 and 610 nm in the as-prepared films. Finally, the heating of our PDCDA multilayers probably releases some stress in the alkyl portion of the multilayers which resulted in increased organization in the alkyl portion of the polymer as evidence in our FTIR data.
Figure 6.
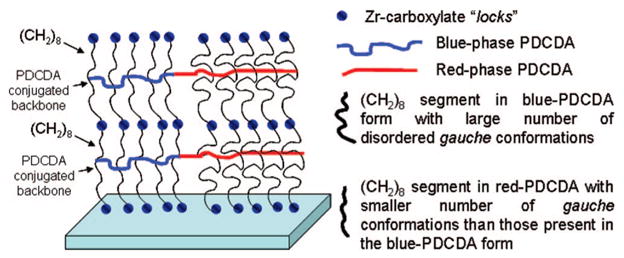
Proposed model showing Zr-carboxylate linkages, blue- and red-PDCDA phases (denoted by curvy blue and red lines), and disordered alkyl portion of PDCDA containing large numbers of gauche conformations.
Interestingly, we also observed some differences in the emission spectrum of the PDCDA films and PDA-based liposomes. For example, the liposome emission spectrum shows a much stronger peaks centered at ~560 nm and a less intense peak at ~610 nm,42 whereas an opposite emission trend was observed for the PDCDA films. The PDCDA films showed stronger peak at 610 nm and a weak emission peak at 560 nm.40 Moreover, the emission peak at 610 nm also became broader (i.e., full-width at half-maxima was increased) with increase in the PDCDA layers (Figure 5). In fact, the films with sixteen layers showed an emission peak centered at ~610 nm has a long “red-tail”. From a physical viewpoint, our multilayer system is different from bilayer liposomes: the surface of liposomes is curved, and they are bilayered (not multilayer) nanostructures. The interaction between two layers of the liposomes is of Van der Waals in nature. On the other hand, our films are formed on relatively flat surfaces, and the multilayers are linked through much stronger Zr4+-carboxylate chemistry. It is possible that the morphology (curved versus relatively planar) and difference in the number of layers between liposomes and our films contributed to their relative differences in the emission intensity of 560 and 610 nm peaks. For example, with increase in the number of layers, the PDCDA chains exist in a range of effective conjugation lengths, i.e., there was increase in the disparity in the conjugation length of the polymer chains with number of PDCDA layers. Moreover, the local environment for liposomes and multilayer films is very different: liposomes and multilayer films exist in aqueous and air (more hydrophobic) environments respectively. Since the emission is sensitive to both conjugated chain length and environment in which the chains are located, we expect that these factors may contribute to overall emission characteristics such as the relative emission intensity and broadening of 560 and 610 nm peaks in the spectra. Finally, interchain excitons51 and interchain energy transfer42a can also play a factor in different emission spectra of liposomes and multilayer films based on PDA. Thus, we believe that the differences in the emission characteristics for liposome and multilayer assemblies are probably due to a combination of many different factors as described above in the text.
Until now, we have discussed the experimental data on PDCDA films deposited on the flat surfaces. We now present our results on PDCDA nanotubes synthesized using LBL template-assisted method in the nanoporous alumina membranes. We have characterized the multilayered nanotubes with ionic-conductivity and electron microscopy measurements. Recently, Martin and co-workers21 have used ionic current analysis for the characterization of LBL based Zr-α,ω-alkylbisphosphonate nanotubes. They showed that the ionic current measurements provide a very convenient way to get information on changes in the nanotube diameter because the ionic current passing through nanotubes is sensitive to changes in the pore diameter. Furthermore, this method is nondestructive in nature and does not require extensive sample preparation such as those for SEM.
Figure 7A schematically shows the branching of the pores and pore diameters at two sides of the nanoporous alumina template. SEM in Figure 7B and C shows that the pores on one side of the template are ~70–120 nm whereas the pore diameter is >200 nm along most of its length. SEM of PDCDA nanotubes synthesized using template-synthesis showed pore diameter of the nanotubes in 70–240 nm range (Figure 8).
Figure 7.
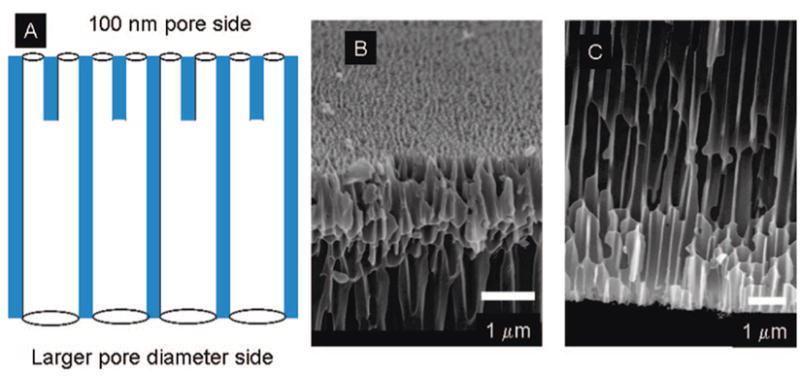
(A) Schematic diagram of 100 nm Anodisc (Whatman) showing the branching of the pores. The blue shaded area represents alumina and white area represents pore (air). (B) Scanning electron micrograph (SEM) of smaller pore diameter side (~70–100 nm). (C) SEM of larger pore diameter side (200–300 nm).
Figure 8.
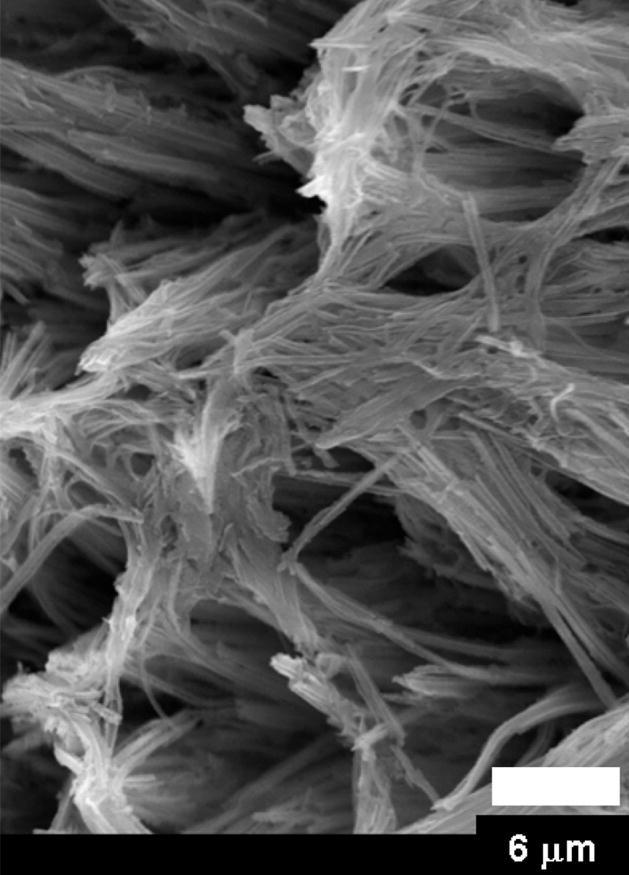
Scanning electron microscopy (SEM) image of 10-layered PDCDA nanotubes synthesized inside of an alumina template.
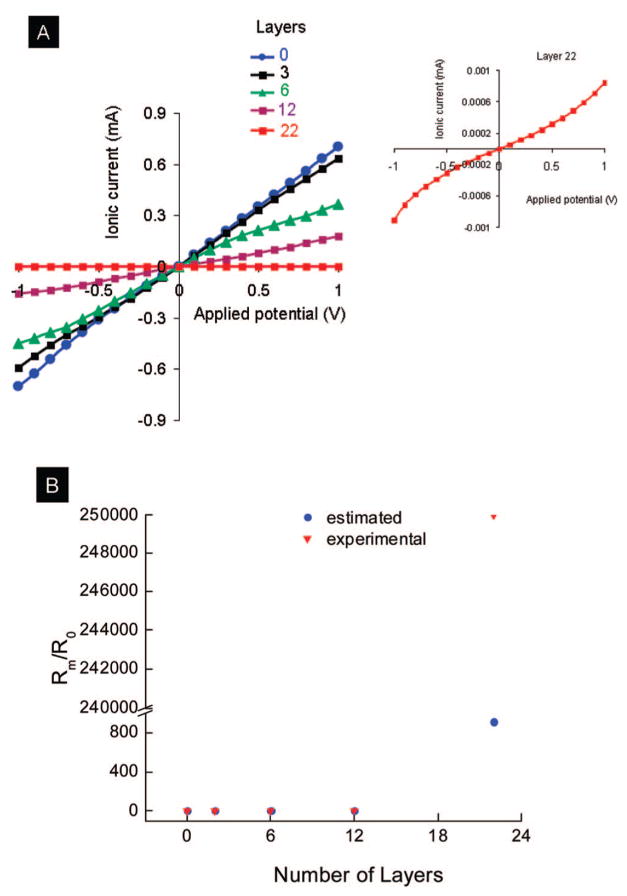
The ionic resistance Rm for the nanotubes was calculated using eq 3 from the experimental knowledge of the ionic current iion and applied voltage. The experimental ionic resistance is an average value of ~4.9 × 10¹⁰ PDCDA nanotubes (the pore density of the template membrane was ~1010 pores/cm2 and the area of the membrane that was exposed to 0.5 M KCl was 0.49 cm2). Since I–V curves are linear (except for layer 22, see below), the slope between I–V curves will give inverse membrane resistance (eq 3)21 which is directly related to internal radii of the nanotubes (Figure 9A). In the above set up, K+ cations will migrate toward the cathode whereas Cl− will migrate toward the anode under an applied voltage. As the pore diameter decreased by PDCDA coating on the inner walls of the pores, the resistance to ions under an electric field increased. Figure 9B shows the experimental and estimated (Rm/R0) versus the number of PDCDA layers in the alumina nanopores. Here Rm = membrane resistance after the deposition of PDCDA multilayers and R0 = resistance of bare alumina membranes (i.e., without PDCDA nanotubes). The measured (Rm/R0) values were calculated from I–V curves (eq 3 and Figure 9A), and the estimated (Rm/R0) was calculated using eq 4 where I–V behavior was assumed to be ohmic in nature:21
Figure 9.
(A) I–V curves for PDCDA multilayers grown inside of 100 nm diameter pores containing templates. Inset shows the nonlinear ohmic behavior for a 22 multilayers nanotube membrane. (B) Comparison of experimental and estimated ionic resistance for PDCDA multiplayer nanotubes. The estimated (Rm/R0) value for 22 PDCDA layers should be infinite (because all pores should be blocked) if we assume that all the nanopores in the template are 100 nm and each PDCDA layer thickness is 2.3 nm. We have arbitrary given an estimated (Rm/R0) value of 250 000 for 22 PDCDA layers containing template.
| (4) |
where ro = radius of bare nanotubes (assumed value is 100 nm) in the alumina template (without PDCDA deposition); and N = number of layers. The factor 2.3 comes into eq 4 because each PDCDA layer is assumed to be 2.3 nm in thickness (from our elliposometry data). In eq 4, there are no parameters that need to be adjusted. The calculated and experimental (Rm/R0) data agreed with one another at smaller number of multilayers except at larger number of layers (for 22 multilayers) where the estimated (Rm/R0) ratio is much higher than experimental (Rm/R0). The groups of Siwy, Martin, and White12–15 have recently showed that for conical nanotubes the resistance to ionic current is highest at the smaller pore diameter. Depending upon the dimensions of the nanotubes, they found that >85% resistance occurs within the 600 nm from the tip of smaller diameter. Assuming that the thickness of each layer is 2.3 nm, the thickness of for 22 PDCDA layers will be 50.6 nm. The pore diameter at smaller side ranges from 60 to 120 nm. Therefore, there are many pores (with pore diameter smaller than 50 nm) but not all of the pores in the template will be completely blocked to ion transport after the deposition of 22 PDCDA layers. Thus, the ionic resistance of the 22 PDCDA layer membranes is large but finite. The estimated (Rm/R0) value for 22 PDCDA layers, however, should be infinite. This is because all pores will be blocked as we assumed that the nanopores in the template are monodispersed of 100 nm and each PDCDA layer thickness is 2.3 nm. We have arbitrary given an estimated (Rm/R0) value of 250 000 for 22 PDCDA layers containing template aid the eyes of the readers (Figure 9B).
We have also noticed a nonlinear I–V response for films with 22 PDCDA layers containing templates. It is also known that the ion transport shows nonohmic response for ions flowing through nanoscale tubes whose diameter approaches double-layer thickness. This is because the surface charges on the nanopores considerably affect the movement of ions under electric fields when the pore diameter and double-layer thickness are comparable.8,11,12 It is possible that for 22 multilayered PDCDA films in the alumina template, the pore diameter for some of the nanotubes is close to the double-layer thickness which will show in nonohmic I–V behavior. Furthermore, when the diameter of the nanopore is smaller than the double-layer thickness, the nanotubes can be permselective.52 That is, these nanotubes will conduct only one type of ions depending upon the charge on nanotube surface.52 Under our experimental conditions, the double-layer thickness is ~0.43 nm. It is possible that some of the pores for our experiments are permselective because the diameter of some of nanotubes in the template can be comparable with double-layer thickness. We are now performing a detailed study to verify this phenomenon. Thus, the major contribution to large differences in the experimental and estimated (Rm/R0) values is due to the assumption that all the nanopores are 100 nm in diameter and each PDCDA layer is 2.3 nm thick. Other contributions to this difference are possibly due to nonlinear I–V and ion-permselectivity responses.
The method described in this report can be used to synthesize nanoscale materials with multifunctionalities and controlled dimensions. Potential applications of these materials are in the fields such as chemical and biochemical separations, drug and gene delivery, and photovoltaics.
Conclusion
Bottom-up approach is one of the methods for synthesizing tailored materials with nanoscale features. Our work has utilized self-assembly to synthesize nanometer size PDCDA nanotubes using a template-assisted technique. The zirconium-carboxylate interlayer chemistry and LBL technique were used for the synthesis of nanotubes of varying inner diameter. PDCDA multilayer films and nanotubes were characterized using optical (UV–vis, fluorescence, ellipsometry, FTIR) spectroscopies, scanning electron microscopy and I–V analysis. Ellipsometry, FTIR, electronic absorption and emission spectroscopies indicated uniform DCDA deposition at each deposition cycle and confirmed that the carboxylate-zirconium interlinkage chemistry is robust. We observed disorganized alkyl portion of PDCDA multilayer films in our FTIR spectra. To explain this we propose that the carboxylate-zirconium interlinkages act as “locks” in between PDCDA layers which restrict the movement of alkyl portion in the films which resulted in less efficient release of stress in the films. Our ionic resistance data from I–V analysis correlate well with calculated resistance at smaller number of PDCDA layers but it significantly deviated for thicker PDCDA nanotubes. These differences were attributed to combined effects of the blocking of ion transport through some nanotubes, the nonohmic and perselective ionic behaviors. Using the proposed method, higher-hierarchal structures with multiple functionalities can be synthesized which may have potential applications in the areas of chemical and biochemical separations, and drug and gene delivery.
Supplementary Material
Acknowledgments
We acknowledge National Institute of Health (GM 8071101) and the National Science Foundation (CMMI 0609349 and CAREER award) for financial support. We thank Prof. Zuzanna Siwy for providing details on her paper prior to its publication, and Prof. McCarroll for exciting discussions. We acknowledge Drs. Schmitt and Bozzola for assistance in the electron microscopy and the reviewers for their positive critiques.
Footnotes
Supporting Information Available: Additional figures. This material is available free of charge via the Internet at http://pubs.acs.org.
References
- 1.(a) Martin CR. Science. 1994;266:1961. doi: 10.1126/science.266.5193.1961. [DOI] [PubMed] [Google Scholar]; (b) Martin CR, Kohli P. Nat Drug Disc. 2003;2:29–27. doi: 10.1038/nrd988. [DOI] [PubMed] [Google Scholar]
- 2.Steinhart M, Wendorff JH, Greiner A, Wehrspohn RB, Nielsch K, Schilling J, Choi J, Gösele U. Science. 2002;296:1997. doi: 10.1126/science.1071210. [DOI] [PubMed] [Google Scholar]
- 3.Steinhart M, Wehrspohn RB, Gösele U, Wendorff JH. Angew Chem, Int Ed. 2004;43:1334. doi: 10.1002/anie.200300614. [DOI] [PubMed] [Google Scholar]
- 4.Kohli P, Harrell CC, Zehui C, Gasparac R, Tan W, Martin CR. Science. 2004;305:984–986. doi: 10.1126/science.1100024. [DOI] [PubMed] [Google Scholar]
- 5.Lee SB, Mitchell DT, Trofin L, Nevanen TK, Soderlund H, Martin CR. Science. 2002;296:2198–2200. doi: 10.1126/science.1071396. [DOI] [PubMed] [Google Scholar]
- 6.Nice Warner-Pena SR, Freeman RG, Reiss BD, He L, Pena DJ, Walton ID, Cromer R, Keating CD, Natan MJ. Science. 2001;294:137. doi: 10.1126/science.294.5540.137. [DOI] [PubMed] [Google Scholar]
- 7.Che G, Lakshmi BB, Fisher ER, Martin CR. Nature. 1998;393:346. [Google Scholar]
- 8.Siwy Zuzanna S, Powell Matthew R, Kalman Eric, Astumian R, Dean, Eisenberg Robert S. Nano Lett. 2006;6:473–477. doi: 10.1021/nl0524290. [DOI] [PubMed] [Google Scholar]
- 9.Zakeri R, Watts C, Wang H, Kohli P. Chem Mater. 2007;19:1954–1963. [Google Scholar]
- 10.Siwy Zuzanna, Trofin Lacramioara, Kohli Punit, Baker Lane A, Trautmann Christina, Martin Charles R. J Am Chem Soc. 2005;127:5000–5001. doi: 10.1021/ja043910f. [DOI] [PubMed] [Google Scholar]
- 11.Martin Charles R, Siwy Zuzanna S. Science. 2007;317:331. doi: 10.1126/science.1146126. [DOI] [PubMed] [Google Scholar]
- 12.(a) Powell MR, Sullivan M, Vlassiouk I, Constantin D, Sudre O, Martens CC, Eisenberg RS, Siwy Z. Nature Nanotechnol. 2008;3:51. doi: 10.1038/nnano.2007.420. [DOI] [PubMed] [Google Scholar]; (b) Siwy Z, Kosinska ID, Fulinski A, Martin CR. Phys Rev Lett. 2005;94:048102. doi: 10.1103/PhysRevLett.94.048102. [DOI] [PubMed] [Google Scholar]
- 13.Sexton LT, Horne LP, Sherrill SS, Bishop GW, Baker LA, Martin CR. J Am Chem Soc. 2007;129:13144–13152. doi: 10.1021/ja0739943. [DOI] [PubMed] [Google Scholar]
- 14.Heins ES, Siwy ZS, Baker LA, Martin CR. Nano Lett. 2005;5:1924–1829. doi: 10.1021/nl050925i. [DOI] [PubMed] [Google Scholar]
- 15.(a) Baker LA, Choi Y, Martin CR. C Nano. 2006;2:243–255. [Google Scholar]; (b) Lee Sungwon, Zhang Yanhui, White Henry S, Harrell C, Chad, Martin Charles R. Anal Chem. 2004;76:6108–6115. doi: 10.1021/ac049147p. [DOI] [PubMed] [Google Scholar]
- 16.Vidu R, Ku JR, Stroeve P. In: Polymeric Nanostructures and Their Applications. Nalwa HS, editor. American Scientific Publishers; Valencia, CA: 2006. [Google Scholar]
- 17.Artyukhin AB, Shestakov A, Harper J, Bakajin O, Stroeve P, Noy A. J Am Chem Soc. 2005;127:7538–7542. doi: 10.1021/ja043431g. [DOI] [PubMed] [Google Scholar]
- 18.Ku J, Stroeve P. Langmuir. 2004;20:2030–2032. doi: 10.1021/la0357662. [DOI] [PubMed] [Google Scholar]
- 19.Qin L, Park S, Huang L, Mirkin CA. Science. 2005;309:113. doi: 10.1126/science.1112666. [DOI] [PubMed] [Google Scholar]
- 20.Park S, Lim J-H, Chung SW, Mirkin CA. Science. 2004;303:348–351. doi: 10.1126/science.1093276. [DOI] [PubMed] [Google Scholar]
- 21.Hou S, Harrell CC, Trofin L, Kohli P, Martin CR. J Am Chem Soc. 2004;126:5674. doi: 10.1021/ja049537t. [DOI] [PubMed] [Google Scholar]
- 22.Hou S, Wang J, Martin CR. J Am Chem Soc. 2005;127:8586. doi: 10.1021/ja042343t. [DOI] [PubMed] [Google Scholar]
- 23.Tian Y, He Q, Tao C, Cui Y, Li J. Biomacromolecules. 2006;7:2539. doi: 10.1021/bm060412l. [DOI] [PubMed] [Google Scholar]
- 24.Lu G, Ai S, Li J. Langmuir. 2005;21:1679. doi: 10.1021/la047771r. [DOI] [PubMed] [Google Scholar]
- 25.Hou S, Wang J, Martin CR. Nano Lett. 2005;5:231. doi: 10.1021/nl048305p. [DOI] [PubMed] [Google Scholar]
- 26.Decher G. Science. 1997;277:1232–1237. [Google Scholar]
- 27.Hong HG, Sackett DD, Mallouk TE. Chem Mater. 1991;3:521–527. [Google Scholar]
- 28.Lee H, Kepley LJ, Hong HG, Mallouk TE. J Am Chem Soc. 1988;110:618–620. [Google Scholar]
- 29.Bakiamoh SB, Blanchard GJ. Langmuir. 1999;15:6379–6385. [Google Scholar]
- 30.Bandyopadhyay K, Patil V, Vijayamohanan K, Sastry M. Langmuir. 1997;13:5244–5248. [Google Scholar]
- 31.Kohli P, Blanchard GJ. Langmuir. 1999;15:1418–1422. [Google Scholar]
- 32.Lee H, Kepley LJ, Hong HG, Akhter S, Mallouk TE. J Phys Chem. 1988;92:2597. [Google Scholar]
- 33.Lee H, Kepley LJ, Hong HG, Mallouk TE. J Am Chem Soc. 1988;110:618. [Google Scholar]
- 34.Thompson ME. Chem Mater. 1994;3:521. [Google Scholar]
- 35.Bakiamoh SB, Blanchard GJ. Langmuir. 2001;17:3438–3446. [Google Scholar]
- 36.Bakiamoh SB, Blanchard GJ. Langmuir. 2002;18:6246–6253. [Google Scholar]
- 37.Lu G, Purvis KL, Schwartz J, Bernasek S. Langmuir. 1997;13:5791. [Google Scholar]
- 38.Aronoff YG, Chen B, Lu G, Seto C, Schwartz J, Bernasek SL. J Am Chem Soc. 1997;119:259. [Google Scholar]
- 39.VanderKam SK, Bocarsly AB, Schwartz J. Chem Mater. 1998;10:685. [Google Scholar]
- 40.Carpick RW, Mayer TM, Sasaki DY, Burns AR. Langmuir. 2000;16:4639–46. [Google Scholar]
- 41.(a) Dubois LH, Nuzzo RG. Annu Rev Phys Chem. 1992;43:437. [Google Scholar]; (b) Campbell AJ, Davies CKL, Batchelder DN. Macromol Chem Phys. 1998;199:109–112. [Google Scholar]
- 42.Li Xuelian, McCarroll Matthew, Kohli Punit. Langmuir. 2006;22:8615–8617. doi: 10.1021/la061340m. [DOI] [PubMed] [Google Scholar]; (b) The extinction coefficient of PDA depends upon the polymerization time and composition of the monomers. Shorter photo-polymerization is expected to result in polymer chains with smaller absorbance (Li, X.; Matthews, S.; Kohli, P. J. Phys. Chem. B Submitted for publication). Similarly, the polymerization will also be affected by monomer composition (see, for example, ref 43) where it is shown that some monomers will not polymerize because of large head group.
- 43.Okada Sheldon, Peng Susan, Spevak Wayne, Charych Deborah. Acc Chem Res. 1998;31:229–239. [Google Scholar]
- 44.Spevak Wayne, Nagy Jon O, Charych Deborah H. Adv Mater. 1995;7:85–89. [Google Scholar]
- 45.Charych Deborah H, Nagy Jon O, Spevak Wayne, Bednarski Mark D. Science. 1993;261:585–588. doi: 10.1126/science.8342021. [DOI] [PubMed] [Google Scholar]
- 46.Kew SJ, Hall EAH. Anal Chem. 2006;78:2231–2237. doi: 10.1021/ac0517794. [DOI] [PubMed] [Google Scholar]
- 47.Tackett JE. Appl Spectrosc. 1989;43:483. [Google Scholar]
- 48.Volkov Victor V, Asahi Tsuyoshi, Masuhara Hiroshi, Masuhara Akito, Kasai Hitoshi, Oikawa Hidetoshi, Nakanishi Hachiro. J Phys Chem B. 2004;108:7674–7680. [Google Scholar]
- 49.Chance RR, Washabuagh MW, Hupe DJ. In: Polydiacetylenes: Synthesis, Structure and Electronic properties. Blor D, Chance RR, editors. Martinus Nijhoff Publsihers; Boston: 1985. pp. 239–256. [Google Scholar]
- 50.Olmsted John, Strand Marglth. J Phys Chem. 1983;87:4790–4792. [Google Scholar]
- 51.Samuel IDW, Rumbles G, Collison CJ. Phys Rev B. 1995;R11:573–52. doi: 10.1103/physrevb.52.r11573. [DOI] [PubMed] [Google Scholar]
- 52.(a) Nishizawa Matsuhiko, Menon Vinod P, Martin Charles R. Science. 1995;268:700–702. doi: 10.1126/science.268.5211.700. [DOI] [PubMed] [Google Scholar]; (b) Vlassiouk I, Smirnov S, Siwy ZS. Nano Letters. doi: 10.1021/nl800949k. (in press) [DOI] [PubMed] [Google Scholar]
Associated Data
This section collects any data citations, data availability statements, or supplementary materials included in this article.


