Abstract
The second-line antitubercular drugs thiacetazone (TAZ) and ethionamide (ETA) are bioactivated by the mycobacterial enzyme EtaA. We report here that human flavin-containing monooxygenase 2.1 (FMO2.1), which is expressed predominantly in the lung, catalyzes oxygenation of TAZ. The metabolites generated, the sulfenic acid, sulfinic acid, and carbodiimide derivatives, are the same as those produced by EtaA and human FMO1 and FMO3. Two of the metabolites, the sulfenic acid and carbodiimide, are known to be harmful to mammalian cells. FMO2.1 also catalyzes oxygenation of ETA, producing the S-oxide. We have developed a novel spectrophotometric assay for TAZ oxygenation. The assay was used to determine kinetic parameters for TAZ oxygenation catalyzed by human FMO1, FMO2.1, and FMO3 and by EtaA. Although the KM values for the four enzyme-catalyzed reactions are similar, kcat and, consequently, kcat/KM (the specificity constant) for FMO2.1-catalyzed TAZ oxygenation are much higher than those of FMO1, FMO3, or EtaA. This indicates that FMO2.1 is more effective in catalyzing TAZ oxygenation than are the other three enzymes and thus is likely to contribute substantially to the metabolism of TAZ, decreasing the availability of the prodrug to mycobacteria and producing toxic metabolites. Because of a genetic polymorphism, Europeans and Asians lack FMO2.1. However, in sub-Saharan Africa, a region in which tuberculosis is a major health problem, a substantial proportion of individuals express FMO2.1. Thus, our results may explain some of the observed interindividual differences in response to TAZ and ETA and have implications for the treatment of tuberculosis in sub-Saharan Africa.
Pulmonary tuberculosis (TB) is a serious respiratory disease caused by the opportunistic bacterium Mycobacterium tuberculosis. The World Health Organization estimated 9.2 million new cases of TB infection worldwide in 2006, of which 31% were in Africa. The appearance of strains of M. tuberculosis that are resistant to more than one first-line antitubercular drug has required the use of second-line drugs (Peloquin, 1993), such as the thiourea thiacetazone (TAZ; 4′-formylacetanilide thiosemicarbazone) and the thioamide ethionamide (ETA; 2-ethylpyridine-4-carbothioamide). TAZ has been widely used in the developing world (Brown, 1992). Although an effective treatment for multidrug-resistant TB, it can produce adverse effects such as liver toxicity, gastrointestinal disturbances, and life-threatening skin reactions, particularly in human immunodeficiency virus patients (Teklu, 1976; Brown, 1992; Peloquin, 1993; Ipuge et al., 1995), and, consequently, its use has been discontinued in several countries (Brown, 1992). ETA continues to be prescribed in both developed and developing countries.
Both TAZ and ETA are prodrugs that are converted to their active forms by the mycobacterial enzyme EtaA (Baulard et al., 2000; DeBarber et al., 2000; Qian and Ortiz de Montellano, 2006), a flavin-containing monooxygenase (FMO) (Vannelli et al., 2002). EtaA activates TAZ by two sequential oxidation steps to form a sulfinic acid and a carbodiimide via a postulated sulfenic acid intermediate (Qian and Ortiz de Montellano, 2006). TAZ treatment affects mycolic acid biogenesis in mycobacteria (Alahari et al., 2007; Dover et al., 2007), and this may be the mechanism by which the drug exerts its antimicrobial effect.
The FMOs (EC 1.14.13.8) of mammals catalyze the oxidative metabolism of numerous xenobiotics, including pesticides, fertilizers, and therapeutic drugs (Krueger and Williams, 2005; Cashman and Zhang, 2006; Phillips et al., 2007; Phillips and Shephard, 2008). Humans express five functional FMOs, FMOs 1 through 5 (Phillips et al., 1995; Hernandez et al., 2004). FMO1, FMO2, and FMO3 can bioactivate thiourea-based drugs (Smith and Crespi, 2002; Henderson et al., 2004; Onderwater et al., 2006), and FMO1 and FMO3 have been shown to catalyze oxygenation of TAZ in vitro, forming the same products as EtaA (Qian and Ortiz de Montellano, 2006).
A genetic polymorphism of the FMO2 gene, g.23238C>T (Q472X), gives rise to an allele, FMO2*2, which encodes a truncated, nonfunctional protein (FMO2.2) (Dolphin et al., 1998). Essentially all Europeans and Asians are homozygous for FMO2*2 and thus do not express functional FMO2 (Dolphin et al., 1998; Whetstine et al., 2000). However, in sub-Saharan Africa, and in populations recently descended from this region, a substantial proportion of individuals possess at least one copy of the ancestral FMO2*1 allele, which encodes a full-length functional protein (FMO2.1) (Dolphin et al., 1998; Whetstine et al., 2000; Veeramah et al., 2008). In contrast to FMO1 and FMO3, which in the adult human are expressed primarily in kidney and liver, respectively (Dolphin et al., 1996; Yeung et al., 2000; Hernandez et al., 2004; Cashman and Zhang, 2006), the main site of expression of FMO2 is the lung (Dolphin et al., 1998; Krueger et al., 2002; Hernandez et al., 2004; Cashman and Zhang, 2006). Expression of functional FMO2.1 has been confirmed in lung microsomes from an individual heterozygous for the FMO2*1 allele (Krueger et al., 2002).
Because TAZ and ETA act against mycobacteria in the lung, we investigated the ability of human FMO2.1 to catalyze the oxygenation of these antitubercular drugs. In this article, we show that the protein encoded by the FMO2*1 allele, FMO2.1, catalyzes oxygenation of both TAZ and ETA, forming the same metabolites as those produced by human FMO1 and FMO3 and by the mycobacterial enzyme EtaA. Furthermore, we show that the specificity constant of FMO2.1 for TAZ is higher than that of any of the other three enzymes. Our results provide a potential explanation for some of the observed interindividual differences in the efficacy of and response to TAZ and ETA and have implications for the treatment of TB in sub-Saharan Africa and in individuals of recent African descent.
Materials and Methods
Materials. Chemical reagents, enzymes, and antibiotics were obtained from Sigma-Aldrich (St. Louis, MO) unless stated otherwise. Plasticware for insect cell culture was obtained from VWR (West Chester, PA). Reagents for high-performance liquid chromatography (HPLC) were obtained from Fisher Scientific (Waltham, MA) and were of HPLC grade.
Protein Expression. Recombinant bacmids encoding full-length human FMO2 (FMO2Q472; FMO2.1) and FMO3 were as described previously (Dolphin et al., 1997, 1998). A recombinant bacmid encoding human FMO1 was prepared from an FMO1 cDNA (Dolphin et al., 1991) (accession number Q01740) via site-specific transposition in Escherichia coli, through the use of the Bac-to-Bac system (Invitrogen, Carlsbad, CA) as described previously (Janmohamed et al., 2006). Bacmid DNAs were isolated using a modified alkaline lysis method. Production of baculovirus and expression of FMOs in Spodoptera frugiperda (Sf) 9 cells were as described previously (Janmohamed et al., 2006), except that after infection with recombinant baculovirus, cells were cultured for 96 h before harvesting. EtaA was expressed and purified as described previously (Vannelli et al., 2002).
Isolation of Microsomal Membranes. Sf 9 cells were harvested and resuspended in HEPES buffer [0.154 M KCl, 10 mM HEPES, pH 7.4, 1 mM EDTA, 20% (v/v) glycerol]. Cells were lysed by three 12-s bursts of sonication on ice. Cell lysates were centrifuged at 1000g for 10 min at 4°C. The resulting supernatant was centrifuged at 100,000g for 1 h at 4°C. The pellet was resuspended in HEPES buffer by hand, using a glass-glass homogenizer placed on ice, and stored in aliquots at –80°C. Protein concentration was determined using the method of Lowry (DC Protein Assay kit; Bio-Rad, Hercules, CA) and bovine serum albumin (Bio-Rad) as a standard.
Quantification of FMOs. Antibodies to FMO1, FMO2, and FMO3 were a gift from Dr. R. Philpot. Heterologously expressed FMOs were quantified by Western blotting essentially as described previously (Dolphin et al., 1997, 1998). Blots were incubated with goat anti-(rabbit FMO1), goat anti-(rabbit FMO2), or goat anti-(rabbit FMO3) serum (1 in 3000 dilution), then with a rabbit anti-(goat IgG)-alkaline phosphatase conjugate (1 in 30,000 dilution). Antigen was visualized through the use of a color development kit (AP Conjugate Substrate Kit; Bio-Rad). The concentration of each expressed FMO was determined by scanning densitometry and Image Gauge software, version 4.2.1 (Science Lab, FujiFilm, Tokyo, Japan) using a standard curve of authentic rabbit FMO1 and FMO2 or human FMO3 (which were gifts from Dr. R. Philpot). As a comparison, the relative abundance of heterologously expressed FMOs was estimated from scans of Coomassie Blue-stained SDS-polyacrylamide gels of a range of amounts of microsomal protein isolated from Sf9 cells infected with recombinant baculoviruses (data not shown). The results corresponded well with those obtained by Western blotting, indicating that there was no appreciable difference in cross-reactivity among the antibodies.
Enzyme Incubations with TAZ or ETA. Sf 9 insect cell microsomes containing heterologously expressed human FMO1, FMO2.1, or FMO3 (at a final concentration of 500 nM) or purified EtaA (1 μM final concentration) were incubated with TAZ (100 μM final concentration) at 37°C for 90 min in the buffer described previously (Qian and Ortiz de Montellano, 2006). Reactions were initiated by the addition of enzyme. Reactions were stopped by addition of an equal volume of ice-cold CH3CN. Mixtures were centrifuged at 10,000g for 5 min at 4°C and analyzed by HPLC as described below.
Sf 9 insect cell microsomes containing heterologously expressed human FMO2.1 were incubated with ETA (final concentration 100 μM) for 60 min as described previously (Qian and Ortiz de Montellano, 2006). Reactions were analyzed by liquid chromatography/mass spectroscopy (LC/MS) as described below.
HPLC. The supernatants were diluted to a final concentration of 5% CH3CN and then analyzed by HPLC on a reverse-phase C18 column (3.5-μm particle size, 4.6 mm i.d. × 150 mm, Symmetry; Waters, Milford, MA) using two buffers: A, H2O and 0.1% formic acid (FA) and B, CH3CN and 0.1% FA. The solvent flow rate was 0.2 ml/min, and the eluent was spectrophotometrically monitored using two bandwidths (330 ± 60 and 260 ± 4 nm). The column was eluted from 0 to 25 min with a linear gradient from 5 to 20% buffer B. For spectral analysis of metabolites, eluent peaks were monitored between 200 and 500 nm.
LC/MS Analyses. For analysis of TAZ metabolites, LC/MS was performed as described previously (Qian and Ortiz de Montellano, 2006), with the exception of the following modifications. The reverse-phase column was eluted with a flow rate of 0.2 ml/min (buffer A, H2O and 0.1% FA; buffer B, CH3CN and 0.1% FA) with the following protocol: 0 to 16 min, 5 to 30% buffer B (linear gradient). The eluent was monitored at 310 nm. The mass spectrometer settings were as described previously (Qian and Ortiz de Montellano, 2006).
LC/MS analysis of ETA metabolites produced by FMO2.1 was performed as described above, with the following modifications. The column was eluted at a flow rate of 0.2 ml/min (buffer A, H2O and 0.1% FA; buffer B, CH3CN and 0.1% FA) with the following protocol: 0 to 15 min with 1% buffer B (isocratic). The eluent was monitored at 350 nm.
Determination of Kinetic Parameters by Spectrophotometric Analysis. The molar extinction coefficient of TAZ was determined as follows. Two cuvettes containing 1 ml of Tris-HCl, pH 8.5, 1 mM EDTA were placed in a Varian Cary 100 dual-beam spectrophotometer (Varian, Inc., Palo Alto, CA). The spectrophotometer was set to blank correction mode. TAZ [in dimethyl sulfoxide (DMSO)] was added to the sample cuvette, and DMSO was added to the reference cuvette. The final organic solvent concentration in each cuvette was held at 0.1% (v/v). Using the Varian Scan application, samples were scanned from 200 to 500 nm over a range of TAZ concentrations between 1 and 20 μM. These measurements were carried out in triplicate using three independently prepared stock solutions of TAZ (20 μM) that were diluted accordingly in DMSO. The absorbance of TAZ, measured at its λmax (328 nm), was plotted against concentration. The molar extinction coefficient of TAZ in DMSO was determined from the gradient of this graph and the Beer-Lambert equation.
Enzyme-catalyzed oxidation of TAZ was monitored by measuring the rate of decrease in the absorbance of TAZ at 328 nm using a dual-beam spectrophotometer (Varian Cary 100, kinetics module). The pH optima for human FMOs and EtaA were determined using the following reaction buffers: 0.1 mM potassium phosphate, pH 7.5, 1 mM EDTA; 0.1 M Tris-HCl, pH 8.5, 1 mM EDTA; and 0.1 M Tricine-OH, pH 9.5, 1 mM EDTA. Immediately before use buffers were aerated at 37°C for 30 min in a shaking water bath. Assays were performed in a volume of 1 ml in reaction buffer containing 0.1 mM NADPH and either Sf 9 cell microsomes containing human FMO1 (320 nM), FMO2.1 (5 nM), or FMO3 (230 nM) or purified EtaA (1 μM). Reaction mixtures were allowed to equilibrate for 1 min at 37°C. Reactions were initiated by the addition of TAZ in DMSO (to a final TAZ concentration of 10 μM) to the sample cuvette and DMSO to the reference cuvette. Initial rates were recorded between 1 and 5 min.
For determination of kinetic parameters, assays were performed on triplicate preparations of enzymes at concentrations of TAZ ranging from 1 to 20 μM. The final organic solvent concentration was held at 0.1% (v/v). Assays were carried out in triplicate as described above in the optimum pH buffer for each enzyme: pH 8.5 for FMO1 and FMO3 and pH 9.5 for FMO2.1 and EtaA.
KM and Vmax values were determined from vi versus [S]o data using nonlinear regression and the kinetics module 3.1 of Sigma Plot version 10 (SPSS Inc., Chicago, IL). For calculation of kcat values, enzyme concentration was determined as described above.
Determination of Kinetic Parameters by HPLC Analysis. Sf 9 cell microsomes containing heterologously expressed human FMO2.1 were incubated in 0.1 M Tricine-OH, pH 9.5, 1 mM EDTA, 0.1 mM NADPH, and TAZ (concentrations ranged from 1–50 μM in DMSO). A duplicate set of samples was prepared but without the addition of enzyme. The final organic solvent concentration was held at 0.1% (v/v). Mixtures were incubated at 37°C for 5 min, and reactions were quenched with an equal volume of ice-cold CH3CN. ETA was added as an internal standard at a final concentration of 100 μM (in DMSO), and mixtures were prepared for HPLC analysis as described above. A standard curve was generated by plotting the ratio of the integrated HPLC peak areas of TAZ and ETA (from the sample set without added enzyme) against the range of TAZ concentrations used. The ratio of the integrated HPLC peak areas of TAZ and ETA, in the sample set with added enzyme, was calculated, and the amount of unmetabolized TAZ was determined from the standard curve. This value was subtracted from the input concentration of TAZ to calculate the amount of TAZ metabolized by the enzyme. Vmax, KM, and kcat were determined as above.
Enzyme Incubations with Methimazole. Sf 9 insect cell microsomes containing heterologously expressed human FMO1, FMO2.1, or FMO3 were assayed for activity toward methimazole by the method of Dixit and Roche (1984) as described previously (Dolphin et al., 1998). Assays for FMO1 and FMO3 activity were carried out at pH 8.5, and those for FMO2.1 were done at pH 9.5.
Results
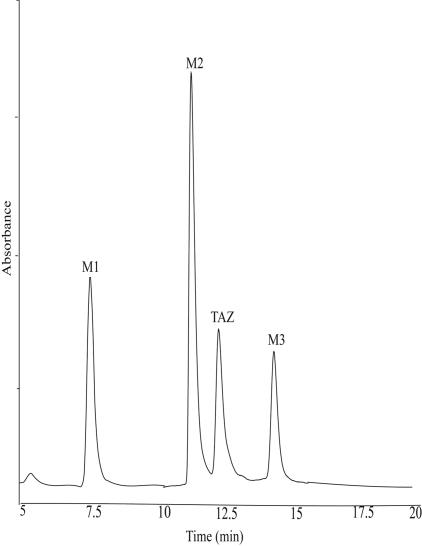
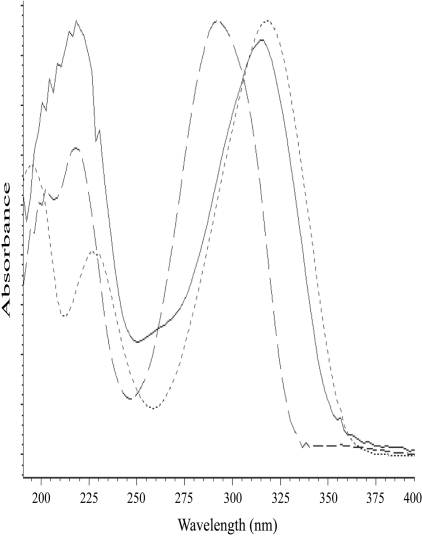
Catalytic Oxidation of TAZ by Human FMO2.1. Incubation of TAZ with Sf9 insect cell microsomes containing heterologously expressed human FMO2.1, in the presence of NADPH, resulted in the formation of three major metabolites with reverse-phase retention times of 7.5 min (M1), 11.4 min (M2), and 14.6 min (M3) (Fig. 1). No products were observed when TAZ was incubated with microsomes isolated from noninfected Sf9 cells or when NADPH was omitted (results not shown). UV spectral analysis of the metabolites (Fig. 2) showed that M1 had a maximal absorption peak at 325 nm and a smaller peak at approximately 230 nm. M2 had a similar spectrum, with peaks at 320 and 220 nm. The absorption spectrum of M3 exhibited a main peak at 295 nm and a secondary peak at 220 nm.
Fig. 1.
UV-HPLC chromatogram of the products from incubations of TAZ with Sf 9 insect cell microsomes containing heterologously expressed human FMO2.1 in the presence of NADPH. Reactions were carried out at pH 9.5 for 90 min at 37°C.
Fig. 2.
UV-absorption spectra of the three metabolites produced from the incubation of TAZ with heterologously expressed human FMO2.1 and NADPH. Dotted line, M1; solid line, M2; and dashed line, M3.
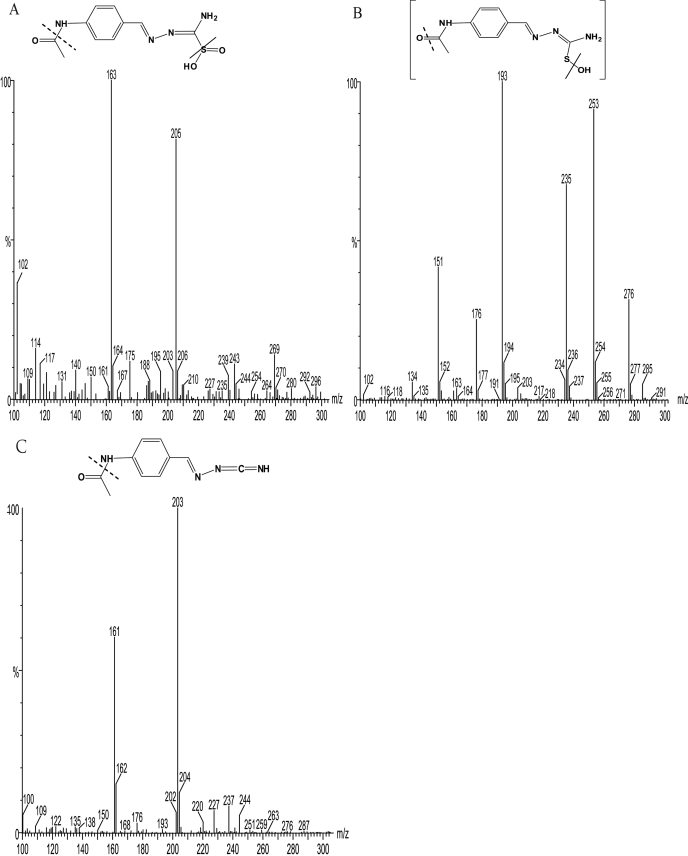
To identify the three metabolites, M1, M2, and M3, formed from TAZ by the action of human FMO2.1, they were analyzed by LC/MS. The mass spectrum of M1 had a molecular ion [M + H]+ at m/z 269.07, with fragment ions at m/z 205.14 and 163.12 (Fig. 3A). The mass of the molecular ion of M1 is 32 atomic mass units more than that of the molecular ion of TAZ (237), suggesting a structure in which TAZ has incorporated two oxygen atoms (Fig. 3A) and hence supports identification of the metabolite as the sulfinic acid derivative. The mass spectrum of M2 had a molecular ion [M + H]+ at m/z 253, with fragment ions at m/z 235 and 193 (Fig. 3B). The mass of the molecular ion of M2 is in accord with a structure in which TAZ has incorporated a single oxygen atom, and thus supports identification of M2 as the monooxygenated, sulfenic acid derivative. The metabolite M3 has a molecular ion [M + H]+ at m/z 203.13, which suggests that it is the carbodiimide generated by elimination from M2 of the oxidized sulfur atom (Fig. 3C). Previously synthesized authentic standards of TAZ-sulfinic acid and TAZ-carbodiimide (Qian and Ortiz de Montellano, 2006) were used to confirm the identity of M1 and M3. Comparison of their HPLC elution times, UV spectra, and MS spectra with those of the synthetic standards unambiguously identified the metabolites M1 and M3 as the sulfinic acid and carbodiimide derivatives of TAZ, respectively.
Fig. 3.
Mass spectra and structures of the products from incubations of TAZ with Sf 9 insect cell microsomes containing heterologously expressed human FMO2.1 in the presence of NADPH in 100 mM tricine buffer, pH 9.5, for 90 min at 37°C. A, M1, identified as the sulfinic acid, has a molecular ion [M + H]+ = m/z 269.07, with fragment ions at m/z 205.14 and 163.12. B, M2, identified as the sulfenic acid, has a molecular ion [M + H]+ = m/z 253, with fragment ions at m/z 235 and 193. C, M3, identified as the carbodiimide, has a molecular ion [M + H]+ = m/z 203.13, with a fragment ion at m/z 161.11.
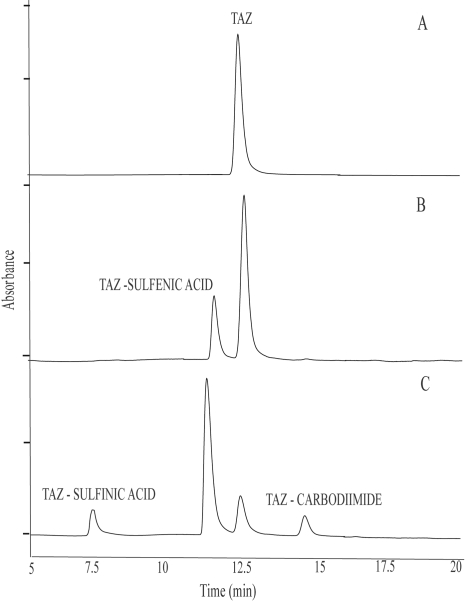
The same three metabolites (the sulfinic acid, sulfenic acid, and carbodiimide derivatives) were also produced when TAZ was incubated with purified EtaA or Sf9 cell microsomes containing heterologously expressed human FMO1 or FMO3 (data not shown). Previous work identified M1 and M3 as products formed by the action of these enzymes on TAZ (Qian and Ortiz de Montellano, 2006). Although the sulfenic acid derivative (M2) was not detected, it was postulated as an intermediate in the enzyme-catalyzed metabolism of TAZ (Qian and Ortiz de Montellano, 2006). To confirm this, incubations of TAZ with heterologously expressed human FMO2.1 were quenched at different time points (Fig. 4). It is clear from the results that formation and accumulation of M2 precede that of M1 and M3, indicating that M2 is an intermediate in the formation of the latter two metabolites.
Fig. 4.
UV-HPLC chromatograms of the products from incubations of TAZ with Sf 9 insect cell microsomes containing heterologously expressed human FMO2.1 in the presence of NADPH. Reactions were carried out at pH 9.5 and 37°C for 0 min (A), 10 min (B), or 20 min (C).
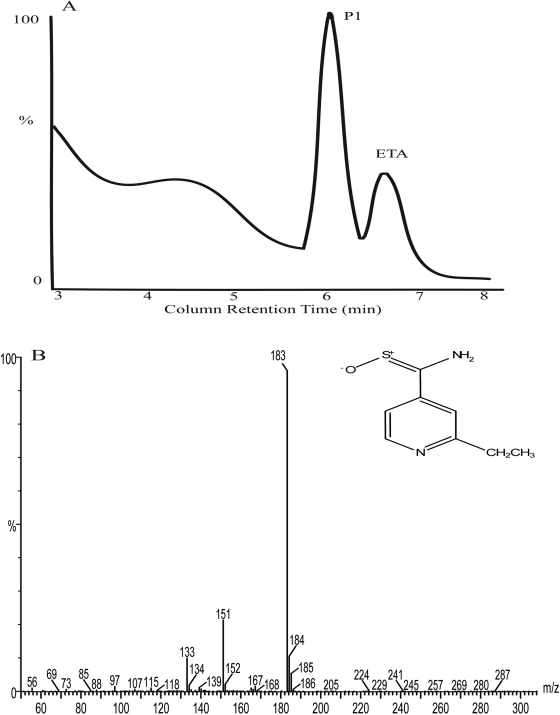
Catalytic Oxidation of ETA by Human FMO2.1. Incubation of ETA with Sf9 microsomes containing heterologously expressed human FMO2.1, in the presence of NADPH, resulted in the formation of a major product, P1, with LC retention time of 6.2 min (Fig. 5A). The mass spectrum of P1 had a molecular ion [M + H]+ at m/z 183, with fragment ions at m/z 151 and 133 (Fig. 5B). The mass of the molecular ion of P1 is 16 atomic mass units more than that of the molecular ion of ETA (166), suggesting a structure in which ETA has incorporated one oxygen atom (Fig. 5B). This supports identification of P1 as the S-oxide of ETA. The retention time and mass spectrum of P1 are identical to those of authentic ETA S-oxide (Vannelli et al., 2002), therefore unambiguously identifying this metabolite as the S-oxide of ETA. A mass spectrum of the broad peak with an LC retention time of approximately 4 min (Fig. 5A) could not be obtained.
Fig. 5.
Analysis of the products from incubation of ETA with Sf 9 insect cell microsomes containing heterologously expressed human FMO2.1 and NADPH in 100 mM potassium phosphate buffer, pH 7.5, for 60 min at 37°C. A, LC chromatogram (350 nm). B, the mass spectrum and structure of the product P1. P1 has a molecular ion [M + H]+ at m/z 183, with fragment ions at m/z 151 and 133.
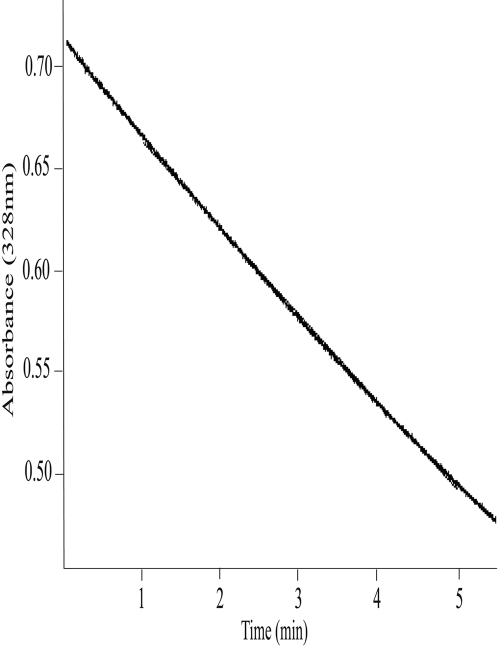
Development of a Spectrophotometric Assay of TAZ Oxidation. A UV absorption spectrum of TAZ revealed an absorption maximum at 328 nm and a smaller peak at approximately 220 nm (data not shown). The absorbance of TAZ at 328 nm was linear between 1 and 20 μM (data not shown), and at this wavelength the molar extinction coefficient of TAZ in DMSO was determined as 38,300 ± 2320 M–1cm–1. Incubation of TAZ, in the presence of NADPH, with Sf9 cell microsomes containing heterologously expressed human FMO1, FMO2.1, or FMO3, or with purified EtaA resulted in a decrease in TAZ absorbance at 328 nm that was linear over time (Fig. 6 and data not shown) and with respect to enzyme concentration. No decrease in TAZ absorbance was observed in the absence of EtaA or human FMOs or when microsomes prepared from noninfected Sf9 cells were used. Omission of NADPH from reaction mixtures containing heterologously expressed human FMOs resulted in a very small (<1% of that observed in the presence of NADPH) and short-lived (<2 min) decrease in TAZ absorbance. This is because of the presence of endogenous NADPH in the insect cell microsomes. This spectrophotometric assay was used to determine the pH optima and kinetic parameters of enzyme-catalyzed oxidation of TAZ.
Fig. 6.
Linearity of FMO2.1- and NADPH-dependent decrease in TAZ absorbance over time. TAZ (20 μM) was incubated with Sf 9 insect cell microsomes containing heterologously expressed human FMO2.1 and NADPH in tricine buffer, pH 9.5, at 37°C, and absorbance at 328 nm was monitored over time.
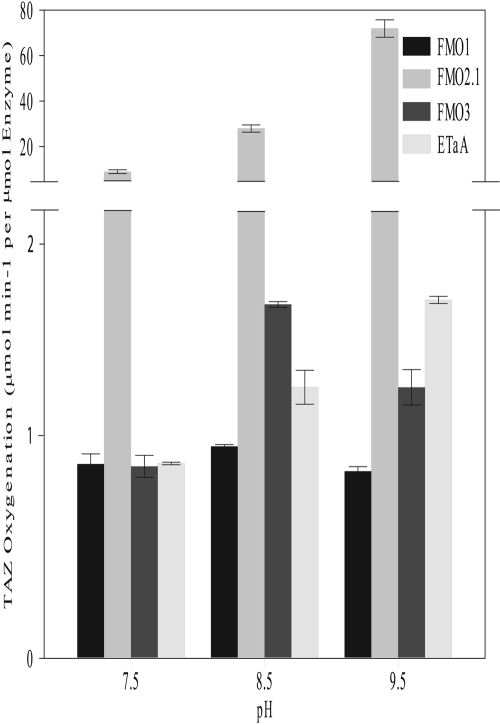
Effect of pH on TAZ Oxidation Catalyzed by Human FMOs and EtaA. TAZ was incubated with purified EtaA or with heterologously expressed human FMO1, FMO2.1, or FMO3 in buffers of pH 7.5, 8.5, or 9.5. Oxidation of TAZ was measured spectrophotometrically. The pH optimum for the oxidation of TAZ at a concentration of 10 μM was 8.5 for human FMO1 and FMO3 and 9.5 for human FMO2.1 and EtaA (Fig. 7).
Fig. 7.
Effect of pH on the rate of TAZ oxygenation catalyzed by purified EtaA or by heterologously expressed human FMO1, FMO2.1, or FMO3. The initial concentration of TAZ was 10 μM. The decrease in TAZ concentration over time was measured at 328 nm in the presence of NADPH in buffers at pH 7.5, 8.5, or 9.5.
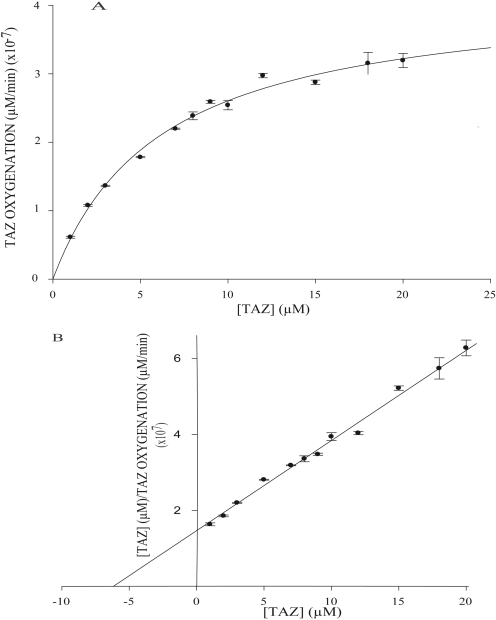
Kinetics of TAZ Oxidation by Human FMOs and EtaA. The kinetics of TAZ oxidation catalyzed by EtaA or heterologously expressed human FMO1, FMO2.1, or FMO3 was evaluated by determining the initial rates of TAZ oxidation, measured spectrophotometrically, over a range of TAZ concentrations (Fig. 8 and data not shown). Assays were performed at the optimum pH determined for each enzyme as described above. Steady-state kinetic parameters were determined from vi versus [S] data by nonlinear regression.
Fig. 8.
A, Michaelis-Menten plot of TAZ oxygenation catalyzed by heterologously expressed human FMO2.1 in the presence of NADPH at pH 9.5. B, linear transform of Michaelis-Menten data using Hanes-Woolf regression (r2 = 0.961).
The KM values for TAZ oxidation catalyzed by human FMO1, FMO2.1, and FMO3 are very similar to each other and slightly lower than that of the EtaA-catalyzed reaction (Table 1). The kcat of the FMO2.1-catalyzed reaction is much higher than that of reactions catalyzed by human FMO1, FMO3, or EtaA (Table 1). Consequently, kcat/KM (the specificity constant) for TAZ is much higher for human FMO2.1 than for the other three enzymes (Table 1). Very similar kinetic parameters for FMO2.1-catalyzed TAZ oxygenation were obtained through the use of an HPLC-based assay, thus validating the spectrophotometric assay (data not shown).
TABLE 1.
Kinetic parameters of enzyme-catalyzed oxygenation of TAZ and methimazole
TAZ assays were performed in triplicate on batches of microsomes isolated from three independent infections of Sf9 cells (i.e., nine measurements per FMO). Methimazole assays were performed in triplicate on a single batch of microsomes for each heterologously expressed human FMO. EtaA assays were performed in triplicate on purified protein. Kinetic parameters are reported as mean ± S.E.
|
Enzyme
|
Thiacetazone
|
Methimazole
|
||||
|---|---|---|---|---|---|---|
| KM | kcat | kcat/KM | KM | kcat | kcat/KM | |
| μM | min-1 | min-1 M-1 (×105) | μM | min-1 | min-1 M-1 (×104) | |
| FMO1 | 6.30 ± 0.80 | 5.08 ± 0.46 | 7.94 ± 1.99 | 8.08 ± 2.35 | 2.27 ± 0.30 | 28.11 ± 7.95 |
| FMO2.1 | 5.80 ± 0.55 | 80.10 ± 4.42 | 142.56 ± 18.30 | 575.75 ± 60.02 | 31.50 ± 2.11 | 5.48 ± 0.68 |
| FMO3 | 7.01 ± 0.53 | 1.37 ± 0.20 | 1.96 ± 0.39 | 29.30 ± 4.06 | 2.60 ± 0.38 | 8.97 ± 1.81 |
| EtaA | 9.05 ± 0.57 | 3.02 ± 0.30 | 3.29 ± 0.81 | N.D. | N.D. | N.D. |
N.D., not determined.
As a comparison, we determined kinetic parameters for FMO1-, FMO2.1-, and FMO3-catalyzed oxygenation of methimazole, a prototypic substrate for FMOs (Table 1). The kcat of each enzyme was similar for TAZ and methimazole. However, for FMO2.1 the KM for methimazole was 100-fold greater than that for TAZ. Consequently, for methimazole oxygenation, the kcat/KM of FMO2.1 is considerably less than that of FMO1 and slightly less than that of FMO3.
Discussion
Our results show that full-length, functional FMO2 of human (FMO2.1) catalyzes oxygenation of the second-line thiourea antitubercular drug TAZ in vitro. The metabolites generated, the sulfenic acid, sulfinic acid, and carbodiimide derivatives, are the same as those produced by the action of human FMO1, human FMO3, or the mycobacterial enzyme EtaA. The sulfinic acid and carbodiimide derivatives have been identified previously as products of TAZ oxygenation catalyzed by FMO1, FMO3, or EtaA (Qian and Ortiz de Montellano, 2006). Although these authors did not detect the sulfenic acid derivative, it was postulated to be an intermediate. Our results confirm that in reactions catalyzed by all three human FMOs and by EtaA, TAZ sulfenic acid is indeed an intermediate in the formation of the sulfinic acid and carbodiimide metabolites.
Human FMO2.1 also catalyzes the oxygenation of ETA, a thioamide second-line antitubercular. The single metabolite identified, the S-oxide, has been shown to be the product of EtaA-catalyzed metabolism of the drug (Vannelli et al., 2002). However, the second product identified by these authors, the amide of ETA, was not detected in our study.
Our kinetic analyses reveal that kcat/KM (the specificity constant) for FMO2.1-catalyzed TAZ oxygenation is much higher than that of FMO1, FMO3, or the mycobacterial enzyme EtaA, indicating that FMO2.1 is more effective in catalyzing TAZ oxygenation than are the other three enzymes. In contrast, FMO2.1 is less effective than FMO1 or FMO3 in catalyzing the oxygenation of methimazole. Although kinetic analyses were done at the pH optimum for each enzyme, even at a more physiological pH, 7.5, as shown in Fig. 7, FMO2.1 is the most effective of the enzymes studied in catalyzing TAZ oxygenation. The higher value of the specificity constant of FMO2.1 for TAZ is a consequence of the higher kcat value rather than a lower KM value, which is similar to those of the other enzymes with lower kcat values (Table 1). Similar high kcat values have been reported for human FMO2.1-catalyzed oxygenation of other thioureas, including thiourea and ethylene-thiourea (Henderson et al., 2004). The relatively low kcat values determined for TAZ oxygenation catalyzed by FMO1 and FMO3 are comparable to those reported for oxygenation of a panel of thioureas by these enzymes (Onderwater et al., 2006). The high values of KM and kcat determined for FMO2.1-catalyzed oxygenation of methimazole are similar to the values reported for purified or heterologously expressed FMO2 of rabbit (Lawton et al., 1991).
Spectrophotometric and kinetic studies indicate that the rate-limiting step for FMO-catalyzed reactions occurs after substrate oxygenation (reviewed in Ziegler, 2002) and thus is independent of oxidizable substrate. Consequently, for a particular FMO, the value of kcat would be expected to be similar for all its substrates. Although our results conform to this expectation, they indicate that the kcat of human FMO2.1 is higher than that of FMO1 or FMO3, suggesting that FMO2.1 is more effective in catalyzing the rate-limiting step of the reaction, the elimination of H2O, than is either of the other two FMOs investigated.
Substrate oxygenation by FMOs is usually a detoxification process. However, in the case of thioureas, the products of FMO-catalyzed oxygenation are typically more toxic than the parent compound (Smith and Crespi, 2002; Henderson et al., 2004; Onderwater et al., 2004, 2006). TAZ sulfenic acid is an electrophile that can react with glutathione (GSH) (Qian and Ortiz de Montellano, 2006) to regenerate the parent compound and convert GSH to its oxidized form (GSSG). In the presence of GSH reductase, a redox cycle may be established that depletes GSH, thus causing oxidative stress and cellular injury (Krieter et al., 1984; Henderson et al., 2004; Onderwater et al., 2004). Sulfenic acid metabolites of thioureas can react covalently with other thiol-containing molecules, such as cysteine residues in proteins, and thus directly perturb protein function (Decker and Doerge, 1992). The TAZ carbodiimide also has the potential to form covalent products with cysteine residues in proteins. Thus, each of the human FMOs that we have investigated—FMO1, FMO2.1, and FMO3—is able to catalyze oxygenation of TAZ, producing metabolites that are known to be harmful to mammalian cells.
The FMO-catalyzed production of TAZ metabolites that are known to be harmful to mammalian cells may be the basis for the adverse clinical reactions associated with this drug (Teklu, 1976; Brown, 1992; Peloquin, 1993; Ipuge et al., 1995). This is supported by the fact that all the adverse effects associated with TAZ occur in tissues in which FMOs are expressed: hepatotoxicity, FMO3 in the liver (Dolphin et al., 1996; Hernandez et al., 2004); gastrointestinal problems, FMO1 in the small intestine (Yeung et al., 2000); and skin rashes, FMO1 and FMO3 in skin (Janmohamed et al., 2001).
Human FMO1 and FMO3 are expressed primarily in the kidney and liver, respectively, and thus may contribute to the extrapulmonary metabolism of TAZ. FMO1 displays interindividual variation in its expression (Yeung et al., 2000; Koukouritaki et al., 2002), and several nonsynonymous polymorphic variants of FMO3 have been identified (reviewed in Phillips et al., 2007; Phillips and Shephard, 2008), one of which, L360P, increases enzyme activity (Lattard et al., 2003), whereas others, such as E158K and E308G, when present together in cis, decrease enzyme activity (reviewed in Phillips et al., 2007; Phillips and Shephard, 2008). Promoter variants that affect transcription have also been identified (Koukouritaki et al., 2005). Therefore, individuals who have lower expression or activity of FMO1 or FMO3 would be less able to metabolize TAZ in extrapulmonary tissues, whereas those with higher expression or activity would metabolize TAZ more effectively, thus reducing the amount of prodrug reaching the lung and increasing the amounts of metabolites toxic to the host. Polymorphic variants in FMO3 have been shown to influence the metabolism and therapeutic outcomes of drugs such as benzydamine and sulindac (Störmer et al., 2000; Hisamuddin et al., 2005).
TAZ and ETA are prodrugs that are converted to their active forms in mycobacteria. Therefore, for treatment to be effective, a sufficient amount of unmetabolized drug must reach mycobacteria in the lung. Although Europeans and Asians lack functional FMO2, a substantial proportion of sub-Saharan Africans and individuals of recent African descent possess an ancestral FMO2*1 allele (Whetstine et al., 2000; Veeramah et al., 2008) and thus would be expected to express functional FMO2 in the lung (Krueger et al., 2002). The relatively high specificity constant for FMO2.1-catalyzed TAZ oxygenation suggests that, when present in lung, FMO2.1 is likely to contribute substantially to the metabolism of TAZ in this tissue, thus decreasing the availability of the prodrug to mycobacteria and producing metabolites toxic to the host. Therefore, patients with multidrug-resistant TB who express FMO2.1 may respond less well to treatment with second-line antitubercular drugs such as TAZ and ETA and may be more prone to adverse clinical reactions to these drugs. The relatively high frequency of the FMO2*1 allele in sub-Saharan Africa, a region in which TB is a major health problem, has implications for the efficacy of and response to antitubercular drugs, such as TAZ and ETA, that are substrates for FMO2.1.
Acknowledgments
We thank Dr. R. Philpot for antibodies to FMOs and FMO protein standards and Prof. Keith Brocklehurst for helpful comments on the manuscript.
The work in San Francisco was supported by National Institutes of Health [Grant AI074824].
Article, publication date, and citation information can be found at http://dmd.aspetjournals.org.
doi:10.1124/dmd.108.024158.
ABBREVIATIONS: TB, tuberculosis; TAZ, thiacetazone; ETA, ethionamide; FMO, flavin-containing monooxygenase; HPLC, high-performance liquid chromatography; Sf, Spodoptera frugiperda; LC/MS, liquid chromatography/mass spectrometry; FA, formic acid; DMSO, dimethyl sulfoxide; GSH, glutathione.
References
- Alahari A, Trivelli X, Guérardel Y, Dover LG, Besra GS, Sacchettini JC, Reynolds RC, Coxon GD, and Kremer L (2007) Thiacetazone, an antitubercular drug that inhibits cyclopropanation of cell wall mycolic acids in mycobacteria. PLoS ONE 2 e1343. [DOI] [PMC free article] [PubMed] [Google Scholar]
- Baulard AR, Betts JC, Engohang-Ndong J, Quan S, McAdam RA, Brennan PJ, Locht C, and Besra GS (2000) Activation of the pro-drug ethionamide is regulated in mycobacteria. J Biol Chem 275 28326–28331. [DOI] [PubMed] [Google Scholar]
- Brown P (1992) Cheap TB drug `too dangerous' for Africa. New Sci 135 5. [PubMed] [Google Scholar]
- Cashman JR and Zhang J (2006) Human flavin-containing monooxygenases. Annu Rev Pharmacol Toxicol 46 65–100. [DOI] [PubMed] [Google Scholar]
- DeBarber AE, Mdluli K, Bosman M, Bekker LG, and Barry CE 3rd (2000) Ethionamide activation and sensitivity in multidrug-resistant Mycobacterium tuberculosis. Proc Natl Acad Sci U S A 97 9677–9682. [DOI] [PMC free article] [PubMed] [Google Scholar]
- Decker CJ and Doerge DR (1992) Covalent binding of 14C- and 35S-labeled thiocarbamides in rat hepatic microsomes. Biochem Pharmacol 43 881–888. [DOI] [PubMed] [Google Scholar]
- Dixit A and Roche TE (1984) Spectrophotometric assay of the flavin-containing monooxygenase and changes in its activity in female mouse liver with nutritional and diurnal conditions. Arch Biochem Biophys 233 50–63. [DOI] [PubMed] [Google Scholar]
- Dolphin C, Shephard EA, Povey S, Palmer CN, Ziegler DM, Ayesh R, Smith RL, and Phillips IR (1991) Cloning, primary sequence, and chromosomal mapping of a human flavin-containing monooxygenase (FMO1). J Biol Chem 266 12379–12385. [PubMed] [Google Scholar]
- Dolphin CT, Beckett DJ, Janmohamed A, Cullingford TE, Smith RL, Shephard EA, and Phillips IR (1998) The flavin-containing monooxygenase 2 gene (FMO2) of humans, but not of other primates, encodes a truncated, nonfunctional protein. J Biol Chem 273 30599–30607. [DOI] [PubMed] [Google Scholar]
- Dolphin CT, Cullingford TE, Shephard EA, Smith RL, and Phillips IR (1996) Differential developmental and tissue-specific regulation of expression of the genes encoding three members of the flavin-containing monooxygenase family of man, FMO1, FMO3 and FM04. Eur J Biochem 235 683–689. [DOI] [PubMed] [Google Scholar]
- Dolphin CT, Janmohamed A, Smith RL, Shephard EA, and Phillips IR (1997) Missense mutation in flavin-containing mono-oxygenase 3 gene, FMO3, underlies fish-odour syndrome. Nat Genet 17 491–494. [DOI] [PubMed] [Google Scholar]
- Dover LG, Alahari A, Gratraud P, Gomes JM, Bhowruth V, Reynolds RC, Besra GS, and Kremer L (2007) EthA, a common activator of thiocarbamide-containing drugs acting on different mycobacterial targets. Antimicrob Agents Chemother 51 1055–1063. [DOI] [PMC free article] [PubMed] [Google Scholar]
- Henderson MC, Krueger SK, Stevens JF, and Williams DE (2004) Human flavin-containing monooxygenase form 2 S-oxygenation: sulfenic acid formation from thioureas and oxidation of glutathione. Chem Res Toxicol 17 633–640. [DOI] [PubMed] [Google Scholar]
- Hernandez D, Janmohamed A, Chandan P, Phillips IR, and Shephard EA (2004) Organization and evolution of the flavin-containing monooxygenase genes of human and mouse: identification of novel gene and pseudogene clusters. Pharmacogenetics 14 117–130. [DOI] [PubMed] [Google Scholar]
- Hisamuddin IM, Wehbi MA, Schmotzer B, Easley KA, Hylind LM, Giardiello FM, and Yang VW (2005) Genetic polymorphisms of flavin monooxygenase 3 in sulindac-induced regression of colorectal adenomas in familial adenomatous polyposis. Cancer Epidemiol Biomarkers Prev 14 2366–2369. [DOI] [PMC free article] [PubMed] [Google Scholar]
- Ipuge YA, Rieder HL, and Enarson DA (1995) Adverse cutaneous reactions to thiacetazone for tuberculosis treatment in Tanzania. Lancet 346 657–660. [DOI] [PubMed] [Google Scholar]
- Janmohamed A, Dolphin CT, Phillips IR, and Shephard EA (2001) Quantification and cellular localization of expression in human skin of genes encoding flavin-containing monooxygenases and cytochromes P450. Biochem Pharmacol 62 777–786. [DOI] [PubMed] [Google Scholar]
- Janmohamed A, Thaunsukon P, Shephard EA, and Phillips R (2006) Expression of recombinant flavin-containing monooxygenases in a baculovirus/insect cell system, in Cytochrome P450 Protocols (Phillips IR and Shephard EA eds) ed 2, pp 307–319, Humana Press Totowa, NJ.
- Koukouritaki SB, Poch MT, Cabacungan ET, McCarver DG, and Hines RN (2005) Discovery of novel flavin-containing monooxygenase 3 (FMO3) single nucleotide polymorphisms and functional analysis of upstream haplotype variants. Mol Pharmacol 68 383–392. [DOI] [PubMed] [Google Scholar]
- Koukouritaki SB, Simpson P, Yeung CK, Rettie AE, and Hines RN (2002) Human hepatic flavin-containing monooxygenases 1 (FMO1) and 3 (FMO3) developmental expression. Pediatr Res 51 236–243. [DOI] [PubMed] [Google Scholar]
- Krieter PA, Ziegler DM, Hill KE, and Burk RF (1984) Increased biliary GSSG efflux from rat livers perfused with thiocarbamide substrates for the flavin-containing monooxygenases. Mol Pharmacol 26 122–127. [PubMed] [Google Scholar]
- Krueger SK, Martin SR, Yueh MF, Pereira CB, and Williams DE (2002) Identification of active flavin-containing monooxygenase isoform 2 in human lung and characterization of expressed protein. Drug Metab Dispos 30 34–41. [DOI] [PubMed] [Google Scholar]
- Krueger SK and Williams DE (2005) Mammalian flavin-containing monooxygenases: structure/function, genetic polymorphisms and role in drug metabolism. Pharmacol Ther 106 357–387. [DOI] [PMC free article] [PubMed] [Google Scholar]
- Lattard V, Zhang J, Tran Q, Furnes B, Schlenk D, and Cashman JR (2003) Two new polymorphisms of the FMO3 gene in Caucasian and African-American populations: comparative genetic and functional studies. Drug Metab Dispos 31 854–860. [DOI] [PubMed] [Google Scholar]
- Lawton MP, Kronbach T, Johnson EF, and Philpot RM (1991) Properties of expressed and native flavin-containing monooxygenases: evidence of multiple forms in rabbit liver and lung. Mol Pharmacol 40 692–698. [PubMed] [Google Scholar]
- Onderwater RC, Commandeur JN, and Vermeulen NP (2004) Comparative cytotoxicity of N-substituted N′-(4-imidazole-ethyl)thiourea in precision-cut rat liver slices. Toxicology 197 81–91. [DOI] [PubMed] [Google Scholar]
- Onderwater RC, Rettie AE, Commandeur JN, and Vermeulen NP (2006) Bioactivation of N-substituted N′-(4-imidazole-ethyl)thioureas by human FMO1 and FMO3. Xenobiotica 36 645–657. [DOI] [PubMed] [Google Scholar]
- Peloquin CA (1993) Pharmacology of the antimycobacterial drugs. Med Clin North Am 77 1253–1262. [DOI] [PubMed] [Google Scholar]
- Phillips IR, Dolphin CT, Clair P, Hadley MR, Hutt AJ, McCombie RR, Smith RL, and Shephard EA (1995) The molecular biology of the flavin-containing monooxygenases of man. Chem Biol Interact 96 17–32. [DOI] [PubMed] [Google Scholar]
- Phillips IR, Francois AA, and Shephard EA (2007) The flavin-containing monooxygenases (FMOs): Genetic variation and its consequences for the metabolism of therapeutic drugs. Current Pharmacogenomics 5 292–313. [Google Scholar]
- Phillips IR and Shephard EA (2008) Flavin-containing monooxygenases: mutations, disease and drug response. Trends Pharmacol Sci 29 294–301. [DOI] [PubMed] [Google Scholar]
- Qian L and Ortiz de Montellano PR (2006) Oxidative activation of thiacetazone by the Mycobacterium tuberculosis flavin monooxygenase EtaA and human FMO1 and FMO3. Chem Res Toxicol 19 443–449. [DOI] [PMC free article] [PubMed] [Google Scholar]
- Smith PB and Crespi C (2002) Thiourea toxicity in mouse C3H/10T1/2 cells expressing human flavin-dependent monooxygenase 3. Biochem Pharmacol 63 1941–1948. [DOI] [PubMed] [Google Scholar]
- Störmer E, Roots I, and Brockmöller J (2000) Benzydamine N-oxidation as an index reaction reflecting FMO activity in human liver microsomes and impact of FMO3 polymorphisms on enzyme activity. Br J Clin Pharmacol 50 553–561. [DOI] [PMC free article] [PubMed] [Google Scholar]
- Teklu B (1976) Gastrointestinal toxicity of thiacetazone. Ethiop Med J 14 17–22. [PubMed] [Google Scholar]
- Vannelli TA, Dykman A, and Ortiz de Montellano PR (2002) The antituberculosis drug ethionamide is activated by a flavoprotein monooxygenase. J Biol Chem 277 12824–12829. [DOI] [PubMed] [Google Scholar]
- Veeramah KR, Thomas MG, Weale ME, Zeitlyn D, Tarekegn A, Bekele E, Mendell NR, Shephard EA, Bradman N, and Phillips IR (2008) The potentially deleterious functional variant flavin-containing monooxygenase 2*1 is at high frequency throughout Sub-Saharan Africa. Pharmacogenet Genomics 18 877–886. [DOI] [PMC free article] [PubMed] [Google Scholar]
- Whetstine JR, Yueh MF, McCarver DG, Williams DE, Park CS, Kang JH, Cha YN, Dolphin CT, Shephard EA, Phillips IR, et al. (2000) Ethnic differences in human flavin-containing monooxygenase 2 (FMO2) polymorphisms: detection of expressed protein in African-Americans. Toxicol Appl Pharmacol 168 216–224. [DOI] [PubMed] [Google Scholar]
- Yeung CK, Lang DH, Thummel KE, and Rettie AE (2000) Immunoquantitation of FMO1 in human liver, kidney, and intestine. Drug Metab Dispos 28 1107–1111. [PubMed] [Google Scholar]
- Ziegler DM (2002) An overview of the mechanism, substrate specificities, and structure of FMOs. Drug Metab Rev 34 503–511. [DOI] [PubMed] [Google Scholar]


