

Abstract
Motivation: As ArrayExpress and other repositories of genome-wide experiments are reaching a mature size, it is becoming more meaningful to search for related experiments, given a particular study. We introduce methods that allow for the search to be based upon measurement data, instead of the more customary annotation data. The goal is to retrieve experiments in which the same biological processes are activated. This can be due either to experiments targeting the same biological question, or to as yet unknown relationships.
Results: We use a combination of existing and new probabilistic machine learning techniques to extract information about the biological processes differentially activated in each experiment, to retrieve earlier experiments where the same processes are activated and to visualize and interpret the retrieval results. Case studies on a subset of ArrayExpress show that, with a sufficient amount of data, our method indeed finds experiments relevant to particular biological questions. Results can be interpreted in terms of biological processes using the visualization techniques.
Availability: The code is available from http://www.cis.hut.fi/projects/mi/software/ismb09.
Contact: jose.caldas@tkk.fi
1 INTRODUCTION
The most common approach for searching in microarray databases is based on metadata such as annotations and descriptions of the arrays and genes (Zhu et al., 2008). Such searches are naturally useful, given that the quality of annotations is good, the search task is reasonably well focused to match the capabilities of the search engine and, most importantly, known things are sought for. The annotations can naturally only contain known things.
An alternative is to search with an interesting gene or gene set as the query, resulting in datasets where the query genes are correlated (Hibbs et al., 2007) or differentially expressed (Parkinson et al., 2009).
In this work, we develop methods for performing searches having an experiment as the query. The simplest method would be content-based search, where the query would be one microarray and the set of most similar microarrays would be retrieved (Fujibuchi et al., 2007; Hunter et al., 2001). The obvious problem is how to choose the distance measure, with which the similarity of the expression profiles will be assessed.
The search problem is related to the natural suggestion that analysis of a new dataset would benefit from putting it in the context of all earlier datasets (Tanay et al., 2005). In that study, the authors develop a method for extracting a set of biclusters from earlier studies and evaluating the activity of those biclusters in a new experiment. In another holistic analysis paper (Segal et al., 2004), a ‘module map’ of gene modules versus clinical conditions was formed by first finding differentially expressed gene sets, then combining them into modules and finally identifying modules differentially expressed over a set of arrays having the same annotation. More recently, a tool called the Connectivity Map was developed for relating diseases and chemicals via common gene expression profiles (Lamb et al., 2006). These ideas can naturally be extended by incorporating more biological knowledge into the model, for instance in the form of regulatory networks, partly assumed and partly learned from data. Of course, the computational complexity will increase accordingly.
What we would like to do is to take the idea of extracting information about biological processes from the gene expression compendium, and to use it in the search process to focus the search on biologically relevant things. This we would like to do in an at least partly data-driven way, in order to be able to find unexpected things in addition to the already known things available for metadata searches. Moreover, out of all potentially biologically relevant things, we would like to focus on the ones that were differentially activated as a result of the experimental setup. Finally, the models used for the compendium need to be reasonably simple to keep the searches scalable, but they still need to be able to extract relevant things.
We will need four elements to make the searches successful: (i) a model for the activity of biological processes across the compendium, which should be able to make the miscellaneous experiments and data types stored in the database commensurable, (ii) a way of performing searches given the model, having one experiment as the query and (iii) ways of visualizing the search results. As an additional insight we would like to ensure that (iv) the retrieved experiments would be relevant in the sense that the same biological processes were activated by the experimental treatment in them, as in the query experiment.
For (i), we would like to specify the model such that it will both incorporate some prior knowledge about biological processes and learn new things from data. Both steps need to be simple to keep the computational load manageable. We chose the simplest form of prior biological knowledge available, used in some of the earlier holistic analyses as well: gene sets extracted from earlier analyses. The gene sets will be incorporated by using Gene Set Enrichment Analysis (GSEA) (Subramanian et al., 2005) in a new way. Each experiment, both the query and the earlier ones in the compendium, will be encoded as a vector containing the number of differentially expressed genes in each set. This step makes the different experiments commensurable. Moreover, when the differential expression is measured for the main experimental variable compared to control, the encoding focuses on the changes each experiment targeted [item (iv) above].
We use the so-called topic models or discrete principal component analysis (Blei et al., 2003; Buntine and Jakulin, 2004), which have earlier been successfully used in textual information retrieval. The topic models are suitable for finding latent components from count data, such as texts assumed to be bags of words. Being probabilistic models they can infer the underlying components taking the uncertainty in the data properly into account. For gene expression, we change the counts of words to counts of differentially expressed genes in gene sets, one word type corresponding to one gene set. Each experiment will then correspond to an activity profile over the components, and each component will correspond to a distribution over the gene sets. The differences from earlier applications of topic models to discretized genomic data (Flaherty et al., 2005; Gerber et al., 2007) are the use of gene sets to bring in biological knowledge, focusing to effects elicited by the experimental treatments and the application to retrieval.
Given a topic model, there are well-justified methods for doing information retrieval (Buntine and Jakulin, 2004; Griffiths and Steyvers, 2004) for texts, where the query is simply another document. The same principles apply for querying with a new experiment here, and we borrow them for item (ii).
Finally, we will need to visualize both the components to interpreting the biological findings, and the retrieval results in order to be able to browse the collection. We will both apply earlier methods (Venna and Kaski, 2007) and develop new ones.
2 METHODS
2.1 Gene expression dataset
We obtained 288 pre-processed human gene expression microarray experiments from the ArrayExpress database (Parkinson et al., 2009). By an experiment, we mean a set of microarrays from a particular paper. Each experiment is associated with a collection of experimental factors describing the variables under study, e.g. ‘disease state’ or ‘gender’. Each microarray in an experiment takes on a specific value for each of the experimental factors, e.g. ‘disease state = normal’ and ‘gender = male’.
We have focused on experiments having the experimental factor ‘disease state’, and decomposed them into sub-experiments, or comparisons, of healthy tissue against a particular pathology. This yielded a total of 105 comparisons that included a wide range of pathologies such as several cancer types, as well as neurological, respiratory, digestive, infectious and muscular diseases (although the only significantly frequent broad category was cancer, with 27 comparisons).
We also systematically transformed the remaining experiments in the dataset into collections of simpler comparisons. For each experimental factor in an experiment, we chose to compare either two values of that experimental factor (e.g. disease A versus disease B), or one value versus all others (e.g. control versus all treatments). In experiments with more than one experimental factor, the factors whose values are not being compared provide a context for the comparison. For example, when comparing two values of ‘disease state’, e.g. ‘normal’ versus ‘cancer’, we can get different comparisons for ‘gender = male’ and for ‘gender = female’.
For each comparison, we generated all possible combinations of contextual factors. We kept all comparisons that had at least six microarrays assigned to each phenotype, mapping probesets to HUGO gene symbols (Eyre et al., 2006) and collapsing equivalent probesets by their median. The total number of obtained comparisons, including the 105 ‘healthy versus disease’ comparisons mentioned above, was 768.
2.2 Topic model
2.2.1 GSEA
this tests if a set of genes is coordinately associated with the difference between two phenotypes in a microarray experiment. Here we give a very brief description; for more details and for software we used, see the original papers (Mootha et al., 2003; Subramanian et al., 2005). GSEA starts by computing a ranked list of the genes in the experiment, according to how well each gene discriminates between the two phenotypes. This can be achieved by using metrics such as fold change or signal-to-noise ratio. Then, a weighted Kolmogorov–Smirnov (KS) running statistic, deemed the enrichment score (ES), is computed over the list. The ES, after normalization, is used to compute significance measures such as the family-wise error rate and the false discovery rate (FDR) q-value. The computation of the statistic also produces a subset of the genes in the set. That subset, called the leading edge subset, constitutes a tentative core for the gene set.
We used GSEA to bring in biological knowledge in the form of the pre-defined gene sets. In effect, we quantified the differential expression within each set as a count. In brief, a sub-experiment essentially consists of a collection of microarrays that is divided into two sample categories, or phenotypes. Designate those phenotypes, respectively, by A and B. In order to assess which gene sets were differentially expressed in either of the phenotype switching directions A→B and B→A, we ran GSEA for both switching directions. The gene sets whose enrichment was assessed were taken from the Molecular Signatures Database (Subramanian et al., 2005); in particular, we used a collection of canonical, manually compiled pathways (collection C2-CP). We collapsed the results from both GSEA runs together, sorting gene sets according to the magnitude of their normalized ES (NES). We then collected the 50 gene sets with the highest absolute NES. This choice was motivated by previous observations that several gene sets that do not reach a standard FDR q-value of 0.25 are still effectively relevant to the condition under study, and that these are overall consistent among laboratories conducting similar microarray experiments (Subramanian et al., 2005). Finally, we obtained the size of the leading edge subset of each of those 50 gene sets.
For each comparison, running the above procedure generates a collection of significant gene sets, each associated with an integer value (the size of its leading edge subset for that particular comparison). This representation can be seen as analogous to the so-called bag-of-words model for text documents. In textual information retrieval, it is common to represent a document by how many times each word in the vocabulary appears in that document. The order of the words is therefore omitted, and hence the name ‘bag-of-words’. The procedure described above effectively generates a bag-of-words representation for each comparison in the dataset. This allows us to conceptually regard each comparison as a document having several words from a vocabulary. In our context, the vocabulary is the collection of canonical pathways, and each gene set found to be significant is a word.
In essence, the above procedure generates a representation of differential expression that is amenable to probabilistic modeling with topic models, and for topic model-based information retrieval tools.
2.2.2 Topic models
These are probabilistic unsupervised models for finding latent components in documents, alternatively called Latent Dirichlet Allocation (LDA; Blei et al., 2003) or discrete Principal Component Analysis (dPCA; Buntine and Jakulin, 2004). Provided a corpus in bag-of-words representation, it models each document as a probability distribution over so-called topics. A topic, the central concept, is itself a probability distribution, but over words in the vocabulary. The model is a generative hierarchical model, which can be specified by formulating the generative process from which the data are assumed to arise. More formally the generative process goes as follows: the distribution over topics for each document d, and the distribution over words for each topic t, are specified, respectively, by the random variables (i.e. parameters of a hierarchical model) θd and ϕt,
Here α and β are scalar hyperparameters for symmetric Dirichlet probability distributions, and they regulate the sparsity of the model. Each word is assumed to come from exactly one topic. For word i in document d, a topic is chosen using the document's topic probability distribution. This amounts to sampling from a scalar variable zd,i,
After choosing a topic zd,i, the corresponding word wd,i is sampled from the topic's distribution over words,
The above formulation corresponds to a variant by Griffiths and Steyvers (2004). Topic models have been successfully used in several text modeling applications; in bioinformatics, they have been used at least for finding components of haploinsufficiency profiling data (Flaherty et al., 2005) and of discretized gene expression data (Gerber et al., 2007).
We use topic models to model the experiments that have been pre-processed by GSEA. The relationship to text document modeling is that we are conceptualizing each experiment as a document. In this conceptualization, each word is a gene set, and each topic is a probability distribution over gene sets. A topic aims at representing a biological process. It specifies an ordering on gene sets, the ordering meaning how likely it is that a gene set is differentially expressed. By considering the top gene sets in a topic, one can obtain a biological picture that is broader and more holistic than the one described by a single gene set. Finally, by having a probability distribution over topics, a comparison effectively assigns different weights to biological processes. In the remainder of the article, we will use the terms ‘experiment’ and ‘document’, as well as ‘gene set’ and ‘word’ interchangeably.
In the models we chose the hyperparameters to be at α = 1 and β = 0.01, and fixed the number of topics at T = 50. For computing the models we used the same approach as Griffiths and Steyvers (2004). We used so-called collapsed Gibbs sampling to find assignments of the words of each document to the topics, by first analytically integrating out the parameters θ and ϕ to the obtained joint probability of the corpus and the word-to-topic assignments,
The values of the z were then sampled by Gibbs sampling, from the conditional probability distribution P(zd,i|z−(d,i), w), where z−(d,i) is obtained by discarding zd,i from z. We sampled iteratively for a total of 2000 scans. On an Intel 1.73 GHz Core 2 Duo CPU, this took about 23 min. Computations were performed using the Topic Modeling Toolbox (http://psiexp.ss.uci.edu/research/programs_data/toolbox.htm).
We repeat the procedure for a total of eight parallel samplers. Out of the samples, we chose for interpretation the sample having the highest probability, and estimated the parameter values θ and ϕ based on the assignments of words to the topics.
The formulas for the conditional distribution, variable estimation and estimate selection are omitted for brevity.
2.3 Probabilistic search
The topic model represents each experiment as a distribution over topics. It is then natural to measure similarity of experiments in terms of distances between their distributions over the topics. Suitable distance measures for distributions include the (symmetrized) Kullback–Leibler divergence, Jensen–Shannon divergence or Hellinger distance; unfortunately all of these have problems with sparsity, which necessarily results when the dimensionality is high. The most straightforward way of retrieving experiments, given a new experiment as a query, would be to rank the documents to be retrieved according to their distance from the query.
There is, however, a more natural and well-performing way of doing information retrieval in a probabilistic model such as this one (Buntine and Jakulin, 2004). Essentially, we compute the probability that the gene sets in a query experiment were generated by another experiment. In more precise terms, this amounts to computing
where wq is the collection of words in a query experiment q and T is the number of topics in the model. The above equation states that, for each word in the query, we compute the overall probability that it was generated by any topic, given the topic proportions in the potentially relevant experiment. By repeating the same query for all experiments, we obtain a ranked list that is ordered by the relevance of each experiment to that query. The computation of all queries took <5 s.
2.4 Visualization
2.4.1 Relationship between comparisons, topics and gene sets
Visualization of the topic model is essential to understand the biological findings of our analysis. We want to gain insight into the structure of our gene expression compendium and the biological processes recorded in it. In order to do so we need to examine the topic composition of the experiments as well as the gene set composition of the topics.
The results obtained from GSEA and the topic model are essentially two matrices Pt and Pg containing the topic probabilities across the experiments and the gene set probabilities across the topics. The connection between Pt and Pg are the topics. Accordingly, we can consider the matrices a disjoint union of two complete bipartite graphs where the probabilities in the matrix represent edge weights. We layout the resulting graph by placing the nodes for experiments, topics and gene sets in three separate columns, where the middle column contains the nodes for the topics and is shared by the two subgraphs.
We have to select a subset of edges for the visualization since the two bipartite graphs are complete. Rather than making a hard selection, we use a reduced line width and color opacity of the edges based on the corresponding weights. With this strategy we emphasize those edges representing a high probability and virtually remove those standing for lower probabilities.
Each topic is assigned a distinct color and all edges connecting the topic are drawn in this color. This makes it easier for the viewer to follow the edges from the topic to the corresponding experiments or gene sets. At the same time the links having a particular color are easily distinguishable and provide an overview interpretation of that particular topic, in terms of both its distribution over gene sets and over experiments where this topic plays a role.
Clutter is reduced by rearranging gene sets and topics so that the number of intersecting edges is low. We found that a suitable heuristic for achieving this is to compute a complete linkage hierarchical clustering of the gene sets and of the experiments to obtain a partial ordering for both. As a distance measure, we used the symmetrized Kullback–Leibler divergence between the corresponding distributions. Further we sort the topics by the index of the maximum value in the corresponding column of Pg. Additionally, we use Bézier curves instead of straight lines to connect topics with experiments and gene sets. The Bézier curves form edge bundles, which further reduces clutter.
In order to increase the space available to plot experiment and gene set names, we plot them circularly instead of along a straight line.
Figure 1 shows the resulting visualization. The complete visualization is readable on an interactive display; to keep it readable also on paper, we selected a subset of topics for which the sum of probabilities given the documents is the highest. In detail, we selected the top 10 topics in the subset of the 105 main experiments and top 10 topics in the completed dataset, and took the union, resulting in a set of 13 topics. We additionally reduced the number of gene sets on the visualization by choosing the most probable 25 for each topic, and taking the union over all topics. Based on a quick inspection, the probabilities typically leveled off beyond the 25. This gave in total 211 gene sets for the visualization of the 13 selected topics.
Fig. 1.

Visualization of the topic model. A subset of 13 topics, 211 gene sets and 105 experiments is shown. For details and a discussion see the text.
2.4.2 Visualizing retrieval results
To complement the standard ranked lists, retrieval results can be presented on a projection display showing all the data items. Assuming that the projection is good, the display is useful in putting the retrieval result into the context of the whole set of experiments. Clusters and outliers in the retrieval results may become obvious, results of different queries can be easily compared, and the whole collection can be interactively browsed while simultaneously seeing the retrieval results.
To visualize retrieval results, we project all experiments to a two-dimensional display using a new projection method that has recently been shown to outperform the alternative methods, in the task of retrieving similar data points (here experiments) given the display. The method called Neighbor Retrieval Visualizer (NeRV; Venna and Kaski, 2007) has been developed specifically for visualizing data in retrieval tasks and for explorative information visualization. NeRV needs to be given the relative cost of misses and false positives of the true similarities between the data points. We chose to penalize false positives, resulting in a display that is trustworthy in the sense that if two points are similar in the visualization they can be trusted to have been similar before the projection also. As other multidimensional scaling methods, NeRV starts with a pairwise distance matrix between all experiments. In this article, we used the symmetrized Kullback–Leibler divergences between the topic distributions of the documents. The pure projection of the experiments shows only their relative similarity, and for further interpretation the display needs to be coupled with the topic content of the documents. It is possible to include this important information by including glyphs in the projections to represent the distribution of topics (Yang et al., 2007). Including the glyphs has the additional advantage that a non-linear projection of a large dataset to a two-dimensional space cannot preserve all similarities, and the imperfectnesses will be detectable based on the glyphs.
We designed glyphs to represent the probability distribution over the topics of a document by dividing a square into vertical slices that each stand for a topic. The width of the slice represents the probability of the topic. This is illustrated in Figure 2B in the top row. While this is sufficient for comparing the shape of the probability distributions of documents, we also color the strips with a distinct color representing the topic, as shown in Figure 2B in the bottom row. The coloring has the additional distinctive purpose that it connects the topics of the glyphs visually with the same topics in the display of Figure 1, which can be used for interpreting them.
Fig. 2.

The experiment collection visualized as glyphs on a plane. Topic colors in all glyphs match topic colors in Figure 1. (A) NeRV projection of the 105 experiments, each shown as a glyph. (B) The slices of each glyph show the distribution of topics in the experiment. The experiment labels are from left to right: asthma, Barrett's esophagus and high-stage neuroblastoma. (C) Enlarged region from (A) where glyphs have additionally been scaled according to their relevance to the query with the ‘malignant melanoma’ experiment shown in the center. A detailed description of this experiment is included in Section 3.
3 RESULTS
3.1 Inferred topics
By analyzing the most probable gene sets for each topic, we can infer its underlying biological theme. The most probable gene sets in most of the topics learned by the model are coherent, and the topics taken together describe a wide range of processes. We focus our analysis on the same most prominent topics shown in the visualizations, based on their sum of probabilities over documents being the highest. The top five gene sets for each of the 13 topics are shown in Table 1.
Table 1.
Top five gene sets for the 13 most probable topics
| 2 | 5 | 11 |
| Cell cycle (BIOCARTA) | Purine metabolism (KEGG) | G protein signaling |
| Cell cycle (KEGG) | Pyrimidine metabolism (KEGG) | Biopeptides pathway |
| G1 to S cell cycle (REACTOME) | Purine metabolism (GENMAPP) | NFAT pathway |
| DNA replication (REACTOME) | Pyrimidine metabolism (GENMAPP) | CREB pathway |
| G2 pathway | DNA replication (REACTOME) | GPCR pathway |
| 15 | 18 | 19 |
| Gluconeogenesis | Apoptosis (GENMAPP 1) | Valine leucine and isoleucine degradation |
| Glycolysis | Apoptosis (KEGG) | Propanoate metabolism (KEGG) |
| Glycolysis and gluconeogenesis (KEGG) | Apoptosis (GENMAPP 2) | Fatty acid metabolism |
| Glycolysis and gluconeogenesis (GENMAPP) | Apoptosis (GENMAPP 3) | Propanoate metabolism (GENMAPP) |
| Fructose and mannose metabolism | Death pathway | Valine leucine and isoleucine degradation |
| 24 | 26 | 27 |
| IL2RB pathway | mTOR pathway | Hematopoietic cell lineage |
| PDGF pathway | Sphingolipid metabolism | Complement and coagulation cascades |
| EGF pathway | eIF4 pathway | Inflammation pathway |
| Gleevec pathway | RAS pathway | NKT pathway |
| IGF-1 pathway | IGF-1 mTOR pathway | Dendritic cell pathway |
| 32 | 35 | 44 |
| Epithelial cell signaling in H. pylori Infection | Integrin pathway | mRNA processing (REACTOME) |
| Cholera infection (KEGG) | Met pathway | RNA transcription (REACTOME) |
| Photosynthesis | ERK pathway | Translation factors |
| ATP synthesis | AT1R pathway | Folate biosynthesis |
| Flagellar assembly | ECM pathway | Basal transcription factors |
| 50 | ||
| Oxidative phosphorylation (KEGG) | ||
| Oxidative phosphorylation (GENMAPP) | ||
| Glycolysis and gluconeogenesis | ||
| IL-7 pathway | ||
| Gamma hexachlorocyclohexane degradation |
An acronym for the source of the gene set was included either to distinguish between gene sets with similar names, or when the gene set's name already includes a mention of that source [KEGG (Kanehisa and Goto, 2000), GENMAPP (Salomonis et al., 2007), BIOCARTA (http://www.biocarta.com) or REACTOME (Vastrik et al., 2007)].
The topics are related to diverse themes such as cell cycle (topic 2), DNA replication (topics 2 and 5), organic compound metabolism (topics 5 and 19), G protein signaling (topic 11) glycolysis (topic 15), apoptosis (topic 18), cell growth and proliferation (topics 24 and 26), cell differentiation (topic 27), infection (topic 32), cell communication (topic 35), DNA replication (topic 44) and oxidative phosphorylation (topic 50). In some topics, some of the top gene sets are almost identical. This stems from the fact that those gene sets are highly overlapping, therefore being put into similar topics with similar probabilities.
Although Table 1 is illustrative of the variety of topics found by the model, understanding each topic may require looking beyond the top five words. For instance, in topic number 2, gene sets until the eighthposition are not deeply informative of the process the topic is representing, beyond the fact that it is related to cell cycle and DNA replication. However, the gene set at the ninth position, ‘ATR BRCA Pathway’, contains a signaling system involving genes BRCA1 (breast cancer 1, early onset), and BRCA2 (breast cancer 2, early onset). These genes are involved in the cellular response to DNA damage, and their mutations have been found to increase breast cancer susceptibility (Tutt and Ashworth, 2002). We investigated which experiments have the highest probability for this topic. The top four results are for cancer-related comparisons: normal tissue versus sporadic basal-like breast cancer, vulvar intraepithelial neoplasia, breast carcinoma and esophageal carcinoma. As the only two breast cancer experiments in the dataset appear among those four top experiments, these results indicate that topic number 2 has relevance not only simply for cell cycle and DNA replication, but also for breast cancer.
As another interesting example, we analyzed the top gene sets in topic number 44. One of the gene sets corresponds to genes involved in folate biosynthesis. Folate has an important role in DNA and RNA synthesis, and low folate levels are known to promote a number of pathologies (Au et al., 2009; Glynn and Albanes, 1994; Hoffbrand et al., 1968). We again computed which experiments had the highest probability for this topic. The top four results pertained to comparisons between normal tissue versus Crohn's disease, chronic lymphocytic leukemia, and chronic myelogenous leukemia, as well as a comparison between patients with normal tissue and cancer patients with acute radiation toxicity. Folate deficiency has been observed both in patients with Crohn's disease (Hoffbrand et al., 1968) and in patients with leukemia (Au et al., 2009). Once again, the model manages to assign experiments to meaningful topics and, moreover, is able to relate experiments according to the mechanisms shared between them. The assignment between topics and experiments is not disjoint as in clustering, assumed to underlie even smoothed clustering, but instead each experiment can genuinely belong to several topics.
The previous two examples illustrate that the topic model is in fact finding topics that correspond to meaningful biological processes. By combining gene sets into topics, a holistic model of the differential activation of biological processes is created. Our approach also seems to be robust, as the topic model was inferred from a collection of experiments from different sources, and as the above examples show, similar comparisons from different laboratories and samples do seem to match to the same biological processes. We point out that the methods we combined are themselves robust, GSEA against laboratory and sample variations, and the topic model against noise in the input data.
3.2 Visualizing the model
A major strength of our topic model visualization in Figure 1 is that it connects gene sets to experiments while making the connection by compressing the relationships through the topics. This enables us to interpret topic distributions of experiments—and thus experiments themselves—efficiently. Furthermore, the visualization allows us to begin the exploration of the model with an experiment, a topic or a gene set.
The larger structure of the model becomes evident immediately as well, namely that topics hardly ever share their top gene sets, while topics are shared across experiments with similar probabilities quite frequently. We can also observe that some experiments have what we could call a ‘primary topic’ that is indicated by a wider-than-average edge connecting the experiment to a topic. For instance, in Figure 1 we can identify an instance of a ‘high-stage neuroblastoma’ experiment where topic 19 seems to be the primary topic. The glyph on the right in Figure 2B confirms this.
The visualization also reveals how gene sets are distributed across topics and that there is a range of different distributions. We find that for example topic 50 has very high probabilities for two gene sets and much lower probabilities for the remaining gene sets, while topic 24 has rather uniformly distributed probabilities for a wide range of gene sets.
Figure 2A shows a NeRV projection of the experiments including glyphs describing the probability distribution over the top 13 topics. While the visualization of the topic model in Figure 1 provides some insight into the structure of the experiment space, the projection immediately provides us with an overview of clusters and outliers. We find only a few distinct clusters in our subset of 105 experiments, but this is not surprising given the range of biological questions that have been investigated in those experiments.
The glyphs reveal how topic usage is changing across documents and explain for instance which topics are shared by experiments forming a cluster. The change in topic usage is gradual in most parts of the projection but seems abrupt in others. This could indicate imperfectness in the projection where not all similarities have been preserved by the dimensionality reduction.
3.3 Searching for experiments
We evaluated the performance of the method quantitatively in retrieving relevant experiments, given a query experiment. For that purpose, we queried with cancer experiments and considered all other cancer experiments to be relevant, and all non-cancer experiments to be irrelevant. We chose cancer because it had the largest number of experiments in our corpus and, more importantly, experiments from several laboratories and on different cancer types. For other diseases, the number of experiments either was too small or came from a single larger experiment, making retrieval too easy.
In total, we queried the system with each of the 27 experiments comparing normal versus cancerous tissue. As a result we obtained a ranked list of experiments, sorted by the probability of the query given the experiment and the model, as discussed in Section 2. We computed the average precision, a standard summary statistic for evaluating retrieval performance, over the top 10 retrieved experiments. To give a baseline, we additionally computed the average precision over randomly ranked results. By randomizing 1000 times we get an estimate of the confidence intervals. We also computed the average of the precision–recall curves for all queries, for both our method and the random baseline. As shown in Figure 3A, in more than half the queries, the average precision is above 0.8, and in 20 of the 27 queries the topic model-based retrieval is above the confidence interval of the random baseline. As seen in Figure 3B, the precision–recall curve shows that the trade-off between precision and recall in our method is reasonable and well above the random baseline. We further studied the false positives in the top 10 ranked experiments, and on average 20% of those were found to be cancer related (e.g. benign tumor), showing an advantage of our method over standard annotation-based searches and suggesting that the actual retrieval performance is actually better than the reported quantitative figures suggest.
Fig. 3.

(A) Average Precision for cancer queries for the top 10 results. Queries are sorted by the average precision given by the topic model. Error bars represent the 99% confidence interval of the random permutation results. (B) Interpolated average precision at 11 standard recall levels (given as percentages). The solid line corresponds to our method; the dashed line corresponds to the baseline.
We will finally illustrate the potential of the probabilistic relevance search with two case studies. We first queried with an experiment comparing normal tissue against malignant melanoma. The top two results were comparisons of normal tissue to bladder carcinoma and vulvar intraepithelial neoplasia. The next two results were hyperparathyroidism and a study of intra-pulmonary airway epithelial cells from non-smokers versus current smokers. The remaining top10 results were from comparisons of normal tissue against bladder carcinoma (twice), infiltrating ductal carcinoma, prostate cancer, breast carcinoma and esophageal adenocarcinoma. It is clear that cancer experiments have a high preponderance in the top results, given the melanoma query. Interestingly, a study of intra-pulmonary airway epithelial cells from smokers was included in the top results. Although the annotation is not fully clear as to what the actual pathology is, it is plausible that it might be a cancer-related one. This highlights the capability of our method for hypothesis generation. Finally, it is known that hyperparathyroidism is associated with a higher cancer incidence (Nilsson et al., 2007), a relation that is highlighted by the melanoma query.
Figure 2C visualizes the topic distributions for experiments found relevant to the melanoma query. The visualization not only highlights the most relevant experiments, but also the relation between them. In particular, a subset of the carcinoma experiments appears to become separate from the glandular-related pathologies (esophageal adenocarcinoma, primary hyperparathyroidism and prostate cancer). Alternatively, Figure 4, which is also a NeRV projection with glyphs, distinguishes the relevance of each experiment by changing the glyph size and color saturation accordingly.
Fig. 4.
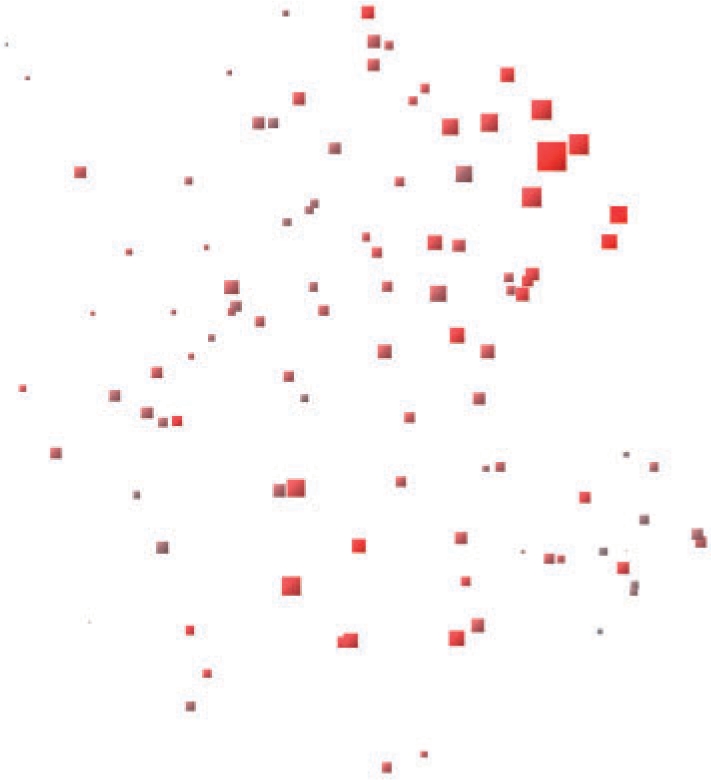
NeRV projection of the 105 experiments, portraying the outcome of querying the model with a melanoma experiment. Both glyph size and color saturation encode the relevance of each experiment to the query. The bigger the glyph and the more saturated the red the higher the relevance of the experiment to the query. The query itself is represented by the biggest glyph.
As another case study, we queried with an experiment on myelogenous leukemia. The top result was Crohn's disease. Although it is a digestive system disease, it has some commonalities with the query, as described in the previous section. The second result was chronic lymphocytic leukemia. Finally, the remaining results were on ischemic cardiomyopathy, post-traumatic stress disorder, multiple invasive and transitional cell carcinomas and chronic obstructive pulmonary disease. Although the top 10 results span a large class of diseases, some of which are hard to connect to the query pathology, this case study highlights the fact that the method is capable of extracting meaningful top results, both by ranking a disease that is very similar to the query above other diseases that are broadly similar (chronic lymphocytic leukemia), and by ranking highly a disease which, although not immediately identifiable as similar to the query, effectively shares properties with it (Crohn's disease).
4 DISCUSSION
We have introduced methods for retrieval of relevant experiments, given a sample experiment as a query. The retrieval is based on methods for modeling and visualizing differential gene set expression in a large body of gene expression microarray experiments. The probabilistic model combines two recent approaches that have been shown to be effective. The model was able to cluster gene sets into components, called topics, that exhibit a high biological coherence and that are meaningfully related to particular experiments. The probabilistic nature of the model allows for a precise formulation of retrieval, in which the model is queried with the differential expression in gene sets of an experiment and it returns a ranked list of relevant experiments. We showed that, querying the model with cancer experiments, we obtain a performance significantly better than random, measured by average precision. More importantly, the average precisions were on average at the good value of ∼82%. The random baseline is ∼40%.
We complemented the quantitative analysis with two case studies. The model was able to associate melanoma with several cancer types. We also demonstrated how the model finds hypothetical connections between experiments, by selecting an experiment of epithelial tissue in non-smokers versus current smokers as being highly relevant to cancer experiments, which naturally makes sense a posteriori. We also showed that the model finds relations between Crohn's disease and leukemia, and also between hyperparathyroidism and cancer, which were confirmed in the literature. Finally, given a query experiment on leukemia, the model was able to extract, from a set of cancer experiments, precisely another leukemia experiment as being the most relevant. The result indicates that the model not only manages to partition the experiments into general classes, but also allows going into finer-grained distinctions. We also provide a concise visual description of one of those case studies, highlighting the consistence in topic distributions between similar experiments.
As for future work, there are two complementary directions. In the current system, we intentionally kept the system simple and fast by using a simple way of bringing in prior biological knowledge and a reasonably simple probabilistic model. Since already such a simple system proved to be very useful in retrieving relevant experiments, it could next be scaled up to large experiment collections. An alternative direction is to include more detailed models, making the retrieval results and analyses more accurate and informative but increasing computational complexity. They should be useful for smallish collections. Straightforward extensions are available by including recent methods that attempt to improve on GSEA (such as Oron et al., 2008). On the other hand, there have been a wide variety of extensions of topic models over the recent years, for instance allowing topics to be correlated (Blei and Lafferty, 2007) or form a hierarchical structure (Blei et al., 2003).
ACKNOWLEDGEMENTS
We would like to thank Misha Kapushesky for his expertise and advice, especially on converting microarray experiments into binary comparisons. J.C., S.K. and A.F. belong to the Finnish Centre of Excellence on Adaptive Informatics Research.
Funding: TEKES (grant no. 40101/07); PASCAL 2 Network of Excellence, ICT 216886 (partially to J.C., A.F. and S.K.). Portuguese Foundation for Science and Technology (doctoral grant to J.C.); European Molecular Biology Laboratory (EMBL) (PhD fellowship to N.G.).
Conflict of Interest: none declared.
REFERENCES
- Au WY, et al. Cough mixture abuse, folate deficiency and acute lymphoblastic leukemia. Leukemia Res. 2009;33:508–509. doi: 10.1016/j.leukres.2008.07.007. [DOI] [PubMed] [Google Scholar]
- Blei D, Lafferty J. A correlated topic model of science. Ann. Appl. Stat. 2007;1:17–35. [Google Scholar]
- Blei D, et al. Hierarchical topic models and the nested Chinese restaurant process. In: Thrun LSS, Schölkopf B, editors. NIPS 16. Cambridge, MA: MIT Press; 2003. [Google Scholar]
- Blei D, et al. Latent Dirichlet allocation. J. Mach. Learn. Res. 2003;3:993–1022. [Google Scholar]
- Buntine W, Jakulin A. Applying discrete PCA in data analysis. In: Chickering DM, Halpern JY, editors. UAI'04. Arlington, Virginia: AUAI Press; 2004. pp. 59–66. [Google Scholar]
- Eyre TA, et al. The HUGO gene nomenclature database, 2006 updates. Nucleic Acids Res. 2006;34:D319–D321. doi: 10.1093/nar/gkj147. [DOI] [PMC free article] [PubMed] [Google Scholar]
- Flaherty P, et al. A latent variable model for chemogenomic profiling. Bioinformatics. 2005;21:3286–3293. doi: 10.1093/bioinformatics/bti515. [DOI] [PubMed] [Google Scholar]
- Fujibuchi W, et al. CellMontage: similar expression profile search server. Bioinformatics. 2007;23:3103–3104. doi: 10.1093/bioinformatics/btm462. [DOI] [PubMed] [Google Scholar]
- Gerber GK, et al. Automated discovery of functional generality of human gene expression programs. PLOS Comput. Biol. 2007;3:1426–1440. doi: 10.1371/journal.pcbi.0030148. [DOI] [PMC free article] [PubMed] [Google Scholar]
- Glynn SA, Albanes D. Folate and cancer: a review of the literature. Nutr. Cancer. 1994;22:101–119. doi: 10.1080/01635589409514336. [DOI] [PubMed] [Google Scholar]
- Griffiths TL, Steyvers M. Finding scientific topics. Proc. Natl Acad. Sci. USA. 2004;101:5228–5235. doi: 10.1073/pnas.0307752101. [DOI] [PMC free article] [PubMed] [Google Scholar]
- Hibbs MA, et al. Exploring the functional landscape of gene expression: directed search of large microarray compendia. Bioinformatics. 2007;23:2692–2699. doi: 10.1093/bioinformatics/btm403. [DOI] [PubMed] [Google Scholar]
- Hoffbrand AV, et al. Folate deficiency in Crohn's disease: incidence, pathogenesis, and treatment. Br. Med. J. 1968;2:71–75. doi: 10.1136/bmj.2.5597.71. [DOI] [PMC free article] [PubMed] [Google Scholar]
- Hunter L, et al. GEST: a gene expression search tool based on a novel Bayesian similarity metric. Bioinformatics. 2001;17:S115–S122. doi: 10.1093/bioinformatics/17.suppl_1.s115. [DOI] [PubMed] [Google Scholar]
- Kanehisa M, Goto S. KEGG: Kyoto encyclopedia of genes and genomes. Nucleic Acids Res. 2000;28:27–30. doi: 10.1093/nar/28.1.27. [DOI] [PMC free article] [PubMed] [Google Scholar]
- Lamb J, et al. The connectivity map: using gene-expression signatures to connect small molecules, genes, and disease. Science. 2006;313:1929–1935. doi: 10.1126/science.1132939. [DOI] [PubMed] [Google Scholar]
- Mootha VK, et al. Pgc-1α-responsive genes involved in oxidative phosphorylation are coordinately downregulated in human diabetes. Nat. Genet. 2003;34:244–245. doi: 10.1038/ng1180. [DOI] [PubMed] [Google Scholar]
- Nilsson I-L, et al. The association between primary hyperparathyroidism and malignancy: nationwide cohort analysis on cancer incidence after parathyroidectomy. Endocr. Relat. Cancer. 2007;14:135–140. doi: 10.1677/erc.1.01261. [DOI] [PubMed] [Google Scholar]
- Oron AP, et al. Gene set enrichment analysis using linear models and diagnostics. Bioinformatics. 2008;24:2586–2591. doi: 10.1093/bioinformatics/btn465. [DOI] [PMC free article] [PubMed] [Google Scholar]
- Parkinson H, et al. ArrayExpress update–from an archive of functional genomics experiments to the atlas of gene expression. Nucleic Acids Res. 2009;37:D868–D872. doi: 10.1093/nar/gkn889. [DOI] [PMC free article] [PubMed] [Google Scholar]
- Salomonis K, et al. GenMAPP 2: new features and resources for pathway analysis. BMC Bioinformatics. 2007;8:85. doi: 10.1186/1471-2105-8-217. [DOI] [PMC free article] [PubMed] [Google Scholar]
- Segal E, et al. A module map showing conditional activity of expression modules in cancer. Nat. Genet. 2004;36:1090–1098. doi: 10.1038/ng1434. [DOI] [PubMed] [Google Scholar]
- Subramanian A, et al. Gene set enrichment analysis: a knowledge-based approach for interpreting genome-wide expression profiles. Proc. Natl Acad. Sci. USA. 2005;102:15545–15550. doi: 10.1073/pnas.0506580102. [DOI] [PMC free article] [PubMed] [Google Scholar]
- Tanay A, et al. Integrative analysis of genome-wide experiments in the context of a large high-throughput data compendium. Mol. Syst. Biol. 2005;1 doi: 10.1038/msb4100005. [DOI] [PMC free article] [PubMed] [Google Scholar]
- Tutt A, Ashworth A. The relationship between the roles of BRCA genes in DNA repair and cancer predisposition. Trends Mol. Med. 2002;8:571–576. doi: 10.1016/s1471-4914(02)02434-6. [DOI] [PubMed] [Google Scholar]
- Venna J, Kaski S. Nonlinear dimensionality reduction as information retrieval. In: Meila M, Shen X, editors. AISTATS'07. San Juan, Puerto Rico: Omnipress; 2007. [Google Scholar]
- Vastrik I, et al. Reactome: a knowledge base of biologic pathways and processes. Genome Biol. 2007;8:R39. doi: 10.1186/gb-2007-8-3-r39. [DOI] [PMC free article] [PubMed] [Google Scholar]
- Yang J, et al. Value and relation display: interactive visual exploration of large data sets with hundreds of dimensions. IEEE T. Vis. Comput. Gr. 2007;13:494–507. doi: 10.1109/TVCG.2007.1010. [DOI] [PubMed] [Google Scholar]
- Zhu Y, et al. GEOmetadb: powerful alternative search engine for the Gene Expression Omnibus. Bioinformatics. 2008;24:2798–2800. doi: 10.1093/bioinformatics/btn520. [DOI] [PMC free article] [PubMed] [Google Scholar]