Abstract
Acute promyelocytic leukemia (APL) is characterized by the t(15;17) chromosomal translocation, which results in fusion of the retinoic acid receptor α (RARA) gene to another gene, most commonly promyelocytic leukemia (PML). The resulting fusion protein, PML-RARA, initiates APL, which is a subtype (M3) of acute myeloid leukemia (AML). In this report, we identify a gene expression signature that is specific to M3 samples; it was not found in other AML subtypes and did not simply represent the normal gene expression pattern of primary promyelocytes. To validate this signature for a large number of genes, we tested a recently developed high throughput digital technology (NanoString nCounter). Nearly all of the genes tested demonstrated highly significant concordance with our microarray data (P < 0.05). The validated gene signature reliably identified M3 samples in 2 other AML datasets, and the validated genes were substantially enriched in our mouse model of APL, but not in a cell line that inducibly expressed PML-RARA. These results demonstrate that nCounter is a highly reproducible, customizable system for mRNA quantification using limited amounts of clinical material, which provides a valuable tool for biomarker measurement in low-abundance patient samples.
Introduction
Here we describe what is, to our knowledge, the first use of a high-throughput digital system to assay the expression of a large number of genes in primary clinical samples from patients with acute myeloid leukemia (AML). This technology captures and counts individual mRNA transcripts without enzymatic reactions or bias and is notable for its high levels of sensitivity, linearity, multiplex capability, and digital readout (1). The nCounter system (NanoString) is capable of detecting as little as 0.5 fM of a specific mRNA, making it a valuable tool for expression signature validation, diagnostic testing, and large translational studies, all of which often are limited by the very small amounts of clinical material available.
In this study, our primary clinical focus is on acute promyelocytic leukemia (APL), a subtype (M3) of AML that is unique in its morphology and its defining molecular initiating event. (Throughout this manuscript, we refer to human APL as M3 AML and the mouse models as murine APL.) Morphologically, the leukemic cells are abnormal promyelocytes, which nevertheless retain many of the structural and immunophenotypic characteristics of normal promyelocytes. M3 AML is further characterized by fusion of the retinoic acid receptor α (RARA) gene to another gene, most commonly the promyelocytic leukemia (PML) gene, through a balanced translocation of chromosomes 17 and 15, respectively. The resulting fusion protein, PML-RARA, has been shown to initiate APL in several mouse models (2–5). Unlike most other AML subtypes, the initiating event of M3 AML is known, making it an attractive model for the study of mechanisms of pathogenesis and progression.
Several recent gene expression profiling studies used microarray technologies to compare subclasses of AML and have reported specific expression signatures for individual morphologic or molecular subtypes (6–18). Although a subset of these studies included normal whole bone marrow or purified myeloid precursor CD34+ cells, none of them included fractionated primary hematopoietic cells from multiple discrete stages of myeloid differentiation (6, 7, 9, 11, 13–15, 17, 18). Because different subtypes of AML represent various arrested developmental stages of hematopoiesis (e.g., M3 versus normal promyelocytes), differences in expression may result from these developmental stages rather than a fundamental difference in pathogenesis or progression. The inclusion of normal, primary fractionated myeloid precursors, including promyelocytes, could mitigate this potential pitfall.
Another shortcoming of many gene expression profiling studies, including the AML studies above, is that only a small number of genes have been validated in a small number of samples, due to limiting amounts of clinical material available and the labor-intensive and costly nature of quantitative RT-PCR–based (qRT-PCR–based) validation. In this study, we have overcome these limitations with a digital RNA quantitation system, which allowed triplicate measurements of the expression levels of 46 genes, using only 100 ng of total RNA (the amount obtained from approximately 40,000 myeloid cells) in a multiplex reaction. Thus, the confidence of our M3-specific signature is substantially increased by such extensive validation.
In the current study, we compare M3 cell expression patterns with those of other AML subtypes and to normal CD34+ cells, promyelocytes, and neutrophils purified from independent healthy human bone marrow samples using high-speed flow cytometry. Using these data, we define a unique expression signature of M3 malignant promyelocytes, which is distinct both from other subtypes of AML and from normal promyelocytes. A subset of the most highly dysregulated genes in this signature were extensively validated using both conventional (qRT-PCR) and innovative (NanoString nCounter system; ref. 1) methodologies.
We further used gene set enrichment analysis (GSEA) (19, 20) to evaluate our validated gene set in 3 other datasets: a published set of 325 human AML samples (18), a mouse model of APL (5), and the PR-9 cell line (21), which is commonly used in studies of PML-RARA activity. Both the human M3 AML and murine APL samples demonstrated significant enrichment of the validated gene set. However, the PR-9 cells failed to show significant enrichment of this gene set after induction of the PML-RARA transgene.
Importantly, the validated genes reliably identified bona fide M3 samples (PML-RARA fusion gene positive), separating them from other FAB subtypes in 3 independent AML datasets.
Results
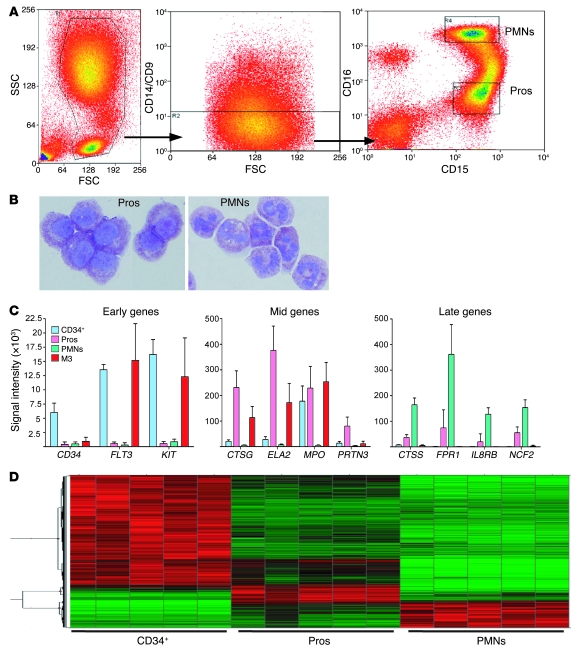
In order to identify genes that are specifically dysregulated in M3 AML cells, we compared the gene expression patterns of M3 samples to those of normal myeloid cells at various stages of differentiation. We collected bone marrow from healthy donors and immediately fractionated it into CD34+ cells, promyelocytes, or neutrophils. CD34+ cells were isolated after incubation with an anti-CD34 antibody and separation on a Miltenyi Biotec MACS column, resulting in greater than 90% purity, as validated by flow cytometry (data not shown). To ensure a high-quality expression analysis of normal promyelocytes, we refined a previously described flow cytometry–based methodology (22) to obtain a large number of highly enriched cells. After red cell lysis, whole bone marrow was incubated with antibodies to CD9, CD14, CD15, and CD16. Washed cells were sorted and collected on a Dako MoFlo flow cytometer as follows: CD9–, CD14–, CD15+, and CD16lo (for promyelocytes) and CD9–, CD14–, CD15+ and CD16hi for neutrophils. (See Methods for details; Figure 1A for flow cytometric plots; and Figure 1B for photomicrographs of sorted cells.) Cell purity for all myeloid cell fractions was high: the average promyelocyte purity exceeded 80%, and neutrophil and band purity was greater than 95%, as determined by manual differentials performed on cytospin samples. RNA isolated from purified cells was analyzed on Affymetrix U133+2 microarrays.
Figure 1. Isolation and expression profiling of myeloid cells.
(A) High-speed cell sorting of bone marrow aspirates from healthy donors. FSC, forward scatter; PMNs, polymorphonuclear cells; Pros, promyelocytes; SSC, side scatter. (B) May Grunwald/Giemsa–stained cytospins of sorted promyelocytes (left; average purity, 80% promyelocytes, 11% myelocytes) and neutrophils (right; average purity, 74% mature granulocytes with segmented nuclei, 21% bands [immediate precursor stage prior to the mature granulocyte, characterized by horseshoe-shaped nuclei]). Original magnification, ×100. (C) Microarray signal intensity data demonstrate the expected stage-specific expression of early, middle, and late developmental myeloid genes in each fraction, with minimal expression in other fractions. Data are mean ± SD. (D) Heat map of microarray data demonstrates a progression of expression from less differentiated to terminally differentiated myeloid cells. Red indicates relatively upregulated expression. Green indicates relatively downregulated expression.
To confirm that each myeloid cell fraction contained cells with gene expression patterns consistent with the predominant cell type, we compared the RNA expression levels of several developmentally regulated myeloid genes (Figure 1C). The “early” hematopoietic genes (associated with primitive myeloid precursor cells) CD34, FLT3, and KIT demonstrated much higher expression in the CD34+ cell fraction than in the other 2 fractions. Conversely, the “late” genes (associated with neutrophils) CTSS, FPR1, IL8RB, and NCF2 were most highly expressed in the neutrophil fraction. Most importantly for this study, the “mid-myeloid,” promyelocyte-specific azurophil granule genes CTSG, ELA2, MPO, and PRTN3 displayed very high expression in the promyelocyte fraction, which decreased by an order of magnitude or more in neutrophils. Further analysis identified genes specifically expressed in each of the 3 fractions. The heat map in Figure 1D illustrates a progression of gene expression from less differentiated to terminally differentiated myeloid cells. The patterns of expression described above support the flow cytometric and morphologic data, demonstrating that each fraction is highly enriched for the target population. Collection of these fractions was essential for a robust comparison of malignant promyelocytes with normal myeloid cells at different stages of differentiation.
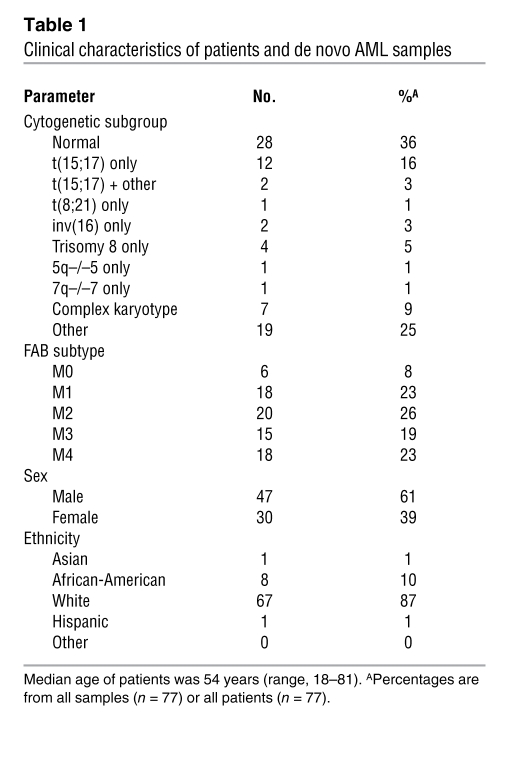
For this study, we analyzed 77 de novo AML bone marrow samples obtained at diagnosis. The characteristics of the patients from which these samples were obtained are summarized in Table 1 and have previously been described (Discovery set, FAB subtypes M0–M4; ref. 23). Of these samples, 15 were diagnosed as M3; only samples with t(15;17) confirmed by cytogenetics and/or FISH were included in the M3 analysis set (24). The remaining 62 samples consisted of FAB subtypes M0, M1, M2, and M4 with 2 or fewer cytogenetic abnormalities (these FAB subtypes were chosen because they represent the most common AML subtypes and because there were insufficient numbers of M5, M6, or M7 patient samples available for analysis). RNA was prepared from snap-frozen cell pellets of the bone marrow cells and analyzed on Affymetrix U133+2 expression microarrays. We did not fractionate the AML samples for the following reasons: (a) the bone marrow blast percentage for all samples, including M3 abnormal promyelocytes, was high (median >70%), (b) we have previously observed that AML bone marrow aspirates subjected to Ficoll separation of mononuclear cells, compared with unfractionated snap-frozen cell pellets, demonstrated no significant differences in expression by microarray analysis (our unpublished observations), and (c) as of yet, there is no standard cell surface marker that can reliably separate malignant AML cells from normal human hematopoietic cells.
Table 1 .
Clinical characteristics of patients and de novo AML samples
Defining the M3-specific dysregulome.
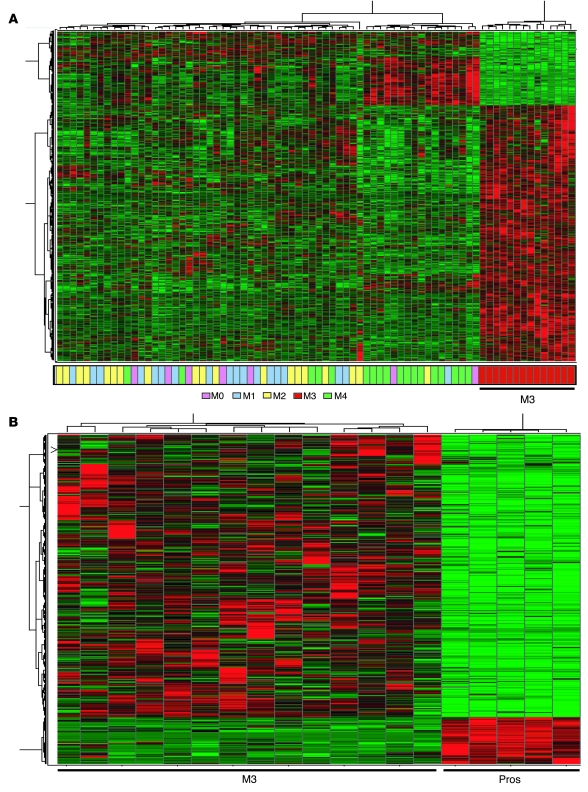
To identify genes specific to M3 AML, we compared M3 samples to other FAB subtypes and to normal myeloid cells at various stages of differentiation. We established a series of criteria for M3-specific genes: significant differences in expression when compared with non-M3 AML or normal promyelocytes, including up- or downregulation, high expression similar to that of CD34+ myeloid precursor cells, and/or high expression of genes that are not expressed in any of the normal myeloid cells tested. We first performed significance analysis of microarrays (25), using a false discovery rate (FDR) cutoff of 0.05. This analysis identified 2,023 annotated genes (3,787 probe sets) whose expression was significantly up- or downregulated in M3 compared with other AML subtypes, as demonstrated by the clear separation of the two groups in the expression heat map (Figure 2A). We observed that some of the genes were expressed at similar levels in both normal and transformed (M3) promyelocytes. Therefore, to exclude genes that are simply markers of the normal promyelocyte developmental stage, and conversely to retain genes that represent aberrant expression of developmentally regulated genes, we filtered these genes based on a comparison with the specific expression signatures identified for normal myeloid cells at 3 stages of differentiation (see Methods and Supplemental Figure 1; supplemental material available online with this article; doi:10.1172/JCI38248DS1). In addition to showing significant (FDR < 0.05) differences in expression compared with other AML subtypes, these genes, which we call the M3-specific dysregulome, fulfilled one or more of the following criteria: (a) were CD34+ precursor stage specific but persistently expressed at similar levels in M3 cells (M3: CD34+ precursor fraction ratio, ≥1:1), (b) showed significantly different expression (FDR < 0.05) from that of normal promyelocytes, and/or (c) showed significantly upregulated M3 expression (FDR <0.05; M3/normal cell fraction ratio, >2:1) and were not expressed in any of the normal myeloid cells tested (greater than 75% absent calls, determined by the MAS 5 algorithm in Affymetrix expression analysis software). The normal promyelocyte filter removed approximately 1,800 probe sets, and the remaining criteria each removed approximately equal numbers of probe sets. The heat map in Figure 2B demonstrates clear separation of these 510 up- or downregulated genes in malignant versus normal promyelocytes (listed in Supplemental Table 1).
Figure 2. Identification of the M3-specific dysregulome: genes with significantly different expression in M3 compared with other AML subtypes and normal promyelocytes.
(A) Heat map of microarray data demonstrates clear separation of 2,023 significantly up- or downregulated genes in M3 samples compared with other AML subtypes, although some genes were expressed at similar levels in normal and malignant (M3) promyelocytes (markers of promyelocyte differentiation). (B) The genes from A were filtered, by comparison with normal myeloid cells (including normal promyelocytes), to retain only those genes with M3-specific expression (510 genes).
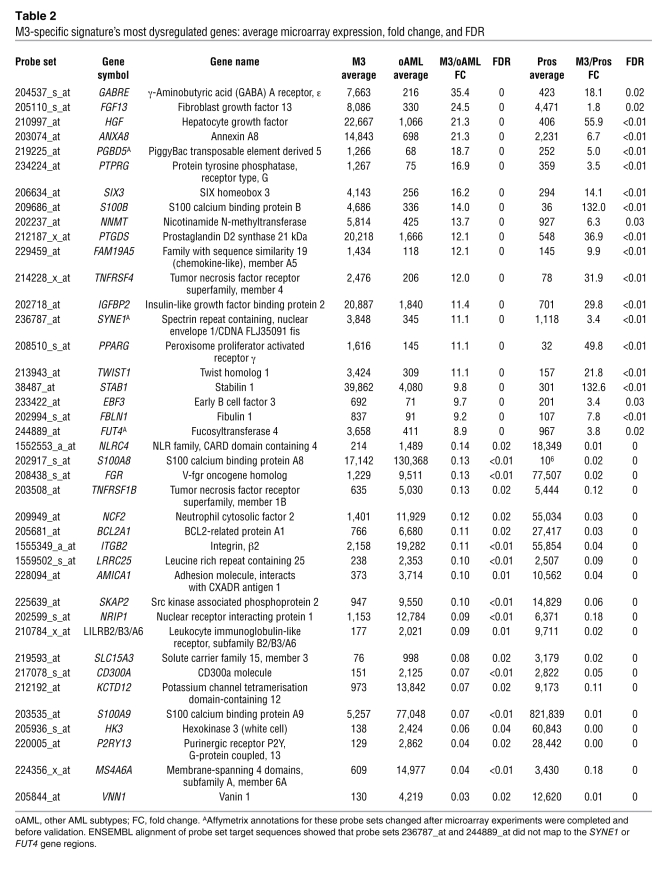
Many of the genes in the M3-specific signature exhibited dramatic differences in expression level when compared with other AML subtypes or normal promyelocytes. A subset of genes with the greatest level of differential expression is shown in Table 2. To investigate genes that may be activated or repressed in M3 AML, equal numbers of up- and downregulated genes were selected for further study and validation. Some of these highly dysregulated genes (such as HGF, FGF13, and PPARG) have been documented in previous reports (6–8, 12, 14). There are also many genes in this list that have not been previously reported to be dysregulated in M3, including BCL2A1, TWIST1, and TNFRSF1B. Of the 40 genes selected for further study, 17 have not previously been reported in other M3 AML expression studies (6–8, 12, 14).
Table 2 .
M3-specific signature’s most dysregulated genes: average microarray expression, fold change, and FDR
Validation of M3-specific dysregulome.
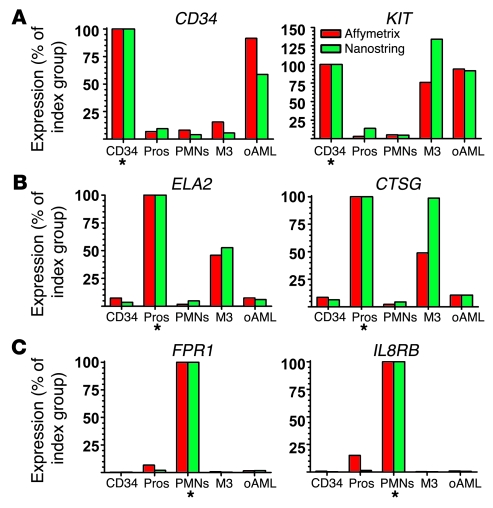
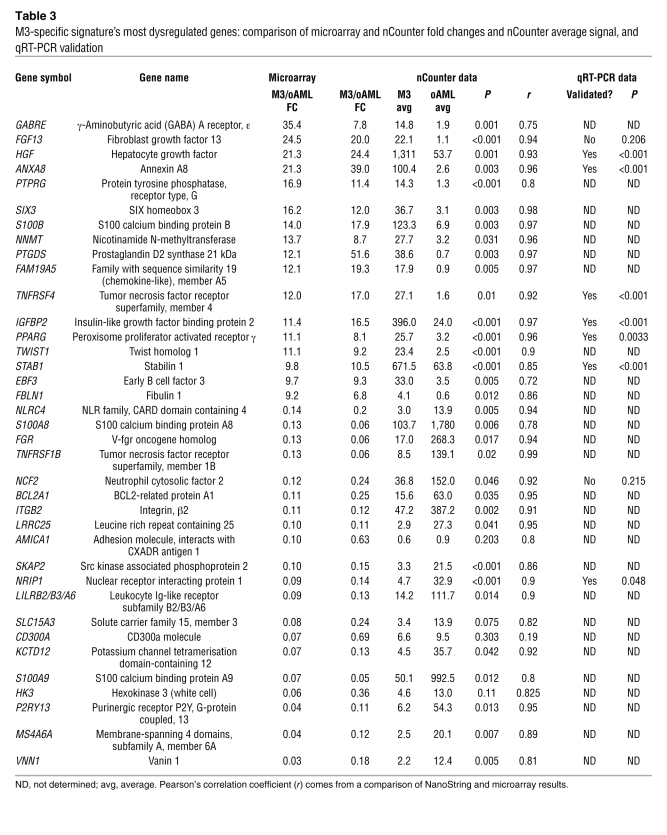
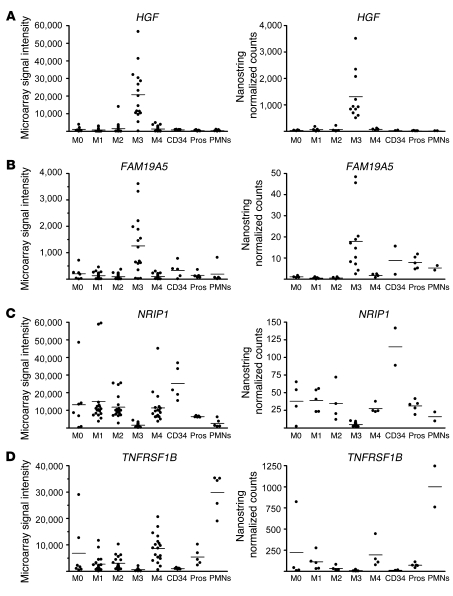
To validate the findings of the microarray analysis, we selected the 40 genes with the largest average fold changes (both up and down) between M3 and the other AML subtypes. Due to limited sample abundance, we used a high-throughput methodology for gene validation that allowed us to perform triplicate measurements of expression of 46 genes (the 40 with the highest fold changes, plus 6 developmentally regulated myeloid genes for calibration) with only 100 ng of RNA per replicate. Based on an average RNA yield of 25 μg per 107 cells from the bone marrow aspirate samples used in this study, we estimated that 100 ng corresponded to approximately 40,000 cells. The NanoString nCounter Analysis System uses digital technology based on direct multiplexed measurement of gene expression and offers high levels of sensitivity (500 attomolar, i.e., <1 copy per cell), precision, and reproducibility (1). The technology uses molecular barcodes and single-molecule imaging to detect and count hundreds of unique mRNAs in a single reaction (See Methods) (1). In this study the full capacity of the nCounter system was not utilized; up to 500 genes can be assayed in 1 multiplex reaction (1). To confirm the performance of this technology, we selected 6 “calibration” genes known to be differentially expressed in each myeloid cell fraction and in M3 samples. A total of 28 AML (11 M3 and 17 other AML subtypes), 2 CD34+, 5 promyelocyte, and 2 neutrophil samples were analyzed. The NanoString results showed the expected pattern of expression for all 6 calibration genes (compare Figure 3, A–C with Figure 1C). As shown in Table 3, 37 of the 40 M3-specific dysregulome genes were also assayed. The remaining 3 genes, SYNE1, FUT4, and PGDB5, could not be analyzed due to either inaccurate (SYNE1 and FUT4) or ambiguous (PGDB5) mapping of Affymetrix probe set target sequences to the human genome (See footnote in Table 2). Data from both methods are plotted for 2 examples each of up- or downregulated genes (HGF and FAM19A5, NRIP1 and TNFRSF1B, respectively) in Figure 4. Data from nCounter and microarray analyses demonstrate similar patterns of expression in M3 samples relative to other AML subtypes and normal promyelocytes (See Table 3 and Supplemental Table 2).
Figure 3. Validation of NanoString nCounter system performance by comparison with microarray results for calibration genes.
A total of 28 AML (11 M3, 17 other AML subtypes), 2 CD34+, 5 promyelocyte, and 2 neutrophil samples were analyzed. Expression is plotted as a percentage ([sample signal/signal of index group] × 100) because the microarray and nCounter system data were expressed in different units. Asterisks indicate the signal index group for each graph. The NanoString results showed the expected pattern of expression for all 6 genes. (A) Expression of early myeloid-specific hematopoietic genes in CD34+ cells, promyelocytes, neutrophils, M3 AML, and other FAB subtypes (oAML) as measured by the Affymetrix microarray (red) and NanoString nCounter system (green). (B) Promyelocyte-specific genes. (C) Late myeloid–specific genes.
Table 3 .
M3-specific signature’s most dysregulated genes: comparison of microarray and nCounter fold changes and nCounter average signal, and qRT-PCR validation
Figure 4. Validation of the M3-specific signature by the NanoString nCounter system.
(A–D) Expression of (A) HGF, (B) FAM19A5, (C) NRIP1, and (D) TNFRSF1B as measured by the Affymetrix Hu133+2 microarray (left panels) and the nCounter system (right panels). The same samples are plotted as in Figure 3. Each data point represents 1 patient sample. The horizontal line indicates the mean of each group. For microarray plots, each data point represents 1 sample (either patient or sorted normal cells) and indicates signal intensity for a single probe set on 1 microarray. For nCounter plots, each data point represents the mean normalized counts for 3 technical replicate measurements of 1 sample (either patient or sorted normal cells).
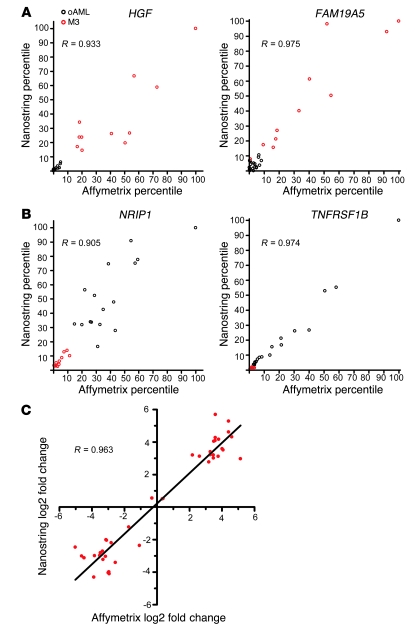
To more directly compare the nCounter and microarray methods, which have different units of measurement, we transformed each AML data point as a proportion of maximum signal for each probe set (microarray) or probe (nCounter) for all samples. These proportions were then plotted on a graph. As depicted in Figure 5, A and B, and Table 3, the correlation coefficients between the results of the 2 methods were r > 0.7 and statistically significant (P < 0.05) for all but 1 gene, CD300A, which may be due to differential targeting of the microarray and nCounter probes (middle and 5′, respectively) to an mRNA with 3 isoforms. Three other genes (AMICA1, SLC15A3, and HK3) demonstrated similar fold change values and high correlation coefficients compared with the microarray data but did not achieve significance when comparing expression in M3 with other AML subtypes in the nCounter assay. This result may be due to the low overall expression signals shown by both methods (Table 3). We also compared fold change ratio measurements (M3/other FAB subtypes) of all genes assayed by both microarray and NanoString. As demonstrated in Figure 5C, the correlation between the 2 platforms was very high (r = 0.963, P < 0.05). Based on the stringent criteria of a significantly high correlation coefficient, similar fold change values, and significant difference in expression (M3 vs. other subtypes and promyelocytes), 33 genes were validated by the nCounter system.
Figure 5. Comparison plots of NanoString nCounter with Affymetrix GeneChip data for M3-specific genes.
(A and B) Scatter plots show the percentage of maximum expression per probe/probe set in all samples for microarray data versus that for nCounter data. Correlation coefficients demonstrate significant correlation between the microarray and nCounter data. (A) Upregulated genes (HGF and FAM19A5), (B) downregulated genes (NRIP1 and TNFRSF1B), and (C) log2 (M3/other AML) fold change ratios as measured by Affymetrix arrays (x axis) and NanoString assay (y axis) for 37 highly dysregulated genes. The linear fit of the ratios in both assays yielded a correlation coefficient of 0.963.
We also performed qRT-PCR for 9 of the 40 M3-specific dysregulome genes in parallel with the nCounter method. For 7 of the 9 genes, qRT-PCR confirmed the significant fold change expression differences among M3, other FAB subtypes, and normal promyelocytes, as determined by the NanoString and microarray datasets (Table 3). Due to the limited abundance of many of our samples, we were unable to perform qRT-PCR assays on all 40 M3-specific dysregulome genes. However, the nCounter method has previously demonstrated strong correlation with qRT-PCR for 21 genes whose expression was measured in quadruplicate at 7 time points (1).
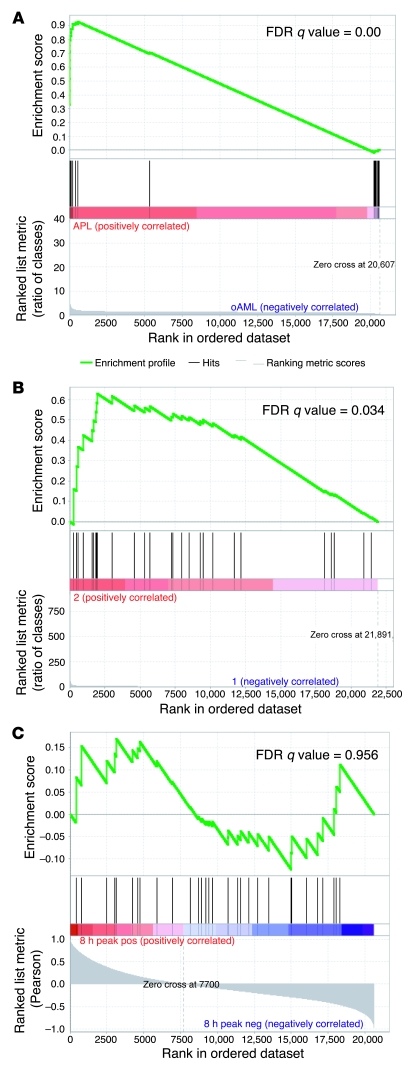
To determine whether the 33 validated genes are similarly dysregulated in AML samples from other studies, we used GSEA (19, 20) to evaluate a published dataset (18) (GSE6891). Expression in this set of 325 primary AML samples demonstrated a highly significant enrichment of the validated 33-gene set (FDR q value = 0.0; Figure 6A). In addition, GSEA analysis of expression in one of our mouse models of APL (5) demonstrated significant enrichment (FDR q value = 0.034; Figure 6B) of the murine orthologs of the validated genes. Finally, we tested expression of these validated genes in the PR-9 cell line (21), a commonly-used model of M3 AML. Zn2+ treatment massively increased expression of the PML-RARA fusion gene (see Supplemental Figure 2). GSEA analysis failed to demonstrate significant enrichment of the validated gene set in PR-9 cells expressing high levels of PML-RARA (FDR q value = 0.956; Figure 6C).
Figure 6. The validated 33-gene M3-specific signature is consistently dysregulated in other AML datasets and a mouse model of APL, but not in a PML-RARA+ cell line.
The top portion of each GSEA plot shows the running enrichment score for the validated M3-specific genes as the analysis moves down the ranked list. The peak score for each plot is the enrichment score for the gene set. The bottom portion of each plot shows the value of the ranking metric as it moves down the list of ranked genes. The FDR is an expression of the significance level of the enrichment, after multiple test correction. (A) GSEA plot of 325 M0–M4 AML samples (GSE6891), comparing M3 with other FAB subtypes, demonstrates significant enrichment. (B) GSEA plot of mCG-PML-RARA murine APL cells (20, 24) compared with day 2 wild-type murine myeloid cells (mostly promyelocytes) demonstrates significant enrichment. (C) GSEA plot of uninduced versus PML-RARA–induced PR-9 cells demonstrates no enrichment of the M3-specific genes at any time point.
Classification of M3 samples using the NanoString-validated gene set.
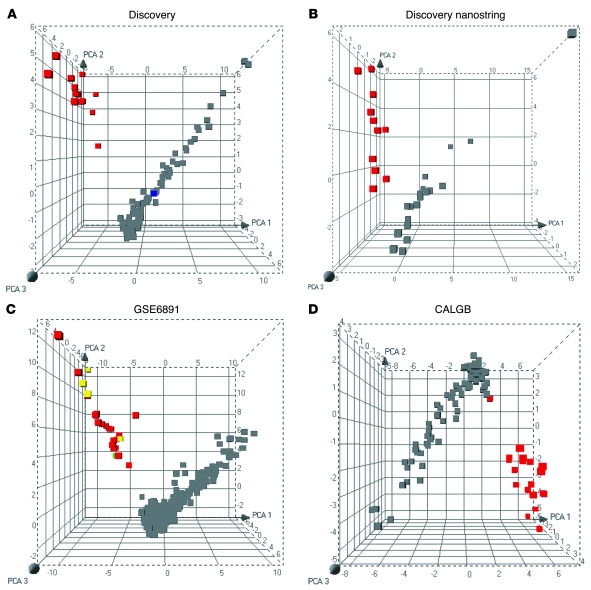
We next tested the ability of the 33 validated genes to identify M3 samples using unsupervised principle component analysis (PCA; ref. 26). In our dataset, all M3 samples positive for the PML-RARA rearrangement separated from the other samples (Figure 7). Notably, 1 sample diagnosed morphologically as M3 AML, but with normal cytogenetics and negative FISH, did not cluster with those positive for the PML-RARA fusion gene (Figure 7A). The patient from whom this sample was taken also failed all-trans retinoic acid (ATRA) therapy and died 2 months after induction. PCA of the primary NanoString expression data also clearly separated 11/11 M3 t(15;17)-positive samples from other FAB subtypes, as expected (Figure 7B). We next tested the validated gene set on a set of 325 M0–M4 AML samples (18) that contained several potentially ambiguous diagnoses. The PCA plot from this analysis shows that all 20 M3 t(15;17)-positive samples clustered separately from the other FAB subtypes, as expected (Figure 7C). In addition, 4 morphologically diagnosed M3 samples, in which the t(15;17) was missed by routine cytogenetics, clustered appropriately. Another sample in which morphological diagnosis (M2) conflicted with routine cytogenetics [t(15;17)] was also appropriately identified. Figure 7D demonstrates the ability of the validated gene set to separate all but 1 of the M3 t(15;17)-positive samples from other FAB subtypes; 19 of 20 M3 samples were appropriately identified in a dataset of 93 AML M0–M4 samples obtained from CALGB and analyzed in our microarray facility (see Methods).
Figure 7. The NanoString-validated, 33-gene M3-specific signature reliably identifies M3 samples, including those with normal cytogenetics and/or ambiguous morphology.
PCA plots of the validated gene expression data demonstrate a clear separation of M3 t(15;17)-positive samples (red) from other FAB subtypes (gray). (A) Data from the Washington University AML discovery set, including 15 M3 and 62 M0, M1, M2, and M4 AML samples (1). The PCA plot shows clustering of all M3 samples with the PML-RARA rearrangement, but not of 1 sample with an M3 morphological diagnosis, normal cytogenetics, and negative FISH that did not respond to ATRA therapy (blue). (B) NanoString nCounter expression data were sufficiently robust to separate 11/11 of M3 t(15;17)-positive samples from other FAB subtypes. (C) M3 samples from a published dataset (GSE6891) formed a distinct cluster separate from other FAB subtypes (total of 325). M3s with t(15;17) that were missed by routine cytogenetics (yellow) and a t(15;17)-positive sample morphologically classified as M2 (green) were also assigned appropriately to the M3 cluster. (D) A total of 19/20 M3s with t(15;17) from a CALGB sample set clustered separately from 73 other FAB subtypes.
Discussion
We have demonstrated the use of an innovative high-throughput methodology, the NanoString nCounter Analysis System, to quantify the mRNA abundance of a large number of genes from an expression signature using very small amounts of clinical material. Through the use of a large number of clinical samples and normal, primary myeloid cells, we defined the unique expression signature of M3 AML, which is distinct from other subtypes of AML and from normal promyelocytes. We then validated the M3-specific signature using the NanoString nCounter Analysis System, which enabled us to quantitate the relative expression of 46 genes with only 300 ng of total RNA, using multiplexed reactions. We determined that the validated genes were also significantly dysregulated in M3 AML samples from another large clinical study and from a mouse model of APL, but not from a commonly used tissue culture model of PML-RARA function. Finally, the validated genes reliably identify bona fide t(15;17)-positive M3 samples, separating them from other FAB subtypes in 3 independent AML datasets.
The findings presented here demonstrate the power of including a large number of de novo AML samples and normal human myeloid samples to define malignancy-specific expression signatures. Comparison of 14 M3 samples with 62 samples of other AML subtypes and 15 samples of normal primary myeloid cells allowed us to identify expression patterns that were both unique and highly reproducible for M3 AML. Comparison with normal enriched promyelocyte samples enabled us to filter out genes that were simply markers of the promyelocyte stage of myeloid development. Although a previous study (7) compared M3 and promyelocyte expression patterns, these were derived from CD34+ PBMCs cultured for 7 days with G-CSF, IL-3, and GM-CSF. Our analysis showed that the majority of the genes reported in that study (7) were filtered out by our comparison of M3 with CD34+ cells, primary promyelocytes, neutrophils, and other AML subtypes.
The NanoString nCounter system allowed us to quantify and validate (in triplicate) the expression of 42 of 46 genes in 28 AML and 11 normal myeloid samples, using approximately 1/10th of the RNA that qRT-PCR would have required. The nCounter system performed with a high level of precision and reproducibility, using only 100 ng of RNA (the RNA content of ~40,000 AML cells) per replicate. Expression signal values demonstrated significant correlation with microarray expression data. The coefficient of variation, a ratio of the standard deviation to the mean and a measure of reproducibility, was consistent with that of conventional qRT-PCR (data not shown).
We have shown that the validated M3 gene set was significantly enriched in M3 samples in another large clinical study. Experimental and in silico validation of the signature allowed us to examine 2 models of APL, one a knockin mouse model of the disease, the other a myeloid cell line with inducible expression of PML-RARA. Analysis of expression in APL cells derived from mCG-PML-RARA mice (27) demonstrated that the validated gene set was significantly dysregulated when compared with wild-type promyelocytes. Our previous work with this mouse model demonstrated that only 3 of 116 genes in the murine APL dysregulome were dysregulated in PML-RARA–expressing preleukemic promyelocytes, suggesting that in mice the genes that are dysregulated in APL are not downstream targets of the transgene (27). Similarly, the validated gene set identified in the current study was not altered in PR-9 cells, suggesting that many of the dysregulated genes in primary M3 AML samples are not direct targets of PML-RARA.
We have further demonstrated that the validated 33-gene set identifies M3 samples from within AML microarray expression datasets from other large studies, reliably separating those with t(15;17) and/or the PML-RARA fusion gene from those that were morphologically ambiguous. Only 1 of 60 M3 samples analyzed by PCA failed to segregate with the other M3s. Unsupervised hierarchical clustering of global expression analysis using the CALGB samples demonstrated that this outlier M3 sample segregated with a large mixed group of FAB subtypes and not with the other M3s (data not shown). There was no difference between the survival of the patient from whom this sample was taken and the survival of other M3 patients in the CALGB group. This evidence suggests that in a small number of patients there may be secondary mutations that can modify expression phenotypes without altering response to ATRA.
Importantly, the NanoString dataset itself was sufficient in reliably identifying all M3 samples in an unsupervised PCA of the 33-gene validated set. In both our study and one other that we analyzed (18), the results of routine cytogenetics conflicted with the morphologic diagnosis in several samples, but all PML-RARA+ samples were appropriately clustered by PCA. This conflict is important since ATRA is critical for the proper treatment of M3 AML patients. When treated with ATRA, patients with M3 AML have a significantly higher survival rate than those with other FAB subtypes (28). Moreover, due to the risk of disseminated intravascular coagulation in M3 AML, rapid, highly accurate diagnosis and initiation of therapy are crucial for optimal patient outcomes. Although most cases of M3 AML can be diagnosed using routine methods, a substantial number present atypically (i.e., without evidence for the reciprocal translocation [ref. 29], with atypical morphology, or with normal cytogenetics [ref. 18]).
The findings of this study may have implications for other types of cancer as well. For example, the diagnosis of solid tumors is often made from fine needle biopsies, which retrieve a small amount of tissue containing relatively few tumor cells. Depending upon the type of needle used and the ratio of tumor cells to stroma, a few hundred thousand to one million cells are typically extracted (30). Given the typical RNA yield of a metabolically active tumor cell, fine needle biopsies from solid tumors would likely provide sufficient RNA for nCounter assays of hundreds of genes.
In summary, we have identified and validated a set of genes that is significantly and specifically dysregulated in M3 relative to other subtypes of AML and normal myeloid cells, including promyelocytes. The nCounter method used to validate this signature is precise, sensitive, and automated and requires only 300 ng of RNA to assay up to several hundred genes in triplicate. The manufacturer provides custom probes, and the assay can be performed on site in a research or clinical lab. With the advent of this innovative technology, a more extensive validation of microarray-based signatures in precious clinical samples is now attainable. Extensive validation of dysregulated genes from clinical samples will allow us to more confidently assess the gene expression profiles of parallel studies performed in different laboratories and to more precisely evaluate model systems for human cancers. Furthermore, use of the nCounter method to assay the M3-specific signature provides a valuable diagnostic tool and offers the potential to assay the expression of hundreds of genes in very small clinical samples.
Methods
Human AML and normal sorted bone marrow samples.
Seventy-seven de novo adult AML bone marrow aspirates, including 14 M3 samples, were analyzed. Patient selection has been described previously (23); patient characteristics are summarized in Table 1. Bone marrow aspirates were also obtained from healthy adult donors. This study was approved by the Human Research Protection Office at Washington University School of Medicine after patients and donors provided informed consent in accordance with the Declaration of Helsinki. Isolation of normal promyelocytes and neutrophils was performed as described previously (22). Briefly, high-speed cell sorting isolated CD9–, CD14–, CD15hi, and CD16lo promyelocytes and CD9–, CD14–, CD15hi, and CD16hi neutrophils (Figure 1, A and B). MACS sorting was performed to isolate normal CD34+ cells according to the manufacturer’s instructions (Miltenyi Biotec). For all samples, sufficient cells were collected to perform the standard 1-cycle 3ι in vitro transcription protocol; this strategy avoids the bias introduced by linear amplification (2-cycle) required for small amounts of RNA. Sorted cells were lysed in Trizol reagent (Invitrogen) and stored at –80°C until RNA purification. RNA from AML bone marrow aspirates was prepared from unfractionated snap-frozen cell pellets using Trizol reagent. RNA from all samples was quantified using UV spectroscopy (Nanodrop Technologies) and qualitatively assessed using a BioAnalyzer 2100 and RNA NanoChip assay (Agilent Technologies). An additional 93 de novo AML bone marrow samples, described previously (23), were obtained from C. Bloomfield and M. Caligiuri, both of The Ohio State University Comprehensive Cancer Center and James Cancer Hospital & Solove Research Institute, Columbus, Ohio, USA; J. Vardiman of the University of Chicago, Chicago, Illinois, USA; and the Cancer and Leukemia Group B Tumor Bank, Chicago, Illinois and processed using the same methods as the samples from Washington University School of Medicine. Samples were labeled and hybridized to Affymetrix Human Genome U133 Plus 2.0 Array GeneChip microarrays (Affymetrix) using standard protocols from the Laboratory for Clinical Genomics (http://www.pathology.wustl.edu/research/lcgoverview.php; ref. 27). Profiling data for all samples have been deposited on the Gene Expression Omnibus (GEO; http://www.ncbi.nlm.nih.gov/geo/; accession no. GSE12662).
Analysis of AML and normal myeloid datasets.
To find genes that are differentially expressed in M3 in comparison with M0, M1, M2, and M4 subtypes, all probe sets with fewer than 10% present calls in both groups and less than 0.5 coefficient of variation across all samples were eliminated from further analysis. The remaining probe sets were analyzed using significance analysis of microarrays, 2-class analysis; 3,787 probe sets were significant at an FDR of 0.05. The normal myeloid developmental signature was defined by probe sets that were significantly different among CD34+, promyelocytes, and neutrophils at an ANOVA-adjusted P < 0.05 after multiple test correction. Probe sets specific to each developmental class were defined as having a significantly higher average expression in one class relative to both other classes (adjusted P < 0.05), yielding 2,622 CD34+-specific, 371 promyelocyte-specific, and 601 neutrophil-specific probe sets.
Cell lines.
NB4 cells were obtained from ATCC. PR-9 cells were a gift of P. Pelicci of the European Institute of Oncology, Milan, Italy (21). All cell lines were maintained in RPMI 1640 with 10% fetal calf serum. PR-9 cells were induced in 100 μM ZnSO4 diluted in medium. Cell lysates were collected at 0, 2, 4, 8, 16, and 24 hours after induction. RNA was isolated, quantified, and hybridized to microarrays as described above.
Western blots.
Prior to lysis, 2 × 10⁶ cells were incubated in the presence of 100 μM diisopropyl-fluorophosphate (Sigma-Aldrich), then lysed in 100 μl 2% SDS/PBS. Total protein (20 μg) was electrophoresed and Western blotting performed as previously described (5).
NanoString nCounter assay.
Details of the nCounter Analysis System (NanoString Technologies) were reported previously (1). In brief, 2 sequence-specific probes were constructed for each gene of interest (Supplemental Table 3). The probes were complementary to a 100-base region of the target mRNA. One probe was covalently linked to an oligonucleotide containing biotin (the capture probe), and the other was linked to a color-coded molecular tag that provided the signal (the reporter probe; see ref. 1). The nCounter CodeSet for these studies contained probe pairs for 73 test and control genes. Forty-six probe pairs were specific for Homo sapiens genes, and 28 corresponded to various nCounter system controls, including a standard curve. Detailed sequence information for the target regions, capture probes, and reporter probes is listed in Supplemental Table 3. Each sample was hybridized in triplicate with 100 ng of total RNA in each reaction. All 46 genes and controls were assayed simultaneously in multiplexed reactions (for details, see ref. 1). To account for slight differences in hybridization and purification efficiency, the raw data were normalized to the standard curve generated via the nCounter system spike-in controls present in all reactions.
qRT-PCR.
One-step qRT-PCR was performed on 20 ng total RNA using the QuantiTect SYBR Green RT-PCR kit and QuantiTect Primer assays (Qiagen) on a Prism 7300 real-time PCR system (Applied Biosystems) according to the manufacturer’s instructions. All reactions were performed in triplicate. Expression was normalized to GAPDH using the ΔCt method.
Analysis software.
For a significance analysis of microarrays, depending on the sample set, 2-class or multi-class analysis was performed. An FDR cutoff of 0.05 was used (http://www-stat.stanford.edu/~tibs/SAM/) (25). For GSEA, depending on the sample size, phenotype or gene set permutation analysis with ratio-of-classes or signal-to-noise gene ranking were performed using GSEA (http://www.broad.mit.edu/gsea) (19, 20). Spotfire DecisionSite 8.2 software (TIBCO) was used in PCA and Wards hierarchical clustering.
Statistics.
P values for NanoString nCounter and qRT-PCR data were calculated using a Student’s 2-tailed t test and were considered significant when P < 0.05. Correlation coefficients for comparison of nCounter and microarray data were calculated as follows: each patient data point was transformed to a percentile of the maximum value for that particular probe set (microarray) or probe (nCounter). Microarray and nCounter percentiles were plotted against each other (see Figure 5) and the Pearson’s correlation coefficient R calculated. Correlation coefficients were considered significant if greater than 0.374, which corresponds to P < 0.05.
Note that the T statistic for R is calculated by the formula T = R√(n – 2) / √(1 – R2). T = 2.056 when P = 0.05 with a 2-tailed distribution. Using T = 2.056 and n = 28 (the total number of AML samples assayed by both Affymetrix microarrays and nCounter), the equation was solved for R (R = 0.374), meaning that any R value greater than 0.374 was statistically significant (P < 0.05).
Supplementary Material
Acknowledgments
This work was supported by grants from the NIH (RO1 CA083962 and PO1 CA0101937) and the Barnes-Jewish Hospital Foundation (to T.J. Ley). The authors thank Clara Bloomfield, Michael Caligiuri, and James Vardiman, and the Cancer and Leukemia Group B (CALBG) Tumor Bank for providing the CALBG AML samples used in this study. The authors are grateful to the High Speed Cell Sorter Core, the Laboratory for Clinical Genomics, the Tissue Procurement Core, and the Bioinformatics Core of the Siteman Cancer Center for their invaluable support. Nancy Reidelberger provided expert editorial assistance. Richard Perrin provided expert microscopy assistance. Matthew Walter critically read the paper and provided helpful advice.
Footnotes
Authorship note: Jacqueline E. Payton and Nicole R. Grieselhuber contributed equally to this work.
Conflict of interest: G.K. Geiss is an employee of NanoString and owns stock in that company.
Nonstandard abbreviations used: AML, acute myeloid leukemia; APL, acute promyelocytic leukemia; ATRA, all-trans retinoic acid; FDR, false discovery rate; GSEA, gene set enrichment analysis; PCA, principle component analysis; qRT-PCR, quantitative RT-PCR.
Citation for this article: J. Clin. Invest. 119:1714–1726 (2009). doi:10.1172/JCI38248
References
- 1.Geiss G.K., et al. Direct multiplexed measurement of gene expression with color-coded probe pairs. Nat. Biotechnol. 2008;26:317–325. doi: 10.1038/nbt1385. [DOI] [PubMed] [Google Scholar]
- 2.Grisolano J.L., Wesselschmidt R.L., Pelicci P.G., Ley T.J. Altered myeloid development and acute leukemia in transgenic mice expressing PML-RAR alpha under control of cathepsin G regulatory sequences. Blood. 1997;89:376–387. [PubMed] [Google Scholar]
- 3.Brown D., et al. A PMLRARalpha transgene initiates murine acute promyelocytic leukemia. Proc. Natl. Acad. Sci. U. S. A. 1997;94:2551–2556. doi: 10.1073/pnas.94.6.2551. [DOI] [PMC free article] [PubMed] [Google Scholar]
- 4.He L.Z., et al. Acute leukemia with promyelocytic features in PML/RARalpha transgenic mice. Proc. Natl. Acad. Sci. U. S. A. 1997;94:5302–5307. doi: 10.1073/pnas.94.10.5302. [DOI] [PMC free article] [PubMed] [Google Scholar]
- 5.Westervelt P., et al. High-penetrance mouse model of acute promyelocytic leukemia with very low levels of PML-RARalpha expression. Blood. 2003;102:1857–1865. doi: 10.1182/blood-2002-12-3779. [DOI] [PubMed] [Google Scholar]
- 6.Bullinger L., et al. Use of gene-expression profiling to identify prognostic subclasses in adult acute myeloid leukemia. N. Engl. J. Med. 2004;350:1605–1616. doi: 10.1056/NEJMoa031046. [DOI] [PubMed] [Google Scholar]
- 7.Casorelli I., et al. Identification of a molecular signature for leukemic promyelocytes and their normal counterparts: Focus on DNA repair genes. Leukemia. 2006;20:1978–1988. doi: 10.1038/sj.leu.2404376. [DOI] [PubMed] [Google Scholar]
- 8.Debernardi S., et al. Genome-wide analysis of acute myeloid leukemia with normal karyotype reveals a unique pattern of homeobox gene expression distinct from those with translocation-mediated fusion events. Genes Chromosomes Cancer. 2003;37:149–158. doi: 10.1002/gcc.10198. [DOI] [PubMed] [Google Scholar]
- 9.Gutierrez N.C., et al. Gene expression profile reveals deregulation of genes with relevant functions in the different subclasses of acute myeloid leukemia. Leukemia. 2005;19:402–409. doi: 10.1038/sj.leu.2403625. [DOI] [PubMed] [Google Scholar]
- 10.Haferlach T., et al. Global approach to the diagnosis of leukemia using gene expression profiling. Blood. 2005;106:1189–1198. doi: 10.1182/blood-2004-12-4938. [DOI] [PubMed] [Google Scholar]
- 11.Haferlach T., et al. AML M3 and AML M3 variant each have a distinct gene expression signature but also share patterns different from other genetically defined AML subtypes. Genes Chromosomes Cancer. 2005;43:113–127. doi: 10.1002/gcc.20175. [DOI] [PubMed] [Google Scholar]
- 12.Kohlmann A., et al. Molecular characterization of acute leukemias by use of microarray technology. Genes Chromosomes Cancer. 2003;37:396–405. doi: 10.1002/gcc.10225. [DOI] [PubMed] [Google Scholar]
- 13.Lee S., et al. Gene expression profiles in acute myeloid leukemia with common translocations using SAGE. Proc. Natl. Acad. Sci. U. S. A. 2006;103:1030–1035. doi: 10.1073/pnas.0509878103. [DOI] [PMC free article] [PubMed] [Google Scholar]
- 14.Valk P.J., et al. Prognostically useful gene-expression profiles in acute myeloid leukemia. . N. Engl. J. Med. 2004;350:1617–1628. doi: 10.1056/NEJMoa040465. [DOI] [PubMed] [Google Scholar]
- 15.Ross M.E., et al. Gene expression profiling of pediatric acute myelogenous leukemia. Blood. 2004;104:3679–3687. doi: 10.1182/blood-2004-03-1154. [DOI] [PubMed] [Google Scholar]
- 16.Schoch C., et al. Acute myeloid leukemias with reciprocal rearrangements can be distinguished by specific gene expression profiles. Proc. Natl. Acad. Sci. U. S. A. 2002;99:10008–10013. doi: 10.1073/pnas.142103599. [DOI] [PMC free article] [PubMed] [Google Scholar]
- 17.Wilson C.S., et al. Gene expression profiling of adult acute myeloid leukemia identifies novel biologic clusters for risk classification and outcome prediction. Blood. 2006;108:685–696. doi: 10.1182/blood-2004-12-4633. [DOI] [PMC free article] [PubMed] [Google Scholar]
- 18.Verhaak R.G., et al. Prediction of molecular subtypes in acute myeloid leukemia based on gene expression profiling. Haematologica. 2009;94:131–134. doi: 10.3324/haematol.13299. [DOI] [PMC free article] [PubMed] [Google Scholar]
- 19.Mootha V.K., et al. PGC-1alpha-responsive genes involved in oxidative phosphorylation are coordinately downregulated in human diabetes. Nat. Genet. 2003;34:267–273. doi: 10.1038/ng1180. [DOI] [PubMed] [Google Scholar]
- 20.Subramanian A., et al. Gene set enrichment analysis: a knowledge-based approach for interpreting genome-wide expression profiles. Proc. Natl. Acad. Sci. U. S. A. 2005;102:15545–15550. doi: 10.1073/pnas.0506580102. [DOI] [PMC free article] [PubMed] [Google Scholar]
- 21.Grignani F., et al. The acute promyelocytic leukemia-specific PML-RAR[alpha] fusion protein inhibits differentiation and promotes survival of myeloid precursor cells. Cell. 1993;74:423–431. doi: 10.1016/0092-8674(93)80044-F. [DOI] [PubMed] [Google Scholar]
- 22.Grenda D.S., et al. Mutations of the ELA2 gene found in patients with severe congenital neutropenia induce the unfolded protein response and cellular apoptosis. Blood. 2007;110:4179–4187. doi: 10.1182/blood-2006-11-057299. [DOI] [PMC free article] [PubMed] [Google Scholar]
- 23.Link D.C., et al. Distinct patterns of mutations occurring in de novo AML versus AML arising in the setting of severe congenital neutropenia. Blood. 2007;110:1648–1655. doi: 10.1182/blood-2007-03-081216. [DOI] [PMC free article] [PubMed] [Google Scholar]
- 24. Jaffe, E.S., Harris, N.L., Stein, H., and Vardiman, J.W. 2001.Pathology and genetics of tumours of haematopoietic and lymphoid tissues. IARC Press. Lyon, France. 352 pp. [Google Scholar]
- 25.Tusher V.G., Tibshirani R., Chu G. Significance analysis of microarrays applied to the ionizing radiation response. Proc. Natl. Acad. Sci. U. S. A. 2001;98:5116–5121. doi: 10.1073/pnas.091062498. [DOI] [PMC free article] [PubMed] [Google Scholar]
- 26. Jolliffe, I.T. 2002.Principal component analysis. 2nd edition. Springer. New York, New York, USA. 502 pp. [Google Scholar]
- 27.Yuan W., et al. Commonly dysregulated genes in murine APL cells. Blood. 2007;109:961–970. doi: 10.1182/blood-2006-07-036640. [DOI] [PMC free article] [PubMed] [Google Scholar]
- 28.Mrozek K., Heerema N.A., Bloomfield C.D. Cytogenetics in acute leukemia. Blood Rev. 2004;18:115–136. doi: 10.1016/S0268-960X(03)00040-7. [DOI] [PubMed] [Google Scholar]
- 29.Lafage-Pochitaloff M., et al. Acute promyelocytic leukemia cases with nonreciprocal PML/RARa or RARa/PML fusion genes. Blood. 1995;85:1169–1174. [PubMed] [Google Scholar]
- 30.Welker L., Akkan R., Holz O., Schultz H., Magnussen H. Diagnostic outcome of two different CT-guided fine needle biopsy procedures. Diagn. Pathol. 2007;2:31.. doi: 10.1186/1746-1596-2-31. [DOI] [PMC free article] [PubMed] [Google Scholar]
Associated Data
This section collects any data citations, data availability statements, or supplementary materials included in this article.


