Abstract
Purpose
Lung cancer, of which 85% is non–small-cell (NSCLC), is the leading cause of cancer-related death in the United States. We used genome-wide analysis of tumor tissue to investigate whether single nucleotide polymorphisms (SNPs) in tumors are prognostic factors in early-stage NSCLC.
Patients and Methods
One hundred early-stage NSCLC patients from Massachusetts General Hospital (MGH) were used as a discovery set and 89 NSCLC patients collected by the National Institute of Occupational Health, Norway, were used as a validation set. DNA was extracted from flash-frozen lung tissue with at least 70% tumor cellularity. Genome-wide genotyping was done using the high-density SNP chip. Copy numbers were inferred using median smoothing after intensity normalization. Cox models were used to screen and validate significant SNPs associated with the overall survival.
Results
Copy number gains in chromosomes 3q, 5p, and 8q were observed in both MGH and Norwegian cohorts. The top 50 SNPs associated with overall survival in the MGH cohort (P ≤ 2.5 × 10⁻⁴) were selected and examined using the Norwegian cohort. Five of the top 50 SNPs were validated in the Norwegian cohort with false discovery rate lower than 0.05 (P < .016) and all five were located in known genes: STK39, PCDH7, A2BP1, and EYA2. The numbers of risk alleles of the five SNPs showed a cumulative effect on overall survival (Ptrend = 3.80 × 10⁻¹² and 2.48 × 10⁻⁷ for MGH and Norwegian cohorts, respectively).
Conclusion
Five SNPs were identified that may be prognostic of overall survival in early-stage NSCLC.
INTRODUCTION
Lung cancer is the leading cause of cancer-related death in the United States.1 Non–small-cell lung cancer (NSCLC) comprises more than 80% of lung cancer.2 The TNM staging system has been the standard for determining prognosis of NSCLC. It is reported that the 5-year survival rate is 40% to 67% in stage I and 25% to 55% in stage II NSCLC.3 The wide range of survival rates seen in patients with early-stage disease indicates the heterogeneity of prognoses within this population and the inadequacy of the TNM staging system to account fully for this heterogeneity.
Due to advances in high-throughput genotyping, screening for disease loci on a genome-wide scale is now possible. Genome-wide association studies have been published on lung cancer, suggesting that lung cancer susceptibility may be associated with several single nucleotide polymorphisms (SNPs).4,5 All of these studies, however, focused on cancer susceptibility rather than cancer survival.
Genetic variations in the tumor genome may serve as better prognostic markers than germline genetic variations. Tumor genomics are more representative of the clinical problem and therefore are more likely to determine the transformative and invasive behaviors specific to cancer cells. Moreover, the SNP genotypes in tumor genome may be different from the corresponding genotypes in the germline DNA because of the frequent events of mutation resulting from genetic instability.6
Genome-wide copy number aberrations in tumor genome have been reported.7,8 Some studies have suggested an association of copy number variation of tumor genome with cancer survival.7,9 There were also studies using metagene or gene signatures from the mRNA expression data of NSCLC to predict patients' prognosis.10,11 However, to our knowledge, there is no study of the association of tumor SNPs with NSCLC survival using genome-wide technology.
The aim of this study was to identify genetic variations in tumors that are associated with the survival in early-stage NSCLC. In this study, genome-wide analysis of survival was conducted with one discovery set and the results were validated using a separate validation set.
PATIENTS AND METHODS
Study Population and Specimens
The discovery phase of the study included 240 patients with early-stage NSCLC who underwent surgical resection at Massachusetts General Hospital (MGH; Boston, MA) between 1992 and 2001, and whose resected specimen was available for pathological review and DNA extraction. One hundred forty of 240 patients were excluded because of insufficient tissue quality, inadequate DNA content, or low DNA quality. The remaining 100 specimens selected from the MGH cohort were used as the discovery set. An independent validation set consisted of 89 specimens assembled using similar criteria from a series of 199 patients with NSCLC collected by the National Institute of Occupational Health, Oslo, Norway, who underwent surgical resection between 1988 and 1998. We also included 19 additional specimens of matched non-neoplastic lung parenchyma from patients with NSCLC in the Norwegian cohort. Written informed consent was obtained from all patients. The study was approved by the institutional review boards of MGH, the Harvard School of Public Health, and the Norwegian Data Inspectorate, and Local Regional Committee for Medical Research. The section of demographic and clinical data collection is described in Appendix (online only).
DNA Quality and Histopathology
Frozen, archived resection specimens were analyzed. DNA was prepared from tumor and non-neoplastic lung parenchyma after manual microdissection of 5-μ histopathologic sections. For the discovery set, a pathologist (L.R.C.) who had no knowledge of the outcome reviewed all sections for each patient. Each specimen was evaluated for amount and quality of tumor cells and histologically classified using the WHO criteria. The Norwegian specimens were all resections collected and prepared in the same way. Specimens with lower than 70% cancer cellularity, inadequate DNA concentration (< 50 ng/μL), or a smearing pattern in gel electrophoresis were not included for genotyping.
Genotyping and Inferring Copy Number
A total of 262,264 SNPs were genotyped for 189 tumor DNAs, 20 paired blood DNAs in the MGH cohort and 19 DNAs from paired noninvolved lung tissues in the Norwegian cohort using Affymetrix 250K Nsp GeneChip (Affymetrix, Santa Clara, CA). The comparison of the 39 tumor DNA and the corresponding 39 DNA from the blood or noninvolved tissue is shown in Appendix Table A1 (online only). Overall, 2.42% of the SNPs had different genotypes in the pair DNAs. The median call rates of the MGH and Norwegian samples were 92.8 and 90.9, respectively, which were similar to the previous studies in solid tumors using Affymetrix SNP chip.12–14 Copy numbers were obtained with dChip software.15 The probe intensities were calculated by model-based expression after invariant set normalization. For each SNP in each sample, the raw copy number was computed as signal times 2 divided by the mean signal of reference samples at this SNP, using blood or non-neoplastic tissue samples as the referent. Inferred copy numbers were computed from the raw copy numbers by median smoothing for each locus of 262,264 SNPs.
Statistical Analysis
Inferred copy numbers ≥ 2.7 were considered gains and ≤ 1.3 were considered losses. These cut-offs were set in order to detect ≥ 3 and ≤ 1 copies by tolerating 30% normal cell contamination. The prevalence of the subjects with copy number variations (CNVs) was plotted across the genome. Significance in genome-wide copy number variations was determined based on the binomial distribution with the probabilities of CNVs (≥ 2.7 or ≤ 1.3) estimated empirically from the data, and q values were calculated to control for multiple comparisons across the genome using the false discovery rate.16
The 74,666 SNPs with ≥ 95% call rate, ≥ 10% subjects with heterozygous or variant homozygous alleles, and ≥ 3% subjects with variant homozygous in the MGH cohort were selected for subsequent genome-wide analysis of overall survival. This selection was necessary to eliminate the potential for biased results driven by the few subjects carrying homozygous variant alleles. For each of the selected 74,666 SNPs, genome-wide analysis of overall survival in the additive mode was performed using the MGH cohort by univariate Cox models. Two-sided P values were obtained using score tests. The top 50 SNPs with the smallest P values were used for validation using the Norwegian cohort. For each of these 50 SNPs, Cox models were fit adjusting for covariates including age (in a continuous scale), sex, clinical stage (IA, IB, IIA, and IIB as ordinal categories), cell type (squamous cell carcinoma v adenocarcinoma), smoking pack-years (in a continuous scale), and false discovery rate (FDR) using q values were computed to control for the 50 comparisons. Survival analysis using joint copy number and SNP was also performed, where copy numbers in each SNP were adjusted by multiplying the SNPs in a continuous scale by the inferred copy numbers. For SNPs with consistent effects in two cohorts, pooled analyses were performed using stratified Cox models, assuming different baseline hazards for the two cohorts to control for differences between the two cohorts that are not accounted for by the covariates, and adjusting for the above covariates.
Risk alleles were defined as the alleles associated with shorter survival. Joint effects were investigated by adding up the number of risk alleles of the five validated SNPs by the Norwegian cohort. Cox models were fit using the total number of risk alleles as an ordinal variable while adjusting for covariates. Poisson regressions were used to compute crude mortality rates, crude recurrence rates, and 95% CIs for different numbers of risk alleles. The numbers of risk alleles of the five SNPs were further categorized into 0, 1 or 2, 3 or 4, and more than 4. Hazard ratios for each category were estimated using Cox models with those carrying 0 risk allele as the referent. Kaplan-Meier survival estimates were also plotted for the four groups and P values were obtained with log-rank tests. Similar P values were obtained using Cox models controlling for covariates. Within stage IA, IB, and II, Kaplan-Meier survival estimates were also plotted for those carrying ≤ 2 risk alleles and more than two risk alleles. The linkage disequilibrium plots were derived using Haploview (version 3.32; http://www.broad.mit.edu/mpg/haploview).
RESULTS
Patient Characteristics
Patient characteristics of the MGH and Norwegian cohorts are described in Table 1. The median survival times were 6.3 and 3.7 years, and 43 and 55 deaths occurred in the MGH and Norwegian cohorts, respectively. The proportion of male patients and squamous cell carcinomas was higher in the Norwegian cohort, but the median smoking pack-years was higher in the MGH cohort (all with P < .05). In the MGH cohort, there were eight patients who received adjuvant radiation and one patient with adjuvant chemotherapy. None of the Norwegian patients received adjuvant chemotherapy or radiotherapy. Among the characteristics listed in Table 1, only age showed marginal significance in association with overall survival (P = .056 and .11 for the MGH and Norwegian cohorts, respectively).
Table 1.
Characteristics of the Massachusetts General Hospital and Norwegian Cohorts
| Characteristic | Massachusetts General Hospital Cohort |
Norwegian Cohort |
||
|---|---|---|---|---|
| No. | % | No. | % | |
| Sample size (death/total) | 43/100 | 55/89 | ||
| Median survival time, years | 6.3 | 3.7 | ||
| Ethnicity | ||||
| White | 96 | 96 | — | |
| Black | 3 | 3 | ||
| Other | 1 | 1 | ||
| Call rate in Affymetrix 250K GeneChip* | ||||
| Median ± interquartile range | 92.8 ± 3.7 | 90.9 ± 4.4 | ||
| Clinical stage | ||||
| IA | 39 | 39 | 20 | 22.5 |
| IB | 43 | 43 | 50 | 56.2 |
| IIA | 3 | 3 | 0 | 0 |
| IIB | 15 | 15 | 19 | 21.3 |
| Sex | ||||
| Female | 44 | 44 | 21 | 23.6 |
| Male | 56 | 56 | 68 | 76.4 |
| Cell type | ||||
| Adenocarcinoma | 86 | 86 | 36 | 40.4 |
| Squamous cell carcinoma | 14 | 14 | 53 | 59.6 |
| Adjuvant chemotherapy | 1 | 1 | 0 | 0 |
| Adjuvant radiation | 8 | 8 | 0 | 0 |
| Age, years | ||||
| Median ± interquartile range | 68.64 ± 11.25 | 67.63 ± 7.00 | ||
| Smoking, pack-years | ||||
| Median ± interquartile range | 49.5 ± 48.48 | 28.00 ± 25.55 | ||
Affymetrix (Santa Clara, CA).
Copy Number Analyses
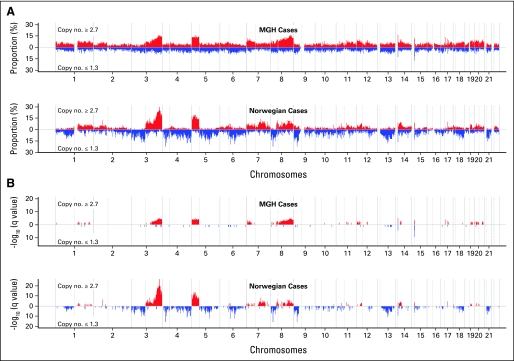
The pattern of copy number variations (≥ 2.7 or ≤ 1.3) in both cohorts was similar although Norwegian cases seemed to have more substantial changes than MGH patients (Fig 1). In both cohorts, at least 10% to 15% subjects had large-scale copy number gains in chromosomes 3q, 5p, and 8q, which was statistically significant even after adjusting for multiple comparisons by FDR. Furthermore, focal amplifications of copy number in chromosomes 7p, 14q, 17q, and 19q were also significantly high in both cohorts (FDR < 0.05).
Fig 1.
(A) Prevalence (%) and its (B) false discovery rate (q values) of patients with copy number ≥ 2.7 (red) and ≤ 1.3 (blue) in two cohorts, respectively. The x-axis represents the positions in genome/chromosomes, and the y-axis represents the prevalence and -log10 (q values).
SNP Analyses
Seventy four thousand six hundred sixty six SNPs were used for genome-wide survival analysis in the MGH cohort. The top 50 SNPs (P ≤ 2.5 × 10⁻⁴ in univariate analyses) that were most highly associated with overall NSCLC survival were chosen for validation in the Norwegian cohort using Cox models assuming the additive mode. Among the 50 SNPs, 10 were found to be associated with overall survival in the same direction with P values lower than .1 and three SNPs with opposite associations in the Norwegian cohort with adjustment of age, sex, cell type, clinical stage, and smoking pack-years (Table 2). Analyses adjusted for copy numbers also revealed similar findings. Notably, nine of 10 SNPs validated at significance level of 0.1 located in known genes, which was significantly overrepresented (P = 1.1 × 10⁻⁴) given the fact that only 40.3% of the probes on the chip were in known genes. The most significant two SNPs (rs10176669 and rs4438452) were located in the same genes (STK39), and two SNPs in both PCDH7 and HTR3E were validated with significance level of 0.1 (FDR < 0.15).
Table 2.
Thirteen Single Nucleotide Polymorphisms Discovered in the Massachusetts General Hospital Cohort Using Genome-Wide Association Analyses of Overall Survival and Validated in the Norwegian Cohort With P < .1
| dbSNP | Risk Allele | Gene | Massachusetts General Hospital Cohort |
Norwegian Cohort |
Pooled Analysis |
|||||||
|---|---|---|---|---|---|---|---|---|---|---|---|---|
| HR* | 95% CI† | P‡ | HR* | 95% CI † | P‡ | q Value§ | HR‖ | 95% CI† | P‡ | |||
| Consistent effects | ||||||||||||
| rs10176669 | A | STK39 | 2.34 | 1.43 to 3.84 | 3.93 × 10⁻⁴ | 2.78 | 1.49 to 5.16 | 9.13 × 10⁻⁴ | 0.014 | 2.40 | 1.65 to 3.49 | 1.74 × 10⁻⁶ |
| rs4438452 | T | STK39 | 2.41 | 1.45 to 4.03 | 4.89 × 10⁻⁴ | 2.73 | 1.43 to 5.18 | .0020 | 0.014 | 2.25 | 1.54 to 3.28 | 9.97 × 10⁻⁶ |
| rs12446308 | G | A2BP1 | 2.99 | 1.75 to 5.11 | 5.18 × 10⁻⁶ | 2.92 | 1.41 to 6.03 | .0027 | 0.014 | 2.90 | 1.93 to 4.36 | 2.88 × 10⁻⁸ |
| rs13041757 | C | EYA2 | 2.53 | 1.55 to 4.14 | 5.93 × 10⁻⁵ | 1.93 | 1.22 to 3.07 | .0071 | 0.029 | 2.04 | 1.48 to 2.81 | 6.08 × 10⁻⁶ |
| rs10517215 | A | PCDH7 | 2.86 | 1.62 to 5.06 | 1.88 × 10⁻⁴ | 2.11 | 1.12 to 3.97 | .016 | 0.047 | 2.44 | 1.61 to 3.71 | 2.45 × 10⁻⁵ |
| rs7078980 | A | CAMK1D | 2.63 | 1.53 to 4.52 | 1.79 × 10⁻⁴ | 1.76 | 1.08 to 2.87 | .036 | 0.092 | 1.93 | 1.37 to 2.72 | 1.40 × 10⁻⁴ |
| rs7926262 | C | — | 3.12 | 1.39 to 7.03 | .0022 | 2.52 | 1.01 to 6.30 | .052 | 0.12 | 2.53 | 1.44 to 4.46 | 9.56 × 10⁻⁴ |
| rs9290781 | A | HTR3E | 3.81 | 2.03 to 7.15 | 5.76 × 10⁻⁶ | 1.56 | 0.97 to 2.51 | .063 | 0.13 | 1.92 | 1.34 to 2.76 | 2.57 × 10⁻⁴ |
| rs11718245 | T | HTR3E | 3.28 | 1.74 to 6.18 | 1.14 × 10⁻⁴ | 1.59 | 0.96 to 2.62 | .067 | 0.13 | 1.96 | 1.35 to 2.85 | 3.87 × 10⁻⁴ |
| rs1374653 | T | PCDH7 | 2.91 | 1.65 to 5.15 | 1.19 × 10⁻⁴ | 2.12 | 0.91 to 4.98 | .080 | 0.14 | 2.58 | 1.61 to 4.12 | 6.71 × 10⁻⁵ |
| Opposite effects | ||||||||||||
| rs6034368 | T/C | — | 2.79 | 1.63 to 4.80 | 1.38 × 10⁻⁴ | 0.41 | 0.22 to 0.74 | .0024 | 0.014 | — | — | — |
| rs1893784 | G/A | — | 2.49 | 1.45 to 4.27 | 6.85 × 10⁻⁴ | 0.61 | 0.41 to 0.90 | .012 | 0.041 | — | — | — |
| rs9307270 | G/A | — | 3.02 | 1.68 to 5.44 | 1.51 × 10⁻⁴ | 0.44 | 0.17 to 1.15 | .097 | 0.15 | — | — | — |
Abbreviation: HR, hazard ratio.
HRs assuming an additive effect of risk alleles, obtained with multivariate Cox models adjusting for age (in a continuous scale), sex, clinical stage (IA, IB, IIA, and IIB as ordinal), cell type (adenocarcinoma v squamous cell carcinoma), and smoking pack-years (in a continuous scale).
Wald-type CIs.
P values obtained with the score test.
q values obtained with false discovery rate method in order to adjust for the 50 hypothesis testing.
Pooled HRs were estimated by stratified Cox model assuming different baseline hazards for the two cohorts and adjusting for age, sex, clinical stage, cell type, and smoking pack-years.
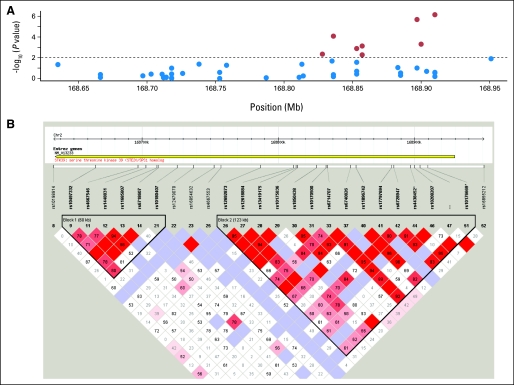
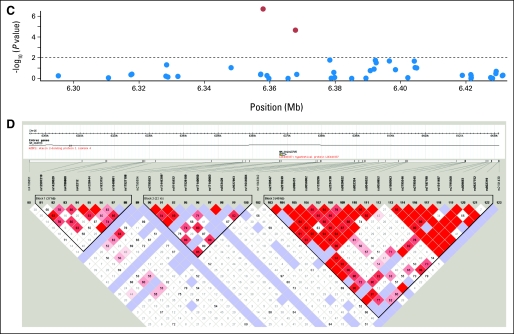
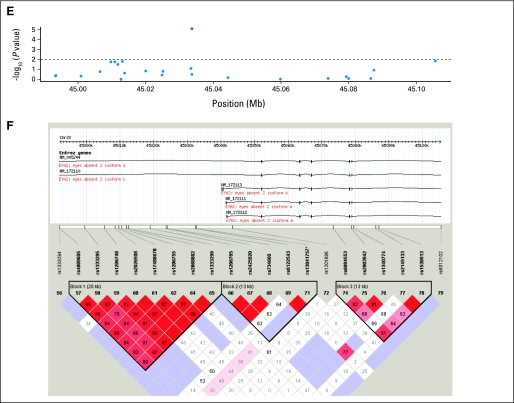
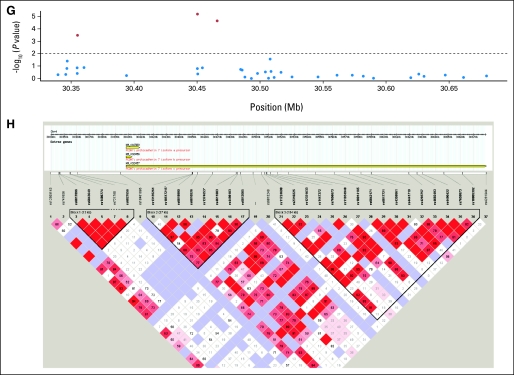
Five SNPs (rs10176669, rs4438452, rs12446308, rs13041757, and rs10517215) with consistent effects and FDR lower than 0.05 (P < .016) were all located in the introns of known genes: serine threonine kinase 39 (STK39), protocadherin 7 (PCDH7), ataxin 2-binding protein 1 (A2BP1), and eyes absent homolog 2 (EYA2). For the five SNPs, pooled analyses showed even higher significance than that in either single cohort. The patients in the MGH cohort receiving adjuvant chemotherapy or radiation affected the results in Table 2 very little after excluding them from the analyses or adjusting for it as a covariate. Analyses excluding the nonwhite patients (n = 4) also showed similar results. The linkage disequilibrium plots of the validated SNPs are shown in Appendix Figure A2(online only).
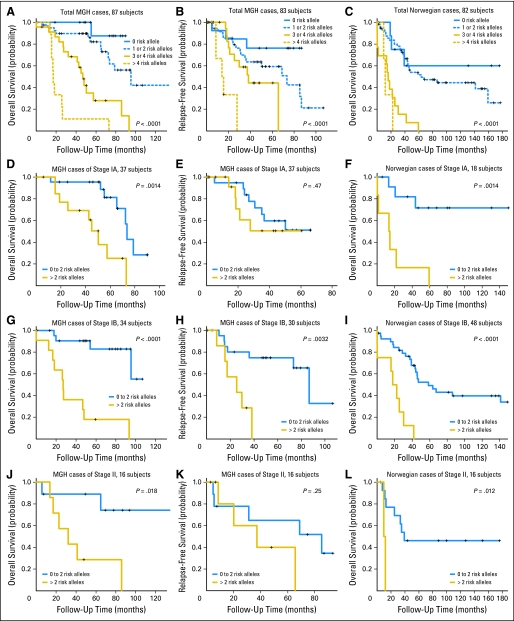
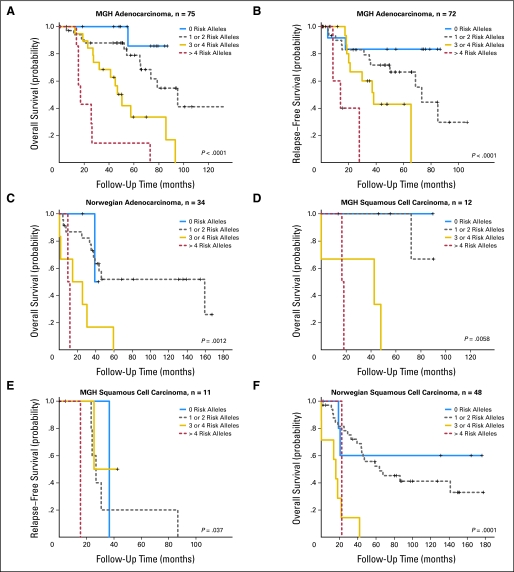
The joint effect of the five SNPs was summarized by the number of total risk alleles in Table 3. The crude mortality rates in both cohorts were shown to increase with the number of risk alleles, which was consistent with the results from tests for trend in Cox models (P = 3.80 × 10⁻¹² in the MGH cohort and P = 2.48 × 10⁻⁷ in the Norwegian cohort). A similar trend was also observed in relapse-free survival of the MGH cohort (P = 1.67 × 10⁻⁵). Adjusted hazard ratios computed for patients carrying at least one risk alleles with Cox models increased from 4.1 to 53.9 times risk of death and 2.1 to 20.4 times risk of recurrence in the MGH cohort, and 1.6 to 16.6 times risk of death in the Norwegian cohort, using those not carrying any risk allele as the referent (Table 3). Similar allele dose-response relationships were also shown in Kaplan-Meier curves (Fig 2). The 5-year survival rates for the patients with 0, 1 or 2, 3 or 4, and more than 4 risk alleles, respectively were 87.5%, 82.0%, 28.0%, and 11.1%, in the MGH cohort, and 60.0%, 51.7%, 0%, and 0% in the Norwegian cohort. Even within different cell types, the patients with more than two risk alleles consistently showed poor prognosis (Appendix Fig A1, online only).
Table 3.
Joint Effects of the Five Single Nucleotide Polymorphisms (rs10176669, rs4438452, rs12446308, rs13041757, and rs10517215) Validated in the Norwegian Cohort With Consistent Effect and q Value < 0.05
| No. of Risk Alleles | Massachusetts General Hospital Cohort |
Norwegian Cohort |
||||||||||||
|---|---|---|---|---|---|---|---|---|---|---|---|---|---|---|
| No. of Subjects* | Crude Mortality Rates per 100 Person-Years |
Adjusted Hazard Ratios† |
Crude Recurrence Rates per 100 Person-Years |
Adjusted Hazard Ratios† |
No. of Subjects* | Crude Mortality Rates per 100 Person-Years |
Adjusted Hazard Ratios† |
|||||||
| Value | 95% CI‡ | Value | 95% CI‡ | Value | 95% CI‡ | Value | 95% CI‡ | Value | 95% CI‡ | Value | 95% CI‡ | |||
| 0 | 13 | 1.43 | 0.20 to 10.15 | 1.0 | Referent | 5.06 | 1.63 to 15.69 | 1.0 | Referent | 9 | 5.80 | 1.87 to 17.99 | 1.0 | Referent |
| 1 | 27 | 4.23 | 1.76 to 10.17 | 4.06 | 0.52 to 31.84 | 11.16 | 6.01 to 20.75 | 2.09 | 0.60 to 7.31 | 32 | 7.19 | 4.26 to 12.14 | 1.56 | 0.47 to 5.16 |
| 2 | 15 | 8.77 | 4.18 to 18.39 | 15.72 | 7.49 to 32.98 | 25 | 14.34 | 8.78 to 23.40 | ||||||
| 3 | 17 | 16.28 | 8.76 to 30.27 | 14.50 | 1.88 to 112.02 | 15.00 | 6.74 to 33.39 | 3.69 | 0.97 to 13.99 | 7 | 131.32 | 62.60 to 275.46 | 11.51 | 3.00 to 44.10 |
| 4 | 6 | 31.45 | 14.13 to 70.01 | 32.24 | 12.10 to 85.91 | 6 | 40.09 | 18.01 to 89.23 | ||||||
| 5 | 3 | 75.52 | 24.36 to 234.15 | 53.93 | 6.44 to 451.63 | 73.34 | 18.34 to 293.27 | 20.36 | 4.21 to 98.54 | 1 | 53.40 | 7.52 to 379.09 | 16.56 | 2.87 to 95.47 |
| 6 | 5 | 38.09 | 15.86 to 91.52 | 44.43 | 11.11 to 177.67 | 1 | 126.82 | 17.86 to 900.35 | ||||||
| 7 | 1 | 69.97 | 9.86 to 496.74 | 139.94 | 19.71 to 993.49 | 1 | 102.31 | 14.41 to 726.33 | ||||||
Thirteen Massachusetts General Hospital patients and seven Norwegian patients were excluded because of the missing information in any of the five single nucleotide polymorphisms and four additional Massachusetts General Hospital patients were excluded from the analyses of relapse rate and relapse-free survival because of the missing information in non–small-cell lung cancer recurrence.
Adjusted for age (in a continuous scale), sex, clinical stage (IA, IB, IIA, and IIB as ordinal), smoking pack-years (in a continuous scale) and cell types (squamous cell carcinoma v adenocarcinoma).
Wald-type CI.
Fig 2.
Kaplan-Meier survival estimates of overall survival among the Massachusetts General Hospital (MGH) and Norwegian cohorts and relapse-free survival among the MGH cohort according to the numbers of risk alleles of the five single nucleotide polymorphisms (rs10176669, rs4438452, rs12446308, rs13041757, and rs10517215) in (A-C) total, (D-F) stage IA, (G-I) stage IB, and (J-L) stage II subjects.
DISCUSSION
Copy number gains in 3q, 5p, and 8q have been reported in previous studies of lung cancer.7,8 These CNV loci provide candidate regions for identification of novel oncogenes and the magnitude of these CNVs makes evident the need for combining both SNPs and CNVs in genome-wide analysis of tumor genome.
Ten SNPs, of which nine were located in six known genes, were validated in Norwegian cohort at significance level of 0.1. Of the six genes, STK39, PCDH7, and HTR3E had more than one SNP on the list of 10 validated SNPs. After adjusting for multiple comparisons with FDR of 0.05 as the cutoff, we still found five SNPs (rs10176669, rs4438452, rs12446308, rs13041757, and rs10517215) in the tumor genome to be significantly associated with the survival of early-stage NSCLC patients (P < .016) even after adjusting for the clinical covariates or copy number variations. The cumulative dosage effect of the five SNPs makes it a promising prognostic marker because it can use the number of risk alleles to predict overall survival and relapse-free survival of early-stage NSCLC patients on a finer scale. In contrast, the cumulative effect may imply certain biologic interactions that require further experimental investigations to define.
The five SNPs identified as significantly associated with survival were located within known genes: STK39, PCDH7, A2BP1, and EYA2. STK39 encodes a serine threonine kinase that specifically activates the p38 mitogen-activated protein kinase signaling pathway and is thought to play a role in cellular stress response.17 Its inactivation has also been shown to enhance cell to apoptosis.18 PCDH7 encodes an integral membrane protein that is believed to function in cell-cell recognition and adhesion,19 and its localization, 4p15, is a region of loss of heterozygosity in some head and neck squamous cell carcinomas.20 A2BP1 encodes a ribonucleoprotein motif that is highly conserved among RNA-binding proteins, which suggests an important basic function in development and differentiation.21,22 EYA2 encodes a transcriptional factor associated with apoptosis during development,23 and its upregulation has been shown to promote tumor growth and decrease overall survival in epithelial ovarian cancer.24
There are three SNPs with opposite effects on survival in the two cohorts. Similar conflicting findings have also been reported in disease risk studies of germline polymorphisms of COMT in schizophrenia25 and of NPSR1 in asthma.26 Such opposite associations, called the flip-flop phenomenon, have been explained by the difference in structures of linkage disequilibrium across different populations when the investigated variant is correlated with the causal variant.25 Moreover, because we studied somatic gene variations, it is possible that there may be considerably more of such phenomena. The dual and opposite role in life span by mechanisms of cellular senescence/aging and tumor suppression has also been shown in tumor suppressor genes p53 and p16INK4a.27,28 However, further investigation is needed to disentangle true but opposite associations from the chance associations.
The design of two independent cohorts for discovery set and validation set is one of our major strengths, which would largely reduce false positive findings from the whole genome scan. In contrast, restriction to early stage and two cell types in NSCLC makes the study population more homogenous, and long follow-up time increase the statistical power to detect a genetic effect on survival. Furthermore, complete clinical information enables us to adjust for potential confounding factors; and stringent histopathological criteria minimizes the misclassification of tumor and normal DNA preserving statistical power to detect the copy number variations and to identify the genetic variation specific to tumors.
We acknowledge several limitations in our study. First, the modest sample size of both cohorts does not have the optimal statistical power of discovering and validating the association, so false negative findings to a certain extent should be expected. It was noted that the most significant SNP, rs16931907, discovered in the MGH cohort (P = 2.01 × 10⁻¹¹), only showed marginal significance (P = .057 in univariate analysis and .16 in multivariate analysis) in the Norwegian cohort, which may reflect such a limitation. However, the sample size of this study is comparable with other genome-wide studies investigating the association of mRNA expression in tumor with NSCLC survival.10,11 Second, the analyses in “one-marker-at-a-time” fashion cannot capture the effect from a “repertoire” of numerous genetic variations, each of which contributes only mild effect singly. Thirdly, the discovery and validation cohorts were not similar as presented in Table 1, which would not provide the optimal efficiency in validating the findings. Among the 50 most significant SNPs discovered in the MGH cohort, 10 were validated at significance level of .1 using univariate Cox models; however, 13 SNPs were validated using multivariate analyses adjusting for age, sex, clinical stage, cell type, and smoking. Conversely, one could argue that the associations validated in the Norwegian cohort are of more value given the diversity between the two cohorts, which was also the case shown in previous studies.10,11 The five SNPs (rs10176669, rs4438452, rs12446308, rs13041757, and rs10517215) reported here were validated in both crude and adjusted analyses at significance level of .05. Finally, the two cohorts are mainly of white origin, which may limit the generalizability of our findings to other ethnicities.
We conclude that copy number increases in chromosomes 3q, 5p, and 8q were validated. Five SNPs in tumor were found to be significantly associated with the survival of early-stage NSCLC patients, and survival decreased with the number of the risk alleles. Larger studies are required to confirm effects of the five SNPs in other patient populations, and resequencing neighboring regions along with functional assessment will confirm the role of these tumor SNPs in NSCLC behavior.
Supplementary Material
Acknowledgment
We are indebted to the participants of Molecular and Genetic Analysis of Lung Cancer Study; to the Lung Cancer Study Group: Eugene Mark, MD, Matthew Kulke, MD, Wei Zhou, MD, PhD, Geoffrey Liu, MD, Marcia Chertok, Andrea Shafer, Lauren Cassidy, Maureen Convery, Salvatore Mucci; to Panos Fidias, MD, and Bruce A. Chabner, MD, and the physicians and surgeons of the Massachusetts General Hospital Cancer Center; to Lodve Stangeland, MD, Haukeland University Hospital, Norway for recruiting patients; to Els Goetghebeur, PhD, Deanne Taylor, PhD, Huanyu Zhou, PhD, and Shun-Chiao Chang of Harvard School of Public Health; to Chien-Ling Lin of University of Massachusetts Medical School for her advice on copy number analysis; and to Edward Cox, MD, and the Microarray Core Facility of Dana-Farber Cancer Institute.
Appendix
Demographic and Clinical Data Collection
Demographic and smoking information was collected by a trained research assistant using a modified standardized American Thoracic Society respiratory questionnaire (Zhou W, Heist RS, Liu G, et al: Clin Cancer Res 12:7187-7193, 2006) and the clinical information was collected via extensive chart review. A similar approach was used for the Norwegian validation set. Relapse-free and overall survival was calculated from time of surgery to time of documented recurrence and death, respectively.
Fig A1.
Kaplan-Meier survival estimates of overall survival among the Massachusetts General Hospital and Norwegian cohorts and relapse-free survival among the MGH cohort according to the numbers of risk alleles of the five single nucleotide polymorphisms (rs10176669, rs4438452, rs12446308, rs13041757, and rs10517215) in (A-C) adenocarcinoma and (D-F) squamous cell carcinoma.
Fig A2.
(A, B) Linkage disequilibrium structure of STK39 locating at 2q24.3. (C) The P values of the association of single nucleotide polymorphisms (SNPs) of A2BP1 around rs12446308 (16p13.3) with the overall survival and (D) the corresponding linkage disequilibrium (LD) structure. (E) The P values and the (F) LD plot of EYA2 around rs13041757 (20q13.1). (G, H) SNPs of PCDH7 around rs10517215 and rs1374653 (4p15). (A, C, E, G) The red points represent P < .01, whereas blue points represent P ≥ .01. (B, D, F, H) Boxe are shaded according to the standardized disequilibrium coefficient and the numbers in the boxes represent the disequilibrium coefficient, D', where the empty boxes mean the D' = 1.
Table A1.
Distribution of Genotypes in Tumor Genome and Blood or Noninvolved Tissue Genome in 20 Pairs of Blood and Tumor DNA in Massachusetts General Hospital Cohort and 19 Pairs of Noninvolved Tissue and Tumor DNA
| Tissue | Single Nucleotide Polymorphisms |
P* | |||||
|---|---|---|---|---|---|---|---|
| AA |
AB |
BB |
|||||
| No. | % | No. | % | No. | % | ||
| Lung tumor | 3,785,272 | 39.71 | 2,167,107 | 22.73 | 3,580,231 | 37.56 | < 10−16 |
| Blood or noninvolved | 3,729,068 | 38.04 | 2,517,673 | 25.68 | 3,556,211 | 36.28 | |
P value was derived from χ2 test with 2 df.
Footnotes
Supported by Grants No. CA092824 (D.C.C.), CA074386 (D.C.C.), and CA090578 (D.C.C.) and funding (X.L.) from the National Institutes of Health; and the Norwegian Cancer Society (V.S., A.H.).
Authors' disclosures of potential conflicts of interest and author contributions are found at the end of this article.
AUTHORS' DISCLOSURES OF POTENTIAL CONFLICTS OF INTEREST
The author(s) indicated no potential conflicts of interest.
AUTHOR CONTRIBUTIONS
Conception and design: Yen-Tsung Huang, Rebecca S. Heist, Xihong Lin, Zhaoxi Wang, David C. Christiani
Financial support: David C. Christiani
Administrative support: David C. Christiani
Provision of study materials or patients: Yen-Tsung Huang, Rebecca S. Heist, Vidar Skaug, Aage Haugen, Li Su, David C. Christiani
Collection and assembly of data: Yen-Tsung Huang, Rebecca S. Heist, Lucian R. Chirieac, Vidar Skaug, Aage Haugen, Kofi Asomaning, David C. Christiani
Data analysis and interpretation: Yen-Tsung Huang, Rebecca S. Heist, Lucian R. Chirieac, Xihong Lin, Vidar Skaug, Michael C. Wu, Zhaoxi Wang, David C. Christiani
Manuscript writing: Yen-Tsung Huang, Rebecca S. Heist, Lucian R. Chirieac, Xihong Lin, Vidar Skaug, Michael C. Wu, Zhaoxi Wang, Li Su, Kofi Asomaning, David C. Christiani
Final approval of manuscript: Yen-Tsung Huang, Rebecca S. Heist, Lucian R. Chirieac, Xihong Lin, Vidar Skaug, Aage Haugen, Michael C. Wu, Zhaoxi Wang, Li Su, Kofi Asomaning, David C. Christiani
REFERENCES
- 1.Jemal A, Siegel R, Ward E, et al. Cancer statistics, 2007. CA Cancer J Clin. 2007;57:43–66. doi: 10.3322/canjclin.57.1.43. [DOI] [PubMed] [Google Scholar]
- 2.Govindan R, Page N, Morgensztern D, et al. Changing epidemiology of small-cell lung cancer in the United States over the last 30 years: Analysis of the surveillance, epidemiologic, and end results database. J Clin Oncol. 2006;24:4539–4544. doi: 10.1200/JCO.2005.04.4859. [DOI] [PubMed] [Google Scholar]
- 3.Hoffman PC, Mauer AM, Vokes EE. Lung cancer. Lancet. 2000;355:479–485. doi: 10.1016/S0140-6736(00)82038-3. [DOI] [PubMed] [Google Scholar]
- 4.Hung RJ, McKay JD, Gaborieau V, et al. A susceptibility locus for lung cancer maps to nicotinic acetylcholine receptor subunit genes on 15q25. Nature. 2008;452:633–637. doi: 10.1038/nature06885. [DOI] [PubMed] [Google Scholar]
- 5.Amos CI, Wu X, Broderick P, et al. Genome-wide association scan of tag SNPs identifies a susceptibility locus for lung cancer at 15q25.1. Nat Genet. 2008;40:616–622. doi: 10.1038/ng.109. [DOI] [PMC free article] [PubMed] [Google Scholar]
- 6.Ninomiya H, Nomura K, Satoh Y, et al. Genetic instability in lung cancer: Concurrent analysis of chromosomal, mini- and microsatellite instability and loss of heterozygosity. Br J Cancer. 2006;94:1485–1491. doi: 10.1038/sj.bjc.6603121. [DOI] [PMC free article] [PubMed] [Google Scholar]
- 7.Kim TM, Yim SH, Lee JS, et al. Genome-wide screening of genomic alterations and their clinicopathologic implications in non-small cell lung cancers. Clin Cancer Res. 2005;11:8235–8242. doi: 10.1158/1078-0432.CCR-05-1157. [DOI] [PubMed] [Google Scholar]
- 8.Weir BA, Woo MS, Getz G, et al. Characterizing the cancer genome in lung adenocarcinoma. Nature. 2007;450:893–898. doi: 10.1038/nature06358. [DOI] [PMC free article] [PubMed] [Google Scholar]
- 9.Kim MY, Yim SH, Kwon MS, et al. Recurrent genomic alterations with impact on survival in colorectal cancer identified by genome-wide array comparative genomic hybridization. Gastroenterology. 2006;131:1913–1924. doi: 10.1053/j.gastro.2006.10.021. [DOI] [PubMed] [Google Scholar]
- 10.Potti A, Mukherjee S, Petersen R, et al. A genomic strategy to refine prognosis in early-stage non-small-cell lung cancer. N Engl J Med. 2006;355:570–580. doi: 10.1056/NEJMoa060467. [DOI] [PubMed] [Google Scholar]
- 11.Chen HY, Yu SL, Chen CH, et al. A five-gene signature and clinical outcome in non-small-cell lung cancer. N Engl J Med. 2007;356:11–20. doi: 10.1056/NEJMoa060096. [DOI] [PubMed] [Google Scholar]
- 12.Torring N, Borre M, Sorensen KD, et al. Genome-wide analysis of allelic imbalance in prostate cancer using the Affymetrix 50K SNP mapping array. Br J Cancer. 2007;96:499–506. doi: 10.1038/sj.bjc.6603476. [DOI] [PMC free article] [PubMed] [Google Scholar]
- 13.Lai LA, Paulson TG, Li X, et al. Increasing genomic instability during premalignant neoplastic progression revealed through high resolution array-CGH. Genes Chromosomes Cancer. 2007;46:532–542. doi: 10.1002/gcc.20435. [DOI] [PubMed] [Google Scholar]
- 14.Koed K, Wiuf C, Christensen LL, et al. High-density single nucleotide polymorphism array defines novel stage and location-dependent allelic imbalances in human bladder tumors. Cancer Res. 2005;65:34–45. [PubMed] [Google Scholar]
- 15.Zhao X, Li C, Paez JG, et al. An integrated view of copy number and allelic alterations in the cancer genome using single nucleotide polymorphism arrays. Cancer Res. 2004;64:3060–3071. doi: 10.1158/0008-5472.can-03-3308. [DOI] [PubMed] [Google Scholar]
- 16.Benjamini Y, Hochberg Y. Controlling the false discovery rate: A practical and powerful approach to multiple testing. J Roy Statist Soc Ser B. 1995;57:289–300. [Google Scholar]
- 17.Johnston AM, Naselli G, Gonez LJ, et al. SPAK, a STE20/SPS1-related kinase that activates the p38 pathway. Oncogene. 2000;19:4290–4297. doi: 10.1038/sj.onc.1203784. [DOI] [PubMed] [Google Scholar]
- 18.Polek TC, Talpaz M, Spivak-Kroizman TR. TRAIL-induced cleavage and inactivation of SPAK sensitizes cells to apoptosis. Biochem Biophys Res Commun. 2006;349:1016–1024. doi: 10.1016/j.bbrc.2006.08.118. [DOI] [PubMed] [Google Scholar]
- 19.Yoshida K. Fibroblast cell shape and adhesion in vitro is altered by overexpression of the 7a and 7b isoforms of protocadherin 7, but not the 7c isoform. Cell Mol Biol Lett. 2003;8:735–741. [PubMed] [Google Scholar]
- 20.Yoshida K, Yoshitomo-Nakagawa K, Seki N, et al. Cloning, expression analysis, and chromosomal localization of BH-protocadherin (PCDH7), a novel member of the cadherin superfamily. Genomics. 1998;49:458–461. doi: 10.1006/geno.1998.5271. [DOI] [PubMed] [Google Scholar]
- 21.Shibata H, Huynh DP, Pulst SM. A novel protein with RNA-binding motifs interacts with ataxin-2. Hum Mol Genet. 2000;9:1303–1313. doi: 10.1093/hmg/9.9.1303. [DOI] [PubMed] [Google Scholar]
- 22.Kiehl TR, Shibata H, Vo T, et al. Identification and expression of a mouse ortholog of A2BP1. Mamm Genome. 2001;12:595–601. doi: 10.1007/s00335-001-2056-4. [DOI] [PubMed] [Google Scholar]
- 23.Clark SW, Fee BE, Cleveland JL. Misexpression of the eyes absent family triggers the apoptotic program. J Biol Chem. 2002;277:3560–3567. doi: 10.1074/jbc.M108410200. [DOI] [PubMed] [Google Scholar]
- 24.Zhang L, Yang N, Huang J, et al. Transcriptional coactivator Drosophila eyes absent homologue 2 is up-regulated in epithelial ovarian cancer and promotes tumor growth. Cancer Res. 2005;65:925–932. [PubMed] [Google Scholar]
- 25.Lin PI, Vance JM, Pericak-Vance MA, et al. No gene is an island: The flip-flop phenomenon. Am J Hum Genet. 2007;80:531–538. doi: 10.1086/512133. [DOI] [PMC free article] [PubMed] [Google Scholar]
- 26.Hersh CP, Raby BA, Soto-Quiros ME, et al. Comprehensive testing of positionally cloned asthma genes in two populations. Am J Respir Crit Care Med. 2007;176:849–857. doi: 10.1164/rccm.200704-592OC. [DOI] [PMC free article] [PubMed] [Google Scholar]
- 27.Tyner SD, Venkatachalam S, Choi J, et al. p53 mutant mice that display early ageing-associated phenotypes. Nature. 2002;415:45–53. doi: 10.1038/415045a. [DOI] [PubMed] [Google Scholar]
- 28.Beausejour CM, Campisi J. Ageing: Balancing regeneration and cancer. Nature. 2006;443:404–405. doi: 10.1038/nature05221. [DOI] [PubMed] [Google Scholar]
Associated Data
This section collects any data citations, data availability statements, or supplementary materials included in this article.


