

Abstract
Differentiation of 3T3-L1 cells into adipocytes involves a highly orchestrated series of events including clonal expansion, growth arrest, and terminal differentiation. The mechanisms coordinating these different steps are not yet fully understood. Here we investigated whether microRNAs (miRNAs) play a role in this process. Microarray analysis was performed to detect miRNA expression during 3T3-L1 preadipocyte differentiation. Several miRNAs, including let-7, were up-regulated during 3T3-L1 adipogenesis. Ectopic introduction of let-7 into 3T3-L1 cells inhibited clonal expansion as well as terminal differentiation. The mRNA encoding high-mobility group AT-hook 2 (HMGA2), a transcription factor that regulates growth and proliferation in other contexts, was inversely correlated with let-7 levels during 3T3-L1 cell adipogenesis, and let-7 markedly reduced HMGA2 concentrations. Knockdown of HMGA2 inhibited 3T3-L1 differentiation. These results suggest that let-7 plays an important role in adipocyte differentiation and that it does so in part by targeting HMGA2, thereby regulating the transition from clonal expansion to terminal differentiation.
A survey of microRNAs expressed during adipogenesis reveals let-7 as a key governor of adipocyte differentiation through its reciprocal regulation of the transcription factor HMGA2.
The mouse 3T3-L1 preadipocyte cell line has been used extensively to dissect the molecular mechanisms underlying adipocyte differentiation (1). After reaching confluence, 3T3-L1 cells undergo growth arrest due to contact inhibition. In response to a standard cocktail of hormones, including insulin, cAMP analogs, and glucocorticoids, the cells reenter the cell cycle for several additional rounds of division. This period of clonal expansion is followed by cell cycle exit and terminal differentiation into mature adipocytes (2,3). The timing of this differentiation process is controlled to a large extent by an elaborate transcriptional cascade involving peroxisome proliferator-activated receptor-γ (PPARγ), CCAAT enhancer-binding protein-α (C/EBPα), C/EBPβ, and C/EBPδ, and E2F transcription factor-1 (E2F1) and -4 (E2F4), among others (3,4).
MicroRNAs (miRNAs) are endogenous, noncoding RNAs generally 20–24 nucleotides in length that play important roles in many physiological processes including growth, differentiation, and development (5). miRNAs function by binding to the 3′ untranslated regions of target mRNAs, thereby repressing their translation and/or promoting their decay (6). Several groups have examined the expression of miRNAs during adipocyte differentiation. In experiments performed with human preadipocytes, Esau et al. (7) showed that the miRNA miR-143 is induced during differentiation and that its inhibition with antisense oligonucleotides blocked differentiation. In a subsequent survey experiment, Kajimoto et al. (8) cloned 65 miRNAs from pre- and postdifferentiated 3T3-L1 cells and showed that 21 miRNAs were either up- or down-regulated during differentiation. Finally, using a microarray approach, Wang et al. (9) recently identified members of the miR-17-92 cluster of miRNAs as up-regulated during 3T3-L1 preadipocyte differentiation and showed that overexpression of the miR-17-92 cluster accelerated adipocyte differentiation. Taken together, these studies indicate that miRNAs may play a prominent role in regulating adipogenesis.
In this study, we have used a microarray strategy to comprehensively assess miRNA expression during 3T3-L1 cell differentiation. We demonstrate regulation of several miRNAs including let-7, which is known to regulate proliferation and differentiation processes in species ranging from Caenorhabditis elegans to man (10,11). Evidence is presented that let-7 contributes to adipogenesis by governing the transition from clonal expansion to terminal differentiation.
Results
Expression of let-7 and other miRNAs during adipogenesis
To investigate whether miRNAs are involved in adipocyte differentiation, we examined the expression of 386 miRNAs during 3T3-L1 differentiation using microarray analysis. Postconfluent 3T3-L1 cells were induced to differentiate using a cocktail of dexamethasone, 3-isobutyl-1-methylxanthine, and insulin (DMI). RNA was prepared from cells at 0, 1, 4, and 7 d after adipogenic induction (Fig. 1A), and small RNAs were purified for use in microarray analysis (Fig. 1B). Among the 386 miRNAs examined, 23 were either increased or decreased more than 1.5-fold during 3T3-L1 differentiation (Fig. 1B). Induction of several of these, including let-7, miR-103, miR-143, miR-193, and miR-210, was confirmed by Northern blot analysis (Fig. 1C). The expression of all these miRNAs was up-regulated after 2 d differentiation and maintained at a high level in mature adipocytes. Consistent with our in vitro findings, let-7, miR-103, miR-143, miR-193, and miR-210 were all expressed in murine white adipose tissue (Fig. 1D). Additional profiling studies revealed that each of these miRNAs was expressed in multiple tissues including brown adipose tissue (Fig. 1D).
Figure 1.

Expression of miRNAs during 3T3-L1 adipogenesis. A, Lipid accumulation during 3T3-L1 cell differentiation into adipocytes was monitored by Oil Red O staining on the days shown (magnification, ×200). B, miRNAs were extracted from the cells shown in A and subjected to microarray analysis. Normalized log2 expression data of miRNAs that changed at least 1.5-fold during adipogenesis were plotted as a heat map (red, higher expression; green, lower expression relative to expression on d 0). C and D, Expression of a subset of miRNAs was surveyed further by Northern blot analysis at the time points indicated during 3T3-L1 cell differentiation (C) and in 10 different adult male mouse tissues (D). U6 small nuclear RNA was used as a loading control.
We chose to focus further experiments on let-7 given its recently established role in regulating cell fate decisions in C. elegans and Drosophila (10,12,13). Let-7 expression was increased in 3T3-L1 cells differentiated by treatment with either the DMI cocktail or the PPARγ agonist rosiglitazone (Fig. 2A). Using a third independent assay, let-7 levels were also increased during insulin-induced differentiation of 3T3-F442A cells into adipocytes (Fig. 2A). In agreement with these findings, let-7 was abundant in mature adipocytes isolated from mice but barely detectable in preadipocytes (Fig. 2B). Let-7 was not induced by DMI treatment of NIH3T3 cells, which do not differentiate into adipocytes, nor was it induced during differentiation of C2C12 cells into myotubes (Fig. 2C). These data show that let-7 induction is not invariably associated with either DMI treatment or differentiation processes.
Figure 2.

Expression of let-7 is specific to the adipogenic differentiation program. A, Postconfluent, preadipocyte cell lines were induced to differentiate by incubation with DMI or rosiglitazone (Rosi) (for 3T3-L1 cells) or with insulin (for 3T3-F442A cells). Northern blot analysis was performed at the indicated time points using a let-7a probe that detects both the precursor and mature miRNA. Relative levels of mature let-7 expression were obtained by normalizing the scanned densities of each band to the U6 loading control and are represented as fold changes compared with the level at d 0. B, Stromal vascular (SV) preadipocyte and mature adipocyte (Ad) cell fractions were isolated from adipose tissue of adult male mice and subjected to Northern blot analysis. Ethidium bromide staining of total RNA is shown as the loading control. C, C2C12 and NIH3T3 cells were induced to differentiate with a myocyte differentiation medium or with DMI, respectively. Northern blot analysis was performed as in A. D, Total RNA was isolated at the time points indicated during 3T3-L1 cell differentiation and individual subtypes of the let-7 family were quantified by RT-qPCR normalized for loading to U6 small nuclear RNA (from triplicate wells, ± sd).
There are several let-7 isoforms in the mouse genome that differ in only one to two nucleotides. Because these isoforms cannot be distinguished by Northern blot analysis, we quantified their levels by real-time quantitative PCR (RT-qPCR). Consistent with the microarray and Northern blot data presented above, the most abundant let-7 isoforms, including let-7a, let-7b, and let-7d, were all up-regulated during 3T3-L1 adipogenesis (Fig. 2D). Interestingly, with the exception of let-7b, all the let-7 isoforms decreased from d 0 to d 1 and then increased. We speculate that this transient dip in let-7 expression may be permissive for clonal expansion (see below).
Let-7 inhibits 3T3-L1 differentiation
To test whether let-7 plays a role in 3T3-L1 adipogenesis, pre-let-7a oligonucleotide was transfected into 3T3-L1 cells, where it was efficiently converted into mature let-7a as confirmed by Northern blot analysis (Fig. 3A). Introduction of ectopic let-7a in 3T3-L1 cells before DMI treatment inhibited their differentiation into adipocytes as measured by Oil Red O staining (Fig. 3B) and triglyceride content (Fig. 3C) on d 6 of differentiation. mRNA levels of PPARγ and C/EBPα, two transcription factors whose induction is important for adipocyte differentiation, were significantly lower in cells transfected with let-7a compared with cells transfected with control oligonucleotide (Fig. 3D). Likewise, mRNA levels of the mature adipocyte markers, fatty acid binding protein 4 (aP2), and adipsin, were decreased by let-7a transfection (Fig. 3D). In contrast, C/EBPβ and C/EBPδ, two genes whose expression is important during the early stages of adipogenesis, were not significantly affected by let-7a at the 6-d time point.
Figure 3.

Ectopic presence of let-7 inhibits 3T3-L1 adipogenesis. A, 3T3-L1 cells were transfected by electroporation with a control oligonucleotide, let-7a precursor oligonucleotide, or a GFP expression plasmid (to monitor transfection efficiency). RNA was isolated 24 h later, and Northern analysis was performed using a let-7a probe. The same membrane was reprobed for U6 expression as a loading control. B, After reaching confluency, transfected cells in A were incubated with (+) or without (−) DMI for 6 d and then stained with Oil Red O. Shown are representative wells of the cultured cells (top) and their magnification at ×200 (bottom). C, Triglyceride content of cells in B was measured by fluorescence as described in Materials and Methods (n = 6 ± sem; *, P < 0.01 vs. control oligo). RFU, Relative fluorescence units. D, Expression of various genes from cells in B was measured by RT-qPCR (n = 3 ± sem; *, P < 0.01 vs. control oligo).
Overexpression of let-7 impairs clonal expansion of 3T3-L1 cells
The treatment of 3T3-L1 cells with an adipogenic stimulus initiates a complex sequence of events including clonal expansion, cell cycle exit, and terminal differentiation (3). Because let-7 controls exit from the cell cycle in C. elegans and D. melanogaster (10,12,13), we postulated that its up-regulation on d 1 of adipogenesis might play an analogous role in promoting terminal differentiation of adipocytes. To test this hypothesis, 3T3-L1 cells were transfected with either let-7a or control oligonucleotides and then allowed to reach confluence, at which point the adipogenic program was initiated with the DMI cocktail. As shown in Fig. 4A, proliferation as measured by bromodeoxyuridine (BrdU) incorporation was reduced in cells transfected with let-7a compared with control oligonucleotide, and there was a corresponding decrease in cell number (Fig. 4B). Let-7a transfection increased the fraction of cells in the G0/G1 phase while decreasing the fraction in S phase (Fig. 4C), indicating that let-7 causes cell cycle delay. Furthermore, several cell cycle genes including cyclin A2, cyclin B1, cyclin D1 and D2, cyclin E2, cdk4, and pcna were down-regulated by let-7 at the mRNA level (Fig. 4D). These data support a role for let-7 in blocking clonal expansion during adipogenesis.
Figure 4.

Ectopic presence of let-7 inhibits 3T3-L1 clonal expansion. A, BrdU incorporation assay of 3T3-L1 cells 24 h after control oligo or let-7a precursor transfection using Roche cell proliferation ELISA kit (n =10 ± sem; *, P < 0.01 vs. control oligo). B, 3T3-L1 cells transfected with a let-7a precursor or control oligonucleotide were incubated with DMI (d 1), and cell growth was monitored for 3 d (n = 3 ± sem; *, P < 0.01 vs. control oligo). C, Cell cycle analysis of 3T3-L1 cells using flow cytometry 24 h after control oligo or let-7a precursor transfection (n = 3 ± sem; *, P < 0.01 vs. control oligo). D, Expression of cell cycle genes from 3T3-L1 cells transfected with let-7a precursor or control oligo was measured by RT-qPCR. Cyclophilin was used as a reference gene (n = 3 ± sem; *, P < 0.05 vs. control oligo).
Let-7 may regulate clonal expansion and differentiation by targeting HMGA2
In an effort to identify genes through which let-7 mediates its effect on adipocyte differentiation, microarray analysis was performed using mRNA prepared from 3T3-L1 cells harvested 24 h after transfection with either let-7a or control oligonucleotide. Genes whose expression was down-regulated more than 2-fold by let-7a are listed in Table 1. Several of these genes, including Hmga2, E2f6, Cdc34, and Igf2bp1, have been previously shown to be targets of let-7 (14,15,16,17).
Table 1.
Genes down-regulated by let-7 in 3T3-L1 cells
| Gene | Accession no. | Fold changes |
|---|---|---|
| Hmga2 | NM_010441 | −3.58 |
| Isg15 | NM_015783 | −3.28 |
| Nfib | NM_001113209 | −2.78 |
| Nme4 | NM_019731 | −2.70 |
| Stat1 | NM_009283 | −2.65 |
| Parp12 | NM_172893 | −2.65 |
| Usp18 | NM_011909 | −2.64 |
| Rnf213 | NM_001040005 | −2.62 |
| Iigp2 | NM_019440 | −2.61 |
| Apol9a | XM_128064 | −2.60 |
| Mx2 | NM_013606 | −2.56 |
| Vstm2a | NM_145967 | −2.54 |
| Cdsn | NM_001008424 | −2.48 |
| Lgals3bp | NM_011150 | −2.25 |
| Apol9b | NM_173743 | −2.21 |
| Arhgap20 | NM_175535 | −2.20 |
| Irgm | NM_008326 | −2.18 |
| Igtp | NM_018738 | −2.17 |
| Ube1l | NM_023738 | −2.17 |
| Samd9l | XM_620286 | −2.17 |
| E2f6 | NM_033270 | −2.15 |
| Ai606181 | XR_035116 | −2.11 |
| Cdc34 | NM_177613 | −2.09 |
| Plagl2 | NM_018807 | −2.07 |
| Igf2bp1 | NM_009951 | −2.00 |
Total RNA was extracted from 3T3-L1 cells transfected with let-7 precursor or control oligonucleotides and analyzed 24 h after transfection using a mouse gene expression microarray. Changes of 2-fold or greater are shown.
Hmga2 was the gene whose expression was most affected by let-7a in 3T3-L1 cells (Table 1). Notably, mice lacking HMGA2 have a striking reduction in adipose tissue (18). Conversely, transgenic overexpression of a truncated HMGA2 in mice resulted in a marked increase in fat tissue, adipose tissue inflammation, and a high incidence of lipomas (19,20). Thus, HMGA2 was a strong candidate for being a let-7 target in differentiating adipocytes. In agreement with the microarray data, ectopic let-7 reduced HMGA2 protein concentrations more than 3-fold in 3T3-L1 cells (Fig. 5A). Interestingly, Hmga2 mRNA was rapidly induced in 3T3-L1 cells during adipocyte differentiation, with levels peaking 4 h after treatment with the DMI cocktail and returning to basal concentrations on d 2 (Fig. 5B). There was a subsequent increase in HMGA2 protein concentrations, with levels peaking at d 2 (Fig. 5C). HMGA2 and let-7 expression were inversely correlated during adipocyte differentiation (compare Fig. 2A, left panel, with Fig. 5, A and B). Finally, small interfering RNA (siRNA) knockdown of HMGA2 inhibited 3T3-L1 differentiation as measured by Ap2 and Pparγ mRNA levels (Fig. 5D). Taken together, these results strongly suggest that let-7 regulates 3T3-L1 differentiation in part by targeting HMGA2.
Figure 5.
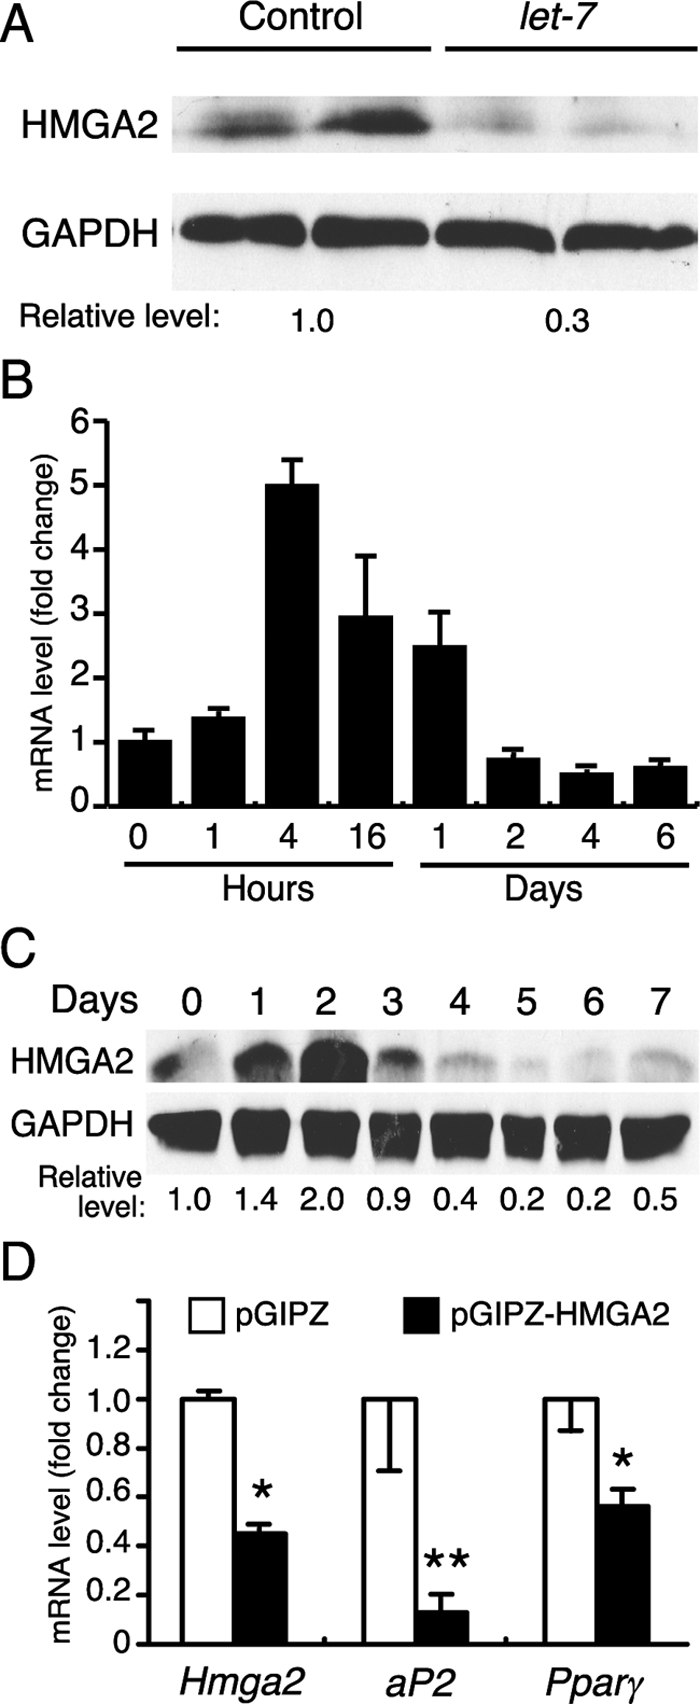
Let-7 regulates adipogenesis by decreasing HMGA2 expression. A, HMGA2 protein levels in 3T3-L1 cells were assayed by Western blot analysis 48 h after transfection with a let-7a precursor or control oligonucleotide. GAPDH is shown as a loading control. B, Hmga2 mRNA levels were evaluated by RT-qPCR at the indicated time points after treatment of 3T3-L1 cells with DMI (shown are data from triplicate samples ± sd). C, HMGA2 protein levels were evaluated by Western blot analysis at the indicated time points after treatment of 3T3-L1 cells with DMI. D, mRNA expression of various adipogenic genes was assayed by RT-qPCR in differentiated 3T3-L1 adipocytes that were treated with siRNAs for Hmga2 or a control sequence (n = 3 ± sem; *, P < 0.05; **, P < 0.01). Hmga2 levels were monitored 24 h after siRNA transfection and aP2 and Pparγ levels were monitored at 6 d after siRNA transfection and incubation with DMI.
In complementary studies, we also examined Hmga2 expression during 3T3-F442A cell differentiation. A marked induction of Hmga2 mRNA occurred within 12 h of insulin treatment followed by a slow return to baseline levels at d 5 (supplemental Fig. S1, published as supplemental data on The Endocrine Society’s Journals Online web site at http://mend.endojournals.org). Thus, as in 3T3-L1 cells, Hmga2 and let-7 expression (Fig. 2) are inversely correlated. Transfection of 3T3-F442A cells with let-7 oligonucleotide before insulin induction blunted adipocyte differentiation as measured by reduced expression of Pparg and aP2 (supplemental Fig. S1). Although the expression of other adipocyte marker genes including C/ebpα, -β, and -δ and adipsin were not significantly changed, we note that the efficiency with which 3T3-F442A cells were transfected with let-7 oligonucleotide was low compared with 3T3-L1 cells (data not shown). Overall, these data lend further support to the importance of the let-7/Hmga2 interaction during preadipocyte differentiation.
Discussion
The differentiation of preadipocytes into mature fat cells requires a highly orchestrated series of changes in gene expression. Although a transcription factor cascade has been identified that regulates adipocyte differentiation, the molecular mechanisms that coordinate the different phases of adipogenesis are not yet completely understood. In this report, we have identified the miRNA let-7 as an important regulator of adipogenesis in 3T3-L1 cells. Let-7 is up-regulated after induction of adipogenesis by either the standard DMI cocktail or the combination of rosiglitazone and insulin. Consistent with these in vitro findings, let-7 is much more abundant in mature adipocytes than preadipocytes derived from mouse epididymal adipose. Notably, introduction of ectopic let-7 blocks 3T3-L1 cell growth and completely inhibits terminal differentiation as measured by lipid accumulation and marker genes.
How does let-7 block adipocyte differentiation? Our results demonstrate that let-7 blocks 3T3-L1 differentiation at the clonal expansion stage. This finding is consistent with previous reports showing that let-7 represses cell proliferation in cancer cell lines (14,21). In microarray experiments performed with RNA from 3T3-L1 cells transfected with let-7a, Hmga2 was the most strongly down-regulated RNA, and there was a corresponding decrease in HMGA2 protein concentrations. Previous studies have demonstrated that let-7 represses HMGA2 expression by binding to six different sites in the Hmga2 3′-untranslated region (16). HMGA2 is an architectural transcription factor that alters chromatin structure. Rearrangements of the HMGA2 gene are frequently observed in benign tumors of mesenchymal origin, including lipomas (22,23). Interestingly, both gain-of-function and loss-of-function experiments in mice implicate HMGA2 in adipogenesis. Mice lacking HMGA2 have marked reductions in adipose tissue (18). Conversely, transgenic mice overexpressing either full-length or truncated derivatives of HMGA2 develop lipomatosis (19,20,24). These findings, together with our data showing that siRNA-mediated knockdown of HMGA2 blocks 3T3-L1 adipogenesis, suggest that HMGA2 is an important target for the effects of let-7 on adipocyte differentiation. However, because let-7 regulates numerous genes, its effects on adipocyte differentiation are likely to be complex and involve regulation of additional genes. In this regard, it is interesting that let-7 reduced the mRNA levels of E2f6 and Stat1. Other members of the E2F family are known to regulate adipogenesis (4), and Stat1 has been shown to be up-regulated during adipogenesis and to regulate gene expression in mature adipocytes (25,26,27).
The regulation of miRNA expression during adipocyte differentiation has been examined by several groups. In a survey of miRNA regulation during 3T3-L1 cell differentiation, Kajimoto et al. (8) observed increased expression of the let-7b isoform, which was robustly induced in our study. In a study of human adipocyte differentiation, Esau et al. (7) saw increased expression of let-7a and let-7c. These findings support a role for let-7 in regulating fat cell differentiation in both humans and mice. Surprisingly, there is relatively little overlap in the miRNAs regulated in our study and that of Kajimoto et al. with only let-7b, miR-143, miR-182, and miR-422b showing similar patterns. The basis for this difference is not known, but it does not appear to be due to marked differences in the differentiation protocols.
Although we were able to observe a strong gain-of-function phenotype in 3T3-L1 adipocytes with let-7a, we did not observe a reciprocal phenotype in knockdown experiments performed with 2′-O-methyl oligoribonucleotide inhibitors against the various let-7 isoforms (data not shown). Functional redundancy among miRNAs is well documented (28), and thus the presence of many let-7 isoforms is a likely explanation for the lack of an effect we seen in these experiments. In this regard, we note that transfection of let-7b had the same effect as let-7a on 3T3-L1 cell differentiation (data not shown).
In summary, we provide evidence that let-7 regulates adipocyte differentiation. We propose that let-7 does this in part by targeting the transcription factor HMGA2, thereby promoting the transition of preadipocytes from clonal expansion to terminal differentiation (Fig. 6). The role of let-7 in mediating this transition switch is reminiscent of its developmental role in C. elegans, where let-7 regulates the transition from the larva to adult (10,11). Our findings suggest that let-7 may have important implications in obesity and other forms of metabolic disease in which there are alterations in the amount and/or function of adipose tissue.
Figure 6.

Schematic model of let-7 and HMGA2 regulation during 3T3-L1 adipogenesis. Induction of adipocyte differentiation by DMI initially results in cell growth and clonal expansion that requires HMGA2 expression. Further stimulation of these cells by insulin results in a let-7-dependent decrease in HMGA2 expression, which in turn leads to growth arrest and terminal differentiation.
Materials and Methods
Cell culture and differentiation
3T3-L1 cells were cultured in a 5% CO2 humidified atmosphere in DMEM/high glucose with l-glutamine (Invitrogen, Carlsbad, CA) supplemented with 10% fetal bovine serum (FBS), 100 U/ml penicillin, and 100 mg/ml streptomycin. For DMI differentiation, 1 μm dexamethasone, 0.5 mm 3-isobutyl-1-methylxanthine, and 5 μg/ml insulin were added to the culture medium 2 d after the cells reached confluence. After 48 h, the culture medium was replaced with DMEM containing 10% FBS and 5 μg/ml insulin. The culture medium was replaced every 48 h until the preadipocytes differentiated into mature adipocytes. For differentiation with rosiglitazone, confluent 3T3-L1 preadipocytes were cultured in DMEM supplemented with 10% FBS and 5 μm rosiglitazone. Medium was replaced every 48 h. For 3T3-F442A differentiation, confluent cells were cultured in DMEM/high glucose with 10% FBS, and differentiation induced with DMEM/high glucose supplemented with 10% FBS and 5 μg/ml insulin. For C2C12 differentiation, confluent myoblasts were cultured in DMEM supplemented with 20% FBS, and differentiation was induced by subsequently culturing the cells in DMEM supplemented with 2% horse serum.
Northern blot analysis
Each sample, consisting of 10 μg total RNA in 2 × sample loading buffer, was incubated at 65 C for 10 min, chilled on ice for 3 min, and loaded on a 15% polyacrylamide gel containing 7 m urea (Invitrogen). Electrophoresis was performed at 250 V for 1 h in 1× Tris-borate-EDTA buffer. RNA was transferred onto Hybond N+ membrane (Amersham Biosciences, Piscataway, NJ) at 20 V for 45 min in 0.5× Tris-borate-EDTA. RNA was cross-linked to the membrane with a UV-linker. Starfire probes for each miRNA were labeled with [α-32P]dATP (Amersham) using the Starfire kit (IDT, Coralville, IA). Labeled probe was separated from free [α-32P]dATP using Sephadex G-25 columns (Roche, Indianapolis, IN). Hybridization was done at 45 C in 0.2 m Na2HPO4, 7% sodium dodecyl sulfate buffer overnight. Membranes were washed with 2× standard saline citrate/0.1% sodium dodecyl sulfate twice and exposed to x-ray film. Ethidium bromide staining or U6 blotting were used as loading controls.
RT-qPCR
Extraction and quantitation of mRNA levels by RT-qPCR was performed as described using an ABI 7900HT sequence detection system and the SYBR green assay (29). The following primers were used for quantitative real-time PCR (30,31): C/EBPα, gacatcagcgcctacatcga (forward) and tcggctgtgctggaagag (reverse); C/EBPβ, atttctatgagaaaagaggcgtatgt (forward) and aaatgtcttcactttaatgctcgaa (reverse); C/EBPδ, ttccaaccccttccctgat (forward) and ctggagggtttgtgttttctgt (reverse); Adipsin, aggacgacctcattctttttaagc (forward) and acttctttgtcctcgtattgcaa (reverse); aP2, gcctgccactttccttgtg (forward) and gacatcagcgcctacatcga (reverse); PPARγ, caagaataccaaagtgcgatcaa (forward) and gagctgggtcttttcagaataataag (reverse); CyclinA2, ttccacttggctctctacacagt (forward) and ccagtctgttgtgccaatga (reverse); CyclinB1, tggcgctcagggtcacta (forward) and cgcctgccatactgacctt (reverse); CyclinD1, gccgagaagttgtgcatctaca (forward) and tgttcaccagaagcagttccatt (reverse); CyclinD2, cgtacatgcgcaggatggt (forward) and aattcatggccagaggaaagac (reverse); CyclinE2, caccaagaagcatcagtatgagatt (forward) and gggctgattcctccagaca (reverse); Cdk4, cctgccggttgagaccat (forward) and agaaaatccaggccgcttag (reverse); Pcna, cgaaggcttcgacacatacc (forward) and ggacatgctggtgaggttca (reverse); and Hmga2, aacctgtgagccctctcctaag (forward) and gccgtttttctccaatggtc (reverse).
miRNA concentrations were measured by RT-qPCR using the TaqMan MicroRNA Assay Kit (Applied Biosystems, Foster City, CA). miRNAs were reverse transcribed using miRNA-specific primers and RT-qPCR with TaqMan probes was done to detect mature miRNAs. Reverse transcription and RT-qPCR were done according to the manufacturer’s instructions with U6 as a loading control. U6 primers and probe were ctcgcttcggcagcaca (forward), aacgcttcacgaatttgcgt (reverse), and ctctgtatcgttccaattttagtat (probe).
Microarray
For miRNA microarray, miRNAs were isolated from total RNA using a FlashPAGE fractionator (Ambion, Austin, TX). Total RNA (100 μg) was loaded onto FlashPAGE precast gels and small size RNAs collected after electrophoresis at 80 V for 12 min. Small size RNA was purified using the FlashPAGE Reaction Clean Up Kit (Ambion). Small size RNA (1 μg) was used for microarray on a custom slide containing 386 probes for human, mouse, and rat miRNAs from the mirVana miRNA Probe Set (Ambion). Slides were scanned and analyzed using GeneTraffic software.
For mRNA microarray, Illumina Beadarrays (Illumina, San Diego, CA) were used. Total RNA was extracted from 3T3-L1 cells 24 h after transfection with either let-7 or control oligonucleotides.
Western blot analysis
3T3-L1 cells were scraped, washed with PBS, and lysed with M-Per Mammalian Protein Extraction Reagent (Pierce, Rockford, IL). Proteins were separated by 15% SDS-PAGE and transferred to cellulose membranes. Membranes were immunoblotted with a 1:200 dilution of anti-HMAG2 rabbit antibody (Biocheck, Foster City, CA) followed by a 1:5000 dilution of antirabbit horseradish peroxidase secondary antibody. The same membrane was blotted with a 1:10,000 dilution of anti-GAPDH horseradish peroxidase-conjugated antibody (Sigma-Aldrich, St. Louis, MO) as a loading control.
Oil Red O staining
Oil Red O staining of 3T3-L1 cells was done as previously described (32). Briefly, cells were washed twice with PBS and fixed in 10% formaldehyde in PBS for 15 min. Cells were stained in fresh Oil Red O solution (60% Oil Red O stock solution consisting of 0.5% Oil Red O in isopropanol and 40% H2O) for at least 1 h. After staining, the cells were washed with 60% isopropanol and then with H2O.
Triglyceride content measurement
Triglyceride content in cells was measured using AdipoRed assay reagent (Cambrex, Walkersville, MD) according to the manufacturer’s instructions. Assays were performed in a 96-well format and fluorescence measured in a Victor 1420 Multilabel Counter (PerkinElmer, Waltham, MA) at an excitation wavelength of 485 nm and an emission wavelength of 572 nm.
BrdU incorporation assay
3T3-L1 cells were transfected with control oligo or let-7 precursor and cultured in a 96-well plate. At 24 h after transfection, BrdU was added to culture medium to a final concentration of 10 μm. After BrdU labeling for 2 h, medium was removed and BrdU incorporation was measured using the cell proliferation ELISA kit (Roche) and a 1:200 dilution of anti-BrdU-peroxidase conjugate antibody. Reactions were stopped with 1 m H2SO4 and absorbance measured at 450 nm.
Cell cycle analysis
3T3-L1 cells transfected with control or let-7 precursor oligonucleotides were cultured in six-well plates. Twenty-four hours later, cells were harvested and washed with PBS. Cells were fixed with cold 70% ethanol, stained in 50 μm propidium iodide, and subjected to cell cycle analysis using FACScan (Becton Dickinson, San Jose, CA). Results were analyzed using Flowjo software.
Transfection assays
3T3-L1 cells were trypsinized and pelleted at 90 × g for 10 min. Cell pellets were resuspended in 100 μl Nucleofector buffer (Nucleofector Kit V) (Amaxa Biosciences, Gaithersburg, MD) with 2 μg of either let-7 precursor (Ambion), control oligonucleotide, or expression plasmid. Nucleofection was performed using the Nucleofector I device (Amaxa Biosciences) and program T-30.
Supplementary Material
Acknowledgments
We thank Drs. Jinchun Zhou, Quan-Zhen Li, and the University of Texas Southwestern Microarray Core for microarray analysis and members of the Mango-Kliewer lab for critical comments.
Footnotes
This work was supported by National Institutes of Health Grant U19-DK062434 (D.J.M.), Robert A. Welch Foundation Grants I-1275 and I-1558 (to D.J.M. and S.A.K.), and the Howard Hughes Medical Institute (to D.J.M.). D.J.M. is an Investigator of the Howard Hughes Medical Institute.
Disclosure Summary: The authors have nothing to disclose.
First Published Online March 26, 2009
Abbreviations: BrdU, Bromodeoxyuridine; C/EBP, CCAAT enhancer-binding protein; DMI, dexamethasone, 3-isobutyl-1-methylxanthine, and insulin; E2F, E2F transcription factor; FBS, fetal bovine serum; miRNA, microRNA; PPARγ, peroxisome proliferator-activated receptor-γ; RT-qPCR, real-time quantitative PCR; siRNA, small interfering RNA.
References
- Green H, Meuth M 1974 An established pre-adipose cell line and its differentiation in culture. Cell 3:127–133 [DOI] [PubMed] [Google Scholar]
- Student AK, Hsu RY, Lane MD 1980 Induction of fatty acid synthetase synthesis in differentiating 3T3-L1 preadipocytes. J Biol Chem 255:4745–4750 [PubMed] [Google Scholar]
- Rosen ED, Spiegelman BM 2000 Molecular regulation of adipogenesis. Annu Rev Cell Dev Biol 16:145–171 [DOI] [PubMed] [Google Scholar]
- Fajas L, Landsberg RL, Huss-Garcia Y, Sardet C, Lees JA, Auwerx J 2002 E2Fs regulate adipocyte differentiation. Dev Cell 3:39–49 [DOI] [PubMed] [Google Scholar]
- Bushati N, Cohen SM 2007 microRNA functions. Annu Rev Cell Dev Biol 23:175–205 [DOI] [PubMed] [Google Scholar]
- Eulalio A, Huntzinger E, Izaurralde E 2008 Getting to the root of miRNA-mediated gene silencing. Cell 132:9–14 [DOI] [PubMed] [Google Scholar]
- Esau C, Kang X, Peralta E, Hanson E, Marcusson EG, Ravichandran LV, Sun Y, Koo S, Perera RJ, Jain R, Dean NM, Freier SM, Bennett CF, Lollo B, Griffey R 2004 MicroRNA-143 regulates adipocyte differentiation. J Biol Chem 279:52361–52365 [DOI] [PubMed] [Google Scholar]
- Kajimoto K, Naraba H, Iwai N 2006 MicroRNA and 3T3-L1 pre-adipocyte differentiation. RNA 12:1626–1632 [DOI] [PMC free article] [PubMed] [Google Scholar]
- Wang Q, Li YC, Wang J, Kong J, Qi Y, Quigg RJ, Li X 2008 miR-17-92 cluster accelerates adipocyte differentiation by negatively regulating tumor-suppressor Rb2/p130. Proc Natl Acad Sci USA 105:2889–2894 [DOI] [PMC free article] [PubMed] [Google Scholar]
- Reinhart BJ, Slack FJ, Basson M, Pasquinelli AE, Bettinger JC, Rougvie AE, Horvitz HR, Ruvkun G 2000 The 21-nucleotide let-7 RNA regulates developmental timing in Caenorhabditis elegans. Nature 403:901–906 [DOI] [PubMed] [Google Scholar]
- Johnson SM, Grosshans H, Shingara J, Byrom M, Jarvis R, Cheng A, Labourier E, Reinert KL, Brown D, Slack FJ 2005 RAS is regulated by the let-7 microRNA family. Cell 120:635–647 [DOI] [PubMed] [Google Scholar]
- Sokol NS, Xu P, Jan YN, Ambros V 2008 Drosophila let-7 microRNA is required for remodeling of the neuromusculature during metamorphosis. Genes Dev 22:1591–1596 [DOI] [PMC free article] [PubMed] [Google Scholar]
- Caygill EE, Johnston LA 2008 Temporal regulation of metamorphic processes in Drosophila by the let-7 and miR-125 heterochronic microRNAs. Curr Biol 18:943–950 [DOI] [PMC free article] [PubMed] [Google Scholar]
- Johnson CD, Esquela-Kerscher A, Stefani G, Byrom M, Kelnar K, Ovcharenko D, Wilson M, Wang X, Shelton J, Shingara J, Chin L, Brown D, Slack FJ 2007 The let-7 microRNA represses cell proliferation pathways in human cells. Cancer Res 67:7713–7722 [DOI] [PubMed] [Google Scholar]
- Boyerinas B, Park SM, Shomron N, Hedegaard MM, Vinther J, Andersen JS, Feig C, Xu J, Burge CB, Peter ME 2008 Identification of let-7-regulated oncofetal genes. Cancer Res 68:2587–2591 [DOI] [PubMed] [Google Scholar]
- Mayr C, Hemann MT, Bartel DP 2007 Disrupting the pairing between let-7 and Hmga2 enhances oncogenic transformation. Science 315:1576–1579 [DOI] [PMC free article] [PubMed] [Google Scholar]
- Lee YS, Dutta A 2007 The tumor suppressor microRNA let-7 represses the HMGA2 oncogene. Genes Dev 21:1025–1030 [DOI] [PMC free article] [PubMed] [Google Scholar]
- Zhou X, Benson KF, Ashar HR, Chada K 1995 Mutation responsible for the mouse pygmy phenotype in the developmentally regulated factor HMGI-C. Nature 376:771–774 [DOI] [PubMed] [Google Scholar]
- Arlotta P, Tai AK, Manfioletti G, Clifford C, Jay G, Ono SJ 2000 Transgenic mice expressing a truncated form of the high mobility group I-C protein develop adiposity and an abnormally high prevalence of lipomas. J Biol Chem 275:14394–14400 [DOI] [PubMed] [Google Scholar]
- Battista S, Fidanza V, Fedele M, Klein-Szanto AJ, Outwater E, Brunner H, Santoro M, Croce CM, Fusco A 1999 The expression of a truncated HMGI-C gene induces gigantism associated with lipomatosis. Cancer Res 59:4793–4797 [PubMed] [Google Scholar]
- Schultz J, Lorenz P, Gross G, Ibrahim S, Kunz M 2008 MicroRNA let-7b targets important cell cycle molecules in malignant melanoma cells and interferes with anchorage-independent growth. Cell Res 18:549–557 [DOI] [PubMed] [Google Scholar]
- Schoenmakers EF, Wanschura S, Mols R, Bullerdiek J, Van den Berghe H, Van de Ven WJ 1995 Recurrent rearrangements in the high mobility group protein gene, HMGI-C, in benign mesenchymal tumours. Nat Genet 10:436–444 [DOI] [PubMed] [Google Scholar]
- Ashar HR, Fejzo MS, Tkachenko A, Zhou X, Fletcher JA, Weremowicz S, Morton CC, Chada K 1995 Disruption of the architectural factor HMGI-C: DNA-binding AT hook motifs fused in lipomas to distinct transcriptional regulatory domains. Cell 82:57–65 [DOI] [PubMed] [Google Scholar]
- Fedele M, Battista S, Kenyon L, Baldassarre G, Fidanza V, Klein-Szanto AJ, Parlow AF, Visone R, Pierantoni GM, Outwater E, Santoro M, Croce CM, Fusco A 2002 Overexpression of the HMGA2 gene in transgenic mice leads to the onset of pituitary adenomas. Oncogene 21:3190–3198 [DOI] [PubMed] [Google Scholar]
- Stephens JM, Morrison RF, Pilch PF 1996 The expression and regulation of STATs during 3T3-L1 adipocyte differentiation. J Biol Chem 271:10441–10444 [DOI] [PubMed] [Google Scholar]
- Hogan JC, Stephens JM 2003 STAT 1 binds to the LPL promoter in vitro. Biochem Biophys Res Commun 307:350–354 [DOI] [PubMed] [Google Scholar]
- Hogan JC, Stephens JM 2001 The identification and characterization of a STAT 1 binding site in the PPARγ2 promoter. Biochem Biophys Res Commun 287:484–492 [DOI] [PubMed] [Google Scholar]
- Miska EA, Alvarez-Saavedra E, Abbott AL, Lau NC, Hellman AB, McGonagle SM, Bartel DP, Ambros VR, Horvitz HR 2007 Most Caenorhabditis elegans microRNAs are individually not essential for development or viability. PLoS Genet 3:e215 [DOI] [PMC free article] [PubMed] [Google Scholar]
- Bookout AL, Mangelsdorf DJ 2003 Quantitative real-time PCR protocol for analysis of nuclear receptor signaling pathways. Nucl Recept Signal 1:e012 [DOI] [PMC free article] [PubMed] [Google Scholar]
- Fu M, Sun T, Bookout AL, Downes M, Yu RT, Evans RM, Mangelsdorf DJ 2005 A nuclear receptor atlas: 3T3-L1 adipogenesis. Mol Endocrinol 19:2437–2450 [DOI] [PubMed] [Google Scholar]
- Lin HH, Xiong Y, Ho YS, Zhou B, Nguyen HV, Deng H, Lee R, Yen Y, Borok Z, Ann DK 2007 Transcriptional regulation by targeted expression of architectural transcription factor high mobility group A2 in salivary glands of transgenic mice. Eur J Oral Sci 115:30–39 [DOI] [PubMed] [Google Scholar]
- Wu Z, Xie Y, Morrison RF, Bucher NL, Farmer SR 1998 PPARγ induces the insulin-dependent glucose transporter GLUT4 in the absence of C/EBPα during the conversion of 3T3 fibroblasts into adipocytes. J Clin Invest 101:22–32 [DOI] [PMC free article] [PubMed] [Google Scholar]
Associated Data
This section collects any data citations, data availability statements, or supplementary materials included in this article.