


Abstract
The biological functions of DNA-binding proteins often require that they interact with their targets with high affinity and/or high specificity. Here, we describe a computational method that estimates the extent of optimization for affinity and specificity of amino acids at a protein–DNA interface based on the crystal structure of the complex, by modeling the changes in binding-free energy associated with all individual amino acid and base substitutions at the interface. The extent to which residues are predicted to be optimal for specificity versus affinity varies within a given protein–DNA interface and between different complexes, and in many cases recapitulates previous experimental observations. The approach provides a complement to traditional methods of mutational analysis, and should be useful for rapidly formulating hypotheses about the roles of amino acid residues in protein–DNA interfaces.
INTRODUCTION
DNA-binding proteins play critical roles in transcription, replication and other cellular processes. These proteins not only bind strongly to DNA, but often do so with high-sequence specificity and/or catalytic activity. The competing demands of affinity, specificity and catalysis are likely to have shaped the evolutionary optimization of residues at the interfaces. Valuable insights into the contributions of individual amino acids to DNA-binding affinity and specificity have been obtained from structural analysis, the analysis of sequence conservation within protein families (1,2,3) and mutational studies (4,5). However, bioinformatic methods require substantial numbers of sequences in a family and lack a thermodynamic basis upon which to contextualize variation, while mutational probing of residues at protein–DNA interfaces is time consuming and rarely comprehensive.
Computational methods that estimate the contributions of amino acid residues to affinity and specificity based on high-resolution structures provide a rapid, comprehensive and inexpensive complement to traditional analyses. We previously developed a computational method for redesigning protein–DNA-binding specificity that utilizes a detailed all-atom force field to estimate the energetics of protein–DNA interactions (6) in the context of amino acid and nucleotide rearragements and substitutions. This method has been used to redesign the DNA cleavage specificity of a homing endonuclease (7). In this article, we utilize our atomic model of the energetics of amino acid–nucleotide interactions to estimate the extent to which protein residues at DNA-binding interfaces are optimized for affinity or specificity.
MATERIALS AND METHODS
Structural data
The following high-resolution crystal structures of protein–DNA complexes were modeled:
Helical transcription factors: 1ig7 1k61 1puf 2hdd 1w0u 1e3o 2d5v 1zaa 1ubd 1g2f 1am9 1gd2 1gu4 1jnm 2dgc 1nkp 1lmb 2or1 1hcr 1ign 1tc3 1bl0 1zs4 2h27 1r71 1pp7 1bc8 1dp7 1f4k.
Restriction endonucleases: 2bam 1b94 2fqz 1fiu 1wte 2ezv 2fl3 1iaw 2oaa 2odi 1d02 1dc1 1dfm 1dmu 3pvi 1ckq.
Homing endonucleases: 1g9y anii 1r7m 1m5x 1mow 1a73 2ex5.
Nonspecific enzymes: 1pt3 1x9m 2bdp 2dnj 2hmi.
All coordinates were downloaded from the RCSB Protein Data Bank (8).
Computational modeling
All modeling was performed using the Rosetta macromolecular modeling and design suite (9). The detailed implementation of protein–DNA interface modeling in Rosetta has been previously described (6,7). The energy of interaction between protein and DNA was computed using an atomic-level forcefield, which includes a Lennard–Jones potential, hydrogen-bonding and electrostatic interactions, an implicit solvation model and a knowledge-based side-chain torsional potential. Interface amino acid positions were defined as those from which a hypothetical arginine side chain could contact any DNA atom without passing through the protein backbone. Point mutations to every possible amino acid at each position in each interface were explicitly modeled in the context of each nearby single-basepair substitution. For each protein–DNA sequence combination, all side-chain rotamer conformations of residues capable of contacting the mutable DNA were simultaneously optimized using discrete Monte Carlo packing calculations followed by torsion space energy minimization. The protein and DNA backbone degrees of freedom were fixed for all calculations. The binding energy of the complex was computed by subtracting the energy of the separated protein and DNA molecules from the energy of the complex.
The analysis of affinity and specificity described in this article has been implemented as a web server (10). The Rosetta software is freely available for academic use (9).
Assessment of optimality for affinity and specificity
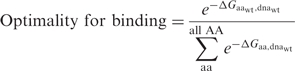
To determine the extent to which a residue at a particular position is optimizal for affinity, we systematically mutated each residue in a protein–DNA interface structure to each of the 19 non-native amino acids. The extent to which the native amino acid at a position is optimal for affinity was calculated using:
 |
where  is the calculated binding energy between a protein with amino acid aa and the native DNA molecule,
  is the calculated binding energy of the native complex, and all AA refers to all twenty amino acids. This expression corresponds to the physical situation in which equimolar amounts of the wild-type protein and each of the 19 single amino acid variants at the position are combined with a limiting amount of native DNA-binding sites; the value yielded is the proportion (from 0 to 1, with a random expectation of 0.05) of bound complexes that are formed between protein possessing the wild-type amino acid and the native DNA.
The specificity of a protein with amino acid aa at a particular site for a native basepair was calculated using:
 |
where  is the calculated binding energy between a protein with amino acid aa at a particular position and DNA containing basepair substitution bp, and
  is the calculated binding energy between this protein and the native DNA molecule. This expression corresponds to the physical situation in which a limiting amount of protein is combined with equimolar amounts of four different DNA-binding sites, each representing a different basepair identity at a single sequence position; the value yielded is the proportion (from 0 to 1, with a random expectation of 0.25) of bound complexes that are formed between protein and DNA sites possessing the wild-type basepair.
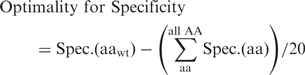
The extent to which the native amino acid at any given position is optimal for DNA-binding specificity was calculated as the difference between its specificity for the native DNA basepair, and the mean of the specificities for the native DNA basepair for all amino acids:
 |
RESULTS AND DISCUSSION
We computationally modeled all point mutations at all interface positions in a set of high-resolution X-ray crystal structures of protein–DNA complexes, and estimated the extent to which the individual amino acids were optimal for affinity or specificity, as described above. The results for five different interfaces are illustrated in Figure 1. The extent which residues were calculated to be optimal for affinity and specificity, according to Equations (1) and (3), are shown on the left, and the relevant regions of the corresponding crystal structures, colored on the basis of these values, are on the right (see figure legend for further details). The following section discusses each of these representative examples in turn.
Figure 1.

Optimality of affinity and specificity at individual positions in representative complexes. Protein identities and pdb codes are indicated at the top of each panel. In the left panels, the extent optimal for affinity [Equation (1)] is plotted against the extent optimal for specificity [Equation (3)] for each residue in a complex. The color of each data point is proportional to the change in the energy of binding calculated for mutation to glycine at that position, where bright cyan indicates the highest relative loss in binding energy, and black indicates the lowest loss in binding energy. All interface residues in each crystal structure are represented; large clusters near (0, 0) correspond to residues in the interface that are not predicted to be optimal for affinity or specificity. At right are representations of the crystal structures for each indicated interface. The amino acids are colored by a dual color gradient in which red indicates the optimality for affinity, blue indicates the optimality for specificity and pink/magenta indicates positions that are optimal for both affinity and specificity. A) DNAse I (pdb code: 2DNJ), B) C2H2 zinc finger Zif268 (1ZAA), C) [β]-Zip GCN4 (2DGC), D) EcoRV (1B94), E) I-MsoI (1M5X). In frame (D), symmetrically equivalent residues in the homodimer EcoRV are labeled on only one chain. Molecular images were rendered using PyMOL (11).
DNAseI
As illustrated in Figure 1A, several residues in the high-resolution structure of the DNAse I interface (pdb code 2DNJ (12)) appear to be optimal for DNA-binding affinity, while none show any particular sequence-specific preference for the bound DNA. This is consistent with the low-DNA sequence cleavage specificity exhibited by the DNAse I enzyme (13), and with experimental mutagenesis studies at key residues in the DNAseI interface (14). In particular, the identification of residues Arg41 and Tyr76 as optimal amino acid choices for conferring DNA-binding affinity agrees with mutagenesis at these positions (15). These observations are consistent with the idea that an enzyme that has evolved to interact with sequence-diverse DNA substrates should possess amino acids that are selected for strong binding but against DNA sequence specificity.
C2H2 zinc finger Zif268
The Zif268 zinc finger transcription factor (pdb code: 1ZAA (16)), shown in Figure 1B, binds with high affinity and specificity to its operator sequence through a combination of direct contacts to the DNA backbone and major groove. Sequence conservation analysis and mutation studies (1,17,18) have identified several key amino acid residues that play important roles in optimizing DNA-binding affinity and specificity for Zif268 and for the C2H2 zinc finger family as a whole. Arg70, a conserved DNA-backbone contacting residue (1,17), as well as Ser75 and Lys79, appear to be selected to confer DNA-binding affinity, while not affecting DNA-binding specificity. In contrast, amino acids Thr52 and Arg80 are found to be optimal amino acid choices for DNA-binding specificity in Zif268. These two amino acids occur at structural analogous positions that have been identified to be highly important for DNA sequence recognition by both Jacobs (17) (as position ‘m3’) and Wolfe et al. (18) (as position ‘6’). The amino acids Arg74 and Asp76 (Jacob's ‘s3’ and ‘s5’; Wolfe et al.'s ‘−1’ and ‘2’) form a dyad to interact very favorably with the adjacent guanine nucleotide, as confirmed by mutational analysis of these two positions (5). Both amino acids appear highly optimal to satisfy this high-order arrangement according to our analysis, however the relative specificity of Arg74 in isolation appears to be underestimated. Glu77 corresponds to a position (Jacob's ‘s6’; Wolfe et al.'s ‘3’) that is commonly involved in specific DNA recognition. Mutation of this residue to alanine results in a moderate broadening of specificity (5) that is not reflected by our analysis (the orientation of this residue in this and other Zif268 structures (19) does not permit base contacts, by any sidechain rotamer conformation).
β-Zip transcription factor GCN4
The transcription factor GCN4 (pdb code: 2DGC (20)), shown in Figure 1C, has a high density of amino acid side chains with direct contacts to DNA that extend from an α-helix nestled deeply into the DNA major groove, as also seen in zinc fingers, homeodomains and response regulators. Two residues, Asn235 and Arg243, are identified as the most optimal for DNA sequence recognition. This is consistent with the well-known importance of these two residues, which are invariant within the bZIP family of transcription factors, but can be modified to alter the DNA-binding specificity of GCN4 (21). However, the influence of residue Thr236 on the sequence specificity within the bZIP family (22) is not reflected, probably due to the lack of sampling of the rigid-body docking orientation of the protein during modeling. It has been suggested that subtle variations in the binding orientations of DNA-binding motifs contribute to differences in sequence recognition (23).
Restriction endonuclease EcoRV
The restriction endonuclease EcoRV (pdb code: 1B94 (24)), shown in Figure 1D, obtains a very high specificity for the restriction site that it cleaves through a combination of DNA-sequence-specific intramolecular distortion (25,26) and small number of tightly-packed direct protein–nucleobase interactions made by loop residues 182–187 (25). Because the relative contributions of binding and catalysis to the readout of specificity are not fully known (27,28), it may not be possible to fully predict the specificity of EcoRV based on a single crystal structure. Nonetheless, we find that the precise arrangement of the small hydrogen-bonding side chains on loop 182–187 leaves little room for alternative basepairs in the recognition site, as reflected by the above average DNA sequence specificities exhibited by residues 183–186. Asparagine 185, in particular, is the only amino acid that can directly satisfy the hydrogen-bonding groups of the adenine nucleotides at the −2 positions of the DNA restriction site, given the three-dimensional context of the interface.
Homing endonuclease I-MsoI
The homing endonuclease I-MsoI (pdb code: 1M5X (29)), shown in Figure 1E, is representative of a class of endonucleases that recognize long target sites (30). These enzymes, which invade and persist in host genomes, must be specific enough to cleave rarely within an entire genome, while remaining adaptable to evolution and genetic drift in the host (31). Thus the recognition of some basepairs in these interfaces is partially degenerate, due to an abundance of water-mediated contacts and semi-permissive interactions (29). Consistent with this view, several of the amino acids in the I-MsoI interface, such as Arg75 and the Asp81/Arg72 dyad, are found to be highly optimized for the recognition of a single basepair identity, while Thr83 and Lys28 participate in less specific interactions. Thr83 is involved in a water-mediated contact that can serve to both donate and accept hydrogen bonds from DNA, and Lys28 can recognize either an adenine or guanine nucleotide at the +6 position of the pseudosymmetric target site (29). Mutation of this amino acid in combination with Thr83 allows the engineering of a mutually exclusive switch in DNA sequence specificity (7).
Trends across broad protein classes
We next analyzed a larger set of 57 high-resolution crystal structures of protein–DNA complexes, including helical-motif transcription factors, restriction endonucleases, homing endonucleases and nonspecific interfaces. Figure 2 compares the the extent to which native amino acids are optimal for DNA-binding affinity and specificity across these different classes. The extent to which amino acids are predicted to be optimized for affinity appears roughly equivalent across all categories (Figure 2B). In contrast, more residues are found to be optimized for specificity in the classes that exhibit sequence specific binding (Figure 2A).
Figure 2.

Distributions of optimality for affinity [Equation (1)] and specificity [Equation (3)] in four catagories of protein–DNA interfaces. Red: helical transcription factors; green: restriction endonucleases; blue: homing endonucleases; black: nonspecific enzymes. Histogram bin centers are indicated on the horizontal axes. Only positions at which mutation to glycine is predicted to result in the loss of >3 kcal/mol of binding energy were included.
Trends within a single protein class
Within closely related structural families of protein–DNA interfaces, the structural context of certain amino acids largely determines their contributions to DNA-binding affinity and specificity (23,32). Table 1 shows average estimates of the optimality of affinity and specificity for several positions in the zinc finger transcription factor family. Within a set of eight high-resolution crystal structures of C2H2 zinc finger transcription factors, key nucleobase-interacting residues at canonical positions −1, 2, 3 and 6 (18) are consistently estimated to be more optimal than average for both binding and specific recognition of adjacent DNA basepairs, in agreement with previous studies (1,5,33). In contrast, the amino acids found at position −5, which can make favorable contacts to the DNA backbone, are found to be optimized for affinity rather than specificity. Our approach can thus provide insights into the roles of amino acid residue positions across families of closely related protein–DNA interfaces.
Table 1.
Optimization of specificity and affinity in the C2H2 zinc finger family
| C2H2 zinc finger family | |||
|---|---|---|---|
| (pdb codes: 1zaa, 1aay, 1mey, 1ubd, 1g2f, 1a1f, 1a1h, 1a1j) | |||
| Position | Counts | 〈opt.ΔG〉 | 〈opt. Spec.〉 |
| −5 | 20 | 0.29 | 0.05 |
| −1 | 24 | 0.83 | 0.43 |
| 2 | 23 | 0.34 | 0.21 |
| 3 | 24 | 0.48 | 0.25 |
| 6 | 24 | 0.56 | 0.28 |
| All other | 97 | 0.07 | 0.02 |
| All int pos | 212 | 0.31 | 0.14 |
All quantities are averaged over the eight complexes noted above. 〈opt.ΔG〉, optimality for binding [Equation (1)]; 〈opt. Spec.〉, optimality for wild-type DNA specificity [Equation (3)]. ‘All other’ refers to all positions excluding −5, −1, 2, 3, and 6. ‘All int pos’ refers to all interface positions
Indirect readout mechanisms
In addition to DNA sequence readout that is achieved through direct contacts between amino acids and individual nucleotide bases, many sequence-specific DNA-binding proteins and enzymes also achieve specificity by exploitation of sequence-dependent DNA deformability, or the ability of certain DNA sequences to adopt noncanonical conformations upon binding or catalysis (34,35). These macromolecular deformations are the concerted result of multiple backbone contacts and overall shape complementarity to a distorted DNA recognition site. While the modeling protocol employed here can identify the native sequence optimality of such contacts on the basis of affinity, it significantly underestimates the optimization of native amino acid sequence for specificity in complexes in which sequence recognition is dominated by indirect readout mechanisms, because it does not model the flexibility of the protein and DNA backbones. Such is the case for the TATA-binding protein (pdb: 1YTB (36)), which binds to the minor groove of DNA and is known to achieve DNA sequence specificity through indirect readout. Our analysis results in a strong signals for the optimality of individual residues for binding affinity, but none for DNA sequence specificity (Supplementary Figure 1). While this is consistent with the idea that indirect readout is achieved through bending of DNA by multiple high-affinity ‘nonspecific’ contacts, our method is not able to recognize the contributions of these amino acids to specificity.
CONCLUSION
Atomic-level structures of biomolecules provide not only a static view of a single low-energy thermodynamic state, but also provide the basis for modeling the thermodynamics of alternative states. As illustrated here, it is possible to obtain insights into the extent to which residues are optimized for binding affinity versus specificity by using a simple biophysical model to estimate the effects of amino acid and nucleotide substitutions. The correspondence with experimental results that we have demonstrated suggests that the method should be useful for rapidly formulating experimentally testable hypotheses about the roles of amino acid residues at protein–DNA interfaces, given a high-resolution structure of the protein-DNA complex.
SUPPLEMENTARY DATA
Supplementary Data are available at NAR Online.
FUNDING
US National Institutes of Health (#GM084433); Foundation for the National Institutes of Health through the Grand Challenges in Global Health Initiative. Funding for open access charge: US National Institutes of Health (#GM084433).
Conflict of interest statement. None declared.
Supplementary Material
ACKNOWLEDGEMENT
We would like to thank Drs Phil Bradley and James J. Havranek, as well as all developers who have contributed to the Rosetta software project.
REFERENCES
- 1.Pabo CO, Sauer RT. Transcription factors: structural families and principles of DNA recognition. Ann. Rev. Biochem. 1992;61:1053–1095. doi: 10.1146/annurev.bi.61.070192.005201. [DOI] [PubMed] [Google Scholar]
- 2.Luscombe NM, Thornton JM. Protein-DNA interactions: amino acid conservation and the effects of mutations on binding specificity. J. Mol. Biol. 2002;320:991–1009. doi: 10.1016/s0022-2836(02)00571-5. [DOI] [PubMed] [Google Scholar]
- 3.Berger MF, Badis G, Gehrke AR, Talukder S, Philippakis AA, Pea-Castillo L, Alleyne TM, Mnaimneh S, Botvinnik OB, Chan ET, et al. Variation in homeodomain DNA binding revealed by high-resolution analysis of sequence preferences. Cell. 2008;133:1266–1276. doi: 10.1016/j.cell.2008.05.024. [DOI] [PMC free article] [PubMed] [Google Scholar]
- 4.Thukral SK, Morrison ML, Young ET. Alanine scanning site-directed mutagenesis of the zinc fingers of transcription factor ADR1: residues that contact DNA and that transactivate. Proc. Natl Acad. Sci. USA. 1991;88:9188–9192. doi: 10.1073/pnas.88.20.9188. [DOI] [PMC free article] [PubMed] [Google Scholar]
- 5.Elrod-Erickson M, Pabo CO. Binding studies with mutants of Zif268. Contribution of individual side chains to binding affinity and specificity in the Zif268 zinc finger-DNA complex. J. Biol. Chem. 1999;274:19281–19285. doi: 10.1074/jbc.274.27.19281. [DOI] [PubMed] [Google Scholar]
- 6.Havranek JJ, Duarte CM, Baker D. A simple physical model for the prediction and design of protein–DNA interactions. J. Mol. Biol. 2004;344:59–70. doi: 10.1016/j.jmb.2004.09.029. [DOI] [PubMed] [Google Scholar]
- 7.Ashworth J, Havranek JJ, Duarte CM, Sussman D, Monnat RJ, Stoddard BL, Baker D. Computational redesign of endonuclease DNA binding and cleavage specificity. Nature. 2006;441:656–659. doi: 10.1038/nature04818. [DOI] [PMC free article] [PubMed] [Google Scholar]
- 8.Berman HM, Westbrook J, Feng Z, Gilliland G, Bhat TN, Weissig H, Shindyalov IN, Bourne PE. The protein data bank. Nucleic Acids Res. 2000;28:235–242. doi: 10.1093/nar/28.1.235. [DOI] [PMC free article] [PubMed] [Google Scholar]
- 9.Rosetta commons. [Accessed: 8 April 2009.]. http://www.rosettacommons.org/
- 10.DnaInterfaceScanServer. [Accessed: 8 April 2009.]. http://robetta.bakerlab.org/dnainterfacescansubmit.jsp.
- 11.DeLano WL. The PyMOL Molecular Graphics System. 2002. [Last accessed: 8 April 2009.]. http://www.pymol.org.
- 12.Lahm A, Suck D. DNase I-induced DNA conformation. 2A structure of a DNase I-octamer complex. J. Mol. Biol. 1991;222:645–667. doi: 10.1016/0022-2836(91)90502-w. [DOI] [PubMed] [Google Scholar]
- 13.Lomonossoff GP, Butler PJ, Klug A. Sequence-dependent variation in the conformation of DNA. J. Mol. Biol. 1981;149:745–760. doi: 10.1016/0022-2836(81)90356-9. [DOI] [PubMed] [Google Scholar]
- 14.Evans SJ, Shipstone EJ, Maughan WN, Connolly BA. Site-directed mutagenesis of phosphate-contacting amino acids of bovine pancreatic deoxyribonuclease I. Biochemistry. 1999;38:3902–3909. doi: 10.1021/bi9824893. [DOI] [PubMed] [Google Scholar]
- 15.Doherty AJ, Worrall AF, Connolly BA. Mutagenesis of the DNA binding residues in bovine pancreatic DNase 1: an investigation into the mechanism of sequence discrimination by a sequence selective nuclease. Nucleic Acids Res. 1991;19:6129–6132. doi: 10.1093/nar/19.22.6129. [DOI] [PMC free article] [PubMed] [Google Scholar]
- 16.Pavletich NP, Pabo CO. Zinc finger-DNA recognition: crystal structure of a Zif268-DNA complex at 2.1A. Science. 1991;252:809–817. doi: 10.1126/science.2028256. [DOI] [PubMed] [Google Scholar]
- 17.Jacobs GH. Determination of the base recognition positions of zinc fingers from sequence analysis. EMBO J. 1992;11:4507–4517. doi: 10.1002/j.1460-2075.1992.tb05552.x. [DOI] [PMC free article] [PubMed] [Google Scholar]
- 18.Wolfe SA, Nekludova L, Pabo CO. DNA recognition by Cys2His2 zinc finger proteins. Ann. Rev. Biophy. Biomol. Struct. 2000;29:183–212. doi: 10.1146/annurev.biophys.29.1.183. [DOI] [PubMed] [Google Scholar]
- 19.Elrod-Erickson M, Rould MA, Nekludova L, Pabo CO. Zif268 proteinDNA complex refined at 1.6A: model system for understanding zinc finger-DNA interactions. Structure. 1996;4:1171–1180. doi: 10.1016/s0969-2126(96)00125-6. [DOI] [PubMed] [Google Scholar]
- 20.Keller W, Knig P, Richmond TJ. Crystal structure of a bZIP/DNA complex at 2.2: determinants of DNA specific recognition. J. Mol. Biol. 1995;254:657–667. doi: 10.1006/jmbi.1995.0645. [DOI] [PubMed] [Google Scholar]
- 21.Suckow M, Schwamborn K, Kisters-Woike B, von Wilcken-Bergmann B, Mller-Hill B. Replacement of invariant bZip residues within the basic region of the yeast transcriptional activator GCN4 can change its DNA binding specificity. Nucleic Acids Res. 1994;22:4395–4404. doi: 10.1093/nar/22.21.4395. [DOI] [PMC free article] [PubMed] [Google Scholar]
- 22.Suckow M, von Wilcken-Bergmann B, Mller-Hill B. Identification of three residues in the basic regions of the bZIP proteins GCN4, C/EBP and TAF-1 that are involved in specific DNA binding. EMBO J. 1993;12:1193–1200. doi: 10.1002/j.1460-2075.1993.tb05760.x. [DOI] [PMC free article] [PubMed] [Google Scholar]
- 23.Pabo CO, Nekludova L. Geometric analysis and comparison of protein–DNA interfaces: why is there no simple code for recognition? J. Mol. Biol. 2000;301:597–624. doi: 10.1006/jmbi.2000.3918. [DOI] [PubMed] [Google Scholar]
- 24.Thomas MP, Brady RL, Halford SE, Sessions RB, Baldwin GS. Structural analysis of a mutational hot-spot in the EcoRV restriction endonuclease: a catalytic role for a main chain carbonyl group. Nucleic Acids Res. 1999;27:3438–3445. doi: 10.1093/nar/27.17.3438. [DOI] [PMC free article] [PubMed] [Google Scholar]
- 25.Winkler FK, Banner DW, Oefner C, Tsernoglou D, Brown RS, Heathman SP, Bryan RK, Martin PD, Petratos K, Wilson KS. The crystal structure of EcoRV endonuclease and of its complexes with cognate and noncognate DNA fragments. EMBO J. 1993;12:1781–1795. doi: 10.2210/pdb4rve/pdb. [DOI] [PMC free article] [PubMed] [Google Scholar]
- 26.Martin AM, Sam MD, Reich NO, Perona JJ. Structural and energetic origins of indirect readout in site-specific DNA cleavage by a restriction endonuclease. Nat. Struct. Biol. 1999;6:269–277. doi: 10.1038/6707. [DOI] [PubMed] [Google Scholar]
- 27.Taylor JD, Badcoe IG, Clarke AR, Halford SE. EcoRV restriction endonuclease binds all DNA sequences with equal affinity. Biochemistry. 1991;30:8743–8753. doi: 10.1021/bi00100a005. [DOI] [PubMed] [Google Scholar]
- 28.Engler LE, Welch KK, Jen-Jacobson L. Specific binding by EcoRV endonuclease to its DNA recognition site GATATC. J. Mol. Biol. 1997;269:82–101. doi: 10.1006/jmbi.1997.1027. [DOI] [PubMed] [Google Scholar]
- 29.Chevalier B, Turmel M, Lemieux C, Monnat RJ, Stoddard BL. Flexible DNA target site recognition by divergent homing endonuclease isoschizomers I-CreI and I-MsoI. J. Mol. Biol. 2003;329:253–269. doi: 10.1016/s0022-2836(03)00447-9. [DOI] [PubMed] [Google Scholar]
- 30.Stoddard BL. Homing endonuclease structure and function. Quart. Rev. Biophy. 2005;38:49–95. doi: 10.1017/S0033583505004063. [DOI] [PubMed] [Google Scholar]
- 31.Scalley-Kim M, McConnell-Smith A, Stoddard BL. Coevolution of a homing endonuclease and its host target sequence. J. Mol. Biol. 2007;372:1305–1319. doi: 10.1016/j.jmb.2007.07.052. [DOI] [PMC free article] [PubMed] [Google Scholar]
- 32.Kono H, Sarai A. Structure-based prediction of DNA target sites by regulatory proteins. Proteins. 1999;35:114–131. [PubMed] [Google Scholar]
- 33.Rebar EJ, Pabo CO. Zinc finger phage: affinity selection of fingers with new DNA-binding specificities. Science. 1994;263:671–673. doi: 10.1126/science.8303274. [DOI] [PubMed] [Google Scholar]
- 34.Lesser DR, Kurpiewski MR, Jen-Jacobson L. The energetic basis of specificity in the EcoRI endonuclease–DNA interaction. Science. 1990;250:776–786. doi: 10.1126/science.2237428. [DOI] [PubMed] [Google Scholar]
- 35.Wenz C, Jeltsch A, Pingoud A. Probing the indirect readout of the restriction enzyme EcoRV. mutational analysis of contacts to the DNA backbone. J. Biol. Chem. 1996;271:5565–5573. doi: 10.1074/jbc.271.10.5565. [DOI] [PubMed] [Google Scholar]
- 36.Kim Y, Geiger JH, Hahn S, Sigler PB. Crystal structure of a yeast TBP/TATA-box complex. Nature. 1993;365:512–520. doi: 10.1038/365512a0. [DOI] [PubMed] [Google Scholar]
Associated Data
This section collects any data citations, data availability statements, or supplementary materials included in this article.