Abstract
Nanoparticles have been investigated as drug delivery vehicles, contrast agents, and multifunctional devices for patient care. Current nanoparticle-based therapeutic strategies for cancer treatment have been mainly based on delivery of chemotherapeutic agents to induce apoptosis or DNA/siRNA to regulate oncogene expression. Here, we present a nanoparticle system that demonstrates an alternative approach to the treatment of cancers, through the inhibition of cell invasion, while serving as a magnetic resonance and optical imaging contrast agent. The nanoparticle is comprised of an iron oxide nanoparticle core, conjugated with an amine-functionalized PEG silane and a small peptide, chlorotoxin (CTX), which enables the tumor cell-specific binding of the nanoparticle. We show that the nanoparticle exhibits substantially enhanced cellular uptake and an invasion inhibition rate of ~98% compared to unbound CTX (~45%). Significantly, our investigation from flow cytometry analysis, transmission electron microscopy and fluorescent imaging revealed that the CTX-enabled nanoparticles deactivated the membrane-bound matrix metalloproteinase 2 (MMP-2) and induced increased internalization of lipid rafts that contain surface-expressed MMP-2 and volume-regulating ion channels through receptor-mediated endocytosis, leading to enhanced prohibitory effects. Since upregulation and activity of MMP-2 have been observed in tumors of neuroectodermal origin, and in cancers of the breast, colon, skin, lung, prostate, ovaries and a host of others, this nanoparticle system can be potentially used for non-invasive diagnosis and treatment of a variety of cancer types.
Keywords: nanoparticles, chlorotoxin, invasion inhibition, specific targeting, cancer, imaging, biological activity
1. Introduction
Use of magnetic nanoparticles conjugated with targeting ligands and/or therapeutic drugs, combined with magnetic resonance imaging (MRI), is playing an increasingly important role in non-invasive, early cancer detection and treatment.[1,2] With continued advances in identification of targeting ligands, and design of surface coatings and conjugation methods, magnetic nanoparticles as diagnostic tools have demonstrated broader applicability and improved efficacy for detection of tumors and visualization of biological processes (e.g., apoptosis, cell trafficking, and gene expression).[3-6] In treatment of cancers, nanoparticles serve as a vehicle for payload delivery. The primary reason of using nanoparticles as carriers for therapeutic delivery is to enable multimodal functionalities, such as imaging or specific targeting, increase tissue permeability and site-specific drug accumulation, and reduce side effects to healthy tissues. Current nanoparticle-based therapeutic strategies for cancer treatment have been mainly based on delivery of chemotherapeutic agents to induce apoptosis or DNA/siRNA to down-regulate oncogene expression.[7] In this study we explore a new approach of nanoparticle-based therapy for treatment of cancers through the inhibition of tumor cell invasion, a strategy particularly suitable for highly invasive cancers, such as gliomas.
Gliomas are the most common and lethal type of brain tumors.[8] Despite incremental advances in surgical and radiation therapies, the treatment of gliomas remains a challenge largely due to the rapid growth rate and highly invasive nature of the disease.[9-11] While the precise mechanism by which glioma infiltrate neighboring tissue is not fully understood, there is mounting evidence suggesting that these cells excrete matrix metalloproteinases (MMPs) to degrade the local extracellular matrix, and alter their morphology via modulation of specific ion channels to pass through tight spaces.[12-15] This has led to a surge in research evaluating possible therapies that target the invasion mechanism.[14,16,17] One promising discovery is the 36 residue peptide, chlorotoxin (CTX), which has been identified as a possible therapeutic against gliomas through inhibition of cell invasion.[12,18,19] CTX has been shown to selectively bind gliomas and other tumors of the neuroectodermal origin,[20,21] through binding to a surface-bound complex that includes the matrix metalloproteinase 2 (MMP-2) endopeptidase.[12,19,22]
Previously, we showed that superparamagnetic nanoparticles covalently bound with CTX and a near infrared emitting fluorophore can be used to selectively label 9L glioma cells for both optical and MR imaging.[23] The use of these nanoparticles for in vivo imaging was also recently demonstrated in a separate study.[24] In the present study, we investigate the therapeutic capacity of CTX-enabled nanoparticles (NPCs) to inhibit the invasive nature of glioma cells, and explore the underlying mechanism for the enhanced prohibitory properties of NPCs. Specific targeting of the nanoparticles for high-grade C6 gliomas was assessed by uptake assays. Invasion inhibition was shown in vitro with NPC-treated glioma cells using transwell migration assays. Optical microscopy was used to study the effects of NPC on the morphological changes of targeted cells, while transmission electron microscopy (TEM) and immunohistochemistry studies were performed to elucidate the inhibition mechanism.
2. Results and Discussion
2.1 Development of NPC for Tumor Invasion Inhibition
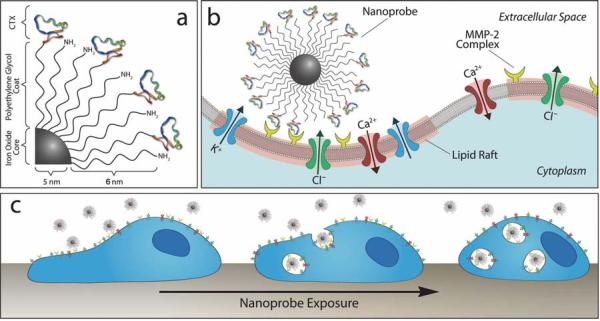
NPC is comprised of an iron oxide nanoparticle core, coated with an amine-functionalized PEG silane. The Alexa Fluor 680 (AF680) fluorochrome and CTX were conjugated to the amino terminal groups of the nanoparticle-bound PEG via successive reactions with N-succinimidyl-S-acetylthioacetate (SATA) and succinimidyl iodoacetate (SIA), as previously reported.[23] A conceptual schematic of this construct is illustrated in Figure 1a. It was determined that 10.2 peptides and 1.22 fluorophores were bound to each nanoparticle.[23] Furthermore, it was determined that the AF680 labeled nanoparticles displayed the same number of peptides as the non-fluorescently labeled nanoprobe, and the fluorophore presence did not enhance or diminish C6 cell uptake. Nanoparticles coated with PEG but not CTX were also prepared to serve as control (denoted as NP).
Figure 1.
Schematic representations of CTX-enabled nanoparticles (NPCs) inhibiting tumor cell invasion. (a) Surface chemistry of NPC conjugate. (b) NPC binding to lipid rafts of glioma cells containing MMP-2 and select ion channels. (c) NPC internalization and effect on cell morphology.
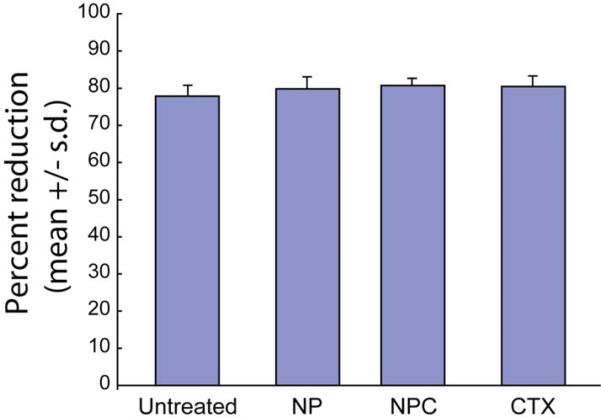
The PEG polymer coating serves several important functions, including increased biocompatibility, ligand binding sites, and a sterically stabilizing corona. This polymeric brush border ensures minimal cellular harm, as verified by Alamar Blue reagent based cell viability study of C6 glioma cells treated with either NPC (nanoparticles with both PEG and CTX conjugated), NP (nanoparticles with PEG but no CTX conjugated), free CTX, or left untreated (Figure 2). These comparisons revealed that there is no significant difference (P > 0.05) in the percent reduction of AlamarBlue reagent between the treated and untreated cells, indicating that neither of the nanoparticle formulations, nor CTX alone, induced cellular toxic effects.
Figure 2.
Viability of C6 glioma cells treated with NP, NPC, free CTX, or left untreated, as determined by percent reduction of Alamar blue.
The MMP-2 endopeptidase complex plays an active role in the degradation of extracellular matrix,[25] an essential component to the glioma cell invasion pathway.[11,13,19] This membrane-bound complex is colocalized on lipid rafts with Cl- and K+ ion channels involved in cell volume regulation during invasion.[12,22] The NPC was designed to bind and inhibit the activity of the MMP-2 endopeptidase, and to induce endocytosis of the lipid rafts, subsequently limiting invasive cell activities (Figures 1b and 1c).
2.2 CTX-Mediated Endocytosis of NPC by C6 cells
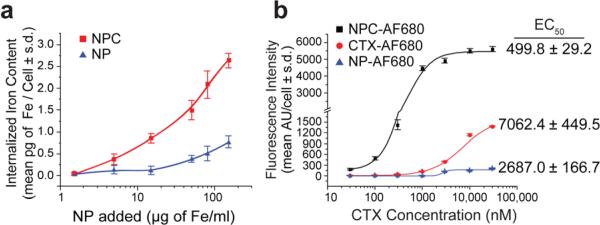
We evaluated NPC-targeting and cellular internalization by incubating C6 cells with either NPC or NP (as a control) for 2 hrs at nanoparticle concentrations between 1.5 and 150 μg Fe ml-1. Iron internalization, as quantified by a cell-based ferrozine assay, was significantly higher for cells exposed to NPC over NP, yielding up to 10.6 (P < 0.0001) fold higher uptake at the same incubation concentration (15 μg Fe mL-1; Figure 3a), confirming CTX-enabled specific targeting of NPC to glioma cells. It is noted that increased attachment of NP to cells at particle concentrations greater than 15 μg Fe mL-1 is likely due to increased non-specific adsorption of NPs to cells.
Figure 3.
Glioma cell binding and internalization of NPC in comparison with controls. (a) NPC uptake by C6 cells in comparison with nanoparticles with no CTX, quantified by iron content per cell. (b) C6 cells incubated with AF680 fluorescently-labeled NPC, NP or CTX and analyzed for total uptake by flow cytometry.
We used MR phantom imaging of cells treated with NPC, NP or left untreated to further confirm the targeting functionality of the NPC and demonstrate the contrast enhancement of the nanoparticles' iron oxide core under MRI. Images of cells treated with NPC were much darker than that of NP-treated and untreated cells (Figure S1), representing a > 2.5× (P < 0.0017) and > 4.0× (P < 0.0009) increase in relaxivity (R2) for NPC-treated cells compared to NP-treated and untreated cells, respectively (Figure S1), and demonstrating the ability of NPC to provide MRI contrast enhancement. The slight increase in relaxivity for cells treated with NPs compared to untreated cells is likely due to minimal nonspecific attachment.
Fluorescence imaging was employed to visualize the localization of nanoparticles or free CTX in cells, and nanoparticle targeting was quantitatively assessed by flow cytometry. NPC, NP, and free CTX were each mono-labeled with AF680 (NPC-AF680, NP-AF680, and CTX-AF680, respectively) for flow cytometry and optical microscopy study. C6 cells were incubated with varying concentrations of CTX, NPC (30-30,000 nM CTX), or NP (Fe equivalent to NPC quantities) for 2 hrs, rinsed, and analyzed. NPC-AF680 uptake appeared to correlate linearly with NPC concentration at lower concentrations (30-1000 nM), followed by a plateau in response at higher concentrations (3,000-30,000 nM), indicative of receptor saturation (Figure 3b). Conversely, non-targeted NP-AF680 showed little or no cell binding at lower concentrations (30-1000 nM), with limited binding at higher concentrations, typical of nonspecific binding interactions. CTX-AF680 showed moderate cell binding, significantly lower than NPC-AF680. Furthermore, by fitting the obtained data to a sigmoidal function,[26] we calculated that the NPC treatment yielded a 50% maximum uptake (EC50) at a CTX dose of 499.8 ± 29.2 nM, while CTX-AF680 yielded an EC50 at a significantly higher (P < 0.0001) dose of 7062 ± 499.5 nM. The fact that the EC50 for NPC occurred at lower CTX concentrations compared to free CTX can be attributed to the multivalent interactions between CTX molecules on individual nanoparticles and MMP-2 receptor complex of the target cell, a phenomenon also observed between peptide-enabled nanoparticles and cells in enhanced targeting affinity[26,27].
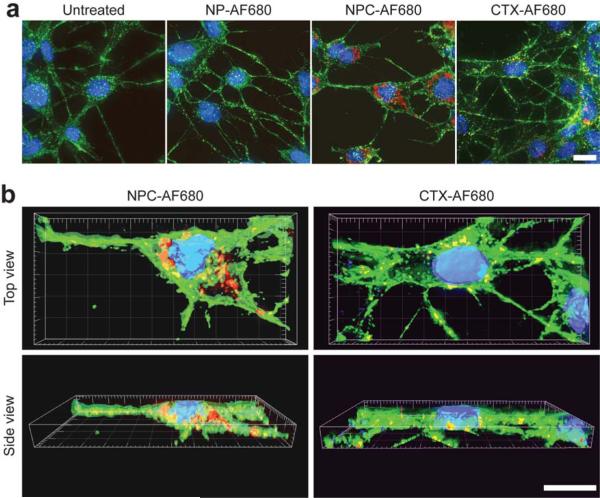
The intracellular localization of the NPC-AF680 and CTX-AF680 was visualized in Z-stacked fluorescence images acquired from C6 cells treated with NPC-AF680, NP-AF680 or CTX-AF690, with a CTX equivalent concentration of 3000 nM. Cells were co-stained with WGA-AF594 (membrane stain) and DAPI (nuclear stain). 2-D image projections of C6 cell samples showed greater accumulation of NPC-AF680 compared with CTX-AF680, and very little NP-AF680 uptake (Figure 4a). Higher magnification, volume surpassed 3-D reconstructed images of cells incubated with NPC-AF680 or CTX-AF680 showed endocytosis and localization of both constructs in the perinuclear region of cytoplasm (Figure 4b).
Figure 4.
Intracellular localization of nanoparticles. C6 cells incubated with AF680 fluorescentlylabeled NPC, NP or CTX and analyzed by (a) Z-stacked 2-D projections and (b) 3-D reconstructions (DAPI nuclear stain in blue, WGA 594 membrane stain in green, and AF680 in red). (Scale bars in a, and b represent 10 μm).
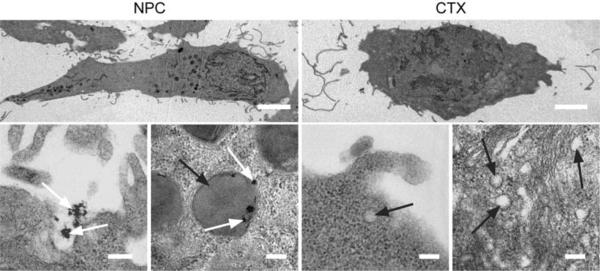
We used TEM to reveal membrane internalization in cells treated with NPC and free CTX. C6 cells were incubated with 3000 nM of CTX or the CTX equivalence of NPC for 2 hrs. NPC (identified by white arrows) internalization was observed at the cell surface, and confined to large endosomes (identified by black arrows) within the cell (Figures 5 and S2). It should be noted that the scale bars for all the images in the bottom row of Figure 5 are the same, which shows that endosomes of NPC-treated cells were 5 to 10 times larger than those of CTX-treated cells (Figure S2), indicating increased lipid raft internalization. This phenomenon signifies an increase in endocytosis of membrane-bound MMP-2 and associated ion channels. The internalization of larger lipid membrane fragments might be attributed to multiple CTX interactions with their complementary binding sites on the lipid raft.
Figure 5.
TEM images showing increased membrane uptake subsequent to NPC binding. Scale bars represent 5 μm and 200 nm for whole cell (first row) and high magnification imaging (second row), respectively. White and black arrows identify NPC and endosomes, respectively.
2.3 Inhibition of Tumor Invasion by NPC
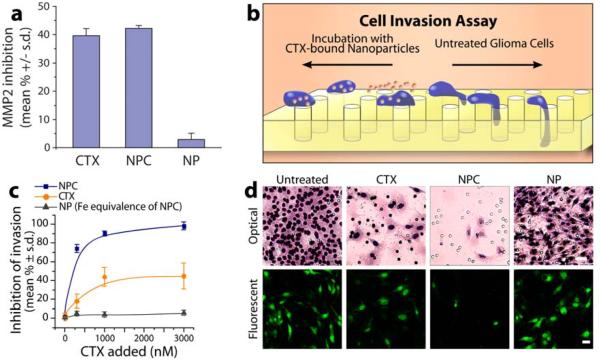
To verify that the CTX bound on NPC retained its inhibitory functionality after conjugation to the nanoparticle, we conducted a MMP Gelatinase activity in vitro assay (Millipore; Billerica, MA) in which p-Aminophenylmercuric acetate (APMA) activated human MMP-2 was incubated with free CTX (3000 nM), NPC (CTX equivalence), or NP in the presence of biotinylated gelatin (Figure 6a). The gelatinase inhibition of free CTX and NPC on MMP-2 were comparable (~40%, P > 0.05) while control NP, with no CTX involved, showed no evident effect on MMP-2 activity (< 5%, P > 0.05), confirming retention of CTX activity after surface attachment to the nanoparticles.
Figure 6.
Glioma cell invasion inhibition. (a) Functional inhibition of NPC, free CTX, and NP on MMP-2 in the presence of gelatin. Comparable inhibition by CTX and NPC indicates retention of catalytic activity of CTX bound to NPC. (b) Schematic of cell invasion assay. (c) Quantitative assessment matrigel cell invasion post-treatment. (d) Optical images of C6 cells (scale bar: 50 μm) and fluorescence images of EGFP-expressing C6 cells (scale bar: 20 μm) that have crossed through the pores of a matrigel invasion chamber, showing that NPC significantly limits cellular mobility compared to NP and CTX treatments.
We used transwell migration assays to assess and compare the therapeutic effects of NPC, free CTX and NP, wherein EGFP-expressing C6 cells were treated with each agent (30-3000 nM) and allowed to migrate across 8 μm pores of matrigel invasion chambers for 24 hrs. Figure 6b shows the schematic diagram of expected cell mobility across the invasion chamber with or without the presence of NPC. Non-invading cells were scrubbed off the upper membranes, while invading cells on the lower membrane were stained and examined using an optical microscopy.
Treating cells with NP showed no evident transwell cell migration inhibition as expected, while free CTX showed moderate transwell cell migration inhibition (Figure 6c). Significantly, NPC limited cell invasion almost completely. NPC showed ~98% inhibition of cell transwell migration at the highest tested exposure concentration (reported as reduction of migrating cells), while free CTX inhibited less than half as many cells at its highest inhibitory capacity (1000 nM and above). Triplicates of each sample were prepared and cell counts were obtained from five random spots on each filter. Figure 6d shows both optical and fluorescence images of cells that have migrated across the chamber. Little cell invasion is observed in either micrograph of cells treated with NPC.
2.4 Inhibition Mechanism Revealed by Cell Morphology Assessment and MMP-2 Immunofluorescence Staining
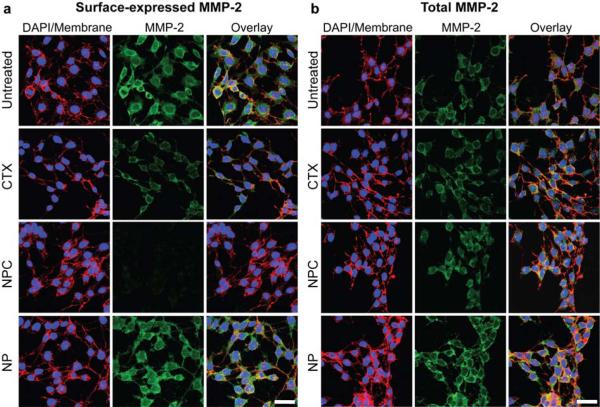
We conducted immunofluorescence studies to evaluate the influence of NPC and free CTX treatment on cell surface and total MMP-2 expression levels. This would provide insight into the role of the surface-expressed MMP-2 in invasive properties of the cell. C6 cells were plated on glass cover slips, grown for 24 hrs and treated with CTX (3000 nM), NPC (CTX equivalence to 3000 nM), or NP (Fe equivalent to NPC) for 2 hrs, or left untreated. Then, anti-MMP-2 antibodies were used to identify MMP-2 expression levels. Surface expression of MMP-2 in NP-treated and untreated cells were similarly high, while a moderate reduction in surface MMP-2 expression was observed in CTX-treated cells (Figure 7a). A large reduction in MMP-2 surface expression by NPC-treated cells was observed (Figure 7a). Total MMP-2 expression levels of cells were evaluated by permeabilizing the treated-cells prior to MMP-2 staining. Interestingly, unlike surface MMP-2 expression, total MMP-2 expression remained about the same in all cell samples (Figure 7b), indicating the NPC and CTX decrease surface expression of MMP-2, while leaving total MMP-2 expression (i.e., including internalized MMP-2) unchanged. Combined with the TEM study (Figures 5 and S2), which shows markedly larger endosomes in NPC-treated cells than in CTX-treated cells, this result suggests increased internalization of lipid rafts containing both surface MMP-2 and ion channels, enhanced by the nanoparticles.
Figure 7.
Confocal fluorescence images highlighting (a) surface expression and (b) total expression of MMP-2 (green) by C6 cells (also, DAPI nuclear stain in blue, and WGA membrane stain in red). The scale bars represent 30 μm in a and b.
The ability of glioma cells to invade neighboring tissue is dependent on the activity of surface-expressed endopeptidases such as MMP-2 to cleave surrounding extracellular matrix, and various ion channels to regulate the cell size as it moves through crevices.[12,19] While the precise binding mechanism of CTX has yet to be fully elucidated, it is known that the peptide binds to a lipid raft-anchored complex on gliomas in a MMP-2 dependent fashion, inhibits catalytic activity of MMP-2, and facilitates endocytosis of the endopeptidase and the C1C-3 chloride channel used in volume regulation.[12,22] These properties were substantially enhanced in this study by conjugation of the CTX peptide to nanoparticles, as demonstrated by decreased surface MMP-2 expression (Figure 7a). CTX exhibited an inhibitory effect of ~45% to C6 cell invasion (Figure 6c), while NPC elicited an inhibitory effect of ~98% (Figure 6c).
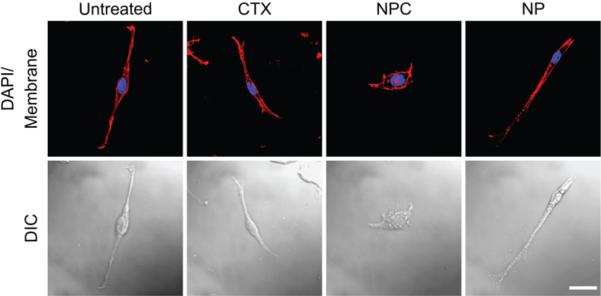
To further demonstrate the internalization of ion channels involved in cellular volume regulation during cell invasion and elucidate the effects of NPC on glioma cell invasion, cell volume regulation was evaluated by morphological assessment.[28] Figure 8 shows confocal DIC and confocal fluorescence images of C6 cells treated for 24 hrs with CTX (3000 nM), NPC (total CTX equivalent to 3000 nM), NP (Fe equivalent to NPC), or left untreated. Untreated cells had long, spindle-shaped bodies, displayed fillopodia-like projections, and had a bipolar morphology, indicative of normal C6 glioma cells that retain volume regulation abilities. Cells treated with NP or CTX exhibited morphology similar to that of untreated cells, while NPC-treated cells were round and puffed. This morphological variation of NPC-treated cells suggests the internalization of lipid raft-bound ion channels required for volume regulation.
Figure 8.
Confocal differential interference contrast (DIC) and confocal fluorescence imaging, showing the morphological changes of C6 cells exposed to NPC (scale bar: 20 μm).
3. Conclusions
In this study, we have shown that CTX-enabled nanoparticles demonstrated significantly higher affinity for tumor cells and therapeutic effect compared to unbound CTX. To elucidate the mechanism of enhanced invasion inhibition, NPC activity was tested directly against MMP-2 and the C6 glioma cell line. Gelatinase activity of MMP-2 in the presence of free CTX and NPC demonstrated comparable inhibition (Figure 6a) indicating a statistically similar rate of activity in presence of the CTX peptide, both when surface-bound to nanoprobe or in its independent molecular form. However, transwell migration studies indicated a marked increase in functional inhibition of glioma invasion by the NPC over the free peptide (Figure 6c and 6d). The immunohistochemistry study further showed that while NPC significantly reduced the MMP-2 surface expression, the total MMP-2 expression in cells remained comparable to that of cells treated with free CTX (Figures 7a and 7b). Additionally, through electron micrographic examinations of C6 cells post treatment with NPC or CTX (Figure 5 and S2) we observed the internalization of significantly larger nanoparticle-bearing endosomes than those observed in cells treated with free CTX. Combined, these results indicate that the enhanced effects of CTX bound to the nanoparticle surface compared to free CTX is due primarily to increased internalization of lipid rafts that contain both MMP-2 and ion channels rather than increased MMP-2 inhibition activity of the NPC.
Upregulation and activity of MMP-2 has been observed not only in brain tumors but also in cancers of the breast, colon, skin, lung, prostate, ovaries and a host of others.[29] Furthermore, the increased levels appear to correlate very closely with advanced tumor stage, increased invasion and metastasis, and shortened survival.[29,30] CTX affinity to tumor cells appear to also correlate similarly with MMP-2 expression.[19,20,22] This correlation is highly advantageous from a clinical stand point, because it creates an opportunity to target and treat the vast majority of solid cancers by attacking their most aggressively growing and invasive portions, including metastases. Additionally, with combined imaging capability and therapeutic effects, this CTX-enabled nanoparticle can be potentially used for both non-invasive diagnosis and treatment of a variety of tumors.
4. Experimental Section
Materials
All chemicals were obtained from Sigma-Aldrich (St. Louis, MO) and cell culture reagents from Invitrogen (Carlsbad, CA) unless otherwise noted.
Synthesis of nanoparticle-PEG-CTX (NPC) and CTX-AlexaFluor 680 (CTX-AF680)
Iron oxide nanoparticles were surface-modified with a poly(ethylene glycol) (PEG) silane to present a terminal amino group. Alexa Fluor 680 (AF680; Invitrogen, Carlsbad, CA), and chlorotoxin peptides (CTX; Alamone Labs, Jerusalem, Israel) were subsequently attached to the terminal amine groups of the PEG-modified nanoparticles, as previously reported.[23] It was determined that 10.2 peptides and 1.22 fluorophores were bound to each nanoparticle.[23] Furthermore, it was determined that the AF680 labeled nanoparticles displayed the same number of peptides as the non-fluorescently labeled nanoprobe, and the fluorophore presence did not enhance or diminish C6 cell uptake. Nanoparticles coated with PEG but not CTX were also prepared to serve as control (denoted as NP).
Cell culture and transfection
C6 rat glioma cells (ATCC; Manassas, VA) were cultured in DMEM medium supplemented with 1% streptomycin/penicillin and 10% fetal bovine serum. Enhanced green fluorescent protein (EGFP) expressing C6 cells were produced by transfecting cells with the pEGFP-N1 plasmid DNA (Clontech Laboratories, Inc. Mountain View, CA.) using the Effectene transfection reagent (Qiagen; Valencia, CA) following the manufacturer's protocol. Post transfection stably expressing GFP+ cells were selected through a two-tiered process. First, 48 hrs post transfection GFP+ cells were isolated using a FACS Vantage cell sorter (BD Sciences; Franklin Lakes, NJ). Second, GFP+ cells isolated through sorting were further purified, chemically, by treating the cells for two weeks in media supplemented with G-418 Sulfate (1 mg ml-1; A.G. Scientific Inc., San Diego, CA). The transfection efficiency of the population was determined to be greater than 90% (data not shown) using a BD FACSCanto flow cytometer (BD Sciences).
AlamarBlue reagent based cell viability study
The effect of NP, NPC, and CTX on the viability of C6 glioma cells was determined by the Alamar blue viability study. Cells were treated with cell culture medium containing CTX (3000 nM), NPC (150 μg of Fe ml-1), NP (150 μg of Fe ml-1), or no agent at all, for 48 hrs at 37°C in humidified incubator maintained at 5% CO2. After incubation cells were washed with Phosphate Buffered Saline pH 7.2 (PBS) and incubated for 1 hr with 10% Alamar blue (Invitrogen; Carlsbad, CA) in phenol-free DMEM (with 10% FBS and 1% antibiotic-antimycotic). The percent reduction of Alamar blue was determined using the manufacturer's protocol.
Iron based quantification of nanoparticle uptake by C6 cells
For nanoparticle uptake experiments 500,000 C6 cells/well were seeded in 12-well plates and grown for 24 hrs at 37°C in a humidified atmosphere with 5% CO2. Cells were washed with PBS and incubated in cell culture medium containing NP, NPC or no agent at all. Uptake assays were conducted at varying doses (n = 6 for each treatment) for 2 hrs at 37°C. Post-incubation unbound nanoparticles were removed through three successive washes with PBS. For analysis cell samples in 12-well plates were lysed with 300 μl 50 mM NaOH, vortexed for 30 seconds, and neutralized with 300 μl 10 mM HCl. To determine cell number, 6 μl of cell lysate solution was added to 300 μl Bio-Safe Coomassie Blue reagent (BIO-RAD) and incubated for 10 minutes at room temperature. Absorbance was measured at 595 nm on a Spectra Max microplate reader, and cell numbers were determined using a standard curve. To determine iron content, 300 μl of iron-releasing reagent (0.7 M HCl, 2.25% KMnO4 in DI H2O) was added to 300 μl of the cell lysate solution and incubated for 2 hrs at 60°C. The samples were cooled to room temperature and 90 μl of the ferrozine solution (1 M ascorbic acid, 2.5 M ammonium acetate, 6.5 mM ferrozine, 0.135% neocuproine in DI H2O) was added. The samples were incubated for 30 minutes at room temperature, and the absorbance at 562 nm was measured on a Spectra Max microplate reader. The values were fit to a standard curve and normalized to iron content per cell.
Magnetic resonance imaging (MRI)
Cell samples incubated with NP, NPC, or no contrast agent at all, were prepared as described above and evaluated by MRI. Phantom samples were prepared by suspending 106 cells in 50 μL of 1% low-melting agarose (BioRad; Hercules, CA). Cell suspensions were then loaded into a pre-fabricated 12-well agarose sample holder and allowed to solidify at 4°C. MR images were acquired using a 4.7-T Varian MR spectrometer (Palo Alto, CA) and a Bruker Medical Systems magnet (Karlsruhe, Germany) equipped with a 5 cm volume coil. A spin-echo multisection pulse sequence was selected. A repetition time (TR) of 3000 msec and variable echo times (TE) of 15-90 msec were used, to ensure samples were fully relaxed between pulses. The spatial resolution parameters were as follows: an acquisition matrix of 256 × 128, field of view of 4 × 4 cm, section thickness of 1 mm, and 2 averages. Regions of interest (ROIs) of 5.0 mm in diameter were placed in the center of each sample image to obtain signal intensity measurements using NIH ImageJ. T2 values were obtained using a built-in Varian macro, “t2” fit program, to generate a T2 map of the acquired images. The transverse relaxation rate R2 or 1/T2 values were calculated using the obtained T2 values to examine the correlation of R2 with the degree of nanoparticle uptake by cancer cells.
Flow cytometry
Quantitative uptake of NPC-AF680 vs. CTX-AF680 was analyzed through flow cytometry. For these experiments 500,000 C6 cells/well were seeded in 12-well plates and grown for 24 hrs at 37°C in a humidified atmosphere with 5% CO2. Cells were then washed with PBS, and incubated with complete cell culture medium (10% FBS) containing NP, NPC-AF680, CTX-AF680, or no agent at all for 2 hrs at 37°C. Uptake assays were conducted at doses described in the results section. Post-incubation, cells were washed of unbound agents with PBS thrice, trypsinized, and then resuspended in 2% FBS (in PBS). Flow cytometry analysis was performed on a BD LSR II; data analysis was performed with the FlowJo software package. A minimum of 10,000 cells was counted for each sample and an n = 3 were evaluated for each treatment.
Evaluation of NPC-AF680 and CTX-AF680 intracellular localization
One million C6 cells were plated on 24 mm glass cover slides and grown for 24 hrs at 37°C in a humidified atmosphere with 5% CO2. Cells were washed with PBS, and incubated with cell culture medium containing NP-AF680, NPC-AF680, or CTX-AF680, or with no agent at all, for 2 hrs at 37°C. Post-incubation cells were washed with PBS thrice, and fixed in a 4% formaldehyde/PBS solution (methanol free, Polysciences inc. Warrington, PA) for 30 min. The fixative was then removed and cells washed again with PBS thrice. The membranes were then labeled with wheat germ agglutinin-AlexaFluor 594 (WGA-AF594; Invitrogen, Carlsbad, CA) according the manufacturer's instructions. The slides were then incubated with DAPI-containing Prolong Gold antifade solution (Invitrogen Inc. Carlsbad, CA) for cellular nuclei staining and fluorescence preservation.
Z-stacked fluorescence microscopy
Z-stacked fluorescence imaging was utilized to determine the localization of CTX-AF680, NPC-AF680, and NP-AF680 in C6 cells. Images were obtained on a DeltaVision deconvolution microscope equipped with DAPI, TRITC, and Cy5 filters (Applied Precision, Issaquah, WA). 2D projections and 3D images were constructed using the DeltaVision SoftWorx program (Applied Precision, Issaquah, WA).
Transmission electron microscopy (TEM)
One million C6 cells were seeded and grown on 25 cm2 flasks for 24 hrs at 37°C in a humidified atmosphere with 5% CO2. Cells were then incubated in cell culture medium containing either NPC (3000 nM CTX equivalence) or CTX (3000nM) for 2 hrs. Then cells were washed thrice with PBS and incubated with ice cold Karnovsky's fixative for 24 hrs. Following fixation, the cells were processed directly from flasks for sectioning. Cell sections were stained with osmium tetroxide, lead citrate, and uranyl acetate for TEM-contrast enhancement. Cell samples were then imaged with a Philips CM100 TEM at 100kV with a Gatan 689 digital slow scan camera.
Gelatinase activity assay
Gelatinase activity of pure human MMP-2 incubated with NP, NPC, or CTX, or left untreated, was determined using the MMP Gelatinase activity kit (Millipore; Billerica, MA) following the manufacturer's protocol. CTX (3000 nM), NPC (CTX equivalence), and NP (Fe equivalence) were incubated with p-Aminophenylmercuric Acetate (APMA) activated MMP-2 provided in the kit for 30 min at 37°C. After incubation 100 μl of each sample was analyzed for MMP-2 gelatinase activity as described by the manufacturer (n = 6 per treatment).
Transwell migration assay
Cellular migration was tested for CTX evaluation. Matrigel invasion chamber inserts (BD Biosciences) were rehydrated according to the manufacturer's instructions. The inserts consisting of 8 μm pore size membranes were washed twice with PBS, blocked for 1 hr with 1% bovine serum albumin (BSA) in PBS, and washed twice with PBS. The inserts were kept in migration assay buffer (serum-free DMEM, with 0.1% BSA) until cell seeding. The transwell membrane was then placed into 24 cell-culture plate wells containing FBS as a chemo- attractant. 1.25 × 10⁶ GFP-expressing C6 cells/well were then plated on the upper chamber and incubated with NP, NPC, or CTX, or left without treatment in a humidified incubator maintained at 37°C and 5% CO2 for 24 hrs. Non-invading cells were scrubbed off the upper membranes, while invading cells on the lower membrane were fixed with 4% formaldehyde and stained using the Diff-Quick stain kit (International medical equipment inc., San Marcos, CA). The membranes of the inserts were detached from the invasion chambers for optical and fluorescence imaging. Bright field images were acquired using a Nikon TE2000 inverted microscope (Melville, NY). The membranes were mounted on glass slides using ProLong Gold antifade reagent, and their fluorescent images were acquired using a Zeiss LSM 510 Meta microscope (Peabody, MA). Relative inhibition of cell invasion was determined by dividing the number of the cells in the presence of CTX, NPC, or NP by the number of the cells without treatment. Triplicates of each sample were prepared and cell counts were obtained from five random spots on each insert. Data was averaged and presented as percentage of inhibition of invasion per treatment.
MMP-2 immunofluorescence staining
Cell surface and total MMP-2 levels were qualitatively evaluated through MMP-2 immunofluorescence staining. 105 C6 cells were plated on 24 mm glass cover slips and grown for 24 hrs at 37°C in a humidified atmosphere with 5% CO2. Cells were then incubated in cell culture medium containing NP, NPC, CTX, or no agent at all for 2 hrs at 37°C. Post-incubation cells were washed with PBS thrice, and fixed in a 4% formaldehyde/PBS solution (methanol free; Polysciences Inc., Warrington, PA) for 15 min. The fixative was then removed, and the cells washed three times with PBS. Cell samples were then immersed for 1 hr at room temperature in a blocking buffer of PBS containing 5% Goat serum (Jackson ImmunoResearch Laboratories, West Grove, PA) and 0.3% Triton X-100 (for “total MMP-2” samples). Cells were then incubated with a primary antibody against MMP-2 (Millipore; Billerica, MA), diluted to 1:500 in blocking buffer, overnight at 4°C. Cells were then rinsed with blocking buffer thrice and reacted with Cy2-labled goat anti-Rabbit IgG secondary antibodies (Jackson ImmunoResearch Laboratories) according to the manufacturer's instructions. Post-MMP-2 immunofluorescence staining, the membranes and nuclei were stained as described above. Samples were imaged using a Zeiss LSM 510 Meta confocal fluorescence microscope (Peabody, MA).
Morphology assessment for volume regulation study
2 × 10⁴ C6 cells were plated on 24 mm glass cover slips and grown for 24 hrs at 37°C in a humidified atmosphere with 5% CO2. Cells were then washed with PBS and incubated in cell culture medium containing CTX (3000 nM), NPC (CTX equivalence), NP (Fe equivalence of NPC), or no agent at all, for 24 hrs at 37°C. After incubation the unbound nanoparticles were washed away with PBS thrice, and cells were fixed and stained with WGA-AF594 and DAPI as described above. Cell morphology was examined by fluorescence and differential interference contrast (DIC) microscopy using a Zeiss LSM 510 Meta confocal fluorescence microscope (Peabody, MA).
Statistical analysis
The data were expressed as mean +/- standard deviation (s.d.) of the mean. Statistical significance in cell viability studies were determined using one-way analysis of variance (ANOVA). For all other statistical significance analysis student's t-tests were used. We considered a P value < 0.05 as statistically significant.
Supplementary Material
Acknowledgments
This work is supported by NIH grants (NIH/NCI 5R01CA9408, and 5R01CA112350-02 We would like to acknowledge NIH training grant (T32GM065098) for J.W.G, and NCI/NSF IGERT and Ford Motor Company fellowships for support of OV and CS respectively. We would also like to thank Ni Mu for her laboratory assistance. Additionally, we would like to acknowledge the use of resources at the Diagnostic Imaging Sciences Center (DISC), and Keck microscopy imaging facilities at the University of Washington.
Footnotes
Supporting Information is available on the WWW under http://www.small-journal.com.
References
- [1].Brigger I, Dubernet C, Couvreur P. Adv. Drug Delivery Rev. 2002;54:631–651. doi: 10.1016/s0169-409x(02)00044-3. [DOI] [PubMed] [Google Scholar]
- [2].Nie SM, Xing Y, Kim GJ, Simons JW. Annu. Rev. Biomed. Eng. 2007;9:257–288. doi: 10.1146/annurev.bioeng.9.060906.152025. [DOI] [PubMed] [Google Scholar]
- [3].Zhao M, Beauregard DA, Loizou L, Davletov B, Brindle KM. Nat. Med. 2001;7:1241–1244. doi: 10.1038/nm1101-1241. [DOI] [PubMed] [Google Scholar]
- [4].Weissleder R, Moore A, Mahmood U, Bhorade R, Benveniste H, Chiocca EA, Basilion JP. Nat. Med. 2000;6:351–354. doi: 10.1038/73219. [DOI] [PubMed] [Google Scholar]
- [5].Jun YW, Huh YM, Choi JS, Lee JH, Song HT, Kim S, Yoon S, Kim KS, Shin JS, Suh JS, Cheon J. J. Am. Chem. Soc. 2005;127:5732–5733. doi: 10.1021/ja0422155. [DOI] [PubMed] [Google Scholar]
- [6].Bulte JWM, Douglas T, Witwer B, Zhang SC, Strable E, Lewis BK, Zywicke H, Miller B, van Gelderen P, Moskowitz BM, Duncan ID, Frank JA. Nat. Biotechnol. 2001;19:1141–1147. doi: 10.1038/nbt1201-1141. [DOI] [PubMed] [Google Scholar]
- [7].Weissleder R. Science. 2006;312:1168–1171. doi: 10.1126/science.1125949. [DOI] [PubMed] [Google Scholar]
- [8].Wrensch M, Minn Y, Chew T, Bondy M, Berger MS. J. Neurooncol. 2002;4:278–299. doi: 10.1093/neuonc/4.4.278. [DOI] [PMC free article] [PubMed] [Google Scholar]
- [9].Giese A, Bjerkvig R, Berens ME, Westphal M. J. Clin. Oncol. 2003;21:1624–1636. doi: 10.1200/JCO.2003.05.063. [DOI] [PubMed] [Google Scholar]
- [10].Miller CR, Perry A. Arch. Pathol. Lab. Med. 2007;131:397–406. doi: 10.5858/2007-131-397-G. [DOI] [PubMed] [Google Scholar]
- [11].Rao JS. Nat. Rev. Cancer. 2003;3:489–501. doi: 10.1038/nrc1121. [DOI] [PubMed] [Google Scholar]
- [12].McFerrin MB, Sontheimer H. Neuron Glia Biol. 2006;2:39–49. doi: 10.1017/S17440925X06000044. [DOI] [PMC free article] [PubMed] [Google Scholar]
- [13].Bjorklund M, Koivunen E. Biochim. Biophys. Acta -Rev. Cancer. 2005;1755:37–69. doi: 10.1016/j.bbcan.2005.03.001. [DOI] [PubMed] [Google Scholar]
- [14].Nakada M, Nakada S, Demuth T, Tran NL, Hoelzinger DB, Berens ME. Cell. Mol. Life Sci. 2007;64:458–478. doi: 10.1007/s00018-007-6342-5. [DOI] [PMC free article] [PubMed] [Google Scholar]
- [15].Demuth T, Berens ME. J. Neurooncol. 2004;70:217–228. doi: 10.1007/s11060-004-2751-6. [DOI] [PubMed] [Google Scholar]
- [16].Sathornsumetee S, Reardon DA, Desjardins A, Quinn JA, Vredenburgh JJ, Rich JN. Cancer. 2007;110:13–24. doi: 10.1002/cncr.22741. [DOI] [PubMed] [Google Scholar]
- [17].Coussens LM, Fingleton B, Matrisian LM. Science. 2002;295:2387–2392. doi: 10.1126/science.1067100. [DOI] [PubMed] [Google Scholar]
- [18].Soroceanu L, Manning TJ, Sontheimer H. J. Neurosci. 1999;19:5942–5954. doi: 10.1523/JNEUROSCI.19-14-05942.1999. [DOI] [PMC free article] [PubMed] [Google Scholar]
- [19].Deshane J, Garner CC, Sontheimer H. J. Biol. Chem. 2003;278:4135–4144. doi: 10.1074/jbc.M205662200. [DOI] [PubMed] [Google Scholar]
- [20].Lyons SA, O'Neal J, Sontheimer H. Glia. 2002;39:162–173. doi: 10.1002/glia.10083. [DOI] [PubMed] [Google Scholar]
- [21].Soroceanu L, Gillespie Y, Khazaeli MB, Sontheimer H. Cancer Res. 1998;58:4871–4879. [PubMed] [Google Scholar]
- [22].Veiseh M, Gabikian P, Bahrami SB, Veiseh O, Zhang M, Hackman RC, Ravanpay AC, Stroud MR, Kusuma Y, Hansen SJ, Kwok D, Munoz NM, Sze RW, Grady WM, Greenberg NM, Ellenbogen RG, Olson JM. Cancer Res. 2007;67:6882–6888. doi: 10.1158/0008-5472.CAN-06-3948. [DOI] [PubMed] [Google Scholar]
- [23].Veiseh O, Sun C, Gunn J, Kohler N, Gabikian P, Lee D, Bhattarai N, Ellenbogen R, Sze R, Hallahan A, Olson J, Zhang M. Nano Lett. 2005;5:1003–1008. doi: 10.1021/nl0502569. [DOI] [PubMed] [Google Scholar]
- [24].Sun C, Veiseh O, Gunn J, Fang C, Hansen S, Lee D, Sze R, Ellenbogen RG, Olson J, Zhang M. Small. 2008;4:372–379. doi: 10.1002/smll.200700784. [DOI] [PMC free article] [PubMed] [Google Scholar]
- [25].Morgunova E, Tuuttila A, Bergmann U, Isupov M, Lindqvist Y, Schneider G, Tryggvason K. Science. 1999;284:1667–1670. doi: 10.1126/science.284.5420.1667. [DOI] [PubMed] [Google Scholar]
- [26].Montet X, Funovics M, Montet-Abou K, Weissleder R, Josephson L. J. Med. Chem. 2006;49:6087–6093. doi: 10.1021/jm060515m. [DOI] [PubMed] [Google Scholar]
- [27].Weissleder R, Kelly K, Sun EY, Shtatland T, Josephson L. Nat. Biotechnol. 2005;23:1418–1423. doi: 10.1038/nbt1159. [DOI] [PubMed] [Google Scholar]
- [28].Rouzaire-Dubois B, Milandri JB, Bostel S, Dubois JM. Pflugers Arch. 2000;440:881–888. doi: 10.1007/s004240000371. [DOI] [PubMed] [Google Scholar]
- [29].Egeblad M, Werb Z. Nat. Rev. Cancer. 2002;2:161–174. doi: 10.1038/nrc745. [DOI] [PubMed] [Google Scholar]
- [30].Turpeenniemi-Hujanen T. Biochimie. 2005;87:287–297. doi: 10.1016/j.biochi.2005.01.014. [DOI] [PubMed] [Google Scholar]
Associated Data
This section collects any data citations, data availability statements, or supplementary materials included in this article.


