Abstract
In the osteoblast 2T3 cell model, 326 genes significantly increase in expression as subconfluent fibroblastic 2T3 cells become confluent and cuboidal. This gene set includes BMP2/4, Dlx2/5, Runx2, Osterix and Lrp5, as well as TGFβ regulated genes. Both activated or total nuclear Smad158 and Smad2 levels increase as they become confluent, and β-catenin protein expression increases as 2T3 cells become confluent, reflecting a set of genes involved in early preosteoblast to osteoblast commitment, as observed in vitro and in vivo. Gene Set Enrichment Analysis (GSEA) demonstrated that this 326 dataset is very similar to several early osteoblast geneset signatures. The MLO-Y4 cell model is a well-known in vitro osteocyte model. The MLO-Y4 expression pattern was directly compared with the 2T3 osteoblast cell model. 181 genes that are highly expressed in MLO-Y4 osteocytes compared to osteoblasts were identified. Very few genes expressed in MLO-Y4 cells are found in osteocytes directly isolate from bone, suggesting that osteocyte specific gene programs most likely require the osteocytes to be embedded in the proper mineralized matrix. The MLO-Y4 dataset includes few established in vivo osteocyte markers, but does include several transcription factors such as Vitamin D receptor, Tcf7, and Irx5, whose expression was confirmed in osteocytes in vivo. Gene expression signatures in MLO-Y4 cells, as determined by functional clustering and interaction maps, suggest active prostaglandin-PKA pathways, genes involved in dendrite formation, acute/defense response pathways, TGFβ signaling, and interferon/chemokine pathways. GSEA demonstrated that MLO-Y4 expression pattern is similar to macrophages, mesenchymal fibroblasts, and early osteoblasts.
Keywords: Osteoblast commitment, MLO-Y4 cell line, Gene expression signatures, Literature interaction maps, Functional clustering, In vivo expression
Introduction
The characteristic transition of a preosteoblast cell in vivo from its fibroblast like morphology to the bone associated early osteoblast with a cuboidal nature is one of the most pronounced morphological transitions observed in bone for the osteoblast lineage. In the bone marrow per se, it is difficult to tell this early preosteoblast from other stromal and fibroblastic appearing cells. Some of the key markers for this transition observed in vivo, are the increased expression of BMP2 and BMP4, Dlx5, osterix, ptch1, Tcf1 and related members, and collagen type 1a1 [55].
2T3 osteoblast cells were established from transgenic mice expressing the BMP2 promoter driving the SV-40 T antigen [10]. The formation of mineralized nodules in these cells is accelerated with the addition of BMP2 and follows the same differentiation pathway as primary osteoblasts [11,12]. The 2T3 cells are clonal, and all behavior is derived from a single cell. Gene expression profiles in 2T3 cells have been determined on a limited basis for early BMP2 induced and repressed genes, from 1 h to 15 days [13]. One of the early BMP2 responsive genes is Osterix, and using a dominant negative Dlx5 retrovirus, BMP2 induced osterix was shown to depend on one or more Dlx transcription factors [12]. When subconfluent-fibroblastoid like 2T3 cells were compared to confluent-cuboidal 2T3 cells, a 10 fold increase in osterix expression was found. This in vitro phenomenon was analogous to in vivo conditions when the early spindle and fibroblastoid cells in the bone marrow first attach to the bone surface, become cuboidal like and turn on Osterix [14]. The gene expression signatures as 2T3 cells become confluent could give insights into the process of this early osteoblast commitment in vivo.
Osteocytes on the other hand are the most abundant cells in bone, and derived from osteoblasts. They are connected with each other and cells on the bone surface through dendritic processes. They form large cellular networks or syncytium of connected cells within the mineralized matrix [1]. Mechanical strain in bone, translated into biological signals of resorption or formation, is thought to be one function of osteocytes. The signals derived by mechanical stimulation of osteocytes regulate the overall metabolism of cells in bone tissue [2–4]. Recent studies on conditional ablation of osteocytes in vivo, using osteocyte specific expression of the diphtheria toxin receptor and postnatal administration of diphtheria toxin, demonstrate that the osteocyte is required for proper maintenance of bone homeostasis, controls bone quality and is a key component of the mechanosensory apparatus in bone [5].
The MLO-Y4 cell line is an ideal model for mechanical loading studies in vitro because of its osteocyte-like characteristics [6]. MLO-Y4 cells respond to mechanical loading signals, similar to primary osteocytes from chick [7].
In MLO-Y4 cells, PGE2 is involved in the effects of fluid flow induced shear stress on intercellular communication. MLO-Y4 cells produce high levels of PGE2 at low density and low levels of connectivity. This is due to the opening of connexin 43 hemichannels in non-connected states [8]. The MLO-Y4 cells are an excellent model for studying Cx43 function and their relationship to other signaling pathways [9].
Thus, a comparison of gene expression signatures of MLO-Y4 and 2T3 cells was carried out, with expression patterns compared at two different densities for both models. After statistical evaluation of the datasets, several functional classes of genes specific to MLO-Y4 were found, as well as a set of genes that defines components of early stages of osteoblast commitment. These functional subsets of genes were then organized into several interactive pathways. Comparison of the gene expression pattern in MLO-Y4 cells and 2T3 cells confirmed several aspects of the pathway models. Several of the unique expression patterns found in vitro were validated in bone in vivo.
Materials and methods
Cell culture
2T3 cells were cultured in α-MEM supplemented with 7% FBS and incubated in a 5% CO2 incubator at 37 °C [15]. Five independent T-150 flasks with cells at 70% confluency were collected for RNA. The second set of five independent T-150 flasks was continued for another two days and then collected when the cells reached confluency.
MLO-Y4 cells were grown in α-MEM supplemented with 2.5% FBS and 2.5% CS. The cells were incubated in 5% CO2 at 37 °C and cultured on collagen-coated (rat tail collagen type I, 0.15 mg/ml) surfaces. Ten separate T-150 flasks were collected when the cells were sparsely connected and five separate flasks collected when the cells were highly connected (Fig. 1).
Fig. 1.
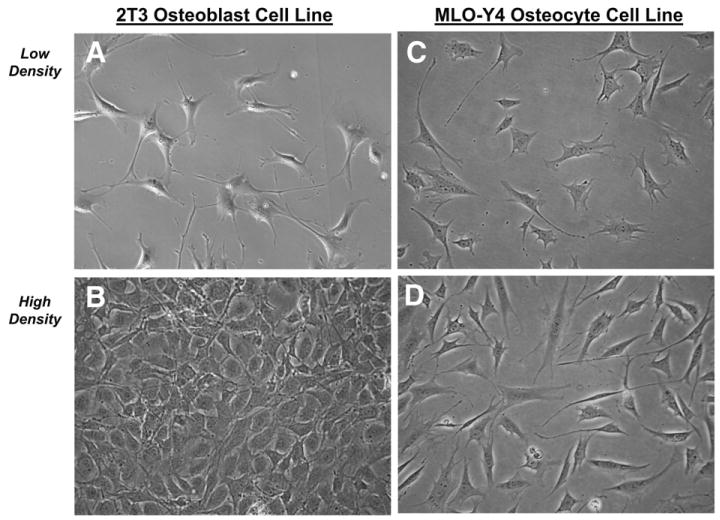
2T3 and MLO-Y4 cell phenotypes for microarray RNA collection. A, 2T3 cells at 70% confluent (2T3 at low density) represent pre-osteoblast fibroblastoid state, that expressed extensive filipodia, similar to MLO-Y4 dendritic processes; B, 2T3 cells at confluency, that represent cuboidal early osteoblasts; C, MLO-Y4 cells with sparse connections between cells (MLO-Y4 at low density); D, MLO-Y4 cells with high level of connections (MLO-Y4 at high density).
mRNA isolation and microarray hybridization
Total RNA was extracted using RNA-Bee reagent (Tel-test, Friendswood, TX, USA). Cells were lysed in RNA-Bee. After phase separation with chloroform, the aqueous phase was precipitated with isopropanol, centrifuged and washed with 80% ethanol. PolyA+ RNA was prepared using oligo dT cellulose columns. cDNA synthesized from polyA+ RNA was labeled with P33 and hybridized to the 5K (5002 mouse genes represented as 80-mer-oligonucleotide) mouse microarray gene chips from Clontech, BD Biosciences, Palo Alto, CA. The GEO platform is GPL151. Microarray hybridization experiments were repeated three times in each group to evaluate statistical significance of the major findings. RNA samples were pooled from the 5 independent flasks for each cell line and each density.
Microarray analysis of gene expression between 2T3 osteoblast and MLO-Y4 Osteocyte-like cell Line
After cDNA hybridization and washes, TIF images of the arrays were first captured by a phosphorimager, Cyclone Storage Phosphor System (PerkinElmer), using Super Resolution Type SR screen Optiquant. A data set of intensity of all image features was captured and quantified using AtlasImage 2.7 beta.
Hybridization signals that were at least 1.7 times background and greater than 2 standard deviations of the background variance were studied for further analysis. After background subtraction, global intensity was used to normalize the data set.
Genes that change as a result of confluency of the cells
2T3 and MLO-Y4 array data were first analyzed as separate sets. 1813 genes from the 2T3 set and 1458 genes from the MLO-Y4 set were initially selected out of the 5002 genes that were presented on the Clontech chip. From the three independent data sets per cell type or state, SAM (Significance Analysis of Microarrays; http://www-stat.stanford.edu/∼tibs/SAM/) was used to statistically analyze the data and to permute data for multiple testing hypotheses. Genes with a high variance were first eliminated, as allowed in SAM analysis [16]. From the 2T3 set, 326 rank-ordered genes with a FDR (False Discovery Rate) <1% were selected for further analysis. From the MLO-Y4 set, 181 rank-ordered genes with a FDR <1% were selected. This rigorous analysis allows visualization of gene expression signatures that are selectively expressed at either density of the 2T3 cells (subconfluent and confluent), or the MLO-Y4 cells (low and high connectivity).
Genes that change between MLO-Y4 cells and 2T3 cells, irrespective of cell density
A common set of genes expressed in both 2T3 and MLO-Y4 cells was first selected. This gene set included 2051 genes. A four way pairwise comparison was used to find the statistically significant gene set that represents genes that are either overexpressed or under-expressed in either 2T3 cells or MLO-Y4 cells, irrespective of the density. A gene set of 638 genes fits this category. Of the 638 gene set, 181 genes were selectively overexpressed in MLO-Y4 cells and served as the gene set to derive the MLO-Y4 gene expression signatures.
Northern analysis
PolyA+ RNA (1–2 μg) was run on standard formaldehyde agarose gels and transferred to a Nytran Plus (Whatman Schleicher & Schuell, Sanford, Me, USA) membrane, as previously described [11].
Cluster analysis and functional classification
Initial cluster analysis was carried out using MEV (MultiExperimentViewer; http://www.tm4.org/mev.html) program supplied by TIGR (The Institute for Genomic Research). Logarithm base 2 transformation on data was used to produce continuous values and to treat up- and down-regulated genes in a similar way [17]. We used a K-median clustering algorithm with K=9 or K=12 to cluster gene profiles based on expression pattern similarity. We ran tests at K=8 to K=16 and found that above K=9 for 2T3 or K=12 for MLO-Y4 data, many clusters were becoming similar, and K=9 or K=12 was sufficient to capture the different trends in the data. All groups were compared to the 2T3 low density group as control and set at baseline (1.0).
NIH DAVID (Database for Annotation, Visualization and Integrated Discovery; http://apps1.niaid.nih.gov/david) [18] tools were used and well as EASE (The Expression Analysis Systematic Explorer http://david.niaid.nih.gov/david/ease.htm). The EASE score is similar to Fisher exact statistic test but more stringent. The EASE sore represents the lower boundary of all possible “jackknife” probabilities (a nonparametric method for estimating standard error of a statistic) and is considered more robust than the Fisher exact probability test [19].
Phospho-Smad1/5/8, Phospho-Smad2, and β-catenin immunocytochemistry in cells
MLO-Y4 and 2T3 cells were plated in 8-well plastic slide culture chambers in appropriate media. When the cells reached the appropriate density, they were fixed by washing with PBS, ice-cold 100% methanol, ice-cold 95% ethanol, ice-cold 70% ethanol, and then stored in 70% glycerol. For immunocytochemistry, cells were washed with PBS three times, then 0.3% hydrogen peroxide for 10 min to block the endogenous peroxidase, and washed again three times with PBS. After 30 min treatment with blocking solution (10% non-immune goat serum or NGS, 0.5% BSA, 1% NaN3) to block non-specific antibody binding, the cells were treated with primary Ab in blocking solution for 1 h. Phospho-Smad1/5/8 and Phospho-Smad2 were obtained from Cell Signaling Technology Inc. (Beverly, MA) and used at 1:50 dilution. β-catenin antibody was a gift from Dr. Feng at Baylor College of Dentistry and used at a dilution of 1:100. The cells were washed three times with PBST (0.05% Triton X-100 in PBS) and then treated with secondary Ab (a goat biotinylated rabbit IgG antibody) at 1:200 dilution in blocking solution for 1 h, followed by alkaline phosphatase (AP) conjugated avidin/biotin complex for 30 min, using VECTASTAIN ABC-AP kit (Vector Laboratories, Burlingame, CA). The AP was then developed using the Fast Red AP substrate (Roche Applied Science, Indianapolis, IN). Controls with each experiment with different antibodies were carried out by leaving out the primary antibody and showed no alkaline phosphatase staining under the above conditions. The red nuclear immunoreactivity was quantitated in 40–60 nuclei using ImageJ and the average and standard deviation were determined in Excel.
Mouse mandible sections
8 μm sections of the mouse mandible from 3 day postnatal mice were prepared from standard paraffin blocks, followed by xylene to deparaffinize and rehydration with a decreasing ethanol series to 70% and then water, for in vivo study by immunohistochemistry or in situ hybridization.
Phospho-Smad1/5/8 immunohistochemistry in bone
High temperature antigen retrieval method was used. The mouse mandibular sections were placed in 10 mM sodium citrate buffer and microwaved for 5 min to boiling, with 2 min at boiling, then washed in water three times, 3% hydrogen peroxide for 10 min, water three times and PBS for 5 min. All the other procedures were preformed the same as with the cells in culture, except 0.1% Tween20 was used instead of Triton X-100 in the PBS media and sections were reacted in primary antibody in blocking solution overnight. Control sections were stained in the same manner without use of primary antibody and showed no reaction under the above conditions.
In situ hybridization (ISH)
Digoxigenin-labeled complementary RNA probes were transcribed from linearized plasmids that encode Osterix, E11/GP38 (Pdpn), MCP3, Itm2B, NuPr1, Spp1, Sost, Vdr, Tcf7 and Irx5. ISH was performed on the mouse mandibular paraffin sections mainly as the method that previous described [20]. Hybridization signals were detected by anti-digoxigenin alkaline phosphatase conjugated antibody and alkaline phosphatase substrate (Boehringer Mannheim/Roche). In all ISH experiment with each different probe, control slides were run in parallel with each experiment by excluding the digoxigenin-labeled RNA probe. The bone sections were counterstained with diluted eosin (red-purple), where the blue color represents the mRNA signal.
Pathway analysis
The clusters from DAVID-EASE were first inspected for classes of functionally related genes. From these related functional classes, we constructed an initial candidate gene list for each given pathway. Genes from these functionally related categories were then organized into virtual pathways using PathwayAssist 3.0 (http://www.ariadnegenomics.com) based on literature references. These maps are referred to as Literature Interaction Maps.
Gene set enrichment analysis
Gene Set Enrichment Analysis (GSEA) was used to examine a variety of data sets from NCBI GEO database that may have enrichment of the same genes expressed in the MLO-Y4 gene set or in the 2T3 gene set [21].
Results
Fig.1 shows the typical morphology of both MLO-Y4 cells and 2T3 cells at their specific densities used in these studies. All raw microarray data and sample sets for this study can be found at NCBI with the GEO accession number GSE2234 that represents the N=3 for each cell line or state (total of 12 samples). After SAM analysis [16], two gene sets were focused on for further analysis. One dataset includes 326 genes that represent the genes whose expression increase as 2T3 cells progress from fibroblastoid (low density) to a confluent state (high density). The second dataset with 181 genes represents the specific gene expression signatures for MLO-Y4 cells compared to 2T3 cells, irrespective of density. The datasets can be found organized in a table format with brief annotation of each gene, fold change, and active Web links to LocusLink/Entrez-Gene and other Bioinformatic tools (http://periodontics.uthscsa.edu/HarrisLab/dataBase/HarrisLab_database.htm. Supplementary results 1 — Functional classification (by DAVID-EASE) as noted above for both the osteoblast and osteocyte datasets). In the MLO-Y4 181 dataset, the values have been normalized to 2T3, low density, and all four values are presented in the table for each functional class. At the top of each list of functionally enriched GO (gene ontology categories, a link to a list of all 326 (2T3) or 181 (MLO-Y4) genes in alphabetic order with the fold changes indicated can be found.
The osteoblast 326 dataset represents part of an early osteoblast commitment gene program
Functional analysis of the 326 genes with GeneOntology (GO) categories indicates strong enrichment in transcription factor (TF) related GO categories (64 genes, E<0.000001), cell cycle-proliferation GO categories (32 genes), DNA replication GO category (8), skeletal development GO categories (8 genes, E<0.002), and 22 genes involved in phosphate metabolism (E<0.04). In this list of TFs, Dlx2, Twist, JunD, Atf1, Creb1, PPARg, thyroid hormone receptor α (Thrα) and others, suggest increases in osteoblast commitment and adipogenesis potential. β-catenin expression also increases 4 fold in confluent 2T3 cells. In the GO category of skeletal development, there are 8 genes, including the ankylosis (Ank) gene, BMP4, chordin, Enhancer of Split, Pleiotrophin, osteopontin, thyroid hormone receptor, and vitamin D receptor (E<0.002). Each GO category in this table format can be explored interactively and is linked to Entrez Gene at NCBI. Several literature linked networks or pathways were constructed from the functional classification data (see below). Standard K-median cluster analysis of the 2T3 326 dataset was first carried out (http://periodontics.uthscsa.edu/HarrisLab/dataBase/HarrisLab_database.htm. Supplementary results 2 — K-median cluster analysis (by TIGR_TM4): 2T3 osteoblast commitment). The heat maps for each of the 9 clusters can be obtained by clicking on the summary cluster graphs. Fig. 2 shows two examples, with clusters 3 and 4, showing only the gene symbol. Cluster 3 contains biglycan, BMP4, Creb-like 1 transcription factor, and the nuclear co-activator α3 (Ncoα3), suggesting alterations in the extracellular matrix and transcription. This is supported by the DAVID analysis, with GO category of extracellular matrix with an E<0.003. In this set of ECM proteins, decorin, biglycan, ecm1, colVa1, colVa3, pleiotrophin, glypican, mmp11, and timp2 can be found. Syndecan 2, a pleiotrophin receptor was also found. These results indicate that cuboidal 2T3 cells are reprogramming their ECM.
Fig. 2.
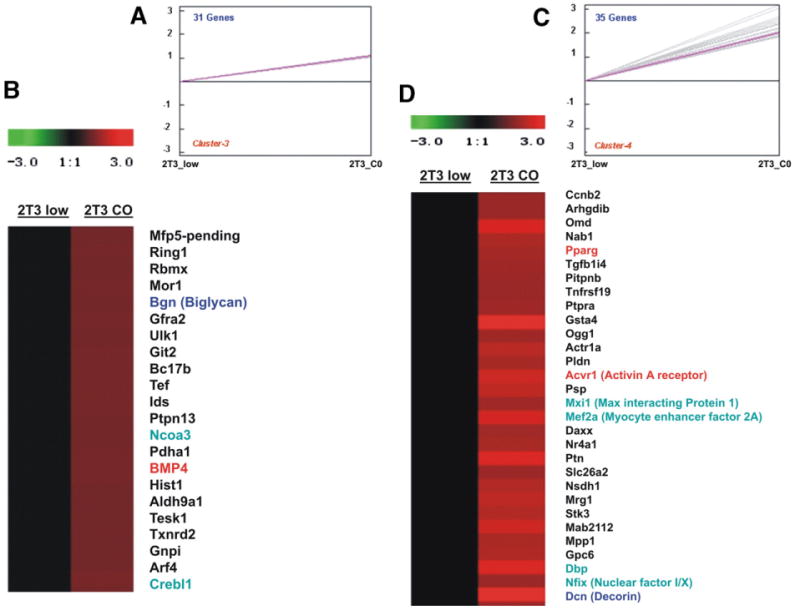
K-median clustering example with clusters 3 and 4, of genes that increase in expression in 2T3 osteoblasts at the cuboidal-confluent state. Gene expression intensities of 2T3 at low density (2T3_low) were normalized to 1 (in black), and the intensities of 2T3 at confluency (2T3_C0) were compared to the 2T3_low or fibroblastoid cells. Red represents increased expression and green represents decreased expression. A and C are the expression plot of clusters B and D respectively. The expression value is log2 transformed and only the gene symbol is shown. Several genes are highlighted for discussion The full dataset cluster diagrams, with gene annotation, and full expression values are at http://periodontics.uthscsa.edu/HarrisLab/dataBase/HarrisLab_database.htm. Supplementary results 2 — K-median cluster analysis (by TIGR_TM4): 2T3 osteoblast commitment.
With the suggestion that 2T3 cells were increasing gene expression involved in early osteoblast stages and adipogenesis, Northern analysis was undertaken to validate some of these observations, as well as explore other known early osteoblast markers. The 3 fold increase in BMP4 (Fig. 3B) and 2 fold increase Dlx2 (not shown) were confirmed. BMP2, Dlx5, Lrp5 (Wnt signaling), Runx2, and Osterix are also shown to increase as 2T3 cells become confluent (2 to 10 fold) as measured by the ratio of expression of the given gene to GAPDH expression (Y-axis of Fig. 3). Osterix expression increased 10 fold.
Fig. 3.
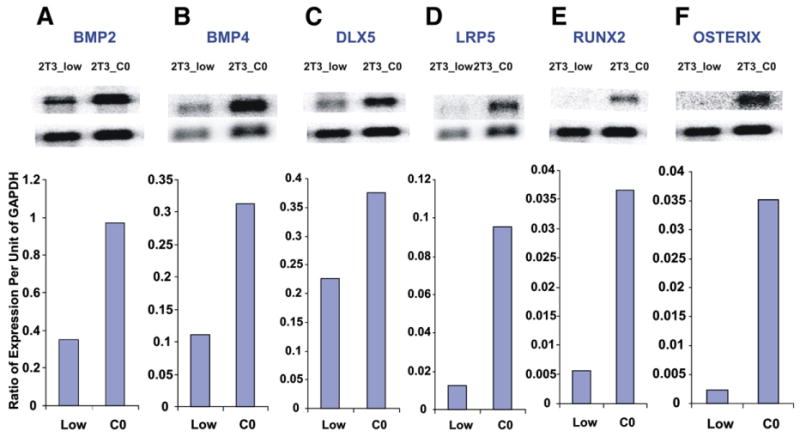
Validation of several of the gene expression changes from 2T3_low to 2T3_CO, by Northern analysis. The Y-axis is the ratio of expression of a given gene normalized to GAPDH expression. Each box shows the expression in low density (2T3_low) vs. confluent status (2T3_CO). A, BMP2; B, BMP4; C, DLX5; D, LRP5; E, Runx2; F, Osterix.
BMP and TGFBeta signaling may increase and β-catenin protein increase as 2T3 osteoblasts reach confluency
There is a 3 fold increase in nuclear localized phospho-Smad1/5/8 immunoreactivity (Fig. 4A, Panels a–c). This increase in nuclear staining could be due to a general increase in Smad158 protein or to activation of the Smad158, although nuclear localization suggests that it represents the activated state. Many BMP regulated genes are also found in the 326 dataset, such as osterix, BMP2, and BMP4, decorin, biglycan and others involved in BMP dependent alterations in the ECM.
Fig. 4.
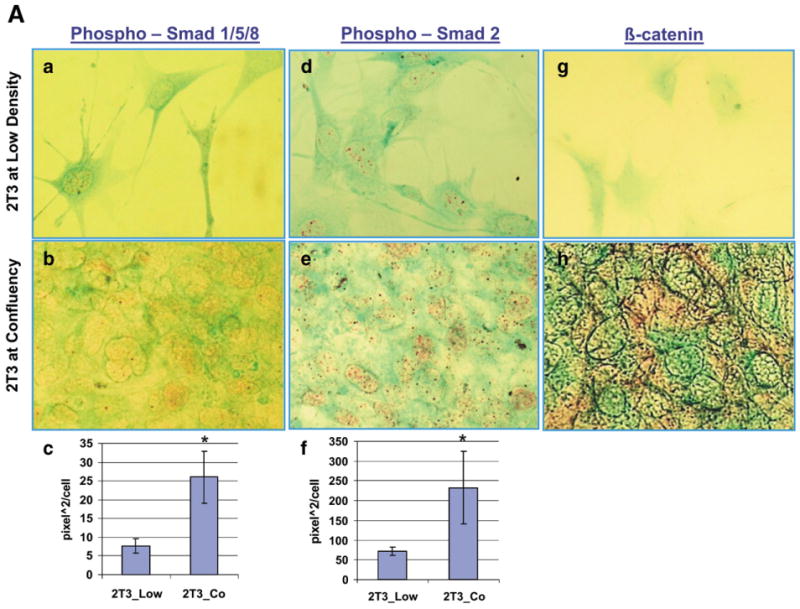
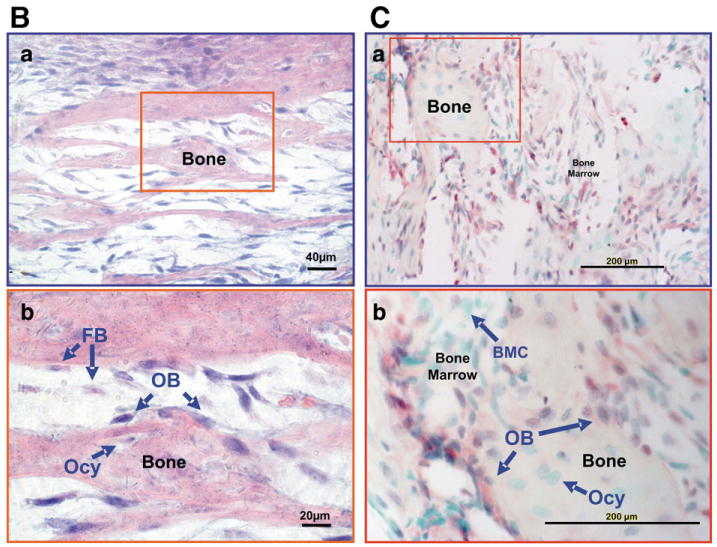
Phospho-Smad158 and Phospho-Smad2 immunoreactivity and β-catenin immunoreactivity increase as 2T3 osteoblasts reach confluency (2T3_CO). (4A) Panels a and b, Phospho-Smad1/5/8 immunoreactivity in 2T3 cells. a, fibroblastoid state; b, cuboidal-confluency state. Panel c, quantitation of the nuclear Phospho-Smad1/5/8 levels at the two states. Panels d and e, Phospho-Smad2 immunoreactivity in 2T3 cells. d, fibroblastoid state; e, cuboidal-confluency state; f, Quantitation of the Phospho-Smad2 nuclear immunoreactivity. Panels g and h, β-catenin immunoreactivity in 2T3 cells. g, fibroblastoid state; h, cuboidal-confluency stage. (4B) Osterix gene expression in bone and bone marrow of E18 mandible alveolar tissue by in situ hybridization (ISH). ISH was detected by alkaline phosphatase substrate (blue color). Panel a, 20×, Panel b, 40×. FB is fibroblastoid marrow cells, OB is rounded bone associated osteoblasts, and Ocy is osteocytes. (4C) Phospho-Smad1/5/8 immunohistochemistry in 3 day mandible alveolar bone. Panel b, BMC is the bone marrow cells, OB is bone associated osteoblasts, and Ocy is osteocytes. Immunohistochemical staining was developed with Roche Fast Red, and counterstained with light green.
Nuclear phosphor-Smad2 levels also increase 2 to 3 fold as the fibroblastoid cells become cuboidal, as shown in Panels d–f of Fig. 4A. Again this increase nuclear staining could represent increase signaling and/or increases in total Smad2 levels. However, many TGF beta induced genes are found in the 326 dataset, supporting that at least in part there is increased TGF beta signaling. For example, TIEG (TGFβ inducible early growth response, alias of KLF10) and TGFβ1i4 (transforming growth factor beta 1 induced transcript 4) transcripts, induced by TGFβ signaling [22], increase in expression as the 2T3 cells become confluent.
Β-catenin protein immunoreactivity also increased on confluency in this model (Fig. 4A — Panels g and h). Much of the increased β-catenin protein appears in the cytoplasm.
Osterix expression and Phospho-Smad1/5/8 levels in bone in vivo
In primary calvarial osteoblasts and cell models including 2T3, Osterix, Runx2, Lrp5 and Dlx5, are associated with the osteoblast commitment, and are also stimulated by BMP signaling [12,13,23,24]. BMP signaling and osterix expression were looked at in vivo. In Fig. 4B— Panels a and b, osterix expression is shown where expression is high in osteoblasts associating with the bone matrix. In the cells labeled FB for fibroblastoid marrow cells, the osterix signal appears less, but this is difficult to quantitate. Phospho-Smad1/5/8 immunoreactivity is low but detectable in the bone marrow cells (BMC) and increases in the more rounded bone associated osteoblasts, label OB, Fig. 4C—Panels a and b.
Pathway analysis and interaction maps in the 2T3 dataset
A subset of the 326 genes, plus several other genes from the Northern analysis was selected based on the functional associations with transcription and extracellular matrix. This set of 46 genes was then placed in Pathway Assist to construct an Interaction Map, based on the entire PubMed database (http://www.ariandegenomics.com). The connections in the pathways are established with active links to one or more references in PubMed. Fig. 5 shows this pathway-interaction map of this set of genes that increase in expression 1.5 to 10 fold in 2T3 cells as they become confluent. The purple line between two gene ovals indicates a link that supports the protein products bind to each other. An internet interactive copy of Fig. 5 can be found at http://periodontics.uthscsa.edu/HarrisLab/dataBase/HarrisLab_database.htm, Supplementary result 3—Pathway analysis, 2T3 commitment, in which the evidence for the association of the two genes can be found. For example if connected to the internet, clicking on the purple dot on the purple line will take you to the appropriate references supporting the binding properties of the two proteins. Similarly, a blue line with an arrow head (+) or a bar (−) indicates evidence that one gene affects, either positively or negatively, expression or activity of the other, either directly or indirectly. By clicking on the blue box on this blue line, one is connected to the references supporting the gene interaction. In the bottom left of Fig. 5 are the symbols for other type of interaction, as indicated, including phosphorylation, promoter binding, etc. This network map captures in an interactive format the relationship of several of the transcription factors, growth factors, and extracellular proteins whose expression increases as the 2T3 cell become confluent.
Fig. 5.
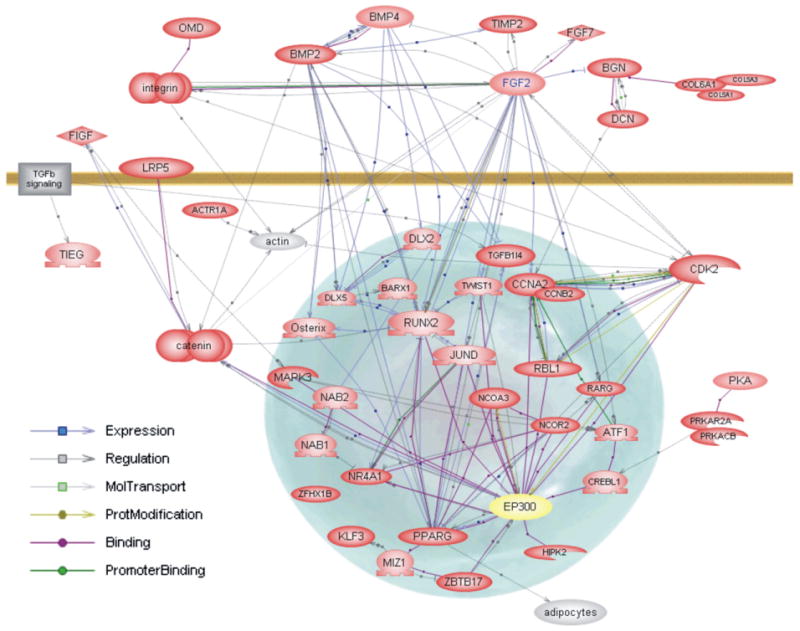
Literature interaction map of osteoblast early commitment network. Selected genes from the functional analysis that were significantly enriched in one or more functional classes were analyzed using PathwayAssist. The genes are actively linked to PubMed using a ResNet database and evidence for relationships can be accessed, with an Internet connection, using the maps on our web site, by clicking on the box that is on the line connecting two genes. A gray line (either solid or dotted) with arrow (+) or bar (−) with a gray box indicates that Gene A in some way interacts, regulates orcoordinately changes, with Gene B. A blue line with arrow or bar with a blue box indicates Gene A regulates expression of Gene B. A purple line with purple circle indicates that product of Gene A binds product of Gene B under some condition or that product of Gene A and Gene B has some similar property, such as binding a given antibody or DNA sequence. A light green line with green circle indicates the product of Gene A (i.e. a kinase) modifies product of Gene B in some way, e.g. phosphorylation. A dark green line with dark green circle indicates product of Gene A binds the promoter of Gene B. The official gene symbol is used to mark each gene that increases in the confluent state and is marked as a red oval. Genes in yellow ovals either do not change in expression or do not exist on the tested microarray chips, but are linked to important components of the pathway that do change in expression.
A network of 18 genes in the 326 dataset has been shown to bind with p300 (EP300) transcription co-activator-histone acetylase, suggesting that this important transcription modulator serves as a key node in osteoblast function. 10 secondary links are also shown. This interaction map and internet links can be found in the Supplementary results 3 — Pathway analysis: 2T3 osteoblast commitment, EP300 network.
Gene set enrichment analysis (GSEA) of the 2T3 confluent dataset
The 326 gene dataset plus the gene expression confirmed by Northern analysis were analyzed for statistically significant enrichment of gene expression patterns found in other public genesets from the NCBI GEO database. GSEA was used for the analysis [21]. Genesets are obtained from skin fibroblast, uncommitted mesenchymal cell line (C3H10T1/2), MC3T3 osteoblast model, primary early and late osteoblast dataset from purified col1a1-GFP cells (EOB and LOB) [25], and datasets of osteoclasts (OC), dendritic immune cells (DC), and macrophages (MACph). The NCBI associated GEO numbers are listed in Supplementary results 4 — GSEA, Table S1, Datasets from GEO. The results are shown in Table 1. C3H10T1/2 uncommitted mesenchyme gene expression was compared to 3.6 Col1a1-gfp mouse osteoblast (EOB) and ranked with the 2T3 326 dataset. The 2T3 dataset was highly enriched in genes and also expressed in C3H10T1/2 cells with a NES (Normalized Enrichment Score) of 1.57 and a FWER (Family Wise Error Rate) of <0.01. A NES of >1.0 or ≤1.0 and a FWER of <0.20 is considered highly significant [21]. The complete list of genes and rank metric score is in Supplementary results 4 — GSEA, Table S2 (GSEA_RankOrder2T3_326Genes C3H10T1/2 vs. EOB). However when the late osteoblast (LOB) data set vs. EOB is used, the 326 dataset is enriched with the EOB genes with a FWER of 0.08. The 2T3 326 dataset compared with EOB vs. Osteoclast or EOB vs. MC3T3, or EOB vs. dendritic cells, again show enrichment in the EOB geneset. For GSEA analysis with the dendritic cell vs. EOB, a rank list of the 326 dataset in the analysis is given in Supplementary results 4 — GSEA, Table S3 (GSEA_RankOrder 2T3_326Genes DC vs. EOB). A heat map or clustering shows a graphical presentation of the genes enriched in the EOB geneset with the 326 2T3 dataset and can be found in Supplementary results 4—GSEA, Figure S1 (HeatMap2T3_326Genes. DC vs. EOB). As noted, most EOB enriched genes are at the bottom position of both the Table S3 and Figure S1, since the algorithm looked at the anti-enrichment (NES=−1.2) in DC cells using the EOB as the base for the gene ranking in the 326 dataset. The enrichment in the C3H10T1/2 cells vs. EOB most likely reflects that the 2T3 326 dataset still contains genes in the adipogenic pathways, such as PPARg. Overall the 326 dataset is most likely the primary early osteoblast (EOB) geneset when compared with mineralizing late osteoblasts (LOB) or expression profiles from other cell models.
Table 1.
Gene set enrichment analysis
| Cell line data set | 2T3 commitment gene set (326) | |||
|---|---|---|---|---|
| ES | NES | FWER P | Enrichment | |
| C3H10T1/2 vs. EOB | 0.37 | 1.57 | 0 | C3H10T1/2 |
| FB vs. EOB | −0.2 | −1.2 | 0.14 | EOB |
| MC3T3 vs. EOB | −0.2 | −0.9 | 0.11 | EOB |
| MACph vs. EOB | −0.4 | −1.5 | 0 | EOB |
| OC vs. EOB | 0 | −1 | 0 | EOB |
| LOB vs. EOB | −0.3 | −1.3 | 0.08 | EOB |
| DC vs. EOB | −0.4 | −1.2 | 0 | EOB |
(2T3 osteoblast 326 gene set).
OC = osteoclast; EOB = calvarial gfp-positive driven by 3.6 Col1a1 promoter and referred toasearlyosteoblasts; C3H10T1/2=mouse mesenchymal precursor with potential to go to adipocytes, chondrocytes or osteoblasts; DC = dendritic antigen presenting mouse cell lines; LOB = late calvarial osteoblasts that are gfp-positive driven by the 2.3 Col1a1 promoter and cultured until mineralization.
The MLO-Y4 osteocyte 181 gene expression signature
The MLO-Y4 dataset was first functionally clustered and classified using the DAVID-EASE tool. (http://periodontics.uthscsa.edu/HarrisLab/dataBase/HarrisLab_database.htm. Supplementary results 1 — Functional classification (by DAVID-EASE)-MLO-Y4 specific gene set (181 genes)). The GO (Gene Ontology) categories with the highest E (enrichment) scores were blood vessel and angiogenesis, defense response, growth factor activity, immune response, acute phase/inflammation responses, and chemokine activity, all with E scores <0.006. This means that there is less than 1 chance in 167 that this result would be found by chance. In the angiogenesis GO category, endoglin, epiregulin, placental growth factor, and vascular endothelial growth factor A were expressed 10–50 times higher in MLO-Y4 cells compared to 2T3 cells, irrespective of density. In the defense response GO category, CD44 (highly expressed in osteocytes in vivo), CD24a, several histocompatibility related genes, haptoglobin, several interferon induced genes, serum amyloid A3 (1000 fold), and a set of chemokines, including Scya7 (MCP3—400 fold), Scya2 (MCP1—40 fold) were all highly expressed in MLO-Y4 cells compared to 2T3 (E<0.00002). In the growth factor GO category, GDF5, interleukin 11, nerve growth factor beta, PDGFα, and TGFβ1 were all expressed 3 to 20 times higher in MLO-Y4 cells. Several TGFβ responsive genes were also much higher in MLO-Y4 cells. The immune response GO category largely overlaps with the defense response and acute response GO categories, but includes GTP binding protein 1 and 2, expressed over 40 fold higher in MLO-Y4 cells. Included in this immune GO category is the transcription factor Stat3, known to regulate many of the immune response genes. In the skeletal development GO category, 5 genes were found with an E<0.03. These include Spp1 or Osteopontin, expressed over 40 fold higher in MLO-Y4 cells, and Tob1, an inhibitor of BMP signaling, the vitamin D receptor, and TGFβ1, all expressed 2 to 5 fold higher in MLO-Y4 cells. In the response to external stimuli GO category, many of the genes overlap with the defense and immune response categories. However, of note is the prostaglandin endoperoxide synthetase gene or Ptgs2 (Cox2), which is expressed over 180 fold in the low density MLO-Y4 cells compared to 2T3 cells but only 80 fold in the high density cultures. This is most likely related to the observation that low density MLO-Y4 cell produce much higher PGE2 levels than the high density cultures, and at either density much higher levels than 2T3 cells [8].
K-median cluster analysis of the MLO-Y4 dataset
Fig. 6 shows an example of two of these clusters,1 and 8 with just the gene symbol and several key genes marked in red. The cluster of interferon related genes is seen in these examples, as well as the Ptgs2, several growth factors/angiogenesis related genes, and genes related to TGFbeta activity. A collection of forkhead and other transcription factors is also highly expressed in MLO-Y4 cells compared to 2T3 (FoxO1, MEF2A and FoxC2). The GP38 or E11 gene, involved in dendrite formation and interacting with CD44, is also highly expressed in MLO-Y4 cells, as seen in cluster 8. Many of these genes are marked with red. The complete cluster analysis, with further annotation and fold change, can be found in Supplementary results 2 — K-median cluster analysis (by TIGR-TM4): MLO-Y4 specific genes.
Fig. 6.
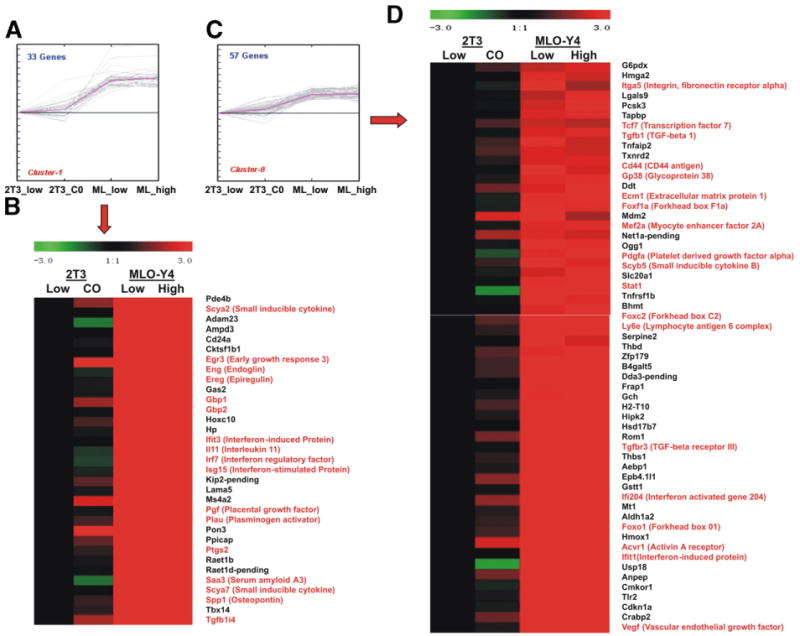
K-median clustering example with clusters 1 and 8, of genes that are highly expressed in MLO-Y4 cells compared to 2T3 cells. Data are presented for both the high and low density states for both cell lines, using the value of the 2T3 cells at low density set at 1.0 (black). Red represents increased expression and green represents decreased expression. Panels A and C are the overall expression plot of clusters 1 and 9, respectively. The expression value is log2 transformed. The full dataset cluster diagrams are at http://periodontics.uthscsa.edu/HarrisLab/dataBase/HarrisLab_database.htm. Supplementary results 2 — K-median cluster analysis (by TIGR_TM4): MLO-Y4 compared to 2T3.
Validation of gene expression patterns in MLO-Y4 cells
Fig. 7 shows Northern analysis where expression is normalized to GAPDH expression. MCP3 levels are 20 to 40 fold higher in the MLO-Y4 cells. Gremlin, a BMP signaling inhibitor, is over 30 fold higher compared to 2T3 cells. Osteopontin or Spp1 levels are over 10 fold higher in MLO-Y4 cells. BMP2 expression in MLO-Y4 cells is hardly detectable while very high in 2T3 confluent cells. Lrp5 expression is very low in MLO-Y4 cells compared to confluent 2T3 cells. Dkk2 level in MLO-Y4 cells is also very low compared to 2T3 cells. These patterns obtained by Northern analysis are consistent with the microarray data.
Fig. 7.
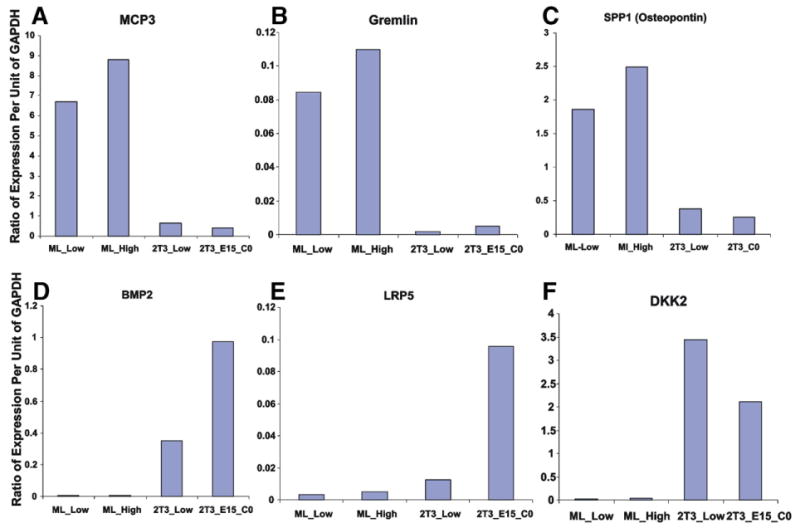
Validation of several of the gene expression changes in MLO-Y4 cells vs. 2T3 cells at both densities for each cell line. The Y-axis is ratio of expression of a given gene normalized to GAPDH expression. Each box (A–F) represents the expression in MLO-Y4 cells (low and high density) and 2T3 cells (low and CO or confluent). A, MCP3; B, Gremlin; C, Spp1 or Osteopontin; D, BMP2; E, LRP5; and F, Dkk1.
In situ hybridization of a subset of the 181 MLO-Y4 dataset
Fig. 8 shows in situ hybridization patterns in vivo using mouse mandibular sections from 3 day old mice of several genes high in MLO-Y4 cells and also highly expressed in freshly purified calvarial osteocyte-late osteoblasts that have not been cultured [54]. The genes observed were E11/gp38, MCP3, Itm2B, Nupr1, Spp1, Sost, Vdr, Tcf7, and Irx5. All of these genes are expressed in osteocytes in vivo, but also found in other components of the bone and not necessarily osteocyte “specific”, except Sost. Control hybridization experiments were carried out with each probe in which the digoxigenin cRNA was left out of the reaction. No signal was observed under these conditions without the cRNA probe. Of note are the high levels of vitamin D receptor and Irx5 gene expression in osteocytes in vivo and in MLO-Y4 cells. E11 expression is high in osteocytes but is also in many bone marrow cells, but not bone associated osteoblasts (arrowhead, Fig. 8A). The formation of many kinds of fibroblastic like cells may utilize E11 and associated genes. Sost is expressed very selectively in osteocytes postnatally in vivo and at low levels in MLO-Y4 cells (data not shown), suggesting that Sost expression, as well as DMP1 expression, in osteocytes may require a mineralized matrix, as we have observed with mineralizing 2T3 cultures [15]. Whenever, we take primary osteocyte enriched cultures and place them on collagen or fibronectin matrix, they begin to loose DMP1 and Sost expression, indicating these osteocyte properties require them to be in a mineralized matrix. MCP3 expression is in osteocytes as well as bone marrow. Osteopontin is highly in osteocytes as well as MLO-Y4 cells. Osteopontin can also be found in a wide variety of other cells, including macrophages and osteoclasts, and osteoblast, as well as osteocytes.
Fig. 8.
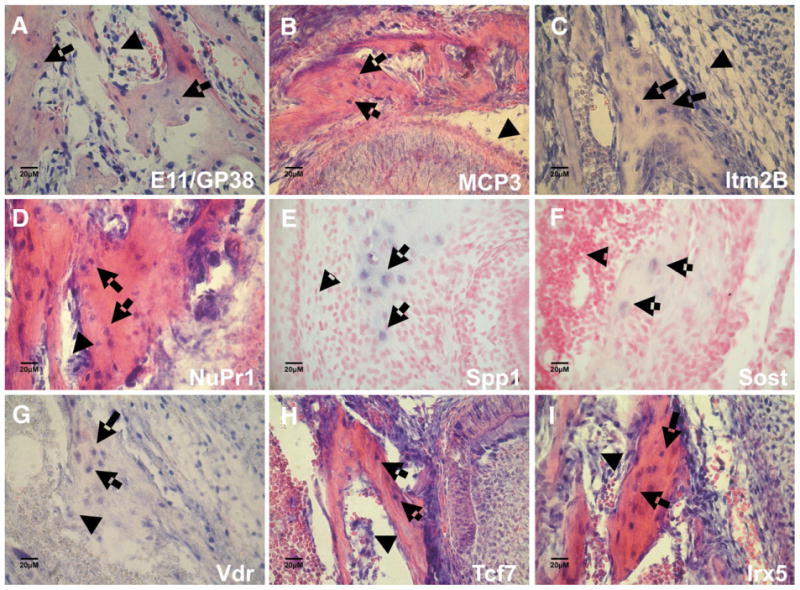
In situ hybridization of selected genes that are expressed in MLO-Y4 cells and validated to be expressed in osteocytes in vivo. A, E11/gp38 (Pdpn) highly expressed in osteoid osteocytes (arrow) and in the bone marrow fibroblastic cells (arrowhead), but not bone associated osteoblasts. B, MCP3 is expressed in some osteocytes (arrow), osteoblasts and bone marrow (arrowhead). C, Itm2B, integral membrane protein 2B is highly expressed in osteocytes (arrow) and in some bone marrow cells (arrowhead). D, NuPr1, or p8 gene expression in osteocytes (arrow) and also strongly expressed in bone associated osteoblasts (arrowhead). E, Spp1 or osteopontin is highly expressed in osteocytes. F, Sost is expressed in some osteocytes (arrow), not in osteoblast or bone marrow (arrowhead), and expression is very low in MLO-Y4 cells (data not shown). G, VDR or vitamin D receptor, is highly expressed in osteocytes (arrow), and in osteoblasts at low levels (arrowhead). VDR is highly expressed in MLO-Y4 cells. H, Tcf7, transcription factor 7 is expressed in some osteocytes (arrow) and is strongly expressed in osteoblasts and bone marrow cells (arrowhead). Irx5 transcription factor is expressed in most osteocytes (arrow), as well it is strongly expressed osteoblasts, and some bone marrow cells (arrowhead).
Phospho-Smad2 in MLO-Y4 cells
Fig. 9 shows that MLO-Y4 cells have high levels of phospho-Smad2 immunoreactivity, reflecting increased signaling or increased steady state levels of Smad2, with a 2.5 fold increase in high density cultures. Phospho-Smad1/5/8 immunoreactivity is undetectable in MLO-Y4 cells (data not shown). This is consistent with the high levels of several TGF beta induced genes, high levels of TGFβIII receptors, and TGFbeta1 ligand, and high levels of gremlin that potentially inhibit BMP signaling.
Fig. 9.
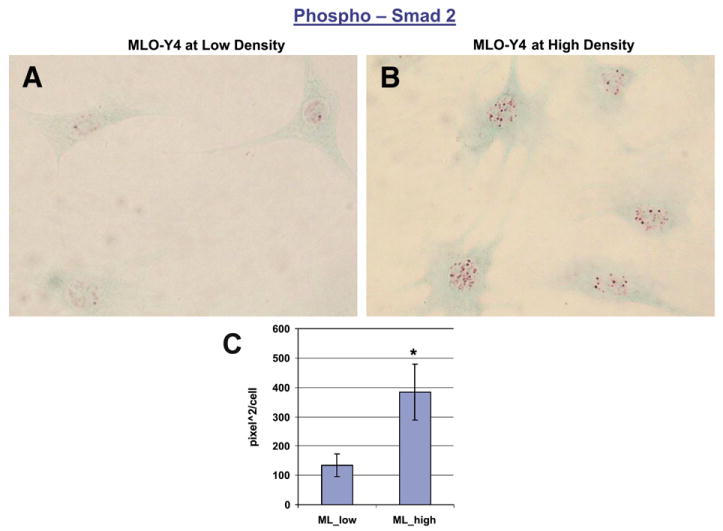
Phospho-Smad2 immunoreactivity in MLO-Y4 cells in MLO-Y4. A, Phospho-Smad2 immunoreactivity in MLO-Y4 cells at low density. B, Phospho-Smad2 immunoreactivity in MLO-Y4 cells at high density. C, Quantitation of nuclear phospho-Smad2 levels in MLO-Y4 cells at low and high density states.
Pathway analysis and interaction maps in the MLO-Y4 181 geneset
Using the functional classification and Pathway Assist, four pathways or interaction maps were constructed for MLO-Y4 cells. All four models with the active links to the internet and appropriate PubMed references for the proposed links can be found in the Supplementary results 3 — Pathway Analysis: MLO-Y4 specific genes (http://periodontics.uthscsa.edu/HarrisLab/dataBase/HarrisLab_database.htm). Fig. 10 shows one of these interaction maps describing the interaction of 36 genes in the 181 dataset that are involved in interferon signaling, chemokine action and acute phase/defense responses. This subset includes many of the genes expressed in MLO-Y4 cells at very high levels (10 to 1000 fold) compared to 2T3 cells. Of note, Saa3 is expressed over 1000 fold in MLO-Y4 cells, and IL6 may modulate Saa3 activity through Saa1. LIF or leukemia inhibitor factor, through GP130 activates Stat3 that in turn increases Myc expression and potential growth of the MLO-Y4 cells. Several of the interactions of the chemokines, Ccl7 (Scya7), Ccl2 (Scya2) and Ccl5 are also captured with links to the references. Links from IL11 and IL6 to the Stat 1 and 3 transcription factors are captured, as well at the Stat regulation of several of interferon induced genes. The toll-like receptor (TLR2) and the tumor necrosis factor receptor substrate F1B (TNFRSF1B) also are linked and upstream of Stat1 transcription factor. Stat3 and TGFβ can also increase haptoglobin expression that is extremely high in MLO-Y4 cells.
Fig. 10.
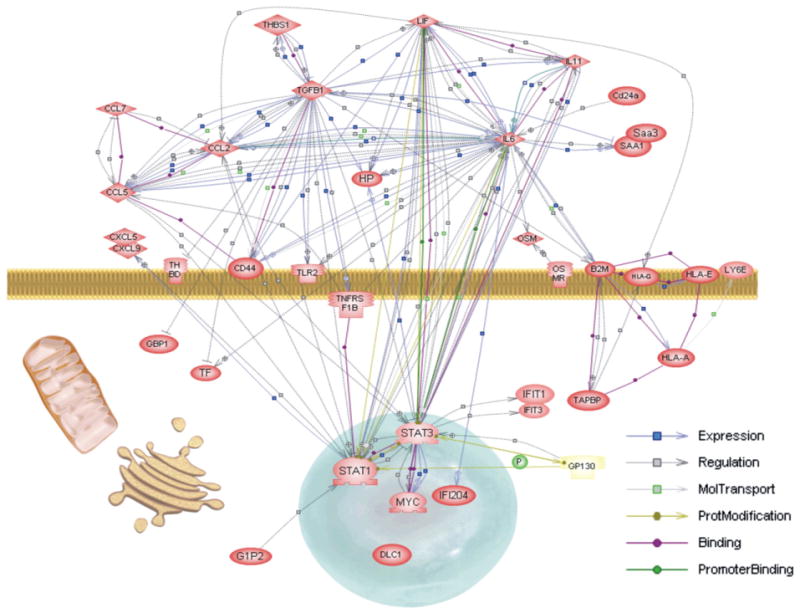
Example literature interaction map of MLO-Y4 reflecting interferon, chemokine, angiogenesis, and acute phase/defense response. Symbols and links marked as in Fig. 5. By functional classification using primarily Gene Ontology (GO) terms, 36 genes were linked with PathwayAssist into this network with the links to the references supporting the connections. See Supplementary data for internet based and interactive form of this map, as well as three other MLO-Y4 themes.
Three other interactive interaction maps can be found in the Supplementary result 3—MLO-Y4 pathways. One of the maps captures several of the genes involved in dendrite formation and extracellular matrix-motility related genes (i.e. GP38, CD44, Spp1, Serpines, ITGA5, etc). Another interaction map captures many of the genes involved in TGFβ signaling and prostaglandin signaling. The last Supplementary MLO-Y4 interaction map captures many of the genes that maybe involved in MLO-Y4 growth properties.
GSEA of the MLO-Y4 181 gene signature
The MLO-Y4 181 dataset was compared to several genesets from public domain. The summary of the GSEA results is shown in Table 2. Genesets from macrophages, skin fibroblasts, late and early osteoblast geneset (used in 2T3 analysis also), dendritic cells, osteoclasts, and T and B cells were used in this analysis. MLO-Y4 181 dataset gene signature is highly enriched in macrophage gene expression patterns with a NES of 1.55 and FWER of <0.01 when using fibroblast as a control. The list of common genes found in MLO-Y4 and macrophages can be found in the Supplementary results 4 — GSEA Table S4 (GSEA RankOrderMLO-Y4_181Genes, MACph vs. FB). The heat map is shown in Supplementary results 4 — GSEA, Figure S2 (Heatmap MLO-Y4_181Genes, MACph vs. FB). The C3H10T1/2 vs. fibroblasts genesets were compared to the 181 dataset, with highly significant NES of 1.54 and FWER or P value of <0.01 for the C3H10T1/2 phenotype. Positive enrichment was observed with late osteoblasts, MC3T3, early osteoblasts, and dendritic cells but none was significant (FWER<0.2). When osteoclasts vs. fibroblasts were compared to 181 dataset, the enrichment was in the fibroblast geneset, not osteoclast. Similar results were obtained with T and B cells vs. NIH3T3 fibroblasts, with the 181 dataset more similar to the NIH3T3 fibroblast geneset.
Table 2.
Gene set enrichment analysis
| Cell line data set | MLO-Y4 signature gene set (181) | |||
|---|---|---|---|---|
| ES | NES | FWER P | Enrichment | |
| MACph vs. FB | 0.27 | 1.55 | 0 | MACph |
| C3H10T1/2 vs. FB | 0.29 | 1.54 | 0 | C3H10T1/2 |
| LOB vs. FB | 0.23 | 1.09 | 0.23 | LOB |
| MC3T3 vs. FB | 0.21 | 0.88 | 0.37 | MC3T3 |
| EOB vs. FB | 0.13 | 0.4 | 0.69 | EOB |
| DC vs. FB | 0.16 | 0.82 | 0.79 | DC |
| OC vs. FB | −0.01 | −1 | 0 | FB |
| TC vs. NIH3T3 | −0.57 | −2.27 | 0 | NIH3T3 |
| BC vs. NIH3T3 | −0.48 | −1.69 | 0 | NIH3T3 |
(MLO-Y4 osteocyte 181 gene set).
BC = B cell lymphoblastic mouse lines; TC = T-cell lymphoblastic mouse cell lines; FB = mouse embryo fibroblastic cell line used as control in experiments; NIH3T3 = standard NIH3T3 mouse fibroblast cell line; All other symbols are marked the same as Table 1.
Discussion
Limited gene expression microarray analysis of the 2T3 osteoblast cell model was compared to the gene expression patterns in the MLO-Y4 osteocyte cell model. The analysis was at both high and low densities. Two highly significant datasets were obtained, one 181 genes representing a MLO-4 gene signature, and another 326 dataset, representing genes involved in an early osteoblast cell fate (2T3 signature).
2T3 dataset
Several conclusions are drawn from the gene expression pattern as a fibroblast like preosteoblast cell model moves to the first stage of confluency and cuboidal nature. This study is one of few to document the early expression changes as an osteoblast cell model moves from subconfluent to confluent states. A large number of transcription factors and ECM genes are in this dataset. Osterix, Dlx2 and 5, Twist, and Runx2 increase 2 to 10 fold, as well as adipocyte regulator, PPARg. Several genes in the 326 2T3 dataset are downstream of TGFβ signaling (i.e. TIEG, TGFbi4) or BMP/Wnt signaling (Lrp5, b-catenin, JunD NR4A1 or Nur77 early growth response genes). Other genes are in the PKA pathway, such as PKA, PRKAR2A, Crebl1, and ATf1 which are potentially involved in prostaglandin and PTH responsiveness in early osteoblasts. FGF2, FGF7, BMP2 and BMP4 plus a variety of ECM proteins (decorin, biglycan, col5a1, col5a3, osteomodulin, and pleiotrophin (ptn)) are increased in this dataset. Ptn overexpression affects bone development by modulating the Wnt pathway [26]. Biglycan and decorin play key early roles in osteoblast commitment and are downstream of BMP2/4 action [27,28]. Recent data in mice with double knock-out of decorin and biglycan demonstrate their key roles in suture fusion and mineralization [29]. Dlx5 and Dlx2 transcription factors, increased in this 326 dataset, are thought to directly activate Runx2 and Osterix genes [12]. The driving force maybe increased BMP signaling and TGFβ/activin signaling as measured by P-Smad158 and P-Smad2 and references [22,23]. Increased β-catenin and LRP5 components and the FGF components are likely important to early commitment stage and related to the concept of “lineage priming”, a term to describe first commitment stages of hematopoietic stem cell [30]. The 2T3 cell model at confluency appears to represent a bipotential cell that can go to adipocytes or osteoblasts, depending on future levels of Wnt and or BMP signaling molecules or PPARg ligands. In the presence of decreased BMP receptor signaling, 2T3 cells easily go to adipocytes and bone formation is decreased in vivo [11,31]. Recent reports show that adipocyte precursors from fat tissue can be reprogrammed to osteoblasts by increasing BMP receptor 1B levels and signaling [32].
The CBP/p300 transcription co-activator is involved in basal transcription and chromatin remodeling through the histone acetyl transferase activities [33]. In osteoblasts, Runx2 and P-Creb interact with p300 as well as the activated Smad proteins [34–36]. BMP signaling stimulates acetylation of Runx2 by p300. The acetylation of Runx2 prevents its degradation by a Smurf1 dependent mechanism and increases Runx2 interaction with phosphorylated Smad1/5/8 [37]. These observations suggest confluent early committed osteoblasts are lineage primed for an overall increased transcriptional capability. P300 is a major regulatory node for organizing these activities, possibly in a 3D chromatin complex, as suggested for steroid receptor complexes with co-activators and motor proteins [38]. Overall, GSEA demonstrated that the 326 dataset is most similar to several early stage primary osteoblasts and other osteoblast cell models.
MLO-Y4 dataset
Using gene ontology (GO) enrichment scores, the 181 MLO-Y4 dataset was organized into 5 general themes or networks, including (1) acute inflammatory response/chemokine/interferon and growth related, (2) TGFβ and prostaglandin/PKA, (3) dendrite process formation, (4) osteoclast differentiation, and (5) integrin and extracellular matrix proteins.
Serum amyloid gene, Saa3, is expressed very high (1000 fold over 2T3) in MLO-Y4 cells and Saa3 is involved in acute phase response in the liver, and expressed at low levels in C2C12 mesenchymal cells treated with BMP2 [39]. The monocyte chemoattractant proteins 1 and 3 or MCP 1 and 3 (also called Ccl2 and Ccl7 in Fig. 10) are expressed highly in MLO-Y4 cells and have been shown to play a role in osteocyte cell survival in the presence of glucocorticoids [40]. The interferon activated genes Ifi204, Gbp1 and Gbp2g (guanylate nucleotide binding protein) are 7 to 72 fold higher in MLO-Y4 cells compared to 2T3 cells. The interferon-induced protein mRNA with tetratricopeptide repeats 1 (Ifit1) and repeats 3 (Ifit3) is 8 to 113 fold increased in the MLO-Y4 cell model, and both genes are highly expressed in macrophages. The GSEA demonstrated that the MLO-Y4 181 dataset is, in fact, highly enriched in a macrophage like network and is consistent with the acute phase/defense inflammatory like gene signatures. Very little of this signature can be found in gene expression patterns in freshly isolate osteocytes-late osteoblast, and may reflect a unique property of MLO-Y4 cells [54]. Of the 181 MLO-Y4 dataset, we found 17 genes that are also in the primary osteocyte-late osteoblast geneset [54]. Larger gene expression dataset in MLO-Y4 cells may reveal a much higher overlap. In many cases it is also difficult to compare primary cells straight from bone with cells grown on collagen in vitro.
Epiregulin (Ereg) and placental growth factor (PGF), involved in angiogenesis and cell cycle regulation, are expressed over 40 times higher in MLO-Y4 cells compared to 2T3. Endoglin (Eng) expressed over 20 fold in the MLO-Y4 cells is normally activated by TGFβ signaling [41–43]. TGFβ and/or activin signaling maybe very active in MLO-Y4 cells and TGFβ1 mRNA is 5 fold higher in MLO-Y4 cells as compared to 2T3. TGFβ1 can bind CD44 hyaluronic acid receptor and regulate several of the chemokines such as MCP1 (Ccl2) and Haptoglobin (Hp) mRNA. Hp and Ccl2 are linked to acute phase responses, in turn regulated by TGFβ. Endoglin protein can feedback and modulate future responses to TGFβ [43]. This network seems highly operative in MLO-Y4 cells. Networks and link support for these and other genes in these themes can be found in the Supplementary results in the DAVID-EASE and pathway analysis of MLO-Y4 cells. For example, in the DAVID-EASE analysis, angiogenesis, defense response, growth factor activity, chemokine receptor and activity, acute phase response all have E or enrichment scores less than 0.006 and represent a major theme in MLO-Y4 cells.
Also, MLO-Y4 cells express very high levels of prostaglandin E2, increasing after exposing cells to fluid flow [4,8,44]. This phenomenon can be explained by the high levels of prostaglandin endoperoxide synthase 2 (Cox2) gene expression. The expression level in MLO-Y4 cells is 84 (high density) to 182 (low density) times the level in 2T3. The Cox2 mRNA level at low density is consistent with the higher level of PGE2 produced in low cell connected cultures vs. the high density cultures [7,8,44]. PGE2 normally leads to activation of the PKA pathway and phosphorylation of the transcription factor Creb and related family members [45]. Activated and phosphorylated Creb also directly regulates Cox2 gene expression, forming a positive feedback loop [45–47] that is in full gear in MLO-Y4 cells.
MLO-Y4 cells have extensive dendritic like processes, as do osteocytes in vivo. E11 or GP38 is a membrane bound protein that links the actin cytoskeleton to ECM proteins such as CD44 and osteopontin, both high in osteocytes [50,52]. Overexpression of E11 in epithelial cell types produces dendritic like processes [49]. Expression of E11 is 5–50 times higher in the MLO-Y4 cells than in 2T3 cells, depending on when expression is compared [48]. E11 clearly plays a key role in dendrite formation in MLO-Y4 cells and most likely in osteocytes in vivo [48].
One of the unusual properties of MLO-Y4 cells is the strong capacity to support osteoclast formation in vitro [51]. MLO-Y4 cells express high levels of both RANKL and CSF1, and primary osteocyte-late osteoblast is also enriched in RANKL (Tnfsf11). MLO-Y4 cells may be very useful for studying the role of these osteoclast growth and differentiation factor in load responsive signals stimulating bone resorption at high loads. In this study, IL-6 is also expressed 3 times higher than 2T3 cells, potentially contributing to the osteoclast support capability of MLO-Y4 cells.
Integrin alpha 5 (Itga5) is 5–10 times higher in MLO-Y4 cells, and increases expression after fluid flow. Itga5 protein translocates to the plasma membrane with connexin 43, where it plays a role in connexin 43 hemichannel formation and PGE2 release [8, unpublished].
Finally, Osteopontin (Spp1, 40–50 fold), Laminin α5 (Lama5, 40–50 fold), and CD44 (4–5 fold), all highly expressed in MLO-Y4 cells and in osteocytes in vivo are thought to play roles in the formation of the pericellular matrix around the cell process of the osteocyte in vivo [52,53].
In summary, the MLO-Y4 cell model expresses a variety of genes also expressed in osteocytes in vivo, including the VDR and Irq5 transcription factors, RANKL, Itga5 that need further investigation. Manyof the genes expressed inMLO-Y4 cells reflect a macrophage like signature that needs further exploration in vivo. However, MLO-Y4 cells express many genes at high levels that are expressed at low levels in primary osteocyte-late osteoblast cells isolate by FAC sorting [54]. Clearly osteocytes in vivo produce MCP3 and other genes in the macrophage signature. MLO-Y4 cells express low to undetectable levels of DMP1 and Sost, suggesting that expression of many of these osteocyte selective genes may require a mineralized matrix that is not provided in vitro for MLO-Y4 cells. This indicates that development of new in vitro models to study osteocyte biology within and without the context of a mineralized matrix is now needed to understand the behavior and gene networks that may better reflect osteocyte biology in the whole animal [56].
Footnotes
This research was supported by National Institute of Health Grants: Contract grant sponsor: SEH; Contract grant number: AR44728 and AR054616. Contract grant sponsor: SEH and LFB; Contract grant number: AR46798.
References
- 1.Doty SB. Morphological evidence of gap junctions between bone cells. Calcif Tissue Int. 1981;33:509. doi: 10.1007/BF02409482. [DOI] [PubMed] [Google Scholar]
- 2.Burger EH, Klein-Nulend J. Mechanotransduction in bone—role of the lacuno-canalicular network. FASEB J. 1999;13:S101. [Review] [118 refs] [PubMed] [Google Scholar]
- 3.Huiskes R, Ruimerman R, van Lenthe GH, Janssen JD. Effects of mechanical forces on maintenance and adaptation of form in trabecular bone. Nature. 2000;405:704. doi: 10.1038/35015116. [DOI] [PubMed] [Google Scholar]
- 4.Cheng B, Zhao S, Luo J, Sprague E, Bonewald LF, Jiang JX. Expression of functional gap junctions and regulation by fluid flow in osteocyte-like MLO-Y4 cells. J Bone Miner Res. 2001;16:249. doi: 10.1359/jbmr.2001.16.2.249. [DOI] [PubMed] [Google Scholar]
- 5.Tatsumi S, Ishii K, Amizuka N, Li M, Kobayashi T, Kohno K, et al. Targeted ablation of osteocytes induces osteoporosis with defective mechanotransduction. Cell Metab. 2007;5:464–75. doi: 10.1016/j.cmet.2007.05.001. [DOI] [PubMed] [Google Scholar]
- 6.Kato Y, Windle JJ, Koop BA, Mundy GR, Bonewald LF. Establishment of an osteocyte-like cell line, MLO-Y4. J Bone Miner Res. 1997;12:2014. doi: 10.1359/jbmr.1997.12.12.2014. [DOI] [PubMed] [Google Scholar]
- 7.Cherian PP, Cheng B, Gu S, Sprague E, Bonewald LF, Jiang JX. Effects of mechanical strain on the function of Gap junctions in osteocytes are mediated through the prostaglandin EP2 receptor. J Biol Chem. 2003;278:43146. doi: 10.1074/jbc.M302993200. [DOI] [PubMed] [Google Scholar]
- 8.Cherian PP, Siller-Jackson AJ, Gu S, Wang X, Bonewald LF, Sprague E, et al. Mechanical strain opens connexin 43 hemichannels in osteocytes: a novel mechanism for the release of prostaglandin. Mol Biol Cell. 2005;16:3100. doi: 10.1091/mbc.E04-10-0912. [DOI] [PMC free article] [PubMed] [Google Scholar]
- 9.Jiang JX, Siller-Jackson AJ, Burra S. Roles of gap junctions and hemichannels in bone cell functions and in signal transmission of mechanical stress. Front Biosci. 2007;12:1450–62. doi: 10.2741/2159. [DOI] [PMC free article] [PubMed] [Google Scholar]
- 10.Ghosh-Choudhury N, Windle JJ, Koop BA, Harris MA, Guerrero DL, Wozney JM, et al. Immortalized murine osteoblasts derived from BMP 2-T-antigen expressing transgenic mice. Endocrinology. 1996;137:331. doi: 10.1210/endo.137.1.8536632. [DOI] [PubMed] [Google Scholar]
- 11.Chen D, Ji X, Harris MA, Feng JQ, Karsenty G, Celeste AJ, et al. Differential roles for bone morphogenetic protein (BMP) receptor type IB and IA in differentiation and specification of mesenchymal precursor cells to osteoblast and adipocyte lineages. J Cell Biol. 1998;142:295. doi: 10.1083/jcb.142.1.295. [DOI] [PMC free article] [PubMed] [Google Scholar]
- 12.Harris SE, Guo D, Harris MA, Krishnaswamy A, Lichtler A. Transcriptional regulation of BMP-2 activated genes in osteoblasts using gene expression microarray analysis: role of Dlx2 and Dlx5 transcription factors. Front biosci. 2003;8:s1249. doi: 10.2741/1170. [Review] [29 refs] [DOI] [PubMed] [Google Scholar]
- 13.Harris SE, Harris MA. Gene expression profiling in osteoblast biology: bioinformatic tools. Mol Biol Rep. 2001;28:139. doi: 10.1023/a:1015232327977. [DOI] [PubMed] [Google Scholar]
- 14.Zhang J, Niu C, Ye L, Huang H, He X, Tong WG, et al. Identification of the haematopoietic stem cell niche and control of the niche size. Nature. 2003;425:836. doi: 10.1038/nature02041. [DOI] [PubMed] [Google Scholar]
- 15.Yang W, Lu Y, Kalajzic I, Guo D, Harris MA, Gluhak-Heinrich J, et al. Dentin Matrix Protein 1 Gene Cis-regulation: Use In Osteocytes to characterize local responses to mechanical loading in vitro and in vivo. J Biol Chem. 2005;280:20680. doi: 10.1074/jbc.M500104200. [DOI] [PubMed] [Google Scholar]
- 16.Tusher VG, Tibshirani R, Chu G. Significance analysis of microarrays applied to the ionizing radiation response. Proc Natl Acad Sci U S A. 2001;98:5116. doi: 10.1073/pnas.091062498. [DOI] [PMC free article] [PubMed] [Google Scholar]; Proc Natl Acad Sci U S A. 2001 Aug 28;98(18):10515. erratum appears in. [Google Scholar]
- 17.Quackenbush J. Microarray data normalization and transformation. Nature genetics. 2002;32(Suppl):496. doi: 10.1038/ng1032. [DOI] [PubMed] [Google Scholar]
- 18.Dennis G, Jr, Sherman BT, Hosack DA, Yang J, Gao W, Lane HC, et al. DAVID: Database for Annotation, Visualization, and Integrated Discovery. Genome biol. 2003;4:P3. [PubMed] [Google Scholar]
- 19.Hosack DA, Dennis G, Jr, Sherman BT, Lane HC, Lempicki RA. Identifying biological themes within lists of genes with EASE. Genome Biol. 2003;4:R70. doi: 10.1186/gb-2003-4-10-r70. [DOI] [PMC free article] [PubMed] [Google Scholar]
- 20.Gluhak-Heinrich J, Yang W, Harris MA, Harris SE. Quantitative in situ hybridization with enhanced sensitivity in soft, bone and teeth tissue using Digoxigenin tagged RNA probes. Biochemia Medica. 2008;18(1):59–80. [Google Scholar]
- 21.Sweet-Cordero A, Mukherjee S, Subramanian A, You H, Roix JJ, Ladd-Acosta C, et al. An oncogenic KRAS2 expression signature identified by cross-species gene-expression analysis. Nat Genet. 2005;37:48. doi: 10.1038/ng1490. [see comment] [DOI] [PubMed] [Google Scholar]
- 22.Kester HA, Ward-van Oostwaard TM, Goumans MJ, van Rooijen MA, van Der Saag PT, van Der Burg B, et al. Expression of TGF-beta stimulated clone-22 (TSC-22) in mouse development and TGF-beta signalling. Developmental dynamics: an official publication of the American Association of Anatomists. 2000;218:563. doi: 10.1002/1097-0177(2000)9999:9999<::AID-DVDY1021>3.0.CO;2-Q. [DOI] [PubMed] [Google Scholar]
- 23.Lee MH, Kwon TG, Park HS, Wozney JM, Ryoo HM. BMP-2-induced Osterix expression is mediated by Dlx5 but isindependent of Runx2. Biochem Biophys Res Commun. 2003;309:689. doi: 10.1016/j.bbrc.2003.08.058. [DOI] [PubMed] [Google Scholar]
- 24.Celil AB, Campbell PG. BMP-2 and insulin-like growth factor-I mediate Osterix (Osx) expression in human mesenchymal stem cells via the MAPK and protein kinase D signaling pathways. J Biol Chem. 2005;280:31353. doi: 10.1074/jbc.M503845200. [DOI] [PubMed] [Google Scholar]
- 25.Kalajzic I, Staal A, Yang WP, Wu Y, Johnson SE, Feyen JH, et al. Expression profile of osteoblast lineage at defined stages of differentiation. J Biol Chem. 2005;280:24618–26. doi: 10.1074/jbc.M413834200. [DOI] [PubMed] [Google Scholar]
- 26.Tare RS, Oreffo RO, Sato K, Rauvala H, Clarke NM, Roach HI. Effects of targeted overexpression of pleiotrophin on postnatal bone development. Biochem Biophys Res Commun. 2002;298:324–32. doi: 10.1016/s0006-291x(02)02456-7. [DOI] [PubMed] [Google Scholar]
- 27.Chen XD, Fisher LW, Robey PG, Young MF. The small leucine-rich proteoglycan biglycan modulates BMP-4-induced osteoblast differentiation. FASEB J. 2004;18:948–58. doi: 10.1096/fj.03-0899com. [DOI] [PubMed] [Google Scholar]
- 28.Gutierrez J, Osses N, Brandan E. Changes in secreted and cell associated proteoglycan synthesis during conversion of myoblasts to osteoblasts in response to bone morphogenetic protein-2: role of decorin in cell response to BMP-2. J Cell Physiol. 2006;206:58–67. doi: 10.1002/jcp.20428. [DOI] [PubMed] [Google Scholar]
- 29.Wadhwa S, Bi Y, Ortiz AT, Embree MC, Kilts T, Iozzo R, et al. Impaired posterior frontal sutural fusion in the biglycan/decorin double deficient mice. Bone. 2007;40:861–6. doi: 10.1016/j.bone.2006.11.003. [DOI] [PMC free article] [PubMed] [Google Scholar]
- 30.Orkin SH. Priming the hematopoietic pump. Immunity. 2003;19:633. doi: 10.1016/s1074-7613(03)00302-9. [DOI] [PubMed] [Google Scholar]
- 31.Zhao M, Harris SE, Horn D, Geng Z, Nishimura R, Mundy GR, et al. Bone morphogenetic protein receptor signaling is necessary for normal murine postnatal bone formation. J Cell Biol. 2002;157:1049. doi: 10.1083/jcb.200109012. [DOI] [PMC free article] [PubMed] [Google Scholar]
- 32.Quarto N, Wan DC, Longaker MT. Molecular mechanisms of FGF-2 inhibitory activity in the osteogenic context of mouse adipose-derived stem cells (mASCs) Bone. doi: 10.1016/j.bone.2008.01.026. in press. [DOI] [PubMed] [Google Scholar]
- 33.Goodman RH, Smolik S. CBP/p300 in cell growth, transformation, and development. Genes Dev. 2000;14:1553. [PubMed] [Google Scholar]
- 34.Franceschi RT, Xiao G. Regulation of the osteoblast-specific transcription factor, Runx2: responsiveness to multiple signal transduction pathways. J Cell Biochem. 2003;88:446. doi: 10.1002/jcb.10369. [DOI] [PubMed] [Google Scholar]
- 35.Sierra J, Villagra A, Paredes R, Cruzat F, Gutierrez S, Javed A, et al. Regulation of the bone-specific osteocalcin gene by p300 requires Runx2/Cbfa1 and the vitamin D3 receptor but not p300 intrinsic histone acetyltransferase activity. Mol Cell Biol. 2003;23:3339. doi: 10.1128/MCB.23.9.3339-3351.2003. [DOI] [PMC free article] [PubMed] [Google Scholar]
- 36.Kim J, Jia L, Stallcup MR, Coetzee GA. The role of protein kinase A pathway and cAMP responsive element-binding protein in androgen receptor-mediated transcription at the prostate-specific antigen locus. J Mol Endocrinol. 2005;34:107. doi: 10.1677/jme.1.01701. [DOI] [PubMed] [Google Scholar]
- 37.Jeon EJ, Lee KY, Choi NS, Lee MH, Kim HN, Jin YH, et al. Bone morphogenetic protein-2 stimulates Runx2 acetylation. J Biol Chem. 2006;281:16502. doi: 10.1074/jbc.M512494200. [DOI] [PubMed] [Google Scholar]
- 38.Nunez E, Kwon YS, Hutt KR, Hu Q, Cardamone MD, Ohgi KA, et al. Nuclear receptor-enhanced transcription requires motor- and LSD1-dependent gene networking in interchromatin granules. Cell. 2008;132:996. doi: 10.1016/j.cell.2008.01.051. [DOI] [PubMed] [Google Scholar]
- 39.Balint E, Lapointe D, Drissi H, van der Meijden C, Young DW, van Wijnen AJ, et al. Phenotype discovery by gene expression profiling: mapping of biological processes linked to BMP-2-mediated osteoblast differentiation. J Cell Biochem. 2003;89:401. doi: 10.1002/jcb.10515. [DOI] [PubMed] [Google Scholar]
- 40.Kitase YK, Ko S, Gluhak-Heinrich J, Harris SE, Bonewald LF. The chemokine, MCP-3, is produced by osteocytes and protects against glucocorticoid-induced apoptosis. J Bone Miner Res. 2005;20:s150. [Google Scholar]
- 41.Cheifetz S, Bellon T, Cales C, Vera S, Bernabeu C, Massague J, et al. Endoglin is a component of the transforming growth factor-beta receptor system in human endothelial cells. J Biol Chem. 1992;267:19027. [PubMed] [Google Scholar]
- 42.Pece-Barbara N, Vera S, Kathirkamathamby K, Liebner S, Di Guglielmo GM, Dejana E, et al. Endoglin null endothelial cells proliferate faster and are more responsive to transforming growth factor beta1 with higher affinity receptors and an activated Alk1 pathway. J Biol Chem. 2005;280:27800. doi: 10.1074/jbc.M503471200. [DOI] [PubMed] [Google Scholar]
- 43.Lastres P, Letamendia A, Zhang H, Rius C, Almendro N, Raab U, et al. Endoglin modulates cellular responses to TGF-beta 1. J Cell Biol. 1996;133:1109. doi: 10.1083/jcb.133.5.1109. [DOI] [PMC free article] [PubMed] [Google Scholar]
- 44.Cheng B, Kato Y, Zhao S, Luo J, Sprague E, Bonewald LF, et al. PGE(2) is essential for gap junction-mediated intercellular communication between osteocyte-like MLO-Y4 cells in response to mechanical strain. Endocrinology. 2001;142:3464. doi: 10.1210/endo.142.8.8338. [DOI] [PubMed] [Google Scholar]
- 45.Constantinescu A, Diamond I, Gordon AS. Ethanol-induced translocation of cAMP-dependent protein kinase to the nucleus. Mechanism and functional consequences. J Biol Chem. 1999;274:26985. doi: 10.1074/jbc.274.38.26985. [DOI] [PubMed] [Google Scholar]
- 46.Tang Q, Chen W, Gonzales MS, Finch J, Inoue H, Bowden GT. Role of cyclic AMP responsive element in the UVB induction of cyclooxygenase-2 transcription in human keratinocytes. Oncogene. 2001;20:5164–72. doi: 10.1038/sj.onc.1204667. [DOI] [PubMed] [Google Scholar]
- 47.Fujino H, Salvi S, Regan JW. Differential regulation of phosphorylation of the cAMP response element-binding protein after activation of EP2 and EP4 prostanoid receptors by prostaglandin E2. Mol Pharmacol. 2005;68:251–9. doi: 10.1124/mol.105.011833. [DOI] [PubMed] [Google Scholar]
- 48.Zhang K, Barragan-Adjemian C, Ye L, Kotha S, Dallas M, Lu Y, et al. E11/gp38 selective expression in osteocytes: regulation by mechanical strain and role in dendrite elongation. Mol Cell Biol. 2006;26:4539. doi: 10.1128/MCB.02120-05. [DOI] [PMC free article] [PubMed] [Google Scholar]
- 49.Scholl FG, Gamallo C, Vilaro S, Quintanilla M. Identification of PA2.26 antigen as a novel cell-surface mucin-type glycoprotein that induces plasma membrane extensions and increased motility in keratinocytes. J Cell Sci. 1999;112(Pt 24):4601. doi: 10.1242/jcs.112.24.4601. [DOI] [PubMed] [Google Scholar]
- 50.Ohizumi I, Harada N, Taniguchi K, Tsutsumi Y, Nakagawa S, Kaiho S, et al. Association of CD44 with OTS-8 in tumor vascular endothelial cells. Biochim Biophys Acta. 2000;1497:197. doi: 10.1016/s0167-4889(00)00063-x. [DOI] [PubMed] [Google Scholar]
- 51.Zhao S, Zhang YK, Harris S, Ahuja SS, Bonewald LF. MLO-Y4 osteocyte-like cells support osteoclast formation and activation. J Bone Miner Res. 2002;17:2068–79. doi: 10.1359/jbmr.2002.17.11.2068. [DOI] [PubMed] [Google Scholar]
- 52.Hughes DE, Salter DM, Simpson R. CD44 expression in human bone: a novel marker of osteocytic differentiation. J Bone Miner Res. 1994;9:39. doi: 10.1002/jbmr.5650090106. [DOI] [PubMed] [Google Scholar]
- 53.Weinbaum S, Guo P, You L. A new view of mechanotransduction and strain amplification in cells with microvilli and cell processes. Biorheology. 2001;38:119. [PubMed] [Google Scholar]
- 54.Harris SE, Yang W, Harris MA, Gluhak-Heinrich J, Bonewald LF, Rowe DW, et al. Osteocyte gene expression signatures indicate that neural, muscle, and cytoskeletal genes as well as Wnt signaling represent novel pathways for osteocyte function. J Bone Miner Res. 2006;21(Suppl 1):pS3, 1006. [Google Scholar]
- 55.Rodda SJ, McMahon AP. Distinct roles for hedgehog and canonical Wnt signalling in specification, differentiation and maintenance of osteoblast progenitors. Development. 2006;133:3231. doi: 10.1242/dev.02480. [DOI] [PubMed] [Google Scholar]
- 56.Bonewald LF, Johnson ML. Osteocytes, mechanosensing and Wnt signaling. Bone. 2008;42:606. doi: 10.1016/j.bone.2007.12.224. [DOI] [PMC free article] [PubMed] [Google Scholar]


