Abstract
The intermediate nucleus of the lateral lemniscus (INLL) is a major input to the inferior colliculus (IC), the auditory midbrain center where multiple pathways converge to create neurons selective for specific temporal features of sound. However, little is known about how INLL processes auditory information or how it contributes to integrative processes at the IC. INLL receives excitatory projections from the cochlear nucleus and inhibitory projections from the medial nucleus of the trapezoid body (MNTB), so it must perform some form of integration. To address the question of what role inhibitory synaptic inputs play in the INLL of the big brown bat (Eptesicus fuscus), we recorded sound-evoked responses of single neurons and iontophoretically applied bicuculline to block GABAA receptors or strychnine to block glycine receptors. Neither bicuculline nor strychnine had a consistent effect on response latency or frequency response areas. Bicuculline increased spike counts and response durations in most units, suggesting that GABAergic input suppressed the late part of the response and provided some gain control. Strychnine reduced the responses of some units with sustained discharge patterns to one or a few spikes at stimulus onset, but increased others. INLL is the only part of the auditory system where reduced responsiveness has been seen in vivo while blocking glycine. However, in vitro studies in the MNTB suggest that glycine can be facilitatory, possibly through presynaptic action. These results show that GABA consistently reduces spike counts and response durations, whereas glycine is suppressive in some INLL neurons but facilitatory in others.
INTRODUCTION
Neural tuning to temporal features or patterns of sound is a process that is built up in stages through multisynaptic parallel pathways in the auditory brain stem, all of which ultimately converge in the midbrain at the inferior colliculus (IC) (for a review, see Casseday and Covey 1995; Covey 2003; Covey and Casseday 1999). One important source of ascending input to the IC is the intermediate nucleus of the lateral lemniscus (INLL), a cell group that is particularly prominent and clearly differentiated in echolocating bats (Covey 1993). The INLL consists of a mixture of several morphologically distinct cell types, each of which presumably also has unique intrinsic properties. These cells receive excitatory input primarily from the anteroventral cochlear nucleus (AVCN) and posteroventral cochlear nucleus (PVCN); inhibitory projections are mainly from the ipsilateral MNTB with some input also coming from periolivary structures, particularly the lateral nucleus of the trapezoid body (LNTB) and ventral periolivary region (Covey and Casseday 1986; Huffman and Covey 1995). This general pattern of inputs to INLL is similar across all mammals (cat: Glendenning et al. 1981; bat: Covey and Casseday 1986; Vater and Feng 1990; Zook and Casseday 1985; rat: Friauf and Ostwald 1988).
There is considerable evidence that convergence of excitatory and inhibitory inputs that differ in latency, discharge pattern, temporal precision, and frequency tuning create populations of neurons that respond selectively to specific biologically relevant temporal features of sound such as duration, modulation rate, or direction of a frequency sweep (Casseday and Covey 1996; Casseday et al. 2000; Covey and Casseday 1999; Faure et al. 2003; Fuzzessery and Hall 1996). Convergent inputs to IC neurons may also provide the connectional basis for more fundamental transformations such as adjusting response latency, changing temporal discharge pattern, or shaping frequency response area (Casseday et al. 2000; Covey 2000, 2003; Covey and Casseday 1991, 1999; Faure et al. 2003; Grothe et al. 1992; Park and Pollak 1993).
Electrophysiological studies have shown that between the level of the cochlear nucleus and INLL, a number of transformations occur, including an increase in the range of response latencies, changes in temporal discharge pattern and, in some cases, increased temporal precision (Covey and Casseday 1991; Haplea et al. 1994). Previous studies provide evidence that the INLL transmits ongoing information about the duration and intensity of a sound to the IC (Covey and Casseday 1991; Huffman et al. 1998a, b). However, it is not known how convergence of inhibitory and excitatory synaptic inputs at the level of INLL affects the information transmitted from there to the IC.
Almost every cell in the INLL is contacted by synaptic terminals that stain for glycine and/or GABA, the two major inhibitory neurotransmitters in the mammalian auditory system (Vater et al. 1997). Receptors for both transmitters are also known to be present in the nuclei of the lateral lemniscus, including INLL (Fubara et al. 1996). Although we do not know what these two forms of neural inhibition accomplish in terms of information processing in INLL, studies of neurons elsewhere provide some clues as to the types of interactions that might be taking place. Previous studies in the superior olivary complex (SOC) and IC have shown that neurons' response latencies can be lengthened and/or discharge patterns altered when a short-latency inhibitory input overlaps with and cancels the initial part of an excitatory input, or when a long-latency inhibitory input overlaps with and cancels the later part of an excitatory input (Grothe et al. 1992, 1997). Because the range of response latencies seen in the INLL is broader than would be predicted based on the combination of fiber length and the speed of synaptic transmission alone (Haplea et al. 1994), it is reasonable to ask whether the latency of INLL neurons might be lengthened through synaptic inhibition as occurs in the SOC and IC (Grothe and Park 1998; Park and Pollak 1993). Previous studies in the IC have also shown that frequency response areas can be sculpted by neural inhibition (Fuzzessery and Hall 1996; Pollak and Park 1993; Yang et al. 1992). It is possible that similar processes occur in the INLL.
Understanding the role of neural inhibition is a crucial step in understanding the overall mechanisms through which the auditory system performs more complex processing and creates new forms of selectivity for sound features or patterns through multiple parallel ascending inputs interacting at multiple stages. To understand the role of inhibition in the INLL, which receives both GABAergic and glycinergic inhibition, it is necessary to establish which response properties are shaped by each neurotransmitter. Selectively blocking receptors for each neurotransmitter can provide evidence regarding which properties arise through the action of GABA or glycine, which are due to other mechanisms such as intrinsic properties interacting with synaptic input, or which simply reflect the properties of input neurons. As the first step in understanding the role of neural inhibition in information processing in the INLL, we examined responses to sound before, during, and after iontophoretic application of antagonists of GABAA and glycine receptors.
METHODS
Animals
Extracellular single-unit recordings were obtained from 15 big brown bats (Eptesicus fuscus) of both sexes from our captive breeding colony. Prior to surgery, bats were housed in a husbandry facility in which temperature and lighting were consistent with natural outdoor conditions. However, supplemental heat was used to maintain the colony >3°C in the winter and >21°C in the summer. Experimental animals were brought into the laboratory 1–3 days before beginning experiments to allow them to acclimate to conditions of constant indoor temperatures. Bats were housed individually or with one or two other bats. Water and food were available ad libitum.
Surgery
To prepare an animal for electrophysiological recording, a small metal post was attached to the dorsal surface of the skull. The post was constructed so that the placement of the animal in the stereotaxic apparatus (Kopf, modified for bats) could be precisely replicated from one recording session to the next. One hour prior to surgery, a general analgesic (buprenorphine hydrochloride, 0.025 mg/kg, Reckitt Benckiser Pharmaceuticals) was administered subcutaneously. The animal was then lightly anesthetized with isoflurane and placed in the surgical apparatus. The bat's head was held in a specially designed bite bar attached to micromanipulators that allowed the position of the head to be adjusted in three dimensions. Once the animal was fixed in the bite bar, the hair on the skull was removed and the skin was swabbed with an iodine (Betadine) surgical scrub. Local analgesic (bupivicaine, 0.6 mg/kg, Abbot Laboratories) was administered subcutaneously to the scalp ≥10 min before incision. During surgery, anesthesia was maintained by a continuous stream of inhalation anesthetic (isoflurane, 2.0–3.0 ml/min) mixed with oxygen (0.1 ml/min). The temporal muscles were retracted and the skull exposed. Fine adjustments were made in the position of the skull so that it conformed to a standard stereotaxic position. A metal post was then attached to the surface of the skull with cyanoacrylate gel adhesive and a liquid acrylic hardener (Jet Liquid; Lang Dental Manufacturing). A chlorided silver wire was placed under the temporal muscle to serve as the reference electrode. A small opening (<1 mm diam) was made in the skull overlying the rostrolateral portion of the inferior colliculus to allow for electrode insertion. After surgery and between recording sessions the opening was covered with a piece of sterile contact lens material and Gelfoam (Pharmacia and UpJohn) coated with Neosporin (Pfizer, Morris Plains, NJ).
Generation of auditory stimuli
All sounds were digitally synthesized with two digital signal processing boards from Tucker Davis Technologies (TDT; Apos II sampling rate, 357 kHz) that were optically interfaced to TDT hardware modules, including two D/A converters (TDT DA3-2). The output of each converter was fed through a low-pass antialiasing filter [TDT FT5; filter cutoff frequency (fc), 120 kHz] and two programmable attenuators (TDT PA4). The outputs were then mixed by a weighted summer (TDT SM5) and fed to an attenuator (Leader LAT-45) before final amplification (Krohn-Hite 7500). All stimuli were presented monaurally, contralateral to the INLL from which recordings were obtained, using a Bruel and Kjaer (B&K) Type 4135 -in condenser microphone (with protective grid on) modified for use as a loudspeaker including a circuit to correct for nonlinearities in the transfer function. The loudspeaker was placed within the cone of the bat's pinna, as close as possible to the external auditory meatus (∼1 mm). The loudspeaker output was measured with a B&K Type 4138 1/8-in condenser microphone (diaphragm, 90° incidence; protective grid removed) that had been calibrated with a B&K Type 4220 sound-level calibrator. Values were expressed in decibels sound pressure level (SPL root mean square referenced to 20 μPa) equivalent to the peak amplitude of continuous tones of the same frequency. The transducer's transfer function was flat ±5 dB from 20 to 100 kHz. Over the range of frequencies used in this study, the SPL at the ear opposite the source was ≥30 dB below the level of the source (Ehrlich et al. 1997). For all experiments, a rise-fall time of 0.4 ms was used, and the stimulus envelope was shaped with a square cosine function. Stimuli were presented at a rate of 3/s. When searching for single-unit activity, restricted band noise bursts were used as search stimuli.
Recording neural responses and microiontophoresis of pharmacological agents
Neural recordings from awake bats were conducted in a double-walled, sound-attenuating chamber (Industrial Acoustics). Recording sessions began 1–4 days after attachment of the post. At least 30 min before recording, each bat was given a subcutaneous injection of a neuroleptic [0.3–0.5 ml 1:1 mixture of 0.025 mg/ml fentanyl citrate and 1.25 mg/ml droperidol (Inapsine); 19.1 mg/kg, Abbot Laboratories] as a tranquilizer and placed in a foam-lined holder molded to the shape of its body to hold it firmly and comfortably. The holder was suspended in a stereotaxic frame (ASI Instruments, Warren, MI) by means of an elastic sling designed to damp movements. The stereotaxic apparatus was on top of a floating vibration isolation table (TMC, Peabody, MA). The head post was secured in a customized holder mounted on a stereotaxic micromanipulator (David Kopf Instruments, Tujunga, CA).
Each bat was used in one to eight recording sessions, each lasting ∼6 h. If the bat showed signs of restlessness or discomfort, the recording session was immediately terminated. All procedures were approved by the University of Washington Laboratory Animal Care and Use Committee.
Neural responses were recorded extracellularly with glass micropipettes (filled with 165 mM NaCl plus 5% biotinylated dextran amine (BDA) (Molecular Probes, Eugene, OR) for marking recording sites. The recording electrode was attached to a multibarrel “piggy-back” electrode assembly (Havey and Caspary 1980). Single-unit recordings were made with thin-wall borosilicate glass micropipette electrodes pulled to a tip diameter of ∼1 μm, with impedances ranging from ∼10 to 40 MΩ. For blocking GABAA and glycine receptors, the single barrel recording electrode was bonded to a three- or five-barrel micropipette with a total tip diameter of 10–15 μm with the tip of the recording electrode extending about 10–15 μm beyond the tip of the multibarrel electrode. One barrel of the multibarrel electrode was filled with 165 mM NaCl. It served as a balance barrel and provided a control for any possible effect of the ejection current on neural responses. The remaining barrels were filled with drug solutions (e.g., 500 mM GABA, pH 3.5–4.0; 500 mM glycine, pH 3.5–4.0; 20 mM bicuculline methiodide, pH 3.0; 20 mM strychnine HCl, pH 3.5–4.0). Drugs were prepared in advance, aliquoted, and stored at −80°C for no more than 3 wk. Retention and ejection currents used to control drug delivery were supplied and monitored through a Medical Systems Neurophore BH-2 constant current generator with 4 iontophoresis modules and one balance module. Resistances of drug barrels typically ranged from 20 to 60 MΩ. A retention current of −15 nA was applied to each drug barrel to prevent leakage. Ejection currents were dictated by electrode resistance and typically ranged from 20 to 100 nA.
In experiments using pharmacological agents, a complete set of “baseline” data was collected under the stimulus conditions of interest, one drug was applied, and the complete stimulus set was presented again. The neuron was then given time to recover to baseline levels of response and the stimulus set was presented a third time to collect “recovery” data. The sequence of collecting baseline, drug, and recovery data was repeated for each drug tested. After recording was complete, an iontophoretic injection of BDA was placed (4 μA positive pulsed current for 2 min) at that location.
The electrode was aimed using a combination of visual landmarks and stereotaxic coordinates and advanced in 1-μm steps with a hydraulic microdrive (Kopf model 650). Data were collected from units that could be identified as cell bodies (signal-to-noise ratio of ≥3:1 and a biphasic action potential). A negative capacitance electrometer was used to amplify recordings, which were then displayed on a Tektronix 5113 multichannel oscilloscope and monitored on an audio amplifier and loudspeaker. Action potentials were discriminated with a Tucker-Davis spike discriminator and viewed on a digital oscilloscope. Spike times were digitized with a time resolution of 10.0 μs. Data were collected using custom software developed in our laboratory and visualized as dot rasters. Once a unit was isolated, pure tones were used to automatically obtain a frequency response area and classify each unit according to its temporal discharge pattern. We collected responses to 15–20 stimulus presentations at each combination of frequency and sound level before, during, and after application of antagonists of inhibitory neurotransmitters. Neurons were tested with stimuli of varying durations (≤20 ms) to determine whether the spike trains did or did not increase in length with increasing stimulus duration. Discharge pattern classifications were based on the response to these longer stimuli. Tests for drug effects were then run with a shorter stimulus (usually 5 ms).
Data analysis
Some analyses were performed on-line (e.g., dot rasters, spike counts, average spike latency, SE of 1st spike latency). Later, statistical analysis across neurons or across conditions was performed using a combination of custom and commercial software packages (Igor, SPSS, Excel).
Spike counts were analyzed over a time window that began with stimulus onset and extended out to 100 ms. Spontaneous activity was taken to be the spike rate in the 10-ms window preceding stimulus presentation. Spikes were considered a response to the stimulus when the spike count was ≥10% of the maximum spike count, spiking occurred on ≥50% of trials, and the SE of the first spike was less than the first spike latency. These criteria were chosen to effectively reveal auditory responses in the presence of spontaneous activity (7 of 44 units) without excluding responses in units that did not have spontaneous activity (37 of 44 units). For statistical testing, only frequency/intensity combinations that were present in both control and drug conditions were compared.
Reconstruction of recording sites
After the final recording session, animals were administered a lethal dose of sodium pentobarbital (Abbot Laboratories) and perfused through the heart with fresh, filtered 0.9% NaCl solution followed by a fixation solution containing 4% paraformaldehyde in 0.1M phosphate-buffered saline solution (PBS). Brains were removed and cryoprotected overnight in a 30% sucrose solution in 0.1M PBS or fixative. The next day the brain was sectioned at 30 μm in the coronal plane on a freezing microtome. Tissue was soaked in 0.3% Triton X in 0.1 M PBS for 30 min followed by three PBS rinses. Tissue was then soaked in an avidin/biotin solution (ABC, Vector Labs, Burlingame, CA) for 1.5 h followed by one rinse in 0.1 M PBS and two rinses in 0.1 M phosphate buffer. To visualize the BDA injections, sections were reacted with a 0.05% 3,3 diaminobenzidine tetrahydrochloride solution (Sigma, St. Louis, MO, with 0.003% hydrogen peroxide in 0.1 M phosphate buffer). Sections were mounted on gelatin-coated slides and stained using a cresyl violet solution. Slides were rinsed and dehydrated in ethanol and xylene and coverslipped using DPX mounting medium. Sections were viewed using light microscopy. Digital photomicrographs were taken at ×5 using a Leica 300F digital camera mounted on a Leica DMR microscope (Leica Microsystems, Allendale, NJ). At the time the photograph was taken, pictures were adjusted for brightness, color, and contrast using Photoshop 7.0 (Adobe Systems, San Jose, CA). No further adjustments were made to the tissue photographs. Locations of marked recording sites were plotted and digital reconstructions were made using Neurolucida software (Microbrightfield, Williston, VT) on a PC computer. All reconstructed electrode tracks and neuron locations were plotted in a rostrocaudally collapsed representation on a representative coronal section through the middle of the INLL. A correction factor of 9.2% was applied to stereotaxic coordinates in the x and y planes to account for tissue shrinkage during histological processing.
RESULTS
We recorded sound-evoked responses from 67 single units in the INLL of 15 big brown bats and obtained a complete set of pharmacological data on 44 of these. Of the 44 units, 24 were tested with strychnine only, nine units with bicuculline only and 11 units with both drugs. The application of GABA or glycine completely abolished neural responses to sound at all frequencies and intensities tested, indicating that receptors for both GABA and glycine were present and that the action of both neurotransmitters was inhibitory as would be expected.
Best frequencies (BF) of the units ranged from 12 to 68 kHz. Thresholds ranged from 10 to 75 dB SPL. All neurons included in this study had rate-level functions in which spike counts monotonically increased with increasing stimulus level or reached a plateau at the highest levels tested. None had nonmonotonic rate-level functions. For all neurons in our sample, first spike latency stability and the regularity of interspike intervals tended to increase with increasing sound level.
Location in the INLL
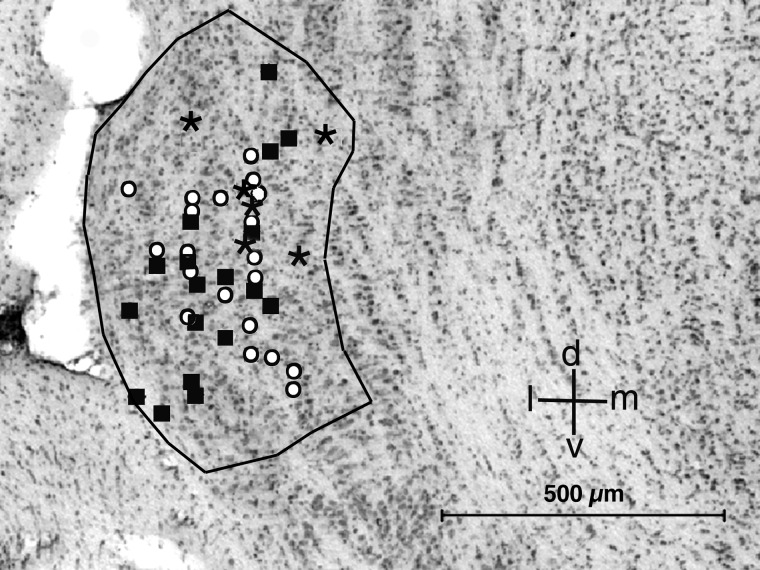
All neurons reported in this study were located in the INLL, and most of them were in the central part of the nucleus. INLL in Eptesicus has a complex tonotopic organization, with a loose low-to-high gradient in the lateral to medial direction (Covey and Casseday 1991). Figure 1 shows the reconstructed dorsoventral and mediolateral positions of all units from which we obtained pharmacological data. Different symbols are used to represent the discharge patterns before application of drugs for each unit included in this study. For the units studied, no systematic relationship was found between discharge pattern and location, best frequency, or threshold. Moreover, there was no systematic relationship between best frequency and discharge pattern or threshold.
FIG. 1.
Reconstruction of recording sites projected onto a representative Nissl-stained coronal section through the central region of intermediate nucleus of the lateral lemniscus (INLL). Symbols represent different discharge patterns under control conditions. ○, sustained; ▪, transient; *, mixed. d: dorsal; v, ventral; m, medial; l, lateral.
Discharge patterns
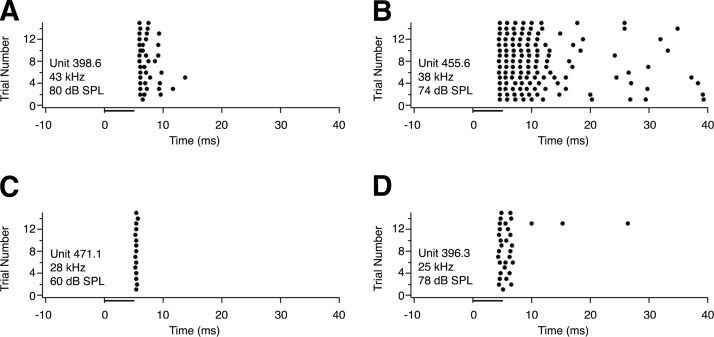
Discharge patterns of neurons in the INLL can be broadly classified into sustained and transient responses (Covey and Casseday 1991). In this study, we also describe a mixed type in which there was a sustained response to frequencies up to and including BF but a transient response to frequencies above BF. Discharge pattern classifications were based on responses to pure tones at each unit's BF, 20 dB above threshold. Examples of typical discharge patterns are shown in Figs. 2 and 3.
FIG. 2.
Dot raster display illustrating typical discharge patterns of units in the INLL in response to 15 presentations of a 5-ms stimulus at the neuron's best frequency, 20 dB above threshold. Sound level is shown on each panel; corresponding attenuation values are given in the text below. The bar below each dot raster shows stimulus duration. A: sustained response with spikes occurring for only the duration of the stimulus (−20 dB); B: sustained response with spikes occurring well beyond the duration of the stimulus (−30 dB); C: transient response with only 1 spike per stimulus (−40 dB); D: transient response with >1 spike per stimulus (−20 dB).
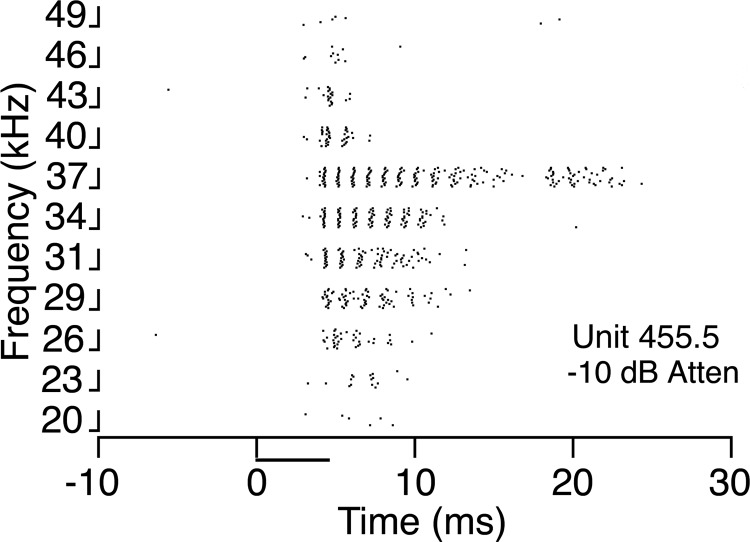
FIG. 3.
Discharge pattern of a neuron in the INLL in response to different frequencies. This unit showed a sustained response at lower frequencies and a transient response at higher frequencies. Responses to tones at different frequencies, 50 dB above threshold, (attenuation of −10 dB). Each vertical bar on the y axis represents 15 trials at a given frequency. Stimulus duration was 5 ms. Threshold for the unit was 40 dB SPL.
Neurons with sustained responses (31/67) were distributed throughout the INLL. Twenty of the 44 units pharmacologically tested had sustained responses. Sustained neurons fired spikes throughout a time period equal to the duration of the auditory stimulus (Fig. 2A) or greater than stimulus duration (B). Sustained neurons showed varying degrees of adaptation; some fired at a high rate initially, but their firing rate progressively decreased throughout the stimulus duration (Fig. 2A), whereas others fired at a nearly constant rate throughout the entire stimulus duration (B). The neuron shown in Fig. 2B not only fired throughout a time period corresponding to the duration of the stimulus but continued to fire sporadically long after the stimulus was over.
Neurons with transient discharge patterns (30/67) were found throughout the entire INLL. Eighteen of these units were pharmacologically tested. Their responses ranged from a single spike per stimulus (Fig. 2C) to several spikes following stimulus onset (D). Transient neurons that fired several spikes differed from sustained neurons in that the number of spikes did not increase when stimulus duration was increased.
Units with mixed discharge patterns (6/67) responded in a sustained fashion to frequencies up to and including BF; above BF they responded in a transient pattern. The reverse pattern was never seen. All six of these units were pharmacologically tested. Figure 3 shows an example of how the discharge pattern of a mixed response neuron changed as a function of frequency. Below BF responses were sustained, or even prolonged beyond the duration of the stimulus, whereas above BF they were transient with one or several spikes.
As in previous studies of latency variability (Covey and Casseday 1991), we calculated average first spike latencies and standard errors for BF tones at 20 dB above threshold. Sustained units' average first-spike latencies ranged from 3.30 to 10.55 ms. Approximately one-third (11/31) of neurons with sustained discharge patterns had first spike latencies with a SE of <0.2 ms. Average first spike latencies of transient neurons ranged from 4.03 to 10.78 ms. Approximately half of the transient neurons (14/30) had a first spike latency with a SE of <0.2 ms across multiple stimulus presentations. Figure 2C shows an example of one of these low jitter neurons. Mixed units' average first-spike latencies ranged from 3.82 to 8.50 ms and none (0/6) had a SE of <0.2 ms.
Effects of bicuculline application
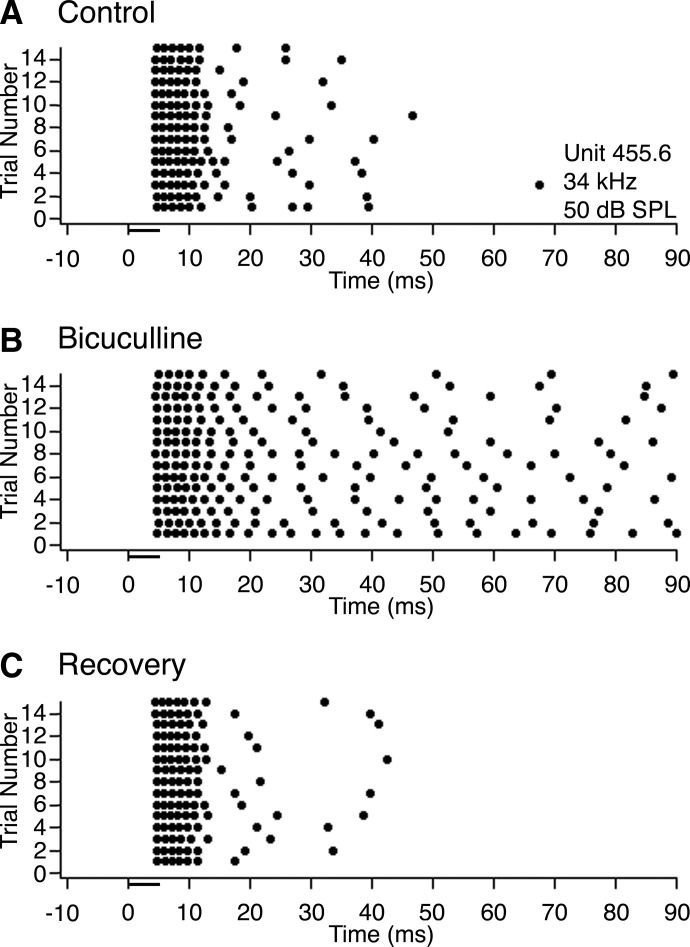
Figure 4 shows an example of the typical effect of bicuculline on a sustained neuron in INLL. Prior to drug application (Fig. 4A) and after recovery (C), the neuron fired a burst of six to seven regularly spaced spikes in response to a 5-ms tone burst with occasional spikes occurring at latencies of as much as ∼50 ms after stimulus onset. When bicuculline was applied (Fig. 4B), the number of spikes per stimulus increased considerably. Although the time axis in Fig. 4B is truncated at 90 ms to provide sufficient resolution of individual spikes, stimulus-evoked firing extended out to ≥200 ms.
FIG. 4.
Effect of bicuculline on the response of a typical neuron in INLL with a sustained discharge pattern. A: dot raster showing responses to 15 trials of a 5-ms pure tone presented at the neuron's best frequency (34 kHz), 20 dB above threshold (50 dB SPL; attenuation of −50 dB). B: dot raster showing the neuron's response to the same stimulus while applying bicuculline to block GABAA receptors. C: dot raster showing the neuron's response after recovering from the effects of bicuculline.
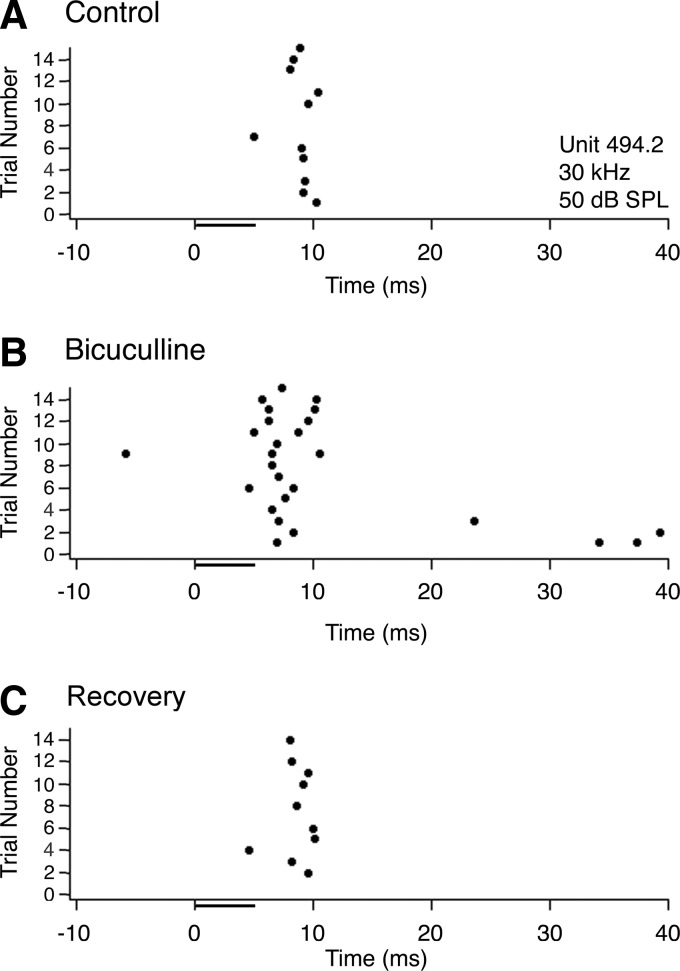
Figure 5 shows an example of the typical effect of bicuculline on a transient neuron. Under control conditions (Fig. 5A) and after recovery (C), the neuron fired one spike with variable latency. During application of bicuculline (Fig. 5B), a few extra spikes were added to the response. In addition, there was a significant decrease in the first spike latency.
FIG. 5.
Effect of bicuculline on the response of a typical neuron in INLL with a transient discharge pattern. A: dot raster showing responses to 15 trials of a 5-ms pure tone presented at the neuron's best frequency (30 kHz), 20 dB above threshold (50 dB SPL; attenuation of −50 dB). B: dot raster showing the neuron's response to the same stimulus while applying bicuculline to block GABAA receptors. C: dot raster showing the neuron's response after recovering from the effects of bicuculline.
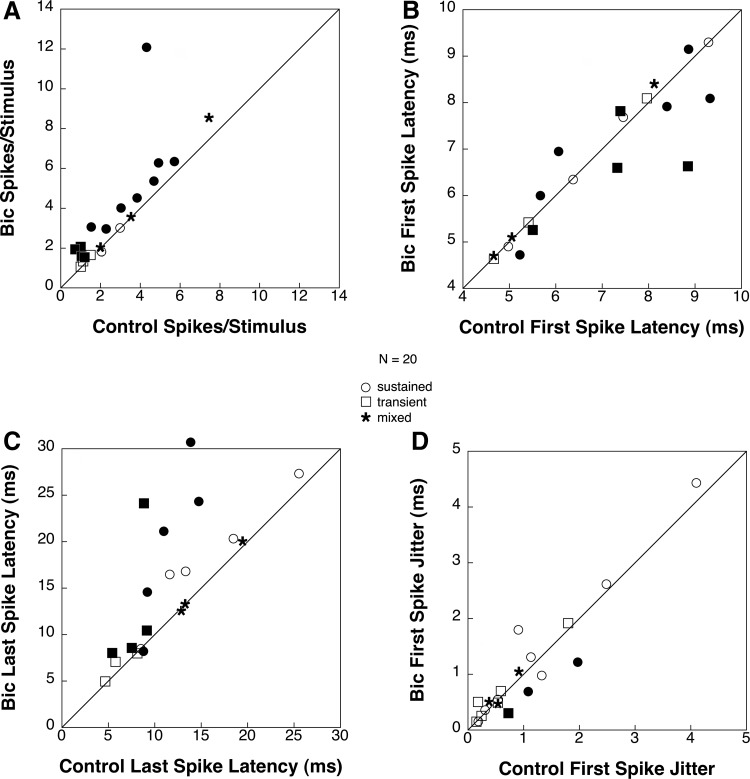
Figure 6 displays population data on the effects of bicuculline on selected response properties for all 20 neurons tested at 20 dB above threshold (10 sustained, 7 transient, and 3 mixed units). Figure 6A compares spikes per stimulus under baseline and drug conditions. Twelve cells (60%) showed a statistically significant increase in spikes/trial during application of bicuculline (t-test: P < 0.05). Eight of these had sustained discharge patterns and four transient. For the sustained units, spike counts increased from an average of 3.52 spikes per stimulus to an average of 4.64 spikes per stimulus (32% increase). For transient units, spikes per trial increased from an average of 1.02 spikes per stimulus to an average of 1.58 spikes per stimulus (55% increase). Eight cells (40%) showed no significant change in spikes/trial. None showed a decrease in spikes/trial. There was no correlation between a cell's location in the INLL or its initial discharge pattern and the extent to which spike count increased during bicuculline application.
FIG. 6.
A comparison of selected response characteristics under control conditions and during bicuculline application for 20 INLL neurons tested with bicuculline. Measurements were taken at 20 dB above threshold. • and ▪ are used to represent units that showed a significant change. Points above the diagonal represent an increase in the value of the tested parameter during drug application and points below the line represent a decrease. Outliers are shown just outside the axis. A: comparison of spikes per trial between drug and baseline conditions. B: comparison of 1st spike latency between drug and baseline conditions. C: comparison of last spike latency between conditions. D: comparison of 1st spike latency jitter (SE of 1st spike latency) between conditions.
Figure 6B compares first spike latency under baseline and drug conditions. Ten cells (50%) showed a statistically significant (t-test: P < 0.05) change in first spike latency during application of bicuculline with four increasing (40%) and six decreasing (60%). For those units in which latency decreased (3 sustained and 3 transient), shifts ranged from 0.04 ms up to ∼2.2 ms. Of the four units (3 sustained and 1 transient) that had a significant increase in first spike latency, all changes were <1 ms. The direction of change in first spike latency did not appear to be correlated with discharge pattern. Ten units (50%) had no significant change in first spike latency under bicuculline application.
Figure 6C compares last spike latency under baseline and drug conditions. Last spike latency increased significantly (t-test: P < 0.05) in eight units (40%), decreased significantly in one (5%), and remained unchanged in 11 units (55%). Of the eight units that had a significant increase in last spike latency, four were sustained and four were transient. Most of these increases in response duration were relatively small (<5 ms), but four units had large increases of >10 ms.
Figure 6D illustrates population data on first spike latency jitter (SE of 1st spike latency) for the 20 cells tested with bicuculline. During bicuculline application, first spike latency jitter decreased significantly (t-test: P < 0.05) in only three units (15%) and remained unchanged in the other 17 units. Of the three units that changed, one was transient and two were sustained. The changes in first spike latency jitter were small, ranging from 0.35 to 0.70 ms.
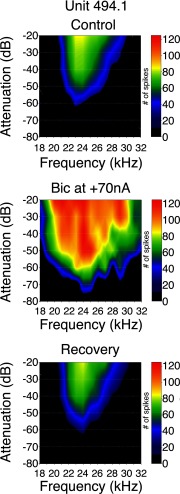
Figure 7 shows an example of the effects of bicuculline on the frequency response area of a neuron with a sustained discharge pattern. The neuron had a best frequency of 24 kHz, a threshold of 37 dB SPL (60 dB attenuation), and it initially responded to frequencies ranging from 21 to 29 kHz at 57 dB SPL (40 dB attenuation). When bicuculline was applied (Fig. 7, middle), the best frequency remained the same, but the neuron responded to a wider range of frequencies (18–32 kHz). Threshold decreased by 15 dB SPL (75 dB attenuation). After the effects of bicuculline wore off (Fig. 7, bottom), the neuron's frequency response area returned to baseline.
FIG. 7.
Effects of bicuculline on the frequency response area of a sustained neuron with a best frequency of 24 kHz. The frequency response area is shown as a contour plot that displays the total number of spikes for each frequency/intensity combination across the entire set of stimulus conditions tested. Frequency is represented along the x axis and sound level (plotted as attenuation relative to maximum stimulation) along the y axis. Right: the spike count associated with each color in the graph. Top: control frequency response area. Middle: frequency response area during application of bicuculline. Bottom: frequency response area after recovery from bicuculline application.
The majority of neurons tested with bicuculline (14/20) did not experience any changes in their frequency response areas. For five neurons, frequency response areas broadened. The extra frequency/intensity combinations added during bicuculline application were always at both the high and low borders of the control frequency response area. BF did not change for any of these neurons, but threshold dropped by 10 dB in two neurons, 15 dB in one neuron, 20 dB in one neuron, and was unaffected in the remaining two cells. In one neuron, bicuculline application caused the frequency response area to narrow. In this case, the high-frequency border of the tuning curve shifted downward by 6 kHz, from 57 to 51 kHz, with no change in BF or threshold. Q10 values under control conditions ranged from 0.95 to 17.0 with an average of 6.36. During bicuculline application, Q values at the same sound level ranged from 1.2 to 17.0 with an average of 5.85. The change in average Q value was not statistically significant.
Effects of stychnine application
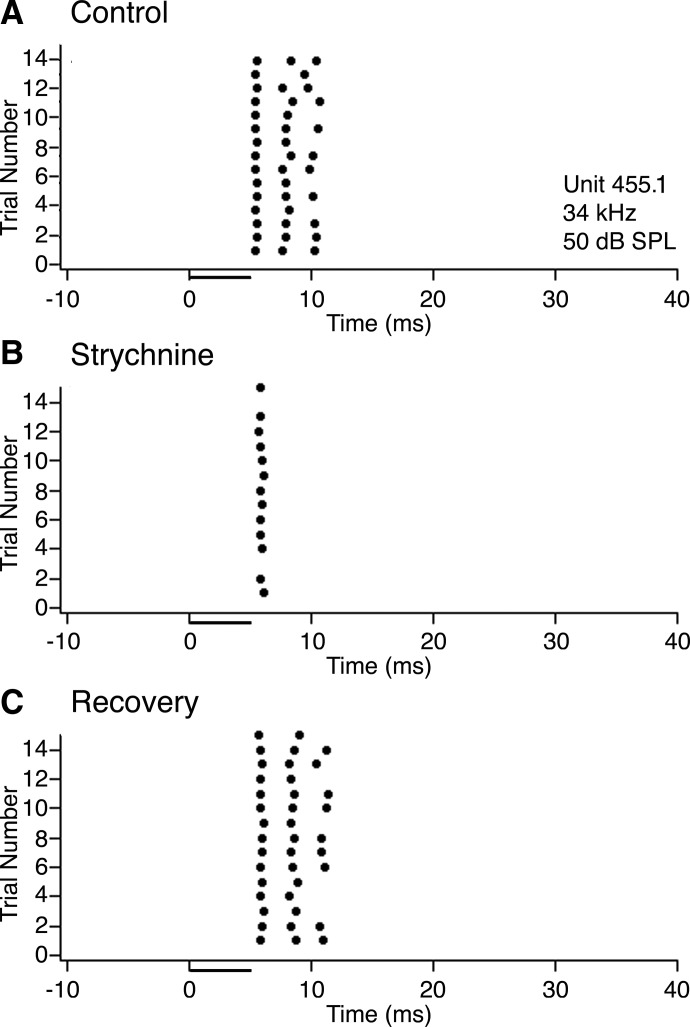
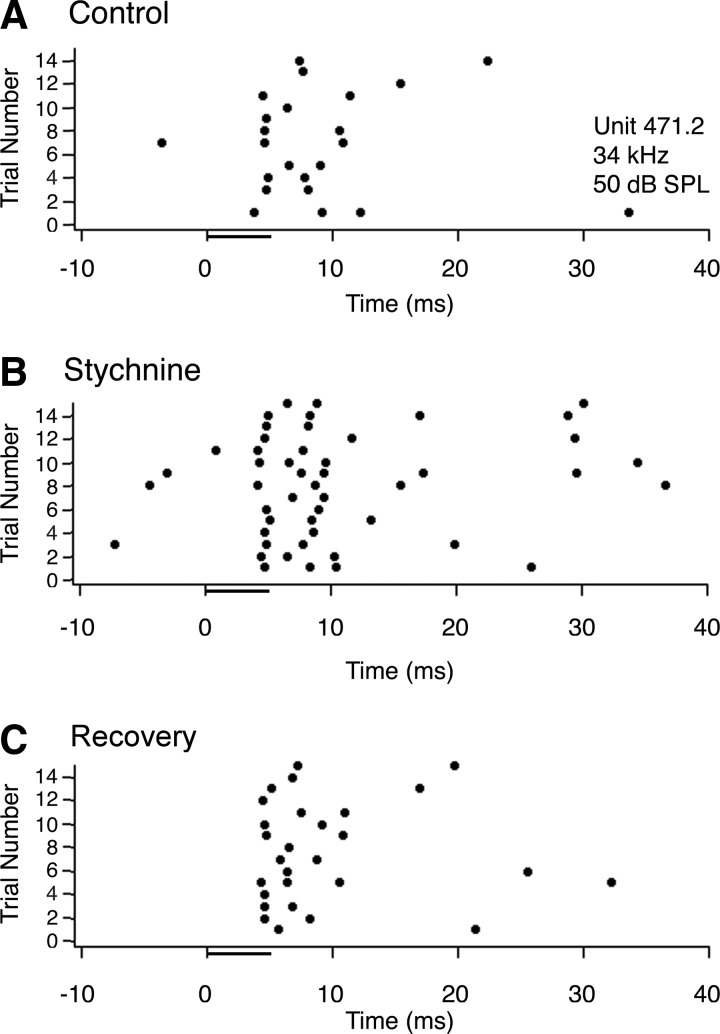
For most units affected by strychnine, application of this drug had the unexpected effect of decreasing overall responsiveness. The effect was especially pronounced in sustained responders. Figure 8 shows an example of a sustained neuron in which strychnine caused a reduction in spike count. Prior to strychnine application (Fig. 8A) and after recovery (Fig. 8C), this neuron had no spontaneous activity and responded on every trial with two or three spikes per stimulus. When strychnine was applied (Fig. 8B), the response to each stimulus presentation was reduced to a single spike, and on two trials, the cell did not respond at all.
FIG. 8.
Typical effect of strychnine on the response of a neuron with a sustained discharge pattern. A: dot raster showing responses to 15 trials of a 5ms pure tone presented at the neuron's best frequency (34 kHz), 20 dB above threshold (50 dB SPL; attenuation of −50 dB). B: dot raster for the same neuron and same stimulus while applying strychnine to block glycine receptors. C: dot raster showing the neuron's response after recovering from the effects of strychnine.
Figure 9 shows an example of the less common effect of strychnine, a transient unit that increased its spike count during drug application. Under control conditions (Fig. 9A) and after recovery (C), the neuron fired an average of 2.26 spikes per trial with variable latency and had a small amount of spontaneous activity. During application of strychnine (Fig. 9B), the neuron increased its firing rate to 4.2 spikes per trial. The level of spontaneous activity also increased.
FIG. 9.
Effect of strychnine on the response of a transient burst neuron that increased its spike count. A: dot raster showing the responses to 15 trials of a 5-ms pure tone presented at the neuron's best frequency (34 kHz), 20 dB above threshold (34 dB SPL; attenuation of −50). B: dot raster for the same neuron while applying strychnine to block glycine receptors. C: dot raster showing the neuron's response after recovering from the effects of strychnine.
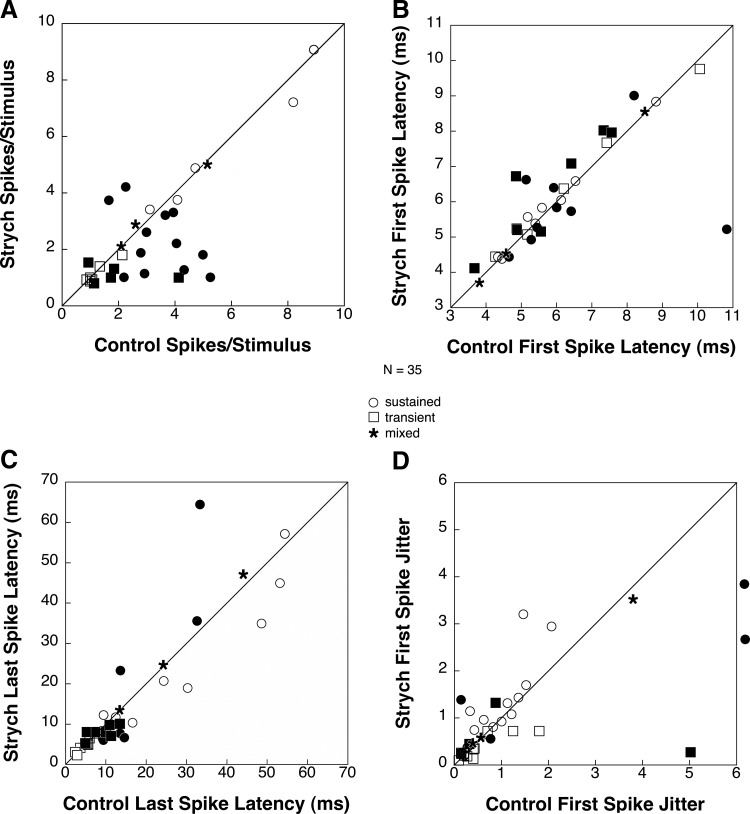
Figure 10 displays population data on the effects of strychnine application on selected response properties for all 35 neurons tested (18 sustained, 14 transient, and 3 mixed). The number of spikes per stimulus (Fig. 10A) underwent a significant change (t-test: P < 0.05) in 17 units (49%) with 14 decreasing and 3 increasing. Of the 14 units that had a significant decrease in number of spikes, 10 were sustained and four were transient units that fired several spikes per stimulus presentation. Spike counts decreased from an average of 3.23 spikes per stimulus to an average of 1.56 spikes per stimulus (52% decrease). The effect on sustained units was so strong that it reduced their discharges to a single action potential per trial in 40% of cases. Of the three units that had a significant increase in spikes per stimulus, two were sustained and one was transient. For these units, spike counts increased from an average of 1.62 spikes per stimulus to an average of 3.15 spikes per stimulus (94% increase).
FIG. 10.
Comparison of selected response characteristics under control conditions and during strychnine application for 35 INLL neurons tested with strychnine. Measurements were taken at 20 dB above threshold. Filled markers are used to represent units that showed a significant change. Points along the line represent no change between baseline and drug conditions. Points above the line represent an increase of the tested parameter during drug conditions while points below the line represent a decrease of the tested parameter during drug conditions. Outliers are shown just outside the axis. A: comparison of spikes per trial between drug and baseline conditions. B: comparison of 1st spike latency between drug and baseline conditions. C: comparison of last spike latency between conditions. D: comparison of 1st spike latency jitter between conditions. Two outlying data points have been omitted for clarity.
First spike latency (Fig. 10B) underwent a small but statistically significant (t-test: P < 0.05) change in 17 units with latency increasing in 10 neurons and decreasing in seven. Although the changes in first spike latency were small, they were statistically significant due to extremely small variability in first spike latencies across stimulus presentations. Of the 10 units that had a significant increase in first spike latency, three were sustained and seven were transient. For these units, first spike latency increased from an average of 5.28 ms to an average of 5.93 ms (12% increase). Of the seven units that had a significant decrease in first spike latency, six were sustained and one was transient. First spike latency decreased from an average of 5.14 ms to an average of 4.91 ms (4% decrease).
Last spike latency (Fig. 10C) changed significantly (t-test: P < 0.05) in 13 units (38%), increasing in 6 and decreasing in 7. Of those that increased, three were sustained and three were transient. For the sustained units, last spike latency increased from an average of 25.19 ms to an average of 37.34 ms (48% increase). The high average value was largely due to the contribution of one unit that increased its last spike latency by 30 ms. For the transient units, last spike latency increased from an average of 4.06 ms to an average of 5.80 ms (43% increase).
Of the seven units with a significant decrease in last spike latency, three were sustained and four were transient. For the sustained units, last spike latency decreased from an average of 11.12 ms to an average of 6.30 ms (43% decrease). For the transient units, last spike latency decreased from an average of 10.70 ms to an average of 8.24 ms (23% decrease).
First spike latency jitter (Fig. 10D) changed significantly (t-test: P < 0.05) in nine units (26%), increasing in four and decreasing in five. The direction of change in first spike latency jitter was not correlated with the discharge pattern of the unit prior to drug application.
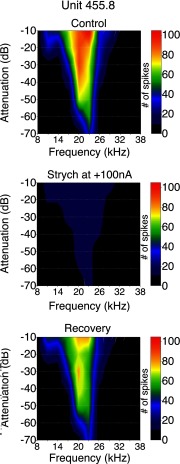
Figure 11 shows an example of the effects of strychnine on the frequency response area of a neuron with a sustained discharge pattern. The neuron was broadly tuned with a BF of 23 kHz and a threshold of 27 dB SPL (−70 dB attenuation). At the peak level tested, 85 dB SPL (−10 dB attenuation) it initially responded to frequencies ranging from 8 to 32 kHz. When strychnine was applied (Fig. 11, middle), the BF remained the same, the neuron continued to respond to the same range of frequencies (8–32 kHz) at peak intensity and retained its predrug threshold of 27 dB SPL (−70 dB attenuation). The only changes during strychnine application were a reduction in spikes per stimulus throughout its frequency response area. After the effects of strychnine wore off (Fig. 11, bottom), the neuron once again responded to each frequency/intensity combination with multiple spikes. None of the 35 neurons tested with strychnine showed any pronounced changes in their frequency response area or threshold, only a change in the number of spikes fired. Under control conditions, Q10 values ranged from 1.4 to 17.0, with an average of 5.6. During strychnine application, Q values for these same neurons at the same sound level ranged from 1.2 to 17 with an average of 6.0. The change in average Q value was not statistically significant.
FIG. 11.
Effects of strychnine on the frequency response area of a sustained neuron with a best frequency of 23 kHz. The frequency response area is shown as a contour plot that displays the total number of spikes for each frequency/intensity combination across the entire set of stimulus conditions tested. Frequency is represented along the x axis and sound level (plotted as attenuation relative to maximum stimulation) along the y axis. Right: the spike count associated with each color in the graph. Top: control frequency response area. Middle: frequency response area during application of strychnine. Bottom: frequency response area after recovery from strychnine application.
Eleven neurons were tested with both bicuculline and strychnine, each applied separately. Of these 11 neurons, 7 had sustained discharge patterns and 4 had transient discharge patterns. Three of the sustained units showed no change in discharge pattern in response to either drug, two showed changes in discharge patterns to bicuculline but not strychnine, one showed changes during strychnine application but not bicuculline application, and one unit showed changes in discharge patterns to both drugs. Two of the transient units showed significant changes to bicuculline only and two showed significant changes to strychnine only. Everything about the responses of these neurons was consistent with what was seen in cells tested with only a single drug.
DISCUSSION
The results presented here indicate that GABA and glycine each play a role in shaping the discharge patterns of units in the INLL of the big brown bat and that the effects depended to some degree on the initial discharge pattern of the neuron as well as which neurotransmitter was blocked. Nevertheless, some general patterns emerged that were characteristic of each class of inhibitory neurotransmission.
General properties and discharge patterns
In addition to providing information about neurotransmitter action, these studies also provide information about some distinctive temporal features of INLL neurons' discharge patterns that have not been described before.
Previous reports (Covey 1993; Covey and Casseday 1991; Haplea et al. 1994) have shown that most neurons in the INLL have little or no spontaneous activity, they are monaural, their frequency response areas are similar to those of auditory nerve fibers or neurons in the AVCN, and their discharge patterns are heterogeneous (Covey and Casseday 1991). As in previous studies, we found no correlation between discharge pattern and units' location, best frequency, or threshold.
One interesting and potentially important finding that has not been previously reported was that INLL contains neurons that, under control conditions, respond with prolonged discharges, the duration of which greatly exceeds the duration of the stimulus used to evoke the response. Studies in which inhibitory input to IC neurons was blocked have revealed prolonged discharges as well, suggesting that they receive inputs that provide long-lasting excitation (e.g., Klug et al. 1995; Pollak and Park 1993; Vater et al. 1992). Other findings indicate that some types of IC neurons receive inhibition that lasts well beyond the duration of the stimulus that evoked the inhibition (Covey et al. 1996; Faure et al. 2003). Our findings indicate that INLL could be at least one source of prolonged inputs to the IC. Because the INLL contains both excitatory and inhibitory projection neurons, the input from INLL to the IC could be either excitatory or inhibitory (Covey and Casseday 1998). The finding that the responses of sustained INLL neurons with long-lasting discharges lengthened even further when bicuculline was applied suggests that the processes through which GABAA receptors shape discharge patterns may be similar in INLL and IC. At present, there is no indication of how INLL or IC neurons acquire such prolonged discharge patterns.
Another class of INLL neuron that has not been described before are those that respond with a sustained discharge pattern up to and including best frequency but with a transient discharge pattern above BF. These neurons were quite stereotyped and were affected very little by blocking GABAA or glycine receptors. To our knowledge, such neurons have not been seen at lower levels in the brain stem, so it is likely that this novel discharge pattern arises at the INLL neuron itself, possibly through specific combinations of inputs from different frequencies and/or some intrinsic property of INLL neurons. It is likely that these neurons were missed in an earlier study that included INLL (Covey and Casseday 1991) because the methods at that time consisted of collecting data on discharge patterns at only one or two sound levels and obtaining an audio-visual tuning curve rather than a comprehensive set of responses across all frequencies and sound levels. Later studies that included INLL (Huffman and Covey 1998a, b) focused on responses to modulated sounds rather than pure tones.
Effect of blocking inhibition on discharge patterns
The spatial location of units in the INLL was not a good predictor of how drug application would affect discharge pattern. The strongest predictor of drug effect was the initial discharge pattern of the unit. This was true for both bicuculline and strychnine.
The main effect of bicuculline on INLL neurons was to increase the number of spikes per trial in both transient and sustained units. This effect is consistent with what has been seen at multiple levels of the auditory system, in both monaural and binaural pathways (Burger and Pollak 1998; Casseday et al. 1994; LeBeau et al. 1996; Park and Pollak 1993). This finding suggests that GABA normally functions to reduce the overall level of spiking in response to an auditory stimulus. This reduction in spiking could provide a form of gain control in INLL units and could also help regulate the period of time over which the neuron discharges action potentials. A particularly interesting finding was that application of bicuculline often caused responses to persist for much longer than the duration of the stimulus. In the most extreme case, the duration of the response lasted 200 ms longer than the duration of the auditory stimulus. These findings suggest that under normal conditions, GABAergic input has a longer latency than the excitatory input and functions to cancel the later part of that excitatory input as proposed in a model by Grothe (1994). Thus the primary function of GABA in most INLL units is to suppress the late part of the response. Another implication is that many INLL neurons receive excitation that lasts considerably longer than the stimulus or else have circuit connections or intrinsic properties that prolong the depolarization caused by a short excitatory synaptic input.
The application of bicuculline did not have a consistent effect on the first spike latency of INLL units with some increasing slightly and others decreasing slightly. Because the effects on latency were small and inconsistent, we can conclude that GABAergic inhibition does not play a robust and straightforward role in regulating first spike latency.
In addition to increasing spike counts and response durations, we found that blocking GABAergic inputs resulted in small expansions of the frequency response areas of some neurons due to the addition of responses at frequency/intensity combinations near the border of predrug frequency response areas. We also witnessed a lowering of thresholds in a small sample of the neurons tested. However, the best frequency of the units did not change despite differences in width of tuning and threshold. This suggests that GABA plays a role in sculpting the frequency tuning of some INLL units and is instrumental in providing gain control for excitatory inputs. Because BF was unaffected by GABAergic inhibition, we conclude that the unit's best frequency is a characteristic that is inherited through the excitatory inputs that it receives.
The most prominent and consistent effect of strychnine application on INLL units was to decrease spike counts and reduce the duration of responses to auditory stimulation in units with sustained discharge patterns. The decreases in spikes/stimulus were due to the removal of spikes from the end of the response during strychnine application. In many cells, the effect was so strong that it reduced sustained discharges to a single action potential on each trial. This suggests that one role of glycine in the INLL is to promote increased spiking in response to an auditory stimulus in a subpopulation of neurons.
There is some precedent for glycine acting in a facilitatory way in the central auditory system. Turecek and Trussel (2001) described in vitro evidence that glycine acts presynaptically in MNTB to enhance the amplitude and duration of excitatory postsynaptic currents (EPSCs). In their study, glycine activated a depolarizing chloride current that in turn raised presynaptic calcium concentration, leading to increased release of excitatory neurotransmitter. It is certainly conceivable that a similar mechanism operates in the INLL. Direct evidence of facilitation of spiking by glycine has not been seen in vivo before, although there have been reports that strychnine eliminates facilitation to the second of two sounds in combination-sensitive neurons of the IC (e.g., Sanchez et al. 2008). These findings taken together suggest that facilitation of excitatory input by glycine under certain circumstances may be an unusual feature that is shared by at least three separate populations of neurons in the lower brain stem auditory pathways.
Although our data provide no evidence regarding the mechanism underlying the paradoxical effect of blocking glycine in INLL, it is interesting to speculate on how such an effect could come about and how it could be reconciled with the observation that iontophoretic application of glycine itself suppresses sound-evoked responses in INLL neurons. If glycine operates presynaptically in a facilitatory manner, it could well be that the effect is concentration-dependent, and the amount of glycine applied in our experiments was outside the physiological range. Another possible explanation could be that glycinergic inhibition, possibly from the MNTB, arrives quickly and is short in duration, producing a rebound depolarization that coincides with and potentiates an excitatory sound-evoked input to the INLL neuron. Continuous iontophoretic application of glycine would not provide the coincidence of depolarizing forces necessary to drive the cell. Even without an excitatory rebound, it is possible that glycinergic inhibition could arrive before excitation and hyperpolarize the neuron, resulting in a different discharge pattern than if the cell was at resting potential when excitation arrived. A similar effect of varying the membrane potential on discharge patterns evoked by depolarization steps has been described for pyramidal cells of the dorsal cochlear nucleus (Kanold and Manis 2001). It is also possible that, once excitation has occurred, glycinergic input could act to quickly repolarize the neural membrane enough to prohibit voltage-gated delayed rectifier K channels from preventing spiking during a continuous stimulus.
In neurons that only fired one spike per trial to begin with, strychnine application did not abolish the first spike nor did it have any other discernable effect. The mechanism by which INLL neurons respond with a single spike at stimulus onset is not well understood. It could directly reflect an input from the cochlear nucleus that fires with a single spike, membrane properties of the cell that render it unresponsive after discharging one action potential (Covey and Casseday 1991), or GABAergic inhibition that limits the response to one spike.
Application of strychnine had a small and inconsistent effect on first spike latency and first spike latency jitter. Therefore it does not appear that timing of the first spike of a response is directly controlled by glycinergic inhibition in INLL.
Strychnine application did not affect the frequency response areas of any of the units tested in this study. When strychnine affected discharge patterns of units, it did so equally at all frequency/intensity combinations tested without causing a change in width of frequency tuning, consistent with a gain control role for glycine in INLL. Thresholds were similarly unaffected. This suggests that glycinergic inhibition plays a more significant role in regulating discharge patterns than establishing frequency tuning or regulating thresholds in INLL.
Because neither first spike latency nor first spike latency jitter were affected in any consistent way by blocking GABA or glycine, it could be that first spike timing properties simply reflect those of the inputs to INLL neurons. However, some latencies found in INLL are longer than what would be expected based on the range of latencies of cochlear nucleus neurons together with synaptic transmission in direct ascending pathways, suggesting that latencies of these neurons are more than a simple reflection of the inputs (Casseday and Covey 1995). It is possible that this increased latency range is due to integrative processes that do not depend on neural inhibition and therefore could not be determined from these experiments.
Taken as a whole, our results represent a first step in discovering which aspects of INLL responses are controlled by synaptic inhibition and which are not. Response characteristics such as first spike timing and best frequency appear to be determined by the inputs each cell receives, independent of any inhibitory control. In contrast, both glycinergic and GABAergic inhibition appear to play significant roles in transforming temporal discharge patterns. GABA shortens the duration of sustained responses, whereas glycine prolongs the time course of responses in some neurons. GABAergic inhibition plays at least a limited role in modulating the width of frequency tuning and establishing thresholds of some INLL units. Although the function of the INLL is still not clear, we have gained an idea of how inhibition functions in this part of the auditory brain stem and how it modifies discharge patterns for transmission to the inferior colliculus.
GRANTS
This research supported by National Institute on Deafness and Other Communication Disorders R01 Grants DC-00287, DC-00607, and DC-P30 P30DC-004661 and Training Grant T32-DC05361.
Acknowledgments
We thank K. Miller and G. Valentine for technical assistance and B. Warren for expert programming.
REFERENCES
- Burger and Pollak 1998.Burger RM, Pollak GD. Analysis of the role of inhibition in shaping responses to sinsusoidally amplitude-modulated signals in the inferior colliculus. J Neurophysiol 80: 1686–1701, 1998. [DOI] [PubMed] [Google Scholar]
- Casseday and Covey 1995.Casseday JH, Covey E. Mechanisms for analysis of auditory temporal patterns in the brainstem of echolocating bats. In: Neural Representation of Temporal Patterns, edited by Covey E, Hawkins H, Port R. New York: Plenum, 1995, p. 25–51.
- Casseday and Covey 1996.Casseday JH, Covey E. A neuroethological theory of the operation of the inferior colliculus. Brain Behav Evol 47: 311–336, 1996. [DOI] [PubMed] [Google Scholar]
- Casseday et al. 1994.Casseday JH, Ehrlich D, Covey E. Neural tuning for sound duration: role of inhibitory mechanisms in the inferior colliculus. Science 264: 847–850, 1994. [DOI] [PubMed] [Google Scholar]
- Casseday et al. 2000.Casseday JH, Ehrlich D, Covey E. Neural measurement of sound duration: control of excitatory-inhibitory interactions in the inferior colliculus. J Neurophysiol 84: 1475–1487, 2000. [DOI] [PubMed] [Google Scholar]
- Covey 1993.Covey E The monaural nuclei of the lateral lemniscus: Parallel pathways from cochlear nucleus to midbrain. In: The Mammalian Cochlear Nuclei: Organization and Function, edited by Merchan MA, Juiz JM, Godfrey DA. New York: Plenum, 1993, pp. 321–334.
- Covey 2000.Covey E Neural population coding and auditory temporal pattern analysis. Physiol Behav 69: 211–220, 2000. [DOI] [PubMed] [Google Scholar]
- Covey 2003.Covey E Brainstem mechanisms for analyzing temporal patterns of echolocation sounds: a model for understanding early stages of speech? Speech Commun 41: 151–163, 2003. [Google Scholar]
- Covey and Casseday 1986.Covey E, Casseday JH. Connectional basis for frequency representation in the nuclei of the lateral lemniscus of the bat, Eptesicus fuscus. J Neurosci 6: 2926–2940, 1986. [DOI] [PMC free article] [PubMed] [Google Scholar]
- Covey and Casseday 1991.Covey E, Casseday JH. The monaural nuclei of the lateral lemniscus in an echolocating bat: parallel pathways for analyzing temporal features of sound. J Neurosci 6: 3456–3470, 1991. [DOI] [PMC free article] [PubMed] [Google Scholar]
- Covey and Casseday 1998.Covey E, Casseday JH. Brainstem circuits for processing time-varying information. In: Psychophysical and Physiological Advances in Hearing, edited by Palmer AR, Rees A, Summerfield AQ, Meddis R. London: Whurr Publishers, 1998, p. 536–545.
- Covey and Casseday 1999.Covey E, Casseday JH. Timing in the auditory system of the bat. Annu Rev Physiol 61: 457–76, 1999. [DOI] [PubMed] [Google Scholar]
- Covey et al. 1996.Covey E, Kauer JA, Casseday JH. Whole-cell patch-clamp recording reveals subthreshold sound-evoked postsynaptic currents in the inferior colliculus of awake bats. J Neurosci 16: 3009–3018, 1996. [DOI] [PMC free article] [PubMed] [Google Scholar]
- Ehrlich et al. 1997.Ehrlich D, Casseday JH, Covey E. Neural tuning to sound duration in the inferior colliculus of the big brown bat, Eptesicus fuscus. J Neurophysiol 77: 2360–2372, 1997. [DOI] [PubMed] [Google Scholar]
- Faure et al. 2003.Faure PA, Fremouw T, Casseday JH, Covey E. Temporal masking reveals properties of sound-evoked inhibition in duration-tuned neurons of the inferior colliculus. J Neurosci 23: 3052–3065, 2003. [DOI] [PMC free article] [PubMed] [Google Scholar]
- Friauf and Ostwald 1988.Friauf E, Ostwald J. Divergent projections of physiologically characterized rat ventral cochlear nucleus neurons as shown by intra-axonal injections of horseradish peroxidase. Exp Brain Res 73: 263–284, 1988. [DOI] [PubMed] [Google Scholar]
- Fubara et al. 1996.Fubara BM, Casseday JH, Covey E. Distribution of GABAA, GABAB and glycine receptors in the central auditory system of the big brown bat, Eptesiscus fuscus. J Comp Neurol 369: 83–92, 1996. [DOI] [PubMed] [Google Scholar]
- Fuzessery and Hall 1996.Fuzessery ZM, Hall JC. Role of GABA in shaping frequency tuning and creating FM sweep selectivity in the inferior colliculus. J Neurophysiol 76: 1059–73, 1996. [DOI] [PubMed] [Google Scholar]
- Glendenning et al. 1981.Glendenning KK, Brunso-Bechtold JK, Thompson GC, Masterson RB. Ascending auditory afferents to the nuclei of the lateral lemniscus. J Comp Neurol 197: 673–703, 1981. [DOI] [PubMed] [Google Scholar]
- Grothe 1994.Grothe B Interaction of excitation and inhibition in processing of pure tone and amplitude-modulated stimuli in the medial superior olive of the mustached bat. J Neurophysiol 71: 706–721, 1994. [DOI] [PubMed] [Google Scholar]
- Grothe and Park 1998.Grothe B, Park TJ. Sensitivity to interaural time differences in the medial superior olive of a small mammal, the Mexican free-tailed bat. J Neurosci 18: 6608–6622, 1998. [DOI] [PMC free article] [PubMed] [Google Scholar]
- Grothe et al. 1997.Grothe B, Park TJ, Schuller G. Medial superior olive in the free-tailed bat: response to pure tones and amplitude-modulated tones. J Neurophysiol 77: 1553–1565, 1997. [DOI] [PubMed] [Google Scholar]
- Grothe et al. 1992.Grothe B, Vater M, Casseday JH, Covey E. Monaural interaction of excitation and inhibition in the medial superior olive of the mustached bat: an adaptation for biosonar. Proc Nat Acad Sci USA 89: 5108–5112, 1992. [DOI] [PMC free article] [PubMed] [Google Scholar]
- Haplea et al. 1994.Haplea S, Covey E, Casseday JH. Frequency tuning and response latencies at three levels in the brain stem of the echolocating bat, Eptesicus fuscus. J Comp Physiol [A] 174: 671–683, 1994. [DOI] [PubMed] [Google Scholar]
- Havey and Caspary 1980.Havey DC, Caspary DM. A simple technique for constructing “piggy-back” multibarrel electrodes. Electroencephalogr Clin Neurophysiol 48: 249–251, 1980. [DOI] [PubMed] [Google Scholar]
- Huffman et al. 1998a.Huffman RF, Argeles PC, Covey E. Processing of sinusoidally frequency modulated signals in the nuclei of the lateral lemniscus of the big brown bat, Eptesicus fuscus. Hear Res 126: 161–180, 1998a. [DOI] [PubMed] [Google Scholar]
- Huffman et al. 1998b.Huffman RF, Argeles PC, Covey E. Processing of sinusoidally amplitude modulated signals in the nuclei of the lateral lemniscus of the big brown bat, Eptesicus fuscus. Hear Res 126: 181–200, 1998b. [DOI] [PubMed] [Google Scholar]
- Huffman and Covey 1995.Huffman RF, Covey E. Ascending projections to the nuclei of the lateral lemniscus in the big brown bat, Eptesicus fuscus. J Comp Neurol 357: 532–545, 1995. [DOI] [PubMed] [Google Scholar]
- Kanold and Manis 2001.Kanold PO, Manis PB. A physiologically based model of discharge pattern regulation by transient K+ currents in cochlear nucleus pyramidal cells. J Neurophysiol 85: 523–538, 2001. [DOI] [PubMed] [Google Scholar]
- Klug et al. 1995.Klug A, Park TJ, Pollak GD. Glycine and GABA influence binaural processing in the inferior colliculus of the mustache bat. J Neurophysiol 74: 1701–13, 1995. [DOI] [PubMed] [Google Scholar]
- LeBeau et al. 1996.LeBeau FEN, Rees A, Malmierca MS. Contribution of GABA and glycine mediated inhibition to monaural temporal response properties of neurons in the inferior colliculus. J Neurophysiol 75: 902–919, 1996. [DOI] [PubMed] [Google Scholar]
- Park and Pollak 1993.Park TJ, Pollak GD. GABA shapes a topographic organization of response latency in the mustache bat's inferior colliculus. J Neurosci 13: 5172–5187, 1993. [DOI] [PMC free article] [PubMed] [Google Scholar]
- Pollak and Park 1993.Pollak GD, Park TJ. The effects of GABAergic inhibition on monaural response properties of neurons in the mustache bat's inferior colliculus. Hear Res 65: 99–117, 1993. [DOI] [PubMed] [Google Scholar]
- Sanchez et al. 2008.Sanchez JT, Gans D, Wenstrup JJ. Glycinergic inhibition mediates selective excitatory responses to combinations of sounds. J Neurosci 28: 80–90, 2008. [DOI] [PMC free article] [PubMed] [Google Scholar]
- Turecek and Trussell 2001.Turecek R, Trussell LO. Presynaptic glycine receptors enhance transmitter release at a mammalian central synapse. Nature 411: 587–590, 2001. [DOI] [PubMed] [Google Scholar]
- Vater et al. 1997.Vater M, Covey E, Casseday JH. The columnar region of the ventral nucleus of the lateral lemniscus in the big brown bat (Eptesicus fuscus): synaptic arrangements and structural correlates of feedforward inhibitory function. Cell Tissue Res 289: 223–233, 1997. [DOI] [PubMed] [Google Scholar]
- Vater and Feng 1990.Vater M, Feng AS. Functional organization of ascending and descending connections of the cochlear nucleus of horseshoe bats. J Comp Neurol 292: 373–395, 1990. [DOI] [PubMed] [Google Scholar]
- Vater et al. 1992.Vater M, Habbicht H, Kossl M, Grothe B. The functional role of GABA and glycine in monaural and binaural processing in the inferior colliculus of horseshoe bats. J Comp Physiol [A] 171: 541–553, 1992. [DOI] [PubMed] [Google Scholar]
- Yang et al. 1992.Yang L, Pollak GD, Resler C. GABAergic circuits sharpen tuning curves and modify response properties in the mustache bat inferior colliculus. J Neurophysiol 68: 1760–1774, 1992. [DOI] [PubMed] [Google Scholar]
- Zook and Casseday 1985.Zook JM, Casseday JH. Projections from the cochlear nuclei in the mustache bat, Pteronotus parnellii. J Comp Neurol 261: 347–361, 1985. [DOI] [PubMed] [Google Scholar]


