

Abstract
Mice are used in many studies to determine the role of genetic and molecular factors in mammalian development and human congenital diseases. MRI has emerged as a major method for analyzing mutant and transgenic phenotypes in developing mice, at both embryonic and neonatal stages. Progress in this area is reviewed, with emphasis on the use of MRI to analyze cardiovascular and neural development in mice. Comparisons are made with other imaging technologies, including optical and ultrasound imaging, discussing the potential strengths and weaknesses of MRI and identifying the future challenges for MRI in mouse developmental biology.
Keywords: MRI, diffusion tensor imaging, brain, cardiovascular
INTRODUCTION
The mouse is the preferred model organism for studies of mammalian development, offering extensive genetic data including the complete DNA sequence database, a large and growing set of tools for altering the mouse genome, and a rich resource of many transgenic and mutant strains. As a result, numerous in vivo investigations now utilize genetically engineered mice to identify and study the genetic and molecular factors controlling embryonic and early postnatal development. A limiting factor in these studies is often the lack of efficient methods for analyzing the anatomical and functional phenotypes of transgenic and mutant mice, which exhibit cellular defects that develop in three-dimensions (3D) over time periods from days to weeks.
MRI is an inherently 3D imaging method, applicable for mouse phenotyping, both in vivo and ex vivo in fixed samples. Although MRI is well developed for anatomical imaging in larger animals and humans, significant technical challenges must be faced to apply these methods in the embryonic and neonatal mouse. For mouse MRI studies, even in adult animals, image resolution is often a limiting factor to extracting useful anatomical information. Image resolution in the much smaller mouse embryo or neonate presents even more of a challenge than in adults. As in all MRI, resolution is a function of signal-to-noise ratio (SNR) and scanning time. Although the physical limit of spatial resolution is approximately 10 μm, the practical limit is currently much greater to obtain reasonable SNR within realistic imaging times. Contrast resolution is as important as spatial resolution for analyzing anatomical features. This presents a special challenge in the developing mouse, where many cells and tissues are undifferentiated or immature, resulting in minimal differences in the MR relaxation properties exploited for image contrast in the adult animal.
Moving beyond anatomical imaging, MRI currently provides a variety of approaches for studying physiological function including cardiac contractility, blood volume and flow, and neural activity. These functional MRI methods are often low resolution compared with anatomical imaging, and therefore can be difficult to apply in mice at earlier developmental stages. Cellular and molecular MRI is still in its infancy, but has enormous potential to affect studies of development, where in vivo cell tracking and imaging of gene expression may provide critical new insights into the dynamics of normal and abnormal developmental processes. In this paper, we aim to provide a review of previous applications of MRI in mouse developmental biology, and to identify the main challenges for future progress in this important research area.
MRI OF MOUSE EMBRYOS
The use of MR micro-imaging (micro-MRI) in mouse developmental biology dates back to the pioneering studies of Smith, Johnson and co-workers at Duke University in the mid-1990s (1,2). The general approach developed in those first studies, preparing fixed embryo samples and acquiring ex vivo micro-MRI data with close-fitting coils which achieve a high filling factor, continues to be used in a number of centers. The main advantage of micro-MRI, using high-field systems (7-11.7 T), has been the ability to perform non-destructive, volumetric analysis of embryonic specimens with spatial resolution of 20-50 μm, and maintaining the option to perform histological studies after MRI. Analysis of the embryonic cardiac and vascular systems has been a particular focus of these ex vivo imaging studies, using both contrast-enhanced micro-MRI after perfusion of gadolinium-loaded gelatin via the umbilical blood vessels (3,4) and micro-MRI of fixed embryos without contrast agent enhancement (5-8) (Fig. 1). Acquisition of high-resolution data for micro-MRI of embryos requires very long imaging times (6-24 h), which is suitable for fixed specimens but is not compatible with in vivo imaging. Recently, multiple-embryo imaging has been used, acquiring data from up to 32 embryos simultaneously to dramatically increase the effective throughput of MRI-based phenotype analysis (9) (Fig. 2).
Figure 1.

Cardiovascular laterality defects in Cited2 mutant embryos at embryonic day 15.5 (MRI of cardiac anatomy). Coronal sections and 3D reconstructions (ventral views) are shown of wild-type (Cited2+/+) and mutant (Cited2-/-) embryonic hearts. (a, b) Wild-type heart where the right ventricle (RV) is dextral to the left and gives rise to the main pulmonary artery (PA). The left ventricle (LV) gives rise to the aorta (Ao). Also indicated is the trachea (Tr) and interventricular septum (IVS). (c, d) Cited2 mutant heart with sinistral looping: the right ventricle is sinistral (and anterior) to the left ventricle. Scale bars, 500 μm. Axes: R, right; L, left; A, anterior; P, posterior. RA, Right atrium; LA, left atrium. Reprinted, with permission, from ref. (7).
Figure 2.

High-throughput high-resolution MR microscopy. (a) Stack of 32 embryos embedded in a NMR tube. (b) Section through the long axis of the NMR tube showing embryos in eight layers. (c) Sagittal section through layer 8 showing the four embryos in this layer. (d-f) Transverse, sagittal, and coronal sections through individual embryos in layers 5, 1 and 4 respectively. The voxel size is 25.4 × 25.4 × 24.4 μm. Structures indicated are the spinal cord (sc), the right and left lungs, atria and ventricles (rl, ll, ra, la, rv, lv), primary atrial and interventricular septa (pas, ivs), mitral valve (mv), midbrain roof (mbr), midbrain (mb), mesencephalic vesicle (mes), thalamus (tha), hypothalamus (hy), pons (po), cerebellum (c), medulla oblongata (mo), pituitary (pit), tongue (t), thymus (th), left superior vena cava and main bronchus (lsvc, lmb), aorta (ao), liver (li), stomach (s), left adrenal and kidney (lad, lk), pancreas (pa), intestines (i), umbilical hernia (uh), aqueduct of Sylvius (aq), fourth ventricle (fv), inner ear (ie), larynx (lar), right ventricular outflow tract (rvot), spleen (sp), and testes (te). Scale bars = 500 μm; axes: d, dorsal; v, ventral; r, right; l, left; a, anterior; p, posterior. Reprinted, with permission, from ref. (9).
In vivo MRI of mouse embryos inside the maternal uterus has been performed, using fast imaging methods, to identify and longitudinally monitor some intra-embryonic structures, but resolution in these studies was limited to the level of the whole organ (10,11). One recent study imaged very early stage embryos, using MRI to identify implantation sites and to analyze early vascular changes during implantation (12). Although gross brain structures have been identified (brain tissue versus fluid-containing ventricles), neural development has not been emphasized to date, in part because of a lack of significant contrast within developing brain tissues.
Important studies of frog embryo development have used single-cell micro-injection and micro-MRI to achieve in vivo imaging of gene expression (13) and cell tracking after magnetic labeling with gadolinium (14). These approaches have not yet been translated into in vivo studies of mouse embryos, because of the difficulty of micro-injecting early mouse embryonic cells, together with the challenges of high-resolution in utero MRI in the pregnant mouse. Interestingly, in the area of cellular imaging, ex vivo MRI of fixed mouse embryos was used recently to detect micron-sized iron oxide particles, internalized in cells of mouse blastocyst-stage embryos, more than a week later in 11.5-day mouse embryos (15) (Fig. 3). Promising results in the area of molecular imaging have recently been reported, achieving MRI contrast by cellular iron internalization after expression of ferritin (16-18), but it remains to be seen whether this approach will provide a robust method for in vivo imaging of gene expression in developing mouse embryos. For the full potential of MRI to be realized in the area of mouse embryo imaging, from anatomical to molecular imaging applications, truly non-invasive in utero imaging is required to provide volumetric and longitudinal analyses of living embryos.
Figure 3.

MRI and histology of micron-sized iron oxide (Bangs) particles in an embryonic day (E)11.5 mouse embryo. (1) Slice from 3D MRI dataset. (2) Expansions of the boxed region in (1), showing susceptibility-induced contrast regions in each image. (3) Matching histological section that corresponds to the same plane as the accompanying MRI. (4) A second image of the section in (3), acquired with a higher magnification, approximately representing the boxed region. The iron stain from the individual particle is circled to assist visualization in the histology. Shown are single 1.63 μm particles registered to the areas of dark contrast in the MRI. Each embryo image is 6.75 mm from head to tail, in both the MRI and the histology. Insets are ×10 magnification. Reprinted, with permission, from ref. (15).
It is difficult to provide absolute values of the resolution and contrast required for effective in vivo imaging of mouse embryos, especially given the paucity of data in this area. On the basis of the anatomical details that have been revealed in fixed embryos, it is likely that spatial resolution of at least 50 μm (isotropic) or better will be required for effective analysis of organogenesis in early-stage mouse embryos (9.5-12.5 days), whereas 80-100 μm (isotropic) may be sufficient for analyzing the developing brain and heart of mid-stage to late-stage mouse embryos (13.5-18.5 days). If one sets an upper limit of 2 h on the acquisition time to maintain reasonable physiology during MRI, then it should be feasible to image later-stage embryos with currently available MR hardware and image sequences, using respiratory and/or cardiac gating to reduce motion artifacts during abdominal imaging. On the other hand, in vivo imaging of early-stage embryos will probably require advances in hardware for small-animal imaging, such as multielement phased-array coils, combined with optimized fast image sequences.
MRI OF MOUSE NEONATES
Imaging of neonatal mice provides a convenient and important entry point for MRI studies of development, requiring less challenging methods than those needed for embryo imaging. Many important developmental events, including maturation and functional development of most organ systems, occur in early postnatal stages in mice. For example, a number of mouse models of neonatal heart failure are available in which MRI can provide functional parameters. So far, MRI has been used for studies of cardiac function at very early (postnatal day 3) neonatal stages (19), but in vivo MRI has not yet been used for analysis of neonatal mutant phenotypes. Importantly, it has been established that anesthesia with freely inhaled isoflurane can be applied safely in mouse neonates (19), similar to most current in vivo MRI studies of adult mice.
In the brain, MRI has been used to assess gross disease, including hemorrhages in the cerebral ventricles (20) and hypoxic ischemia in the neonatal mouse brain (21). For finer detail, the pre-myelinated neonatal mouse brain presents a challenge for conventional MRI using relaxation-based (T1, T2) contrast, which is generally dominated by regional myelin concentration (Fig. 4). Solutions to this problem include contrast-enhanced MRI and alternative contrast approaches such as diffusion tensor imaging (DTI), described in the next section. Manganese-enhanced MRI (MEMRI) has been found to be useful for analyzing the neonatal mouse brain in vivo, enhancing several prominent brain regions, including olfactory bulb, hippocampus and cerebellum, after systemic administration of MnCl2 and providing high-resolution data (100 μm isotropic) with scanning times acceptable for in vivo imaging (≤2 h) (22). The enhanced visualization of the developing cerebellum with MEMRI has been used to analyze cerebellar patterning defects in neonatal mutant mice (22) (Fig. 5). Importantly, MEMRI also has the potential to reveal normal and abnormal neural activity, as demonstrated in recent in vivo functional neuro-imaging studies of pre-weaning stage mice (23).
Figure 4.
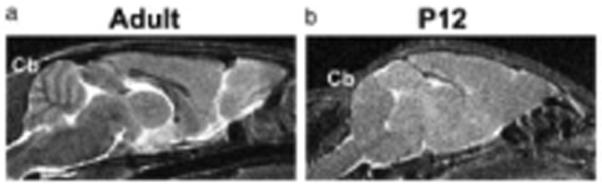
Short time inversion recovery (STIR) images, providing additive T1 and T2 contrast, can be used to visualize adult, but not neonatal, cerebellar folia. Mid-sagittal STIR images of adult (a) and postnatal day (P)12 (b) mouse brains. The foliation pattern in the cerebellum (Cb) can be visualized in the adult (500 μm slice thickness) through the presence of myelin (dark), but not in the neonatal mouse (300 μm slice thickness). Reprinted, with permission, ref. (22).
Figure 5.

Use of MEMRI for phenotyping neonatal cerebellar defects. Sagittal (a, d) and horizontal (b, e) T1-weighted images, and surface-rendered volumetric images (c, f) of a wild-type P11 mouse cerebellum (a-c), compared with a Gbx2 mutant littermate (d-f) showing the extensive deletion of most of the central cerebellum in the Gbx2 mutant. Reprinted, with permission, from ref. (22).
ALTERNATIVE CONTRAST APPROACH: DTI
DTI provides image contrast based on the anisotropic diffusion of water molecules within a sample. DTI is based on the ability of MRI to measure the extent of water diffusion, the random motion of water, along an arbitrary axis (24) (Fig. 6). From this measurement, it is often found that the water tends to diffuse along a preferential axis, a phenomenon known as diffusion anisotropy, which coincides with the orientation of ordered structures such as axonal tracts in the brain. On the basis of diffusion orientation of water molecules, this technique can provide several types of imaging contrast such as anisotropy maps, orientation maps, or a combination of the two, called color-coded orientation maps or simply color maps. In the color map, the brightness shows the extent of the anisotropy, and the color represents fiber orientation.
Figure 6.

Principles of DTI. (a) A schematic diagram representing brain structures, where the upper region has an ordered structure resulting from fibers running along the curved arrow, whereas the lower region has a random fiber structure. (b) Diffusion measurements along three different axes are indicated by the directions of the fingers. The apparent diffusion constant becomes faster if the fiber orientation coincides with the measurement orientation, and slower when they are perpendicular to each other. This results in different diffusion constants that depend on the measurement orientation in the upper region, whereas the lower region is insensitive to the measurement orientation. (c) Results of DTI. Anisotropy (diffusion directionality) of the upper region is high because the diffusion constant of this region depends on measurement orientation. When anisotropy is high, the fiber angle can be calculated from the information in (b), which can be represented by vectors or by color. In this two-dimensional example, regions with fibers running horizontally are green and those running vertically are red. Transition areas become yellow, representing a mixture of green and red. (d) Actual DTI-based images of a mouse embryo. The raw data are 3D, and arbitrary slice angles and positions can be extracted. The anisotropy and orientation maps have the same image intensity, but the orientation maps have extra orientation information represented by colors. In the color map, fibers orienting along right-left, dorsal-ventral, caudal-rostral axes are indicated by green, blue, and red, respectively. Reprinted, with permission, from ref. (26).
DTI has been successfully applied to the analysis of both embryonic and neonatal brain development (25-27). As discussed above, in the developing mouse brain before myelination, conventional relaxation-based MRI provides limited information compared with DTI (Fig. 7). In the developing mouse brain, DTI enables identification and analysis of important features such as the early embryonic neuro-epithelium, the ventricular layer where neurons first originate, and the more external cortical plate, a precursor to the adult cortex (Fig. 8). Moreover, DTI is sensitive to subtle changes in cellular architecture including the alignment of radial glia, which provide the scaffold for migrating neurons perpendicular to the brain surface, and the tangential arrangement of developing axons, for example in the presumptive corpus callosum. DTI also provides a powerful approach for assessing mouse mutant brain phenotypes (28-30), enabling whole-brain volumetric analysis, which is difficult or impossible with current histological methods. Using DTI, it is possible to identify subsets of commissural tracts that are selectively missing, as well as subtle differences in tracts or layers that are abnormal in size, thickness or position.
Figure 7.

DTI of developing mouse brains. (a) T2 and DTI color map images of embryonic mouse brains, from embryonic day (E) 12 to 18. (b) T2 and DTI maps of postnatal mouse brains, from postnatal day (P) 0 to 45. 3D images were carefully aligned to ensure proper orientation and position, and two-dimensional coronal images were selected at the level of the anterior commissure. T2 map images were scaled from 0 to 120 ms. Colored arrows indicate the location of the cortical plate (blue), the intermediate zone (orange) and the ventricular zone or neuroepithelium (pink) in embryonic brain (a). White matter tracts shown here include the anterior commissure (red arrows), the corpus callosum (orange arrows), the fornix (yellow arrows), and the internal capsule (white arrows) in postnatal brains (b). Scale bars are 2 mm. Reprinted, with permission, from ref. (28).
Figure 8.

Cortical and white matter development. Horizontal planes of the color maps from embryonic day (E)12 to 18 brains. Blue and pink arrowheads indicate locations of the neuroepithelium (ne) and cortical plate (cp). Yellow pins indicate the leading edge of the growing intermediate zone (iz) or axonal tracts in between the ne and cp. The inset diagram explains the cellular events during E12-E18 based on radial migration theory. Blue circles indicate neurons in the ne from newborn mice, white bars represent migration scaffolds by the radial glia, pink circles are neurons in the cp, and yellow arrows are the growing axons. At E12, there is only one layer (ne), which has radial structures around the ventricle. At E13, the cp emerges and simultaneously afferent and efferent axons (iz) arrive between the ne and cp layers, resulting in a transient three-layer structure. Between E14 and E18, the cp progresses to completion, with concomitant loss of the ne layer and ventricle shrinkage, while the axons follow the leading edge of the cp. A portion of the E16 brain (white box) is enlarged to show the fiber orientation in a vectorial format. Images in each panel are scaled independently. See ref. (26) for details on the spatial resolution of each image. Reprinted, with permission, from ref. (26).
To date, DTI studies in both the embryonic and neonatal mouse brain have been performed ex vivo in fixed samples. The usefulness of DTI as a complementary method to histology has been emphasized, rather than as a method for in vivo, longitudinal monitoring of developmental defects. In vivo DTI in embryos is not possible currently because of the problems of physiological motion in the pregnant mouse and the limited SNR achievable with imaging times feasible for in vivo imaging (≤2 h). Even with high-field magnets, DTI of small samples, such as mouse embryos, with 2 h of scanning time generates very noisy images. On the other hand, in vivo DTI of adult mice is feasible, and the number of publications in this area is steadily increasing. With the advent of improved hardware for microimaging, it is likely that in vivo neonatal mouse DTI will become possible in the near future.
OTHER IMAGING METHODS
It is interesting to compare MRI with alternative imaging methods currently available for analyzing mouse embryonic and neonatal development. A number of in vivo optical methods are currently being developed (31), providing submicron resolution but with limited penetration compared with MRI (≤500 μm), even with multi-photon microscopy, which provides the greatest penetration. Mouse embryos are particularly difficult to image with in vivo optical microscopy, because of their inaccessibility inside the maternal uterus. Nevertheless, considerable effort has been devoted to the creation of transgenic and knock-in mouse embryos, with genetic reporters, primarily green and related fluorescent proteins, to define and image cell populations and gene expression patterns (32). To take advantage of these genetically engineered mice, optical microscopy requires removal of the embryos from the uterus, for example using confocal microscopy to image mouse embryos maintained in culture (33,34) or multi-photon microscopy after exteriorizing the embryos (35). Although these approaches provide important information at the cellular level, optical imaging has limitations in terms of penetration depth and restriction to early stages amenable to embryo culture. Furthermore, mouse embryos can only be maintained in culture or exo utero for short periods of time (<24 h), which limits optical studies to relatively narrow developmental windows. The potential advantage of micro-MRI over optical imaging is the much greater tissue penetration, albeit with more limited spatial resolution.
In addition to in vivo imaging, two ex vivo optical methods have been developed for analysis of fixed mouse embryo specimens. Optical projection tomography (OPT) is a method for 3D imaging of fixed and stained embryos, enabling whole-mount analysis of gene expression patterns in the context of embryonic anatomy (36). Another optical method is episcopic fluorescence image capture (EFIC), a simple approach for acquiring a stack of images from sequential sections through a fixed, embedded mouse embryo (37). EFIC is a destructive method in which the face of the block containing an embryo is imaged after each section is cut, enabling distortion-free, high-resolution 3D imaging and analysis of gene expression patterns from fluorescence. For fixed mouse embryos, OPT and EFIC provide several advantages over ex vivo micro-MRI, especially at earlier stages when light penetration is less problematic, offering much higher spatial resolution and the ability to utilize many readily available fluorescent transgenic mouse strains and immunofluorescent tissue stains.
Ultrasound imaging provides an established in vivo approach for imaging mouse development. Unlike micro-MRI, ultrasound biomicroscopy (UBM) is a truly realtime micro-imaging method which has been successfully used for non-invasive in utero imaging of live mouse embryos for over a decade (38). UBM uses high-frequency (40-50 MHz) ultrasound in a pulse-echo imaging method, acquiring images at a rate limited only by the mechanical or electronic scan rate of the transducer. Scan rates up to 100 images per second are now possible using commercially available scanners, with spatial resolution of 30 μm axial and 70 μm lateral, and penetration depths close to 10 mm at 40 MHz (39). The real-time, non-invasive imaging capability of UBM, together with hemodynamic assessment using Doppler ultrasound, has led to a wide range of applications in cardiovascular development (40). UBM has also been developed as an image-guidance method for direct in utero manipulation of mouse embryos (39,41,42). In comparison with micro-MRI, UBM currently offers a clear advantage in image acquisition time, but offers fewer options for modifying image contrast through alternative acquisition methods such as DTI, and fewer available agents for contrast-enhanced imaging.
In MRI and the other imaging methods described above, data analysis is often the limiting step in the study. 3D image sets represent very large amounts of data, which are only useful in a high-throughput sense if effective, automated data analysis tools are developed. Therefore, continued development of advanced volumetric analysis and visualization software is critical to the success of imaging applications. MRI is inherently 3D, so image registration and normalization routines are generally more robust when applied to MR data than to other imaging methods. With sufficient SNR, MR images are also very well suited to automated or semi-automated segmentation and 3D visualization, enabling effective volumetric analysis of embryonic and neonatal anatomical details.
SUMMARY
In summary, micro-MRI has already found a number of applications for anatomical and functional analysis in developing mouse embryos and neonates. To date, most applications have utilized ex vivo imaging, focusing on the ability of micro-MRI to provide distortion-free, 3D anatomical data. Given the recent availability of ex vivo optical imaging methods such as OPT and EFIC, which provide 3D anatomical data with much higher resolution than MRI, the future of MRI probably lies in the unique information on tissue structure that it can provide, for example when imaging cardiovascular structures deep within later-stage embryos and for imaging developing brain structures with DTI. Ultimately, the full capability of MRI lies in its potential for in vivo imaging of both mouse embryos inside the maternal uterus and postnatal mice from the earliest neonatal to adult stages. The ability to image the mouse over this wide range of developmental stages will enable longitudinal studies of anatomical and functional changes in individual animals. UBM already provides an established method for in utero imaging of live mouse embryos, with image acquisition times that will continue to be orders of magnitude shorter than MRI for the foreseeable future. MRI provides several potential advantages over UBM in terms of deeper penetration, more flexibility in manipulating tissue contrast, and more available contrast agents. Most likely, the best approach for in vivo analysis of mouse development will combine a variety of complementary imaging methods, similar to the multi-modality imaging systems used in modern radiology clinics. In this context, MRI can serve as a valuable tool for high-throughput screening, especially using multiple-mouse imaging to pre-select animals of interest for further analysis with MRI and other imaging methods (9,43). The main challenges for the future are to develop robust methods for in utero micro-MRI of mouse embryos, and to develop cell-specific contrast-enhancement approaches to allow a wide variety of functional studies, including in vivo cell tracking and imaging of gene expression in developing mice.
Acknowledgements
We thank all the past and current members of the Mori and Turnbull laboratories for contributing to the work described in this review. We also thank Drs Jürgen Schneider and Shoumo Bhattacharya (University of Oxford) and Dr Alan Koretsky (National Institute of Neurological Disorders and Stroke) for permission to reprint figures from their published work.
Abbreviations used
- DTI
diffusion tensor imaging
- EFIC
episcopic fluorescence image capture
- MEMRI
manganese-enhanced MRI
- OPT
optical projection tomography
- SNR
signal-to-noise ratio
- UBM
ultrasound biomicroscopy
REFERENCES
- 1.Smith BR, Johnson GA, Groman EV, Linney E. Magnetic resonance microscopy of mouse embryos. Proc Natl Acad Sci USA. 1994;91:3530–3533. doi: 10.1073/pnas.91.9.3530. [DOI] [PMC free article] [PubMed] [Google Scholar]
- 2.Smith BR, Linney E, Huff DS, Johnson GA. Magnetic resonance microscopy of embryos. Comput Med Imaging Graph. 1996;20:483–490. doi: 10.1016/s0895-6111(96)00046-8. [DOI] [PubMed] [Google Scholar]
- 3.Smith BR. Magnetic resonance microscopy in cardiac development [Review] Microsc Res Tech. 2001;52:323–330. doi: 10.1002/1097-0029(20010201)52:3<323::AID-JEMT1016>3.0.CO;2-F. [DOI] [PubMed] [Google Scholar]
- 4.Huang GY, Wessels A, Smith BR, Linask KK, Ewart JL, Lo CW. Alteration in connexin 43 gap junction gene dosage impairs conotruncal heart development. Dev Biol. 1998;198:32–44. doi: 10.1006/dbio.1998.8891. [DOI] [PubMed] [Google Scholar]
- 5.Dhenain M, Ruffins SW, Jacobs RE. Three-dimensional digital mouse atlas using high-resolution MRI. Dev Biol. 2001;232:458–470. doi: 10.1006/dbio.2001.0189. [DOI] [PubMed] [Google Scholar]
- 6.Schneider JE, Bamforth SD, Farthing CR, Clarke K, Neubauer S, Bhattacharya S. Rapid identification and 3D reconstruction of complex cardiac malformations in transgenic mouse embryos using fast gradient echo sequence magnetic resonance imaging. J Mol Cell Cardiol. 2003;35:217–222. doi: 10.1016/s0022-2828(02)00291-2. [DOI] [PubMed] [Google Scholar]
- 7.Bamforth SD, Braganca J, Farthing CR, Schneider JE, Broadbent C, Michell AC, Clarke K, Neubauer S, Norris D, Brown NA, Anderson RH, Bhattacharya S. Cited2 controls left-right patterning and heart development through a Nodal-Pitx2c pathway. Nat Genet. 2004;36:1189–1196. doi: 10.1038/ng1446. [DOI] [PubMed] [Google Scholar]
- 8.Schneider JE, Bhattacharya S. Making the mouse embryo transparent: identifying developmental malformations using magnetic resonance imaging [Review] Birth Defects Res C Embryo Today. 2004;72:241–249. doi: 10.1002/bdrc.20017. [DOI] [PubMed] [Google Scholar]
- 9.Schneider JE, Bose J, Bamforth SD, Gruber AD, Broadbent C, Clarke K, Neubauer S, Lengeling A, Bhattacharya S. Identification of cardiac malformations in mice lacking Ptdsr using a novel high-throughput magnetic resonance imaging technique. BMC Dev Biol. 2004;4:16. doi: 10.1186/1471-213X-4-16. [DOI] [PMC free article] [PubMed] [Google Scholar]
- 10.Hogers B, Gross D, Lehmann V, Zick K, De Groot HJ, Gittenberger-De Groot AC, Poelmann RE. Magnetic resonance microscopy of mouse embryos in utero. Anat Rec. 2000;260:373–377. doi: 10.1002/1097-0185(20001201)260:4<373::AID-AR60>3.0.CO;2-Q. [DOI] [PubMed] [Google Scholar]
- 11.Chapon C, Franconi F, Roux J, Marescaux L, Le Jeune JJ, Lemaire L. In utero time-course assessment of mouse embryo development using high resolution magnetic resonance imaging. Anat Embryol. 2002;206:131–137. doi: 10.1007/s00429-002-0281-6. [DOI] [PubMed] [Google Scholar]
- 12.Plaks V, Kalchenko V, Dekel N, Neeman M. MRI analysis of angiogenesis during mouse embryo implantation. Magn Reson Med. 2006;55:1013–1022. doi: 10.1002/mrm.20881. [DOI] [PubMed] [Google Scholar]
- 13.Louie AY, Huber MM, Ahrens ET, Rothbacher U, Moats R, Jacobs RE, Fraser SE, Meade TJ. In vivo visualization of gene expression using magnetic resonance imaging. Nat Biotechnol. 2000;18:321–325. doi: 10.1038/73780. [DOI] [PubMed] [Google Scholar]
- 14.Jacobs RE, Fraser SE. Magnetic resonance microscopy of embryonic cell lineages and movements. Science. 1994;263:681–684. doi: 10.1126/science.7508143. [DOI] [PubMed] [Google Scholar]
- 15.Shapiro EM, Skrtic S, Sharer K, Hill JM, Dunbar CE, Koretsky AP. MRI detection of single particles for cellular imaging. Proc Natl Acad Sci USA. 2004;101:10901–10906. doi: 10.1073/pnas.0403918101. [DOI] [PMC free article] [PubMed] [Google Scholar]
- 16.Genove G, DeMarco U, Xu H, Goins WF, Ahrens ET. A new transgene reporter for in vivo magnetic resonance imaging. Nat Med. 2005;11:450–454. doi: 10.1038/nm1208. [DOI] [PubMed] [Google Scholar]
- 17.Cohen B, Dafni H, Meir G, Harmelin A, Neeman M. Ferritin as an endogenous MRI reporter for noninvasive imaging of gene expression in C6 glioma tumors. Neoplasia. 2005;7:109–117. doi: 10.1593/neo.04436. [DOI] [PMC free article] [PubMed] [Google Scholar]
- 18.Deans AE, Wadghiri YZ, Bernas LM, Yu X, Rutt BK, Turnbull DH. Cellular MRI contrast via coexpression of transferrin receptor and ferritin. Magn Reson Med. 2006;56:51–59. doi: 10.1002/mrm.20914. [DOI] [PMC free article] [PubMed] [Google Scholar]
- 19.Wiesmann F, Ruff J, Hiller KH, Rommel E, Haase A, Neubauer S. Developmental changes of cardiac function and mass assessed with MRI in neonatal, juvenile, and adult mice. Am J Physiol Heart Circ Physiol. 2000;278:H652–H657. doi: 10.1152/ajpheart.2000.278.2.H652. [DOI] [PubMed] [Google Scholar]
- 20.Xue M, Balasubramaniam J, Buist RJ, Peeling J, Del Bigio MR. Periventricular/intraventricular hemorrhage in neonatal mouse cerebrum. J Neuropathol Exp Neurol. 2003;62:1154–1165. doi: 10.1093/jnen/62.11.1154. [DOI] [PubMed] [Google Scholar]
- 21.Aden U, Dahlberg V, Fredholm BB, Lai LJ, Chen Z, Bjelke B. MRI evaluation and functional assessment of brain injury after hypoxic ischemia in neonatal mice. Stroke. 2002;33:1405–1410. doi: 10.1161/01.str.0000014608.78503.db. [DOI] [PubMed] [Google Scholar]
- 22.Wadghiri YZ, Blind JA, Duan X, Moreno C, Yu X, Joyner AL, Turnbull DH. Manganese-enhanced magnetic resonance imaging (MEMRI) of mouse brain development. NMR Biomed. 2004;17:613–619. doi: 10.1002/nbm.932. [DOI] [PubMed] [Google Scholar]
- 23.Yu X, Wadghiri YZ, Sanes DH, Turnbull DH. In vivo auditory brain mapping in mice with Mn-enhanced MRI. Nat Neurosci. 2005;8:961–968. doi: 10.1038/nn1477. [DOI] [PMC free article] [PubMed] [Google Scholar]
- 24.Mori S, Zhang J. Principles of diffusion tensor imaging and its applications to basic neuroscience research [Review] Neuron. 2006;51:527–539. doi: 10.1016/j.neuron.2006.08.012. [DOI] [PubMed] [Google Scholar]
- 25.Mori S, Itoh R, Zhang J, Kaufmann WE, van Zijl PC, Solaiyappan M, Yarowsky P. Diffusion tensor imaging of the developing mouse brain. Magn Reson Med. 2001;46:18–23. doi: 10.1002/mrm.1155. [DOI] [PubMed] [Google Scholar]
- 26.Zhang J, Richards LJ, Yarowsky P, Huang H, van Zijl PC, Mori S. Three-dimensional anatomical characterization of the developing mouse brain by diffusion tensor microimaging. Neuroimage. 2003;20:1639–1648. doi: 10.1016/s1053-8119(03)00410-5. [DOI] [PubMed] [Google Scholar]
- 27.Zhang J, Miller MI, Plachez C, Richards LJ, Yarowsky P, van Zijl P, Mori S. Mapping postnatal mouse brain development with diffusion tensor microimaging. Neuroimage. 2005;26:1042–1051. doi: 10.1016/j.neuroimage.2005.03.009. [DOI] [PubMed] [Google Scholar]
- 28.Zhang J, Chen YB, Hardwick JM, Miller MI, Plachez C, Richards LJ, Yarowsky P, van Zijl P, Mori S. Magnetic resonance diffusion tensor microimaging reveals a role for Bcl-x in brain development and homeostasis. J Neurosci. 2005;25:1881–1888. doi: 10.1523/JNEUROSCI.4129-04.2005. [DOI] [PMC free article] [PubMed] [Google Scholar]
- 29.Andrews W, Liapi A, Plachez C, Camurri L, Zhang J, Mori S, Murakami F, Parnavelas JG, Sundaresan V, Richards LJ. Robo1 regulates the development of major axon tracts and interneuron migration in the forebrain. Development. 2006;133:2243–2252. doi: 10.1242/dev.02379. [DOI] [PubMed] [Google Scholar]
- 30.Wang Y, Zhang J, Mori S, Nathans J. Axonal growth and guidance defects in Frizzled3 knock-out mice: a comparison of diffusion tensor magnetic resonance imaging, neurofilament staining, and genetically directed cell labeling. J Neurosci. 2006;26:355–364. doi: 10.1523/JNEUROSCI.3221-05.2006. [DOI] [PMC free article] [PubMed] [Google Scholar]
- 31.Dickinson ME. Multimodal imaging of mouse development: tools for the postgenomic era [Review] Dev Dyn. 2006;235:2386–2400. doi: 10.1002/dvdy.20889. [DOI] [PubMed] [Google Scholar]
- 32.Hadjantonakis AK, Dickinson ME, Fraser SE, Papaioannou VE. Technicolour transgenics: imaging tools for functional genomics in the mouse [Review] Nat Rev Genet. 2003;4:613–625. doi: 10.1038/nrg1126. [DOI] [PubMed] [Google Scholar]
- 33.Jones EA, Baron MH, Fraser SE, Dickinson ME. Measuring hemodynamic changes during mammalian development. Am J Physiol Heartf Circ Physiol. 2004;287:H1561–H1569. doi: 10.1152/ajpheart.00081.2004. [DOI] [PubMed] [Google Scholar]
- 34.Rhee JM, Pirity MK, Lackan CS, Long JZ, Kondoh G, Takeda J, Hadjantonakis AK. In vivo imaging and differential localization of lipid-modified GFP-variant fusions in embryonic stem cells and mice. Genesis. 2006;44:202–218. doi: 10.1002/dvg.20203. [DOI] [PMC free article] [PubMed] [Google Scholar]
- 35.Ang ES, Jr, Haydar TF, Gluncic V, Rakic P. Four-dimensional migratory coordinates of GABAergic interneurons in the developing mouse cortex. J Neurosci. 2003;23:5805–5815. doi: 10.1523/JNEUROSCI.23-13-05805.2003. [DOI] [PMC free article] [PubMed] [Google Scholar]
- 36.Sharpe J, Ahlgren U, Perry P, Hill B, Ross A, Hecksher-Sorensen J, Baldock R, Davidson D. Optical projection tomography as a tool for 3D microscopy and gene expression studies. Science. 2002;296:541–545. doi: 10.1126/science.1068206. [DOI] [PubMed] [Google Scholar]
- 37.Weninger WJ, Mohun T. Phenotyping transgenic embryos: a rapid 3-D screening method based on episcopic fluorescence image capturing. Nat Genet. 2002;30:59–65. doi: 10.1038/ng785. [DOI] [PubMed] [Google Scholar]
- 38.Turnbull DH, Bloomfield TS, Baldwin HS, Foster FS, Joyner AL. Ultrasound backscatter microscope analysis of early mouse embryonic brain development. Proc Natl Acad Sci USA. 1995;92:2239–2243. doi: 10.1073/pnas.92.6.2239. [DOI] [PMC free article] [PubMed] [Google Scholar]
- 39.Turnbull DH, Foster FS. Ultrasound biomicroscopy in developmental biology [Review] Trends Biotechnol. 2002;20:S29–S33. [Google Scholar]
- 40.Phoon CK, Turnbull DH. Ultrasound biomicroscopy-Doppler in mouse cardiovascular development [Review] Physiol Genomics. 2003;14:3–15. doi: 10.1152/physiolgenomics.00008.2003. [DOI] [PubMed] [Google Scholar]
- 41.Olsson M, Campbell K, Turnbull DH. Specification of mouse telencephalic and mid-hindbrain progenitors following heterotopic ultrasound-guided embryonic transplantation. Neuron. 1997;19:761–772. doi: 10.1016/s0896-6273(00)80959-9. [DOI] [PubMed] [Google Scholar]
- 42.Liu A, Joyner AL, Turnbull DH. Alteration of limb and brain patterning in early mouse embryos by ultrasound-guided injection of Shh-expressing cells. Mech Dev. 1998;75:107–115. doi: 10.1016/s0925-4773(98)00090-2. [DOI] [PubMed] [Google Scholar]
- 43.Bock NA, Nieman BJ, Bishop JB, Henkelman RM. In vivo multiple-mouse MRI at 7 Tesla. Magn Reson Med. 2005;54:1311–1316. doi: 10.1002/mrm.20683. [DOI] [PubMed] [Google Scholar]