

Abstract
NG2+ cells in the adult CNS are a heterogeneous population. The extent to which the subpopulation of NG2+ cells that function as oligodendrocyte progenitor cells (OPCs) respond to spinal cord injury (SCI) and recapitulate their normal developmental progression remains unclear. We used the CNP-EGFP mouse, in which oligodendrocyte lineage cells express EGFP, to study NG2+ cells in the normal and injured spinal cord. In white matter of uninjured mice, bipolar EGFP+NG2+ cells and multipolar EGFPnegNG2+ cells were identified. After SCI, EGFP+NG2+ cell proliferation in residual white matter peaked at 3 days post injury (DPI) rostral to the epicenter, while EGFPnegNG2+ cell proliferation peaked at 7 DPI at the epicenter. The expression of transcription factors Olig2, Sox10 and Sox17, and the basic electrophysiological membrane parameters and potassium current phenotype of the EGFP+NG2+ population after injury were consistent with those of proliferative OPCs during development. EGFPnegNG2+ cells did not express transcription factors involved in oligodendrogenesis. EGFP+CC1+ oligodendrocytes at 6 weeks included cells that incorporated BrdU during the peak of EGFP+NG2+ cell proliferation. EGFPnegCC1+ oligodendrocytes were never observed. Treatment with glial growth factor 2 and fibroblast growth factor 2 enhanced oligodendrogenesis and increased the number of EGFPnegNG2+ cells. Therefore, based on EGFP and transcription factor expression, spatio-temporal proliferation patterns, and response to growth factors, two populations of NG2+ cells can be identified that react to SCI. The EGFP+NG2+ cells undergo cellular and physiological changes in response to SCI that are similar to those that occur in early postnatal NG2+ cells during developmental oligodendrogenesis.
Keywords: Oligodendrocyte Progenitor Cells, Olig2, CNP gene, endogenous repair, cell proliferation, glial growth factor, fibroblast growth factor
INTRODUCTION
The chondroitin sulfate proteoglycan NG2 is a marker for oligodendrocyte progenitor cells (OPCs) during development (Stallcup, 1981; Levine et al., 1993; Levine and Nishiyama, 1996; Nishiyama et al., 1996; Reynolds and Hardy, 1997; Diers-Fenger et al., 2001; Liu et al., 2002; Mallon et al., 2002). Following spinal cord injury (SCI) in adult rodents, NG2+ cells respond by increased proliferation (McTigue et al., 2001; Zai and Wrathall, 2005; Lytle and Wrathall, 2007) and may serve as an endogenous source of glial replacement chronically (Zai and Wrathall, 2005; Horky et al., 2006; Lytle and Wrathall, 2007; Rabchevsky et al., 2007; Tripathi and McTigue, 2007).
However, the NG2+ cell population in the adult central nervous system is heterogeneous (Butt et al., 2002; Horner et al., 2002; Nishiyama et al., 2002; Stallcup, 2002; Chittajallu et al., 2004). In addition to NG2+ OPCs, and potentially other types of NG2+ progenitor cells, NG2+ synantocytes have been described. Although this finding has made it difficult to define the adult OPC response to injury, this may be important in devising therapeutic approaches to mitigate abnormal myelination (Gledhill et al., 1973; Blakemore, 1974; Blight, 1983b, 1985; Wrathall et al., 1998) and resultant abnormalities of conduction (Blight, 1983a; Dimitrijevic et al., 1984; Bunge, 1994; Dimitrijevic et al., 1997) of spared white matter chronically after SCI.
There is indirect evidence suggesting that more than one type of NG2+ cells responds to SCI. In a recent study of cells dissociated from the rat spinal cord at 3 days after a standardized contusion SCI, we found that not all NG2+ cells could be accounted for by oligodendrocyte lineage markers A2B5, O4 and O1 (Lytle et al., 2006). In vitro clonal analysis showed that NG2+ cells from the injured spinal cord produce oligodendrocytes, and to a lesser extent astrocytes, or mature into morphologically complex NG2 cells (Yoo and Wrathall, 2007). Furthermore, in examining tissue from C57Bl6 mice subjected to a murine version of the same SCI (Kuhn and Wrathall, 1998), we found two populations of NG2+ cells, a nestin+ (neural progenitor marker) and nestinneg population of NG2-expressing cells (Lytle and Wrathall, 2007). Taken together, these results suggest that more than one type of NG2+ cells may proliferate in response to SCI. Importantly, previous studies have been unable to distinguish between the response of OPCs and non-OPC NG2+ cells in the spinal cord after traumatic injury, and to what extent the adult NG2+ cell response might recapitulate developmental events in this progenitor population.
We examined the NG2 cell response in a transgenic mouse expressing enhanced green fluorescent protein (EGFP) driven by the 2–3-cyclic nucleotide 3-phosphodiesterase (CNP) promoter (Yuan et al., 2002). In these mice, all cells in the oligodendrocyte lineage express EGFP (Yuan et al., 2002), allowing us to study the response of NG2+ OPCs to SCI and that of other non-OPC lineage NG2+ cells. We analyzed spinal cords of both normal CNP-EGFP mice and of mice after standardized contusive SCI, using BrdU-labeling of proliferating cells, together with immunohistochemistry for cellular antigens and transcription factors, and patch clamp electrophysiology of cells in spinal cord slices. Our data demonstrate that two different populations of NG2+ cells - EGFP+ and EGFPneg, respectively - proliferate in response to SCI. We show not only that EGFP+NG2+ cells generate oligodendrocytes after SCI, but also that these progenitors undergo cellular and physiological changes in response to SCI that are similar to those that occur in early postnatal NG2+ cells during developmental oligodendrogenesis.
METHODS
Spinal Cord Injury
Surgery was performed on 5–7 week old CNP-EGFP mice. Mice were anesthetized with 0.4–0.6mg/g of Avertin (2,2,2-tribromoethanol, Sigma), and a laminectomy was performed at thoracic level 8/9. The spinal column was stabilized via the lateral processes at T7 and T10. Contusion was produced by dropping a 2g weight from a height of 2.5cm (mild injury) onto a teflon impounder 1.5mm in diameter, as previously described (Kuhn and Wrathall, 1998). The muscle was sutured and the skin closed with wound clips. Animals were injected subcutaneously with 2ml saline at the hip area and recovery was allowed on a heating pad until the animals awoke. Bladder expression was performed manually until a reflex bladder was established, usually 3–6 days post-injury. All procedures were approved by the Children’s National Medical Center Animal Care and Use Committee.
Behavioral Assessment
Mice were tested for hindlimb functional deficits at 24h after SCI, and again at 3 and 7 days post-injury, with further behavioral testing at 1 week intervals for chronic animals. For acute studies, 8 animals were used for each terminal timepoint and control groups. For chronic studies, 6 animals were used, as well as 5 controls. Hindlimb locomotor recovery was assessed using the Basso Mouse Scale (BMS) for locomotion, an open-field locomotor score (Engesser-Cesar et al., 2005; Basso et al., 2006). The BMS scale ranges from 0 to 9, with 0 indicating complete paralysis of the hindlimbs.
Bromodeoxyuridine Incorporation Experimental Design
Study I: Acute Proliferation
Mice (N = 8 per group) were injected i.p. with BrdU (17mg/kg) at 2, 4, and 6 hours prior to perfusion 1, 3, 4 and 7 days post-injury. Uninjured controls (N = 5) were also injected under the same conditions.
Study II: Chronic Replacement
Mice (N = 6) were injected with BrdU (17mg/kg) 2 times at 2 hour intervals on days 2, 3 and 4 post-injury. Mice were sacrificed at 42 days post-injury.
Histology
At 1, 3, 7 and 42 days post injury, mice were anesthetized with Avertin and perfused with 50 ml each of 0.9% saline and 4% buffered paraformaldehyde (PFA). Spinal cords were post-fixed for 1 hour in PFA, and cryoprotected in a sucrose gradient. Cords were quickly embedded and frozen in OCT (Fisher, Fairlawn, NJ) in blocks of 4, with each block containing injured and control tissue, and stored at −20°C. Ten μm coronal sections were cut from a 1cm length of spinal cord centered on the injury epicenter. Representative slides were stained with eriochrome cyanine (ECRC), hemotoxylin, and eosin and phyloxine to assess tissue morphology and determine the location of the injury epicenter, as previously described (Grossman et al., 2001).
Immunohistochemistry
Immunohistochemistry was performed on cross sections of tissue at specified distances rostral and caudal to the injury epicenter, at the specified terminal timepoints. Primary antibodies against Cd11b (1:50, Calbiochem, San Diego, CA), nestin (1:500, DSHB), BrdU (1:50, BD Biosciences), Nkx2.2 (1:200, Developmental Studies Hybridoma Bank), Mash1 (1:100, BD Biosciences), and APC/CC1 (1:1000, Calbiochem) were monoclonals raised in Mouse. Anti-AN2 (1:50), a monoclonal raised in mouse, was a kind gift from Dr. Jacqueline Trotter at the University of Mainz. Antibodies against Olig1 (1:500) and Olig2 (1:500) were a kind gift from the Dana Farber Cancer Institute. Antibodies to NG2 (1:200) and glial fibrillary acid protein (1:100, GFAP, Chemicon, Temecula CA), neurofilament (1:600) (Sigma, St. Louis MO), Sox10 (1:200, Abcam) and Ki67 (1:50, Novo Castra) were polyclonals raised in rabbit. The anti-PDGFR-α antibody (1:50, Santa Cruz, Caramillo, CA) and the anti-human Sox17 (1:100, R&D Systems, Minneapolis, MN) were raised in goat. Fluorescent immunohistochemistry was performed using Cy5-conjugated or Rhodamine-conjugated secondary antibodies against goat, mouse and rabbit (MP Biomedicals, Solon, OH, and Jackson ImmunoResearch Laboratories, Inc., West Grove, PA). All tissue blocks contained both injured and uninjured tissue. No-primary controls were performed alongside all immunostaining procedures. All procedures were optimized for cell-specific staining and to reduce background and non-specific staining.
BrdU labeling
Slides were treated with 10% formalin, for 10 minutes and washed with phosphate buffered saline. DNA was denatured using 2M HCl for 45 minutes at room temperature. Tissue was then neutralized using 0.1M borate buffer pH 8.5 for 10 minutes, and blocked for 1 hour in 20% serum. Tissue was incubated with primary antibody against BrdU (BD Biosciences mouse monoclonal, 1:50) at 4°C for 24 hours. Tissue was washed, and incubated with secondary antibody (TRITC-α-mouse) for 1 hour at room temperature. Slides were washed and mounted with Vectashield (Vector) containing DAPI (4′,6-diamidino-2-phenylindole, Vector) for visualization of nuclei. For double labeling, antigen labeling was performed first, as described above, followed by BrdU labeling.
Cell Counts: Sampling and Statistics
Cells were counted within a reticule of specified area (200μm2) positioned in the ventral-lateral portion of spared white matter, between the tips of the ventral horns (at distal rostral and caudal locations) or the border of the spared white matter and the lesion (at the epicenter), and at the perimeter of the tissue, as previously described (Lytle and Wrathall, 2007). This area was counted because it is free of overt lesion at all distances examined. Labeling was assessed every 0.5 mm distal to the epicenter, up to 2mm. At all locations, three randomly selected sections separated by 10 μm were examined from each slide. For each distance (e.g. epicenter), 3 sections were counted per animal, on both left and right sides, for a total of 6 fields of view per distance, per animal, and 5 animals in each group. On average there are about 50 DAPI+ nuclei per field of view, with minor differences depending on time after injury and distance from epicenter. Thus the data point for each animal at each location and time represents the average from the analysis of approximately 300 cells. The N number used for statistical analysis was the number of mice per group. Significance was determined using Repeated Measures 2-Way ANOVA or One-Way ANOVA with Tukey’s post-hoc analysis. Significance was set at p < 0.05.
Electrophysiology
Mice (5–7 weeks of age) were anaesthetized with 4% isoflurane, decapitated, and spinal cords quickly removed. The dura was removed. Longitudinal 200μm thick slices were cut. Following a 1 hour recovery period, slices were transferred to a recording chamber and perfused with extracellular solution of the following composition (in mM): NaCl 124, KCl 3, CaCl2 2.5, MgSO4 1.3, NaHCO3 26; NaHPO4 1.25; glucose 15; tetrodotoxin 1mM; saturated with 95% O2/5% CO2 at room temperature. CNP-EGFP+ cells were identified in the ventral lateral white matter of the spinal cord. One cell was analyzed per slice. Patch electrodes had resistances between 6 and 8 MΩ when filled with intracellular solution of the following composition (in mM): K-gluconate 130; NaCl 10; Mg-ATP 2; Na-GTP 0.3, HEPES 10; EGTA 0.6, 0.3% biocytin, adjusted to pH 7.2 and 275 mOsm. Prior to whole-cell recording of currents, series resistances values ranged between 4 to 12 MΩ and were compensated by at least 75%. Delayed rectifying (KDR) and transient (KA) potassium currents were isolated as previously described (Chittajallu et al., 2004; Chittajallu et al., 2005). Biocytin/NG2 and biocytin/O4 staining was performed as previously described (Chittajallu et al., 2005).
Glial Growth Factor 2 (GGF2) and Fibroblast Growth Factor 2 (FGF2) Treatment
Standardized contusive injury was performed, as described above. Mice (N = 3) were injected with 0.8mg/kg recombinant human GGF2 (Acorda Pharmaceutical, Hawthorne NY) and 0.02mg/kg FGF2 (Peprotech, Rocky Hill NJ) in 500μl of sterile 0.9% saline once daily, subcutaneously, for 8 days following injury, beginning 1 day post injury. Control mice (N = 3) were injected with 500μl of saline once daily, subcutaneously. Mice were perfused and spinal cords post-fixed and sectioned, as described above, 9 days post-injury.
RESULTS
Histopathology and functional deficit after SCI in the CNP-EGFP mouse
In the CNP-EGFP mouse, EGFP is expressed by oligodendrocyte lineage cells, neural progenitor cells that express the CNP gene and Schwann cells (Yuan et al., 2002; Aguirre et al., 2004; Chittajallu et al., 2005). In the normal spinal cord, EGFP+ cells were easily visualized in both grey and white matter. As previously reported, in rats and wild-type mice, spinal cord contusion in the CNP-EGFP mouse (Supplemental Figure 1) produced a dorso-central lesion at the T8/T9 vertebral level, surrounded by residual white matter (Kuhn and Wrathall, 1998; Seki et al., 2002; Ghasemlou et al., 2005; Basso et al., 2006; Lytle and Wrathall, 2007). Within the overt lesion, normal spinal cord tissue including EGFP-expressing cells, was lost. In addition, the total amount of myelinated white matter in cross-sections through the epicenter was significantly reduced after SCI.
There also appeared to be a loss of glial cells in the residual white matter surrounding and adjacent to the overt lesion. To examine cell loss quantitatively we compared overall DAPI+ cells, oligodendrocytes (EGFP+CC1+) and astrocytes (EGFPnegGFAP+) in the spared ventral-lateral white matter (Supplemental Figure 1), and found a similar pattern as previously reported in C57Bl/6 wild-type mice (Lytle and Wrathall, 2007). The density of mature EGFP+CC1+ oligodendrocytes and EGFPnegGFAP+ astrocytes was significantly reduced by 1 day post injury (DPI) at the injury epicenter, with decreasing loss distally. Loss of mature glia within the first week predominantly occurred by 1 DPI, when 47 ± 4% of EGFP+CC1+ cells were lost in spared ventrolateral white matter at the injury epicenter: little additional loss occurred though day 7. At 1 and 2 mm rostral and caudal the epicenter, loss of EGFP+CC1+ cells in residual white matter was significant at 3 and 7 DPI (p<0.05). These results are similar to those previously reported for astrocyte and oligodendrcyte loss after SCI in C57Bl6 wild-type mice (Lytle and Wrathall, 2007).
To verify that SCI in the CNP-EGFP mouse also produced expected functional deficits, we assessed locomotor activity using the BMS scale for murine hindlimb function that rates open-field performance from 0 (complete loss of hindlimb function) to 9 (normal) (Engesser-Cesar et al., 2005; Basso et al., 2006). Animals were severely impaired at 1 DPI (BMS score 1.6 ± 0.1), exhibiting only slight to extensive ankle movement and no hind limb weight support. Significant improvements in hindlimb function occurred at days 3 and 7 DPI, before leveling off. At 35 and 42 DPI, hindlimb function was significantly increased over 7 days. By 42 days, mice had a BMS score of 6.8 ± 0.5, indicating frequent/consistent plantar stepping, some coordination, paws parallel at initial contact, and severe trunk instability. This pattern is consistent with what we have previously reported for wild-type C57Bl/6 mice (Lytle and Wrathall, 2007), and was not statistically different from CNP-EGFPneg littermates.
Proliferative response of EGFP+NG2+ cells following spinal cord injury
In addition to loss of mature glial cells in the residual white matter, we found evidence for the proliferative response of different cell types that may contribute to glial replacement after SCI. To address the issue of whether proliferative NG2+ cells migrated to their positions or proliferated locally, a short timeframe of BrdU incorporation was employed, and BrdU specificity was confirmed with Ki67 double-labeling and nuclear colocalization (Figure 1A). Greater than 99% of BrdU+ cells were Ki67+. The extremely small percentage of BrdU+Ki67neg cells likely represent BrdU uptake by cells undergoing DNA repair. EGFP+NG2+ cells were analyzed for proliferation patterns in response to injury, and showed a peak of BrdU incorporation in the rostral spinal cord at 3 DPI (Figure 1B).
Figure 1. Evidence for proliferation of EGFP+NG2+ cells after spinal cord injury.
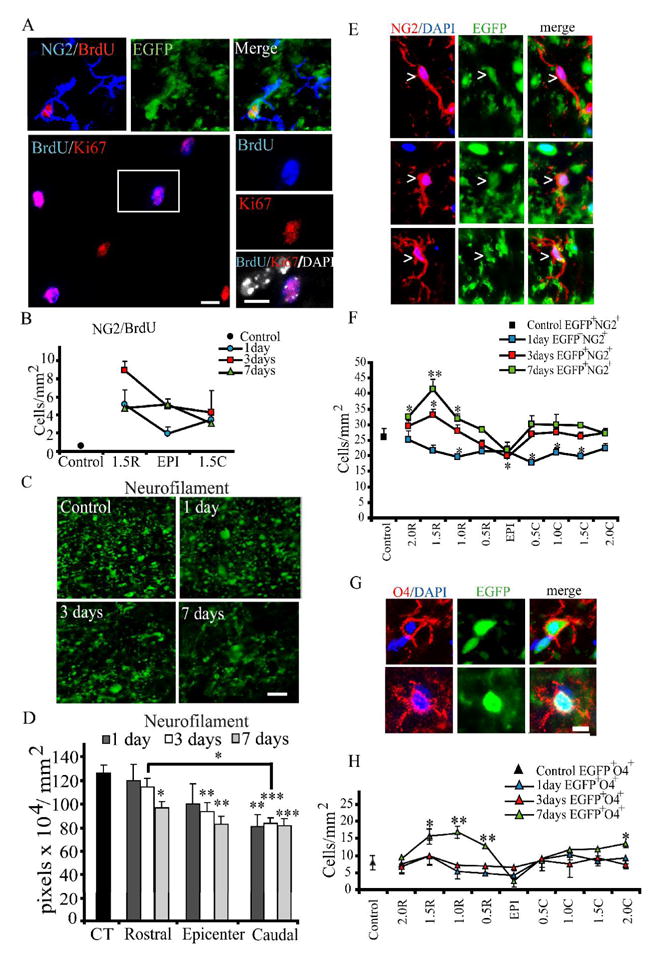
A. BrdU incorporation (red) in EGFP+ (green) NG2+ (blue) cells. BrdU incorporation (blue, bottom panels) always occurs in Ki67-expressing (red) cells and is always nuclear, as indicated by labeling with DAPI (white). Tissue shown is from the rostral spinal cord, 3DPI. Scale bar = 10μm.
B. Quantitative analysis of EGFP+NG2+BrdU+ cells (bottom panel) in control animals and at 1, 3 and 7 DPI at 1.5mm rostral, injury epicenter, and 1.5mm caudal. Cell counts were performed in the ventral-lateral white matter. Immunoreactive cells were quantified from 5 animals at the injury epicenter, and at 1.5mm rostral and caudal in the spared ventral-lateral white matter. For each distance at each timepoint, three 10 μm-thick sections were counted, left and right hemispheres, for a total of six fields per animal. Therefore, thirty 200 μm2 fields of view were quantified for each. One-Way ANOVA with Tukey’s post-hoc analysis for variance. * p < 0.05; ** p < 0.01; *** p < 0.001 vs. control.
C–D. The proliferative response of EGFP+NG2+ cells is correlated to neurofilament (NF) immunoreactivity (IR). Representative NF staining in the spared ventral lateral white matter at the injury epicenter in control and 1, 3 and 7 days post-injury and quantification of NF immunoreactivity (pixels/mm2) at 1.5mm rostral and caudal and at the injury epicenter. There is degradation of NF structure by 1 DPI, with significant loss at 3 and 7 days. IR was quantified for 5 animals at the injury epicenter and at 1.5mm rostral and caudal in the spared ventral-lateral white matter. For each distance at each timepoint, three 10 μm-thick sections were counted, left and right hemispheres, for a total of six fields per animal. Therefore, thirty 200 μm2 fields of view were quantified for each. There is significant loss in the caudal cord at all timepoints examined. Loss at the epicenter is significant at 3 and 7 days, and in the rostral cord at 7 days. * p<0.05, ** p<0.01, *** p<0.001 vs. control. There is a significant difference between the rostral and caudal cords at 3 days (p<0.05). Bars represent mean ± SEM. Two-way ANOVA with Bonferroni’s post-hoc analysis. Scale bar = 5μm.
E. EGFP-expressing (green) NG2 (red) cells (arrowheads) are typically bipolar (top panels, uninjured tissue shown) or have very few branches (middle panels, injured tissue shown 3 DPI). Occasionally, cells have more complex branching (bottom panels, uninjured tissue shown). DAPI (blue) labels cell nuclei. Scale bar = 10μm.
F. Cell counts in control and injured animals for EGFP+NG2+ cells every 0.5 mm from the injury epicenter, up to 2 mm rostral and caudal. There is a significant increase in EGFP+NG2+ cells in the rostral spinal cord at 3 and 7 dpi. One-Way ANOVA with Tukey’s post-hoc analysis for variance. * p < 0.05; ** p < 0.01 vs. control.
G. Preoligodendrocytes labeled with O4 (top panels) express EGFP. Scale bar = 10μm.
H. There is a significant increase in EGFP+O4+ cells in the rostral spinal cord at 7 dpi. One-Way ANOVA with Tukey’s post-hoc analysis for variance. * p < 0.05; ** p < 0.01 vs. control.
During development, NG2+ cells do not generate oligodendrocytes in vivo in the absence of appropriate axon-derived signals, and axon loss prevents oligodendrocyte development (Greenwood and Butt, 2003). We therefore investigated axon preservation after SCI, comparing the relative amount of neurofilamant immunoreactivity in sections at different locations with respect to the injury epicenter (Figure 1C–D). These data indicate that while there are likely to be many contributing factors to NG2 cell proliferation and differentiation after SCI, the relatively greater axon preservation rostral to the injury site may contribute to relative higher EGFP+NG2+ cell proliferation. There was a significant increase in total EGFP+NG2+ cells (Figure 1E–F) in the rostral cord beginning 3 DPI followed by an increase in EGFP+O4+ pre-oligodendrocytes in the rostral spinal cord by 7 DPI (Figure 1G–H), suggesting differentiation of EGFP+NG2+ OPCs.
EGFP+NG2+ cells in the adult spinal cord display electrophysiological characteristics of early postnatal OPCs in the developing CNS
One distinct advantage offered by the CNP-EGFP mouse is the visual identification of oligodendrocyte lineage cells for patch clamp analysis. Passive membrane properties and voltage-gated potassium channel profiles have been well characterized in NG2+ cells and later stage O4+ cells during development (Chittajallu et al., 2004; Chittajallu et al., 2005). In order to determine whether adult EGFP+NG2+ cells physiologically resemble early postnatal OPCs in the developing animal, we performed in situ patch clamp analysis. To initially identify EGFP+NG2+ cells, 200μm-thick longitudinal sections of the normal and injured spinal cords at 3 DPI were immunostained for NG2. As NG2+ cells express PDGFαR in the developing CNS, EGFP+NG2+ cells were also immunolabeled with anti-PDGFαR antibodies for identification (Figure2A, top). Out of approximately 200 EGFP+NG2+ cells analyzed (N = 3 mice), 95 +/− 2% were PDGFaR+ in uninjured controls, and 93 +/− 6% at 7 DPI. PDGFαR labeling, however, was weak and observed only on cell bodies. EGFP+NG2+PDGFαR+ cells expressed low levels of EGFP and had cell bodies 5–10μm in diameter that were generally elongated. Recorded cells were filled with biocytin for post-hoc immunocytochemical analysis to confirm their phenotype (Figure2A, bottom).
Figure 2. Electrophysiological analysis of EGFP+NG2+ cells after spinal cord injury indicates an OPC-like phenotype.
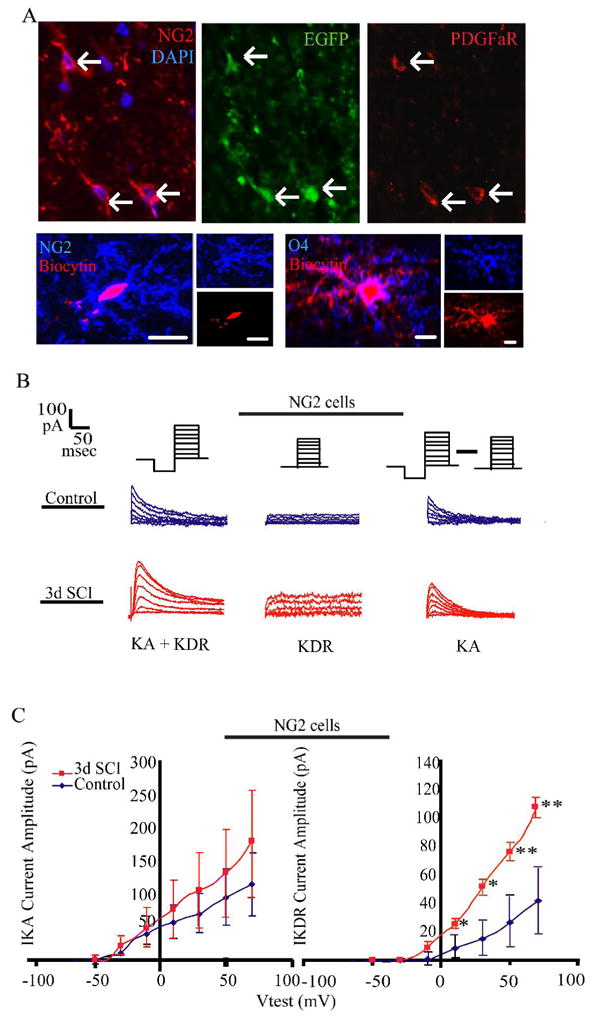
A. Immunostaining for NG2 and PDGFα R identifies EGFP+ OPC-like cells. Expression of PDGFαR was observed on NG2 cells, but was weak and limited to the cell body. After electrophysiological analysis, cells were filled with biocytin (red) for post-hoc immunocytochemical analysis to distinguish between EGFP+NG2+ (blue, top panels) and EGFP+O4+ (blue, bottom panels) stage cells, and to confirm identification of EGFP+NG2+ cells.
B. Proliferative electrophysiological phenotype of EGFP+NG2+ cells in the rostral spinal cord of uninjured and injured animals at 3 DPI. Representative traces from EGFP+NG2+ cells depicting total outward current (KA + KDR, top panel), isolated KDR (middle panel) and isolated KA (bottom panels) for control (left panels) and 3-day injured (right panels) cells.
C. Current-voltage curves constructed from a series of depolarizing voltage steps from −70mV to 70 mV; 10mV increments. Holding potential was −60mV. For isolation of KA, KDR amplitude was digitally subtracted from the total outward current. For KDR, this followed a pre-pulse to −40mV to inactivate KA. All values are after junction potential correction. N = 32 cells for control, and 32 cells for injured. Prior to recording, series resistance compensation to at least 75% was performed. Symbols represent mean ± SEM.
We first established the distinct passive membrane properties associated with EGFP+NG2+ cells or later stage EGFP+O4+ cells (Table 1). All cells were analyzed for resting membrane potential (RMP), membrane resistance (Rm,) and capacitance. Consistent with previous reports during development in the CNS (Yuan et al., 2002; Chittajallu et al., 2005), EGFP+O4+ cells in the uninjured animal had a more hyperpolarized RMP (−52 ± 5 mV) than EGFP+NG2+ cells (−33 ± 3 mV), and lower Rm (183 ± 59 MΩ) than NG2+ cells (306 ± 77 MΩ). EGFP+O4+ cells also displayed higher capacitance (75 ± 16 pF) than EGFP+NG2+ cells (8 ± 1 pF in control), indicative of the increase in cell size associated with acquisition of a more mature phenotype.
Table 1.
Passive membrane properties of NG2 and O4 cells
| RMP (mV) | Rm (MOhm) | Cm (pF) | ||
|---|---|---|---|---|
| Mean ± SEM; Range | Mean ± SEM; Range | Mean ± SEM Range | ||
| NG2 | Control | −33.2 ± 3.2; −15 to −40 | 306.2 ± 77; 200 to 1200 | 8 ± 0.9; 4 to 20 |
| 3d SCI | −30.2 ± 3.9; −13 to −40 | 1267.9 ± 450.7; 150 to 5000 | 6.9 ± 0.9; 4 to 15 | |
|
| ||||
| O4 | Control | −52.2 ± 5.3; −32 to −77 | 183.6 ± 59.4; 35 to 150 | 75.7 ± 16.2; 12 to 150 |
| 3d SCI | −45.6 ± 3.7; −30 to −73 | 122.2 ± 22.5; 47 to 300 | 81.7 ± 25.7; 13 to 265 | |
Passive membrane properties of NG2 and O4 cells were determined. Resting membrane potential (RMP), membrane resistance (Rm) and capacitance (Cm) reveal distinct properties associated with NG2 or O4 cells in both control and injured preparations. Confirmation of cell types was performed with biocytin filling in combination with post-hoc immunocytochemical analysis. Eighty-eight cells were analyzed: N = 32 NG2 cells (control), N = 32 NG2 cells (injured), N= 8 O4 cells (control), N = 16 O4 cells (injured).
Following SCI (3 DPI), EGFP+NG2+ cells exhibited no change in RMP (−33 ± 3 mV) or capacitance (6.9 ± 0.9 pF). The Rm was significantly increased (1267 ± 450 MΩ), which may be indicative of a more immature stage of progenitor cell development. Also EGFP+O4+ cells exhibited no change in RMP (−45 ± 4 mV), Rm (122.2 ± 22.5 MΩ), or capacitance (81.7 ± 25.7 pF) following SCI.
As voltage-gated potassium channels are involved in proliferation, differentiation and maturation of NG2+ oligodendrocyte progenitors during development (Borges et al., 1994; Gallo et al., 1996; Knutson et al., 1997; Chittajallu et al., 2002; Neusch et al., 2003; Vautier et al., 2004; Chittajallu et al., 2005), analysis of potassium currents (KA, KDR, and KIR) was performed in both EGFP+NG2+ and EGFP+O4+ cells. In control spinal cords, both EGFP+NG2+ and EGFP+O4+ cells expressed KA and KDR (Figure 2B). No EGFP+NG2+ cells expressed KIR. However, consistent with previous developmental analysis (Borges et al., 1994; Gallo et al., 1996; Knutson et al., 1997; Chittajallu et al., 2002; Neusch et al., 2003), KIR was expressed by EGFP+O4+ cells (data not shown).
As increased KDR expression is correlated with a proliferative phenotype during development, we also analyzed EGFP+NG2+ cells from 3-day injured spinal cords rostrally, i.e. when and where EGFP+NG2+ proliferation peaks (Figure 1B). There was an increase in the KDR in EGFP+NG2+ cells after injury at all test pulses greater than 10mV (Figure 2B), consistent with the observed increase in proliferation. There was also an increase in the percentage of EGFP+NG2+ cells expressing KDR (Table 2). While KA current density did not significantly increase at 3 DPI, the percentage of EGFP+NG2+cells expressing KA did (Table 2). Single Boltzmann curve fits for KA and KDR were constructed (data not shown), and half-activation values (V1/2) for EGFP+NG2+ cells were calculated (data not shown). These were significantly different for both KA (−2.3 mV in control animals vs. 11.1 mV in injured) and KDR (4.4 mV in control animals vs. 17.1 mV in injured), and showed a right shift in the voltage response curve after injury, which may be indicative of different potassium channel subunit compositions (Figure 2C). Conversely, cells at the EGFP+O4+ stage displayed no differences in KA, KDR, or KIR current amplitude between the uninjured and injured populations (data not shown).
Table 2.
Percentage of Cells Expressing Voltage-Gated Potassium Currents
| KA | KDR | KIR | KA | KDR | KIR | ||||
|---|---|---|---|---|---|---|---|---|---|
| NG2 | Control | 25% (8/32) | 75% (24/32) | 0% (0/32) | O4 | Control | 100% (8/8) | 100% (8/8) | 75% (6/8) |
|
|
|||||||||
| 3d SCI | 59% (19/32) | 100% (32/32) | 0% (0/32) | 83% (12/14) | 100% (14/14) | 100% (14/14) | |||
Not all cells displayed all voltage-gated potassium currents. There was an increase in the percentage of NG2 cells expressing KA and KDR after injury. No NG2 cells expressed KIR. There was a decrease in the percentage of O4 cells expressing KA after injury, and an increase in KIR. Eighty-eight cells were analyzed: N = 32 NG2 cells (control), N = 32 NG2 cells (injured), N= 8 O4 cells (control), N = 16 O4 cells (injured).
Expression of cell-specific markers in EGFP+NG2+ cells
As NG2+ cells are known to give rise to astrocytes in culture (Raff et al., 1983; Belachew et al., 2003), and Cd11b+ cells express NG2 transiently after injury (Bu et al., 2001), EGFP+NG2+ cells were examined for co-expression of the astrocyte marker GFAP and the macrophage/microglial marker Cd11b. All cells were negative for GFAP and Cd11b (data not shown). Additionally, no NeuN+ cells were EGFP+ (data not shown).
As nestin is upregulated in OPCs that are actively in the cell cycle during development (Gallo and Armstrong, 1995), EGFP+ NG2+ cells were also examined for nestin expression (Supplemental Figure 2A–B). In control animals, only 7% of EGFP+NG2+ cells expressed nestin (2 ± 0.4 cells/mm2). This percentage increased at all locations and time points after injury. Consistent with the observed rostral increase in proliferation of EGFP+NG2+ cells, total nestin+EGFP+NG2+ cells were greatest in the rostral cord at 3 DPI, where approximately 30% of EGFP+NG2+ were nestin+ (6 ± 0.7 cells/mm2, Supplemental Figure 2B).
S100β is a known astrocyte precursor cell marker (Langley et al., 1984) and is also expressed in oligodendrocyte lineage cells (Deloulme et al., 2004; Hachem et al., 2005). Approximately 65% of EGFP+NG2+ cells in the uninjured animal expressed S100β (16 ± 3 cells/mm2, Supplemental Figure 2C–D). However, this was significantly decreased at 1 DPI (Supplemental Figure 2D). At 3 DPI, numbers remained low caudally, but returned to normal levels rostrally and at the epicenter (Supplemental Figure 2D). By 7 DPI, rostral and caudal levels were normal, with a significant increase at the epicenter to 137% of control (44 ± 5 cells/mm2).
The transcription factor expression pattern is altered in EGFP+NG2+ cells after spinal cord injury
The transcription factors Olig1, Olig2, Nkx2.2, Sox10, Sox17 and Mash1 play essential roles in oligodendrocyte progenitor cell specification and differentiation in the developing embryonic spinal cord and brain (Woodruff et al., 2001;Ligon et al., 2006a; Sohn et al., 2006; Sugimori et al., 2007). Immunopositive cells were quantified to investigate possible roles that these transcription factors play in the injured adult spinal cord. In normal tissue, Olig1, Olig2 and Nkx2.2 expression was observed in both grey and white matter, and was not limited to EGFP-expressing cells (data not shown). Sox10, Sox17 and Mash1 were also expressed in grey and white matter, although in only less than 1% of cells (data not shown).
In control animals, 58% of EGFP+NG2+ cells were Olig2+, averaging 50 ± 5 cells/mm2. At 1 DPI, 80–98% of EGFP+NG2+ cells were Olig2+, with highest coexpression (98%, or 45 ± 2 cells/mm2) in the rostral spinal cord. Furthermore, there was an overall increase in the total number of Olig2+NG2+ cells by 1 DPI in the rostral cord (Supplemental Figure 3A–B). At 3 and 7 DPI, Olig2 expression in EGFP+ NG2+ cells was still greatest in the rostral spinal cord. While the percentage of EGFP+NG2+ cells that express Olig2 decreased with time, the density of EGFP+NG2+ cells that express Olig2 remained at or above control levels (Supplemental Figure 3B), suggesting consistent replacement of this population. By 6 weeks, the density of Olig2-expressing EGFP+NG2+ cells was generally decreased (Supplemental Figure 3C). These data support the observation that Olig2 plays an important role in the acute injury phase and may induce programs of gene activity acutely after injury similar to those necessary for oligodendrocyte formation during development.
After injury, there was considerable loss of overall Nkx2.2 and Olig1 expression in the spared white matter (data not shown). While Nkx2.2 was expressed in uninjured mice at a density of approximately 35 ± 4 EGFP+ cells/mm2, only 6 ± 0.9% of EGFP+Nkx2.2+ cells were NG2+, indicating that most Nkx2.2 expression occurred in more mature oligodendrocyte lineage cells. After injury, Nkx2.2 expression in EGFP+NG2+ increased from a density of 2 cells/mm2 in control animal white matter to an average of 5 ± 0.4 cells/mm2 (approximately 15% of total EGFP+NG2+ cells, depending on location vis-à-vis the injury epicenter and time after injury) at rostral and caudal locations in the spared white matter at all acute time points. However, Nkx2.2 expression in EGFP+NG2+ cells decreased to control levels at 6 weeks, indicating a role for Nkx2.2 in the acute injury phase. Olig1 was similarly expressed in a small population of EGFP+NG2+ cells in control animals. There was an overall decrease from control levels (approximately 7 ± 1 cells/mm2) in EGFP+NG2+Olig1+ cells after injury, both acutely (approximately 4 ± 0.6 cells/mm2) and chronically (approximately 2 ± 1 cells/mm2).
Sox10 and Sox17, transcription factors that promote differentiation of oligodendrocytes (Sohn et al., 2006; Liu et al., 2007), were expressed in 21% (5 ± 0.13 cells/mm2, Supplemental Figure 3D–E) and 20% (5.2 ± 0.08 cells/mm2, Supplemental Figure 3D, F) of EGFP+NG2+ cells in uninjured controls, respectively. By 3 DPI, there was a significant decrease in EGFP+NG2+Sox10+ cells at all locations. By 7 DPI, EGFP+NG2+Sox10+ cells returned to near-normal levels at the injury epicenter and rostrally, with a significant increase in EGFP+NG2+Sox10+ cells caudally. EGFP+NG2+Sox17+ cells significantly decreased rostrally and at the injury epicenter by 3 DPI. While expression was still down at the epicenter at 7 DPI, rostral expression returned to control levels, and a significant increase in caudal expression was observed.
Finally, Mash1, which promotes differentiation of oligodendrocytes and neurons in the embryonic spinal cord (Sugimori et al., 2007), was rarely observed in uninjured or injured spinal cord tissue, with fewer than 1 immunopositive cell per field of view (data not shown). This is consistent with previous reports (Yamamoto et al., 2001; Ohori et al., 2006).
These results show that, during the first week after injury, expression of the transcription factor Olig2, which is necessary for oligodendrocyte specification during development, was upregulated while transcription factors necessary for lineage progression to a differentiated stage (Nkx2.2, Sox10, Sox17) and (re)myelination (Olig1) were generally downregulated during the first week.
A subpopulation of NG2+ cells of the spinal cord does not express EGFP before or after injury
If all NG2+ cells were strictly oligodendrocyte lineage cells, then we would expect expression of EGFP in all NG2+ cells, as CNP mRNA is expressed earlier than NG2 in the developing rodent spinal cord (Yu et al., 1994; Nishiyama et al., 1996). In other regions of the postnatal and adult brain of the CNP-EGFP mouse, all NG2+ cells are also EGFP+ (Yuan et al., 2002; Aguirre and Gallo, 2004; Aguirre et al., 2004; Chittajallu et al., 2004). Immunohistochemical analysis revealed that in adult spinal cord, while CC1+ oligodendrocytes and O4+ pre-oligodendrocytes expressed EGFP at greater than 99% frequency, NG2 was expressed in both EGFP+ (Figure 1E) and EGFPneg cells (Figure 3A). Furthermore, EGFP+NG2+ and EGFPnegNG2+ cells were morphologically distinct. EGFP+NG2+ cells were generally bipolar in appearance (Figure 1E), typical of OPCs, whereas EGFPnegNG2+ cells ranged from multipolar cells with secondary branching to a simple, bipolar morphology, with the former being the predominant phenotype (Figure 3A). We then immunolabeled EGFPnegNG2+ cells with anti-GFP to ensure that EGFP was not being expressed at levels undetectable by fluorescence microscopy. EGFPnegNG2+ cells were not stained with anti-GFP antibodies (Figure 3B). Lastly, we labeled EGFPnegNG2+ cells for PDGFαR and observed weak expression on nearly all EGFPnegNG2+ cell bodies (Figure 3C). In approximately 200 EGFPnegNG2+ cells (N = 3 mice), 91 +/− 4% were PDGFαR+ in uninjured controls, and 93 +/− 3% rostrally at 7 DPI. These data are consistent with studies published by Berry et al. (2002), suggesting that morphologically complex NG2+ cells express PDGFαR, and can be distinguished from OPCs by a lack of CD9 antigenicity.
Figure 3. EGFPnegNG2+ cells also proliferate after spinal cord injury and do not resemble OPCs.
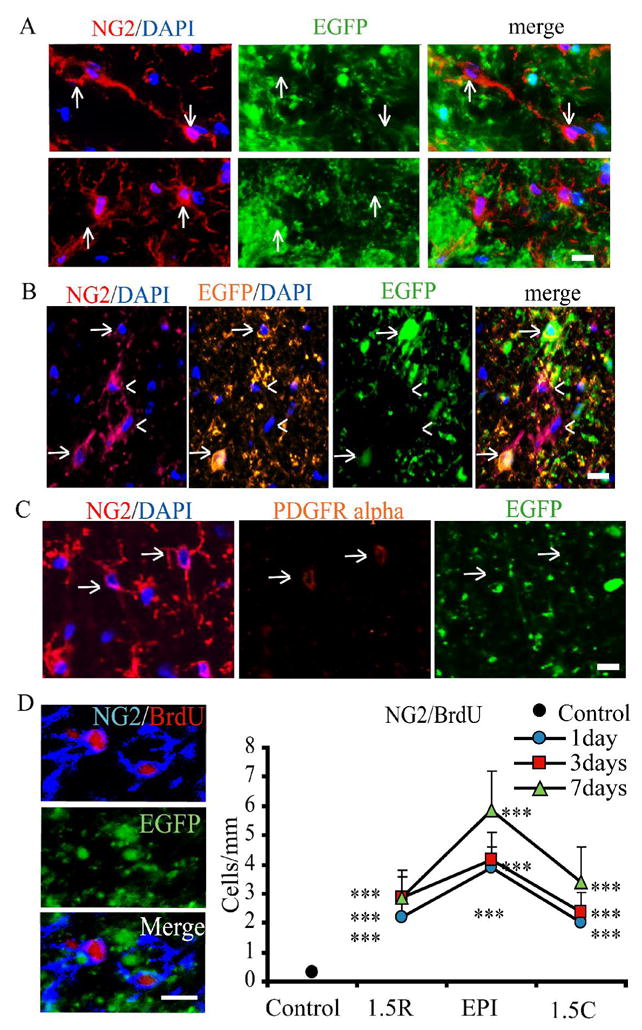
A. Non-EGFP-expressing NG2 (red) cells (arrows) range in morphology from simple, bipolar (top panels, injured tissue shown 3 DPI) to branched, multipolar (bottom panels, uninjured tissue shown). DAPI (blue) labels cell nuclei. Scale bar = 10μm.
B. Non-EGFP-expressing NG2+ cells (arrow heads) are negative for anti-EGFP (orange). EGFP+NG2+ cells can also be seen (arrows) and are immuno-positive for GFP. Scalebar = 10μm.
C. Non-EGFP-expressing NG2+ cells express PDGFRα. However, expression is weak and was limited to the cell body.
D. BrdU (red) is incorporated into EGFPnegNG2+ cells (blue) in the first week after injury. Scale bar = 10um. Quantitative analysis of EGFPnegNG2+BrdU+ cell counts in control animals and after injury. Cell counts were performed in the ventral-lateral white matter. Immunoreactive cells were quantified for 5 animals every at the injury epicenter and at 1.5mm rostral and caudal in the spared ventral-lateral white matter. For each distance at each timepoint, three 10 μm-thick sections were counted, left and right hemispheres, for a total of six fields per animal. Therefore, thirty 200 μm2 fields of view were quantified for each. One-Way ANOVA with Tukey’s post-hoc analysis for variance. * p < 0.05; ** p < 0.01; *** p < 0.001 vs. control.
EGFPnegNG2+ cells incorporated BrdU in a distinct spatio-temporal pattern compared to EGFP+NG2+ cells, with a peak at 7 DPI at the injury epicenter (Figure 3D). It is important to note that EGFPnegNG2+ cells displayed the highest proliferation rate where the lesion is largest, i.e. at the epicenter.
Expression of cell-specific markers in EGFPnegNG2+ cells
EGFPnegNG2+ cells were also examined for co-expression of the astrocyte marker GFAP, the neuronal marker NeuN and the macrophage/microglial marker Cd11b. The EGFPnegNG2+ population was negative for GFAP and NeuN (not shown). A small subpopulation of EGFPnegNG2+ cells transiently expressed Cd11b at 3 DPI (not shown). However, these cells morphologically resembled activated macrophages/microglia and were therefore not included in the analysis.
EGFPnegNG2+ cell populations were also examined for nestin and S100β (Figure 4A–D). About 9% of EGFPnegNG2+ cells express nestin in the uninjured animal (4 ± 0.5 cells/mm2), and these were generally cells that did not display a complex morphology (Figure 4A). However, after SCI, up to 35% of EGFPnegNG2+ cells expressed nestin (12 ± 1.5 cells/mm2), depending upon time after injury and location (Figure 4B). The peak of nestin expression was at 7 DPI in EGFPnegNG2+ cells at the injury epicenter. The observed increase in nestin expression may be indicative of a progenitor cell subtype. Alternatively, as nestin is expressed by reactive astrocytes, and as expression is greatest at the injury epicenter, EGFPnegNG2+nestin+ cells may represent a “reactive” NG2+ cell subtype.
Figure 4. The EGFPnegOlig2+ cell population displays different patterns of expression of S1008, nestin, and transcription factors associated with OPCs.

A. Example of a nestin+ (blue) EGFPneg (green) NG2+ (red) cell in the ventrolateral white matter in injured tissue at 3 DPI. Scale bar = 10μm.
B. Quantitative analysis for EGFPnegNG2+nestin+ cells (top) in the control animal and in the injured animal at 1, 3 and 7 DPI, at 1.5mm rostral, epicenter, and 1.5mm caudal. Cell counts were performed in the ventral-lateral white matter. A side-by-side comparison for EGFPnegNG2+ and EGFPnegNG2+nestin+ cells is shown for each timepoint. Immunoreactive cells were quantified for 5 animals every 0.5 mm from the injury epicenter, and at the injury epicenter in the spared ventral-lateral white matter. For each distance at each timepoint, three 10 μm-thick sections were counted, left and right hemispheres, for a total of six fields per animal. Therefore, thirty 200 μm2 fields of view were quantified each. One-Way ANOVA with Tukey’s post-hoc analysis for variance. * p<0.05, ** p<0.01 vs. control.
C. Example of S100β+ (blue) EGFPneg (green) NG2+ (red) cells in the ventrolateral white matter in injured tissue at 3 DPI. Scale bar = 10μm.
D. Quantitative analysis for EGFPnegNG2+S100β+ cells in the control animal and in the injured animal at 1, 3 and 7 DPI, at 1.5mm rostral, epicenter, and 1.5mm caudal. Cell counts were performed in the ventral-lateral white matter. A side-by-side comparison for EGFPnegNG2+ and EGFPnegNG2+S100β+ cells and is shown for each timepoint. A subset of EGFPnegNG2+ cells express S100β. Immunoreactive cells were quantified for 5 animals every 0.5 mm from the injury epicenter, and at the injury epicenter in the spared ventral-lateral white matter. For each distance at each timepoint, three 10 μm-thick sections were counted, left and right hemispheres, for a total of six fields per animal. Therefore, thirty 200 μm2 fields of view were quantified each. One-Way ANOVA with Tukey’s post-hoc analysis for variance. * p<0.05, ** p<0.01 vs. control.
E. Representative images of Olig2 staining in EGFPnegNG2+ cells, acutely and chronically. Olig2 was not observed in the acute injury phase, but was observed chronically.
F. Quantification of EGFPnegOlig2+ cells in the chronic animal. Immunoreactive cells were quantified for 5 animals every 0.5 mm from the injury epicenter, and at the injury epicenter in the spared ventral-lateral white matter. For each distance at each timepoint, three 10 μm-thick sections were counted, left and right hemispheres, for a total of six fields per animal. Therefore, thirty 200 μm2 fields of view were quantified for each. Represented as mean ± SEM. One-Way ANOVA with Tukey’s Post-hoc test Symbols represent mean ± SEM. One-way ANOVA with Tukey’s post-hoc analysis. * = p<0.05, ** = p<0.01 vs. Control.
In the EGFPnegNG2+ population, 17% of cells from the uninjured spinal cord, generally bipolar cells, expressed S100β (7 ± 1 cells/mm2, Figure 4C–D). This decreased by 1 DPI, and rebounded by 3 DPI. By 7DPI, S100β levels were at or significantly greater than normal levels (Figure 4D).
We also examined the expression of oligodendrocyte lineage transcription factors Olig1, Olig2, Nkx2.2, Sox10, Sox17 and Mash1 in EGFPnegNG2+ cells. Sox10, Sox17 and Mash1 were only rarely observed in these cells. In addition, EGFPnegNG2+ cells rarely expressed Olig2 in control or acutely injured animals through 7 days after injury (Figure 4E). However, Olig2 was expressed in approximately 15% of EGFPnegNG2+ cells in the chronically injured animals at 6 weeks (9 ± 2 cells/mm2, Figure 4F).
Nkx2.2 was expressed in approximately 8% of EGFPnegNG2+ cells in the normal spinal cord (3 ± 0.5 cells/mm2). While the total number of EGFPnegNG2+Nkx2.2+ cells showed a slight increase in the acute injury phase, the percentage of EGFPnegNG2+ cells that expressed Nkx2.2 significantly decreased to approximately 5% (2 ± 0.3 cells/mm2), with no obvious trend vis-à-vis the injury epicenter and time after injury. Only 6% of EGFPnegNG2+ cells expressed Nkx2.2 at 6 weeks post-injury (2 ± 0.4 cells/mm2). Olig1 was expressed by approximately 12% of EGFPnegNG2+ cells in control animals (5 ± 1 cells/mm2), and expression of this transcription factor decreased by 50% in this cell population during the acute injury phase at most locations and time points. At 6 weeks, while expression was still down significantly at the injury epicenter, levels returned to normal at rostral and caudal locations.
Chronic Replacement of Mature Glial Cells
Mature glial cells were lost from residual white matter by 24 hours after injury. EGFP+NG2+ cells, among other cells, proliferated within the first week with a peak at 3 DPI in the rostral spinal cord (Figure 1B). By 7 DPI, there was an increase in total EGFP+NG2+ cells and EGFP+O4+ cells in the rostral spinal cord (Figure 2A–D). We wanted to examine whether cells that proliferate in the first week survive chronically and whether they produce mature glia, particularly oligodendrocytes. Therefore, mice were injected with BrdU on days 2, 3 and 4 post-injury, and allowed to survive for 6 weeks.
In uninjured tissue, BrdU+ cells were occasionally observed, and were generally EGFP+CC1+, EGFPnegGFAP+, EGFPnegNG2+ or EGFP+NG2+. Cells that incorporated BrdU in the first week following injury survived to 6 weeks (Figure 5A), and included EGFP+CC1+ oligodendrocytes, EGFPnegGFAP+ astrocytes, EGFPnegNG2+ cells or EGFP+NG2+ cells (Figure 5B–D), indicative of replacement of mature glia that were lost in the acute injury phase. Approximately 13–28% of CC1+ oligodendrocytes were BrdU+ (15 ± 2 to 28 ± 3 cells/mm2) and 12–36% of GFAP+ astrocytes were BrdU+ (4 ± 1 to 18 ± 1 cells/mm2). In total, the EGFP+CC1+ cell density returned to normal levels and the EGFPnegGFAP+ astrocyte density was increased as much as 2–3 fold in the spared ventral-lateral white matter (Figure 5D). It is important to note that all BrdU+CC1+ oligodendrocytes expressed EGFP. These data indicate that proliferative populations in the acutely injured animal contribute to the replacement of mature glial cells chronically.
Figure 5. Fate of cells that incorporate BrdU in the first week following spinal cord injury.
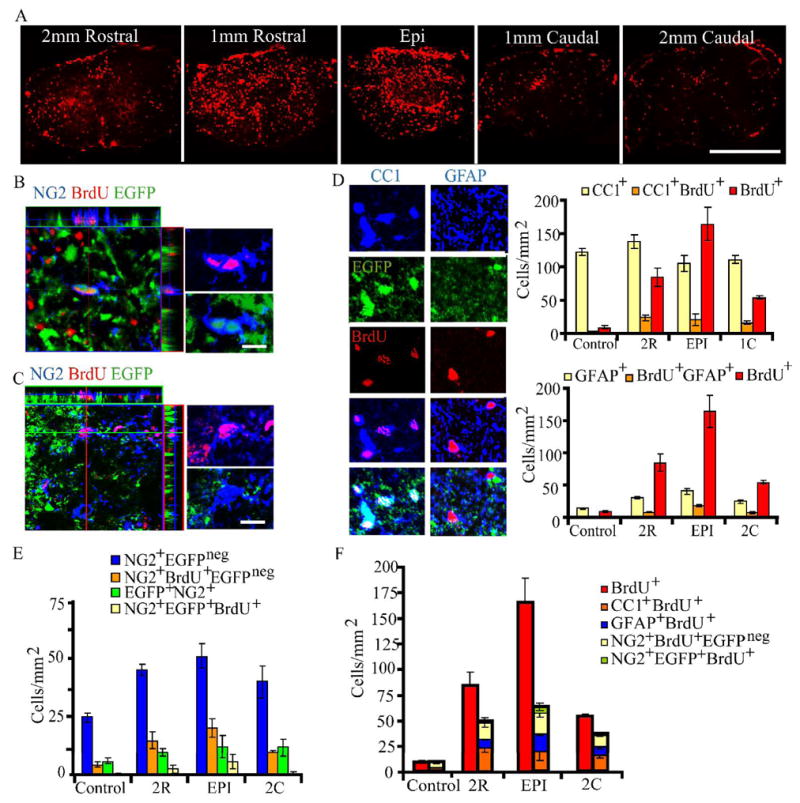
Six mice were injected with bromodeoxyuridine (BrdU) at 2–4 dpi, and were sacrificed at 6 weeks. Five control animals were also injected. Cell counts were performed in the spared ventral-lateral white matter. Six fields of view were counted per distance per animal, for a total of 36 fields of view per distance in injured animals, 30 in control.
A. Low-power view of BrdU incorporated in cells at the injury epicenter, and 1mm and 2mm rostral and caudal to it. Scalebar = 500 μm
B – C. Representative confocal microscopy images with orthogonal views. Both EGFP+ and EGFP−NG2+ cells display BrdU incorporation. Scalebars = 5 μm.
D. Representative confocal microscopy images of EGFP+CC1+ oligodendrocytes and EGFP−GFAP+ astrocytes that have incorporated BrdU. Scalebar = 10 um.
Top right panel: Quantification of average EGFP+CC1+ oligodendrocytes, BrdU+ nuclei, and EGFP+CC1+ cells that have incorporated BrdU. Bars represent mean ± SEM. One-way ANOVA with Tukey’s post-hoc analysis was performed. BrdU incorporation is significantly greater at all distances (p<0.001).
Bottom right panel: Quantification of average EGFP−GFAP+ astrocytes, BrdU+ nuclei, and EGFP−GFAP+ cells that have incorporated BrdU. Bars represent mean ± SEM. One-way ANOVA with Tukey’s post-hoc analysis. GFAP+ cell density in the chronic spinal cord is significantly greater than control levels at all distances (p<0.05). BrdU incorporation is significantly greater at all distances (p<0.01).
E. Quantification of EGFP+NG2+ cells and EGFPnegNG2+ cells. Bars represent mean ± SEM. One-way ANOVA with Tukey’s post-hoc analysis. EGFPnegNG2+ cells are significantly greater than control at all distances (p<0.05). EGFPnegNG2+BrdU+ cells are significantly greater than control at all distances (p<0.05). EGFP+NG2+ cells are significantly greater than normal at rostral locations, and at 1mm caudal (p<0.01). EGFP+NG2+BrdU+ cells are significantly greater than normal at the injury epicenter and at 1mm rostral and caudal (p<0.05).
F. BrdU+ cell population breakdown. EGFP+CC1+ oligodendrocytes, EGFPnegGFAP+astrocytes and NG2+ cells comprise about half of all BrdU+ cells in the chronic animal.
Up to 50% of EGFP+NG2+ cells were BrdU+ (6 ± 1 cells/mm2), and up to 50% of EGFPnegNG2+ cells were also BrdU+ (24 ± 4 cells/mm2), depending upon location with respect to the injury epicenter (Figure 5E). Notably, there were approximately four times as many EGFPnegNG2+ cells as compared to EGFP+NG2+ cells chronically, depending upon location vis-à-vis the injury epicenter. If EGFP+NG2+ cells were indeed OPCs, then a significant number of cells that divided in the first week would be expected to have matured by 6 weeks. If the EGFPnegNG2+ cell population is comprised largely of non-progenitor cells which do not contribute to glial replacement after SCI, then this population should increase by the chronic time point. Figure 5E demonstrates that indeed a significant increase in the density of EGFPnegNG2+ cells was observed at 6 weeks after SCI. NG2, CC1, and GFAP accounted for approximately half of all BrdU positive cells (Figure 5F), indicating a contribution from other cell types that respond to acute injury, and survive chronically following SCI.
Treatment with Glial Growth Factor 2 and basic Fibroblast Growth Factor in vivo results in increased numbers of EGFP+CC1+ oligodendrocytes and EGFPnegNG2+ cells
Basic fibroblast growth factor (FGF2) and glial growth factor 2 (GGF-2) have been shown to increase the number of NG2+ cells and/or oligodendrocytes after SCI (Zai et al., 2005; Ohori et al., 2006). Furthermore, increases in endogenous FGF2 coincide with NG2+ cell upregulation after SCI (Zai et al., 2005). However, it is still undefined whether the responsive cells are OPCs. Therefore, we treated CNP-EGFP mice with FGF2 and GGF-2 after contusive SCI. As previously reported, we found an increase in the total number of NG2+ cells in vivo (Figure 6A–B, D). However, this increase was only observed in EGFPnegNG2+ cells, with the greatest increase at the injury epicenter, consistent with the correlation of endogenous levels of these growth factors with EGFPnegNG2+ cell density (Figure 6C). There was no significant difference in the EGFP+NG2+ cell population between treated and un-treated mice (Figure 6D). We did, however, observe a significant increase in the number of EGFP+CC1+ oligodendrocytes (Figure 6C, E). These data suggest that EGFP+NG2+ cells maintain a consistent population even when differentiation is enhanced. Moreover, these data show that EGFP+NG2+ cells and EGFPnegNG2+ cells show a differential response to treatment with FGF2 and GGF2 following SCI.
Figure 6. In vivo treatment with glial growth factor 2 and basic fibroblast growth factor spinal cord injury results in increased numbers of EGFP+CC1+ oligodendrocytes.

SCI Mice were injected subcutaneously with 0.02mg/kg FGF2 and 0.8mg/kg GGF2 for 8 days, beginning at 1 DPI, and sacrificed on day 9. NG2 immunoreactivity was increased in GGF2 + FGF2 mice (A), compared to saline-injected controls (B). EGFP+CC1+ oligodendrocytes were also increased in GGF2 + FGF2 treated mice (C). D. Quantification of NG2+ cells indicating a significant increase in EGFPnegNG2+ cells. E. Quantification of CC1+ cells indicating a significant increase in EGFP+CC1+ oligodendrocytes; bars represent mean ± SEM. Two-way ANOVA was performed with Bonferrroni’s post-hoc analysis.
DISCUSSION
We utilized the CNP-EGFP mouse to investigate the response of different subpopulations of NG2+ cells to SCI. We show that at least two types of NG2+ cells exist in the normal spinal cord and proliferate in response to SCI with spatio-temporal differences, which suggest that they may respond to distinct signals. In the white matter of the normal adult spinal cord, approximately one-third of NG2+ cells expressed EGFP. These EGFP+NG2+ cells were generally bipolar, which is typical of OPCs. Conversely, approximately two-thirds were EGFPnegNG2+ cells, whose morphology ranged from bipolar to more complex, but was generally multipolar.
We provide further support for a growing body of evidence that a subset of adult NG2-expressing cells, and specifically EGFP+NG2+ cells, recapitulate developmental programs of early postnatal OPCs to give rise to replacement oligodendrocytes observed chronically after SCI. We extend these findings with novel electrophysiological analysis of proliferative NG2+ cells after SCI. Specifically, using an in situ preparation of adult spinal cord tissue, we found that the passive membrane properties and voltage gated potassium channel profile of EGFP+NG2+ cells at 3 DPI were consistent with those reported for proliferative OPCs in vitro and in situ (Bevan et al., 1987; Sontheimer et al., 1989; Barres et al., 1990; Kettenmann et al., 1991; Berger et al., 1995; Borges and Kettenmann, 1995; Attali et al., 1997; Knutson et al., 1997; Chittajallu et al., 2002). We identified an increase in the amplitude of the delayed rectifier K+ current coincident with the peak in BrdU incorporation after injury, consistent with a proliferative OPC population during development. In particular, increased Rm and upregulation of and KDR were observed at 3 DPI, when proliferation of EGFP+NG2+ cells, as measured by BrdU incorporation, was greatest. These data indicate that reactivation of EGFP+NG2+ cells after SCI involves specific changes in their membrane ionic channels, and suggest that EGFP+NG2+ cells in the adult spinal cord may rely on similar mechanisms of proliferation as observed during embryonic and early postnatal development.
Similar to OPCs, EGFP+NG2+ cells after SCI expressed cellular proteins and transcription factors associated with OPCs during developmental oligodendrogenesis. In particular, we observed an increase in the expression of cellular markers associated with OPC proliferation and early lineage progression (nestin, Olig2 and Nkx2.2), and a decrease in transcription factors associated with oligodendrocyte maturation (Olig1, Sox17 and Sox10). As previously reported, Mash1 was rarely observed (Yamamoto et al., 2001; Ohori et al., 2006), and only a small fraction of EGFP+NG2+ cells expressed Olig1, Nkx2.2, Sox10 or Sox17 at the acute time points after injury investigated. These transcription factors play a key role in oligodendrocyte maturation and myelination, and it is likely that expression increases later than 7 DPI. Olig2, which is required early in lineage progression and for acquisition of the O4+ pre-myelinating stage (Yue et al., 2006), was expressed by more EGFP+NG2+ cells than any other transcription factor examined. An increase in the number of Olig2-expressing cells has been demonstrated in various injury paradigms in different regions of the CNS (Fancy et al., 2004; Han et al., 2004; Talbott et al., 2005). We observed up-regulation of Olig2 rostral to the injury epicenter, prior to the observed increase in O4+ cells rostrally, as it would be expected if Olig2 expressing EGFP+NG2+ are OPCs.
We show here, for the first time, that in the adult spinal cord, a subset of NG2-expressing cells, EGFPnegNG2+ cells, are potentially not OPCs and that they respond to SCI in a robust manner in vivo. The peak of proliferation of EGFPnegNG2+ cells was observed at the injury epicenter, where scar formation is greatest. EGFPnegNG2+ cells did not express transcription factors consistent with OPC development and oligodendrogenesis. Considering that the increase in NG2+ cell density persists as long as 9 weeks post-injury (McTigue et al., 2001), after replacement of lost oligodendrocytes in spared white matter had been accomplished (Lytle and Wrathall, 2007; Zai and Wrathall, 2005), it is possible that a subpopulation of NG2-expressing cells in the adult CNS may be a differentiated glial phenotype that does not serve as a macroglial reservoir (Levine and Nishiyama, 1996; Horner et al., 2002). One study concluded that BrdU+NG2+ cells were destined to participate in scar formation in a cortical stab wound study (Alonso, 2005), consistent with the recently hypothesized role of NG2+ synantocytes in homeostatic function (Berry et al., 2002; Butt et al., 2002; Horner et al., 2002; Lin and Bergles, 2002; Nishiyama et al., 2002). Our results are also consistent with results from clonal analysis of rat NG2+ cells after SCI studied in vitro (Yoo and Wrathall, 2007), where some clones of purified NG2+ cells produced glia when permitted to differentiate, while others remained NG2+ cells. An alternative possibility is that the EGFPnegNG2+ cell population may itself be heterogeneous, as demonstrated by the finding that S100β was expressed in a subset of bipolar EGFPnegNG2+ cells, which may represent an immature astrocyte population that does not yet express GFAP.
It is, of course, a possibility that EGFPnegNG2+ cells and EGFP+NG2+ cells share a common lineage. Even though oligodendrocytes and ventral motor neurons arise from a common progenitor during embryonic spinal cord development (Miller, 2002), it is well established that the adult spinal cord is not conducive to neurogenesis after injury, even in the presence of exogenous growth factors (Ohori et al., 2006). Olig2 is down-regulated to allow progression along a neuronal lineage during development (Lu et al., 2001; Fancy et al., 2004; Hack et al., 2005; Lee et al., 2005) and may be a repressor of neurogenesis after injury (Buffo et al., 2005). Therefore, Olig2+EGFPnegNG2+ cells in the chronic animal may be progenitors that failed to differentiate along the oligodendrocyte lineage acutely and also did not receive the proper signals to become neurons. It has also been demonstrated that ablation of Olig2 function during early development leads to a complete lack of OPCs and synantocytes (Ligon et al., 2006b). Therefore, Olig2+EGFPnegNG2+ cells after chronic SCI may be synantocytes derived from Olig2+EGFP+NG2+ cells stimulated during the acute injury phase.
GGF2 and FGF2 have been shown to increase the number of NG2+ cells and/or oligodendrogenesis (Zai et al., 2005; Ohori et al., 2006). We therefore treated SCI animals with GGF2 and FGF2 to determine the specific response of EGFP+NG2+ cells and EGFPnegNG2+ cells. While the number of EGFP+NG2+ cells was not affected, the observed increase in EGFP+CC1+ oligodendrocytes suggests that we stimulated differentiation of the EGFP+NG2+ cell population, which might have strong implications for therapeutic intervention. However, the observed increase in survival and/or proliferation of EGFPnegNG2+ cells in response to growth factor treatment has therapeutic implications as well. It is also likely that treatment with GGF2 and FGF2 has led to more axonal preservation/regeneration, providing more available axons onto which OPCs can differentiate. It has, however, been shown GGF2 infusion alone into areas of primary demyelination does not lead to remyelination enhancement (Penderis J, et al., 2003b).
Survival, proliferation and/or differentiation of OPCs and other NG2-expressing cells may be only part of a complicated path to remyelination in the injured adult spinal cord. And while we did not study remyelination per se, our studies may indicate a need for combinatorial treatment. The role of these cells is not yet clear, and whether they are beneficial or detrimental to recovery remains unknown. Optimizing therapeutic agents and time windows for increased response of specific subsets of NG2-expressing cells should be considered in the future design of regeneration and repair therapies.
In conclusion, the data presented here provide strong evidence that the EGFP+NG2+ cell population is morphologically and electrophysiologically similar to perinatal OPCs that give rise to mature oligodendrocytes. We also provide support for the assertion that NG2+ cells in the adult and after SCI may include immature astrocytes (S100β+), other progenitor cell subtypes (nestin+, Olig1/2+, Nkx2.2+) and possibly synantocytes. The complexity of the cellular response aftaer SCI indicates that, in the future, specific treatment paradigms targeted to enhance the response of certain subtypes of NG2+ cells may improve the potential for regeneration and remyelination after SCI.
Supplementary Material
Acknowledgments
This work was supported by R01-NS045702 (V.G.), R01-NS056427 (V.G.), National Multiple Sclerosis Society RG3712 (V.G.), NRSA 5F31NS051086-02 (J.L.), R01-NS035647 (J.W.) and the Christopher Reeve and Sam Schmidt Foundations (J.W., contract number WB2-0403). We are particularly thankful to Drs. Joshua Corbin and Tarik Haydar for discussion and for critical comments on this project. We thank Drs. Thomas Finn and Gerard Ahern for discussion. We also thank all members of the Gallo and Wrathall labs for their support and for discussion. Lastly, we thank Acorda for providing the rhGGF2.
References
- Aguirre A, Gallo V. Postnatal neurogenesis and gliogenesis in the olfactory bulb from NG2-expressing progenitors of the subventricular zone. J Neurosci. 2004;24:10530–10541. doi: 10.1523/JNEUROSCI.3572-04.2004. [DOI] [PMC free article] [PubMed] [Google Scholar]
- Aguirre AA, Chittajallu R, Belachew S, Gallo V. NG2-expressing cells in the subventricular zone are type C-like cells and contribute to interneuron generation in the postnatal hippocampus. J Cell Biol. 2004;165:575–589. doi: 10.1083/jcb.200311141. [DOI] [PMC free article] [PubMed] [Google Scholar]
- Alonso G. NG2 proteoglycan-expressing cells of the adult rat brain: possible involvement in the formation of glial scar astrocytes following stab wound. Glia. 2005;49:318–338. doi: 10.1002/glia.20121. [DOI] [PubMed] [Google Scholar]
- Attali B, Wang N, Kolot A, Sobko A, Cherepanov V, Soliven B. Characterization of delayed rectifier Kv channels in oligodendrocytes and progenitor cells. J Neurosci. 1997;17:8234–8245. doi: 10.1523/JNEUROSCI.17-21-08234.1997. [DOI] [PMC free article] [PubMed] [Google Scholar]
- Barres BA, Raff MC. Proliferation of oligodendrocyte precursor cells depends on electrical activity in axons. Nature. 1993;361:258–260. doi: 10.1038/361258a0. [DOI] [PubMed] [Google Scholar]
- Barres BA, Koroshetz WJ, Swartz KJ, Chun LL, Corey DP. Ion channel expression by white matter glia: the O-2A glial progenitor cell. Neuron. 1990;4:507–524. doi: 10.1016/0896-6273(90)90109-s. [DOI] [PubMed] [Google Scholar]
- Basso DM, Fisher LC, Anderson AJ, Jakeman LB, McTigue DM, Popovich PG. Basso Mouse Scale for locomotion detects differences in recovery after spinal cord injury in five common mouse strains. J Neurotrauma. 2006;23:635–659. doi: 10.1089/neu.2006.23.635. [DOI] [PubMed] [Google Scholar]
- Belachew S, Chittajallu R, Aguirre AA, Yuan X, Kirby M, Anderson S, Gallo V. Postnatal NG2 proteoglycan-expressing progenitor cells are intrinsically multipotent and generate functional neurons. J Cell Biol. 2003;161:169–186. doi: 10.1083/jcb.200210110. [DOI] [PMC free article] [PubMed] [Google Scholar]
- Berger T, Muller T, Kettenmann H. Developmental regulation of ion channels and receptors on glial cells. Perspect Dev Neurobiol. 1995;2:347–356. [PubMed] [Google Scholar]
- Berry M, Hubbard P, Butt AM. Cytology and lineage of NG2-positive glia. J Neurocytol. 2002;31:457–467. doi: 10.1023/a:1025735513560. [DOI] [PubMed] [Google Scholar]
- Bevan S, Lindsay RM, Perkins MN, Raff MC. Voltage gated ionic channels in rat cultured astrocytes, reactive astrocytes and an astrocyte-oligodendrocyte progenitor cell. J Physiol (Paris) 1987;82:327–335. [PubMed] [Google Scholar]
- Blakemore WF. Pattern of remyelination in the CNS. Nature. 1974;249:577–578. doi: 10.1038/249577a0. [DOI] [PubMed] [Google Scholar]
- Blight AR. Axonal physiology of chronic spinal cord injury in the cat: intracellular recording in vitro. Neuroscience. 1983a;10:1471–1486. doi: 10.1016/0306-4522(83)90128-8. [DOI] [PubMed] [Google Scholar]
- Blight AR. Cellular morphology of chronic spinal cord injury in the cat: analysis of myelinated axons by line-sampling. Neuroscience. 1983b;10:521–543. doi: 10.1016/0306-4522(83)90150-1. [DOI] [PubMed] [Google Scholar]
- Blight AR. Delayed demyelination and macrophage invasion: a candidate for secondary cell damage in spinal cord injury. Cent Nerv Syst Trauma. 1985;2:299–315. doi: 10.1089/cns.1985.2.299. [DOI] [PubMed] [Google Scholar]
- Borges K, Kettenmann H. Blockade of K+ channels induced by AMPA/kainate receptor activation in mouse oligodendrocyte precursor cells is mediated by Na+ entry. J Neurosci Res. 1995;42:579–593. doi: 10.1002/jnr.490420416. [DOI] [PubMed] [Google Scholar]
- Borges K, Ohlemeyer C, Trotter J, Kettenmann H. AMPA/kainate receptor activation in murine oligodendrocyte precursor cells leads to activation of a cation conductance, calcium influx and blockade of delayed rectifying K+ channels. Neuroscience. 1994;63:135–149. doi: 10.1016/0306-4522(94)90012-4. [DOI] [PubMed] [Google Scholar]
- Bu J, Akhtar N, Nishiyama A. Transient expression of the NG2 proteoglycan by a subpopulation of activated macrophages in an excitotoxic hippocampal lesion. Glia. 2001;34:296–310. doi: 10.1002/glia.1063. [DOI] [PubMed] [Google Scholar]
- Buffo A, Vosko MR, Erturk D, Hamann GF, Jucker M, Rowitch D, Gotz M. Expression pattern of the transcription factor Olig2 in response to brain injuries: implications for neuronal repair. Proc Natl Acad Sci U S A. 2005;102:18183–18188. doi: 10.1073/pnas.0506535102. [DOI] [PMC free article] [PubMed] [Google Scholar]
- Bunge RP. The role of the Schwann cell in trophic support and regeneration. J Neurol. 1994;242:S19–21. doi: 10.1007/BF00939235. [DOI] [PubMed] [Google Scholar]
- Butt AM, Kiff J, Hubbard P, Berry M. Synantocytes: new functions for novel NG2 expressing glia. J Neurocytol. 2002;31:551–565. doi: 10.1023/a:1025751900356. [DOI] [PubMed] [Google Scholar]
- Butt AM, Hamilton N, Hubbard P, Pugh M, Ibrahim M. Synantocytes: the fifth element. J Anat. 2005;207:695–706. doi: 10.1111/j.1469-7580.2005.00458.x. [DOI] [PMC free article] [PubMed] [Google Scholar]
- Chittajallu R, Aguirre A, Gallo V. NG2-positive cells in the mouse white and grey matter display distinct physiological properties. J Physiol. 2004;561:109–122. doi: 10.1113/jphysiol.2004.074252. [DOI] [PMC free article] [PubMed] [Google Scholar]
- Chittajallu R, Aguirre AA, Gallo V. Downregulation of platelet-derived growth factor-alpha receptor-mediated tyrosine kinase activity as a cellular mechanism for K+-channel regulation during oligodendrocyte development in situ. J Neurosci. 2005;25:8601–8610. doi: 10.1523/JNEUROSCI.2122-05.2005. [DOI] [PMC free article] [PubMed] [Google Scholar]
- Chittajallu R, Chen Y, Wang H, Yuan X, Ghiani CA, Heckman T, McBain CJ, Gallo V. Regulation of Kv1 subunit expression in oligodendrocyte progenitor cells and their role in G1/S phase progression of the cell cycle. Proc Natl Acad Sci U S A. 2002;99:2350–2355. doi: 10.1073/pnas.042698399. [DOI] [PMC free article] [PubMed] [Google Scholar]
- Deloulme JC, Raponi E, Gentil BJ, Bertacchi N, Marks A, Labourdette G, Baudier J. Nuclear expression of S100B in oligodendrocyte progenitor cells correlates with differentiation toward the oligodendroglial lineage and modulates oligodendrocytes maturation. Mol Cell Neurosci. 2004;27:453–465. doi: 10.1016/j.mcn.2004.07.008. [DOI] [PubMed] [Google Scholar]
- Diers-Fenger M, Kirchhoff F, Kettenmann H, Levine JM, Trotter J. AN2/NG2 protein-expressing glial progenitor cells in the murine CNS: isolation, differentiation, and association with radial glia. Glia. 2001;34:213–228. doi: 10.1002/glia.1055. [DOI] [PubMed] [Google Scholar]
- Dimitrijevic MR, McKay WB, Sherwood AM. Motor control physiology below spinal cord injury: residual volitional control of motor units in paretic and paralyzed muscles. Adv Neurol. 1997;72:335–345. [PubMed] [Google Scholar]
- Dimitrijevic MR, Dimitrijevic MM, Faganel J, Sherwood AM. Suprasegmentally induced motor unit activity in paralyzed muscles of patients with established spinal cord injury. Ann Neurol. 1984;16:216–221. doi: 10.1002/ana.410160208. [DOI] [PubMed] [Google Scholar]
- Engesser-Cesar C, Anderson AJ, Basso DM, Edgerton VR, Cotman CW. Voluntary wheel running improves recovery from a moderate spinal cord injury. J Neurotrauma. 2005;22:157–171. doi: 10.1089/neu.2005.22.157. [DOI] [PubMed] [Google Scholar]
- Fancy SP, Zhao C, Franklin RJ. Increased expression of Nkx2.2 and Olig2 identifies reactive oligodendrocyte progenitor cells responding to demyelination in the adult CNS. Mol Cell Neurosci. 2004;27:247–254. doi: 10.1016/j.mcn.2004.06.015. [DOI] [PubMed] [Google Scholar]
- Gallo V, Armstrong RC. Developmental and growth factor-induced regulation of nestin in oligodendrocyte lineage cells. J Neurosci. 1995;15:394–406. doi: 10.1523/JNEUROSCI.15-01-00394.1995. [DOI] [PMC free article] [PubMed] [Google Scholar]
- Gallo V, Zhou JM, McBain CJ, Wright P, Knutson PL, Armstrong RC. Oligodendrocyte progenitor cell proliferation and lineage progression are regulated by glutamate receptor-mediated K+ channel block. J Neurosci. 1996;16:2659–2670. doi: 10.1523/JNEUROSCI.16-08-02659.1996. [DOI] [PMC free article] [PubMed] [Google Scholar]
- Ghasemlou N, Kerr BJ, David S. Tissue displacement and impact force are important contributors to outcome after spinal cord contusion injury. Exp Neurol. 2005;196:9–17. doi: 10.1016/j.expneurol.2005.05.017. [DOI] [PubMed] [Google Scholar]
- Ghiani CA, Eisen AM, Yuan X, DePinho RA, McBain CJ, Gallo V. Neurotransmitter receptor activation triggers p27(Kip1)and p21(CIP1) accumulation and G1 cell cycle arrest in oligodendrocyte progenitors. Development. 1999a;126:1077–1090. doi: 10.1242/dev.126.5.1077. [DOI] [PubMed] [Google Scholar]
- Ghiani CA, Yuan X, Eisen AM, Knutson PL, DePinho RA, McBain CJ, Gallo V. Voltage-activated K+ channels and membrane depolarization regulate accumulation of the cyclin-dependent kinase inhibitors p27(Kip1) and p21(CIP1) in glial progenitor cells. J Neurosci. 1999b;19:5380–5392. doi: 10.1523/JNEUROSCI.19-13-05380.1999. [DOI] [PMC free article] [PubMed] [Google Scholar]
- Gledhill RF, Harrison BM, McDonald WI. Demyelination and remyelination after acute spinal cord compression. Exp Neurol. 1973;38:472–487. doi: 10.1016/0014-4886(73)90169-6. [DOI] [PubMed] [Google Scholar]
- Greenwood K, Butt AM. Evidence that perinatal and adult NG2-glia are not conventional oligodendrocyte progenitors and do not depend on axons for their survival. Mol Cell Neurosci. 2003;23:544–558. doi: 10.1016/s1044-7431(03)00176-3. [DOI] [PubMed] [Google Scholar]
- Grossman SD, Rosenberg LJ, Wrathall JR. Temporal-spatial pattern of acute neuronal and glial loss after spinal cord contusion. Exp Neurol. 2001;168:273–282. doi: 10.1006/exnr.2001.7628. [DOI] [PubMed] [Google Scholar]
- Hachem S, Aguirre A, Vives V, Marks A, Gallo V, Legraverend C. Spatial and temporal expression of S100B in cells of oligodendrocyte lineage. Glia. 2005;51:81–97. doi: 10.1002/glia.20184. [DOI] [PubMed] [Google Scholar]
- Hack MA, Saghatelyan A, de Chevigny A, Pfeifer A, Ashery-Padan R, Lledo PM, Gotz M. Neuronal fate determinants of adult olfactory bulb neurogenesis. Nat Neurosci. 2005;8:865–872. doi: 10.1038/nn1479. [DOI] [PubMed] [Google Scholar]
- Han SS, Liu Y, Tyler-Polsz C, Rao MS, Fischer I. Transplantation of glial-restricted precursor cells into the adult spinal cord: survival, glial-specific differentiation, and preferential migration in white matter. Glia. 2004;45:1–16. doi: 10.1002/glia.10282. [DOI] [PubMed] [Google Scholar]
- Horky LL, Galimi F, Gage FH, Horner PJ. Fate of endogenous stem/progenitor cells following spinal cord injury. J Comp Neurol. 2006;498:525–538. doi: 10.1002/cne.21065. [DOI] [PMC free article] [PubMed] [Google Scholar]
- Horner PJ, Thallmair M, Gage FH. Defining the NG2-expressing cell of the adult CNS. J Neurocytol. 2002;31:469–480. doi: 10.1023/a:1025739630398. [DOI] [PubMed] [Google Scholar]
- Horner PJ, Power AE, Kempermann G, Kuhn HG, Palmer TD, Winkler J, Thal LJ, Gage FH. Proliferation and differentiation of progenitor cells throughout the intact adult rat spinal cord. J Neurosci. 2000;20:2218–2228. doi: 10.1523/JNEUROSCI.20-06-02218.2000. [DOI] [PMC free article] [PubMed] [Google Scholar]
- Jones LL, Yamaguchi Y, Stallcup WB, Tuszynski MH. NG2 is a major chondroitin sulfate proteoglycan produced after spinal cord injury and is expressed by macrophages and oligodendrocyte progenitors. J Neurosci. 2002;22:2792–2803. doi: 10.1523/JNEUROSCI.22-07-02792.2002. [DOI] [PMC free article] [PubMed] [Google Scholar]
- Keirstead HS, Blakemore WF. The role of oligodendrocytes and oligodendrocyte progenitors in CNS remyelination. Adv Exp Med Biol. 1999;468:183–197. doi: 10.1007/978-1-4615-4685-6_15. [DOI] [PubMed] [Google Scholar]
- Kettenmann H, Blankenfeld GV, Trotter J. Physiological properties of oligodendrocytes during development. Ann N Y Acad Sci. 1991;633:64–77. doi: 10.1111/j.1749-6632.1991.tb15596.x. [DOI] [PubMed] [Google Scholar]
- Kigerl KA, McGaughy VM, Popovich PG. Comparative analysis of lesion development and intraspinal inflammation in four strains of mice following spinal contusion injury. J Comp Neurol. 2006;494:578–594. doi: 10.1002/cne.20827. [DOI] [PMC free article] [PubMed] [Google Scholar]
- Knutson P, Ghiani CA, Zhou JM, Gallo V, McBain CJ. K+ channel expression and cell proliferation are regulated by intracellular sodium and membrane depolarization in oligodendrocyte progenitor cells. J Neurosci. 1997;17:2669–2682. doi: 10.1523/JNEUROSCI.17-08-02669.1997. [DOI] [PMC free article] [PubMed] [Google Scholar]
- Kuhn PL, Wrathall JR. A mouse model of graded contusive spinal cord injury. J Neurotrauma. 1998;15:125–140. doi: 10.1089/neu.1998.15.125. [DOI] [PubMed] [Google Scholar]
- Langley O, Ghandour M, Gombos G. Immunohistochemistry of cell markers in the central nervous system. New York: Plenum; 1984. [Google Scholar]
- Lee SK, Lee B, Ruiz EC, Pfaff SL. Olig2 and Ngn2 function in opposition to modulate gene expression in motor neuron progenitor cells. Genes Dev. 2005;19:282–294. doi: 10.1101/gad.1257105. [DOI] [PMC free article] [PubMed] [Google Scholar]
- Levine JM, Nishiyama A. The NG2 chondroitin sulfate proteoglycan: a multifunctional proteoglycan associated with immature cells. Perspect Dev Neurobiol. 1996;3:245–259. [PubMed] [Google Scholar]
- Levine JM, Stincone F, Lee YS. Development and differentiation of glial precursor cells in the rat cerebellum. Glia. 1993;7:307–321. doi: 10.1002/glia.440070406. [DOI] [PubMed] [Google Scholar]
- Levine JM, Reynolds R, Fawcett JW. The oligodendrocyte precursor cell in health and disease. Trends Neurosci. 2001;24:39–47. doi: 10.1016/s0166-2236(00)01691-x. [DOI] [PubMed] [Google Scholar]
- Ligon KL, Fancy SP, Franklin RJ, Rowitch DH. Olig gene function in CNS development and disease. Glia. 2006a;54:1–10. doi: 10.1002/glia.20273. [DOI] [PubMed] [Google Scholar]
- Ligon KL, Kesari S, Kitada M, Sun T, Arnett HA, Alberta JA, Anderson DJ, Stiles CD, Rowitch DH. Development of NG2 neural progenitor cells requires Olig gene function. Proc Natl Acad Sci U S A. 2006b;103:7853–7858. doi: 10.1073/pnas.0511001103. [DOI] [PMC free article] [PubMed] [Google Scholar]
- Lin SC, Bergles DE. Physiological characteristics of NG2-expressing glial cells. J Neurocytol. 2002;31:537–549. doi: 10.1023/a:1025799816285. [DOI] [PubMed] [Google Scholar]
- Liu Y, Wu Y, Lee JC, Xue H, Pevny LH, Kaprielian Z, Rao MS. Oligodendrocyte and astrocyte development in rodents: an in situ and immunohistological analysis during embryonic development. Glia. 2002;40:25–43. doi: 10.1002/glia.10111. [DOI] [PubMed] [Google Scholar]
- Liu Z, Hu X, Cai J, Liu B, Peng X, Wegner M, Qiu M. Induction of oligodendrocyte differentiation by Olig2 and Sox10: evidence for reciprocal interactions and dosage-dependent mechanisms. Dev Biol. 2007;302:683–693. doi: 10.1016/j.ydbio.2006.10.007. [DOI] [PubMed] [Google Scholar]
- Lu QR, Cai L, Rowitch D, Cepko CL, Stiles CD. Ectopic expression of Olig1 promotes oligodendrocyte formation and reduces neuronal survival in developing mouse cortex. Nat Neurosci. 2001;4:973–974. doi: 10.1038/nn718. [DOI] [PubMed] [Google Scholar]
- Lytle JM, Wrathall JR. Glial cell loss, proliferation and replacement in the contused murine spinal cord. Eur J Neurosci. 2007;25:1711–1724. doi: 10.1111/j.1460-9568.2007.05390.x. [DOI] [PubMed] [Google Scholar]
- Lytle JM, Vicini S, Wrathall JR. Phenotypic changes in NG2+ cells after spinal cord injury. J Neurotrauma. 2006;23:1726–1738. doi: 10.1089/neu.2006.23.1726. [DOI] [PubMed] [Google Scholar]
- Mallon BS, Shick HE, Kidd GJ, Macklin WB. Proteolipid promoter activity distinguishes two populations of NG2-positive cells throughout neonatal cortical development. J Neurosci. 2002;22:876–885. doi: 10.1523/JNEUROSCI.22-03-00876.2002. [DOI] [PMC free article] [PubMed] [Google Scholar]
- McTigue DM, Wei P, Stokes BT. Proliferation of NG2-positive cells and altered oligodendrocyte numbers in the contused rat spinal cord. J Neurosci. 2001;21:3392–3400. doi: 10.1523/JNEUROSCI.21-10-03392.2001. [DOI] [PMC free article] [PubMed] [Google Scholar]
- Miller RH. Regulation of oligodendrocyte development in the vertebrate CNS. Prog Neurobiol. 2002;67:451–467. doi: 10.1016/s0301-0082(02)00058-8. [DOI] [PubMed] [Google Scholar]
- Neusch C, Weishaupt JH, Bahr M. Kir channels in the CNS: emerging new roles and implications for neurological diseases. Cell Tissue Res. 2003;311:131–138. doi: 10.1007/s00441-002-0669-x. [DOI] [PubMed] [Google Scholar]
- Nishiyama A, Watanabe M, Yang Z, Bu J. Identity, distribution, and development of polydendrocytes: NG2-expressing glial cells. J Neurocytol. 2002;31:437–455. doi: 10.1023/a:1025783412651. [DOI] [PubMed] [Google Scholar]
- Nishiyama A, Lin XH, Giese N, Heldin CH, Stallcup WB. Co-localization of NG2 proteoglycan and PDGF alpha-receptor on O2A progenitor cells in the developing rat brain. J Neurosci Res. 1996;43:299–314. doi: 10.1002/(SICI)1097-4547(19960201)43:3<299::AID-JNR5>3.0.CO;2-E. [DOI] [PubMed] [Google Scholar]
- Ohori Y, Yamamoto S, Nagao M, Sugimori M, Yamamoto N, Nakamura K, Nakafuku M. Growth factor treatment and genetic manipulation stimulate neurogenesis and oligodendrogenesis by endogenous neural progenitors in the injured adult spinal cord. J Neurosci. 2006;26:11948–11960. doi: 10.1523/JNEUROSCI.3127-06.2006. [DOI] [PMC free article] [PubMed] [Google Scholar]
- Penderis J, Shields SA, Franklin RJ. Impaired remyelination and depletion of oligodendrocyte progenitors does not occur following repeated episodes of focal demyelination in the rat central nervous system. Brain. 2003a;126:1382–1391. doi: 10.1093/brain/awg126. [DOI] [PubMed] [Google Scholar]
- Penderis J, Woodruff RH, Lakatos A, Li WW, Dunning MD, Zhao C, Marchionni M, Franklin RJ. Increasing local levels of neuregulin (glial growth factor-2) by direct infusion into areas of demyelination does not alter remyelination in the rat CNS. Eur J Neurosci. 2003b;2003:2253–2264. doi: 10.1046/j.1460-9568.2003.02969.x. [DOI] [PubMed] [Google Scholar]
- Rabchevsky AG, Sullivan PG, Scheff SW. Temporal-spatial dynamics in oligodendrocyte and glial progenitor cell numbers throughout ventrolateral white matter following contusion spinal cord injury. Glia. 2007;55:831–843. doi: 10.1002/glia.20508. [DOI] [PubMed] [Google Scholar]
- Raff MC, Miller RH, Noble M. A glial progenitor cell that develops in vitro into an astrocyte or an oligodendrocyte depending on culture medium. Nature. 1983;303:390–396. doi: 10.1038/303390a0. [DOI] [PubMed] [Google Scholar]
- Reynolds R, Hardy R. Oligodendroglial progenitors labeled with the O4 antibody persist in the adult rat cerebral cortex in vivo. J Neurosci Res. 1997;47:455–470. doi: 10.1002/(sici)1097-4547(19970301)47:5<455::aid-jnr1>3.0.co;2-g. [DOI] [PubMed] [Google Scholar]
- Rosenberg LJ, Zai LJ, Wrathall JR. Chronic alterations in the cellular composition of spinal cord white matter following contusion injury. Glia. 2005;49:107–120. doi: 10.1002/glia.20096. [DOI] [PubMed] [Google Scholar]
- Seki T, Hida K, Tada M, Koyanagi I, Iwasaki Y. Graded contusion model of the mouse spinal cord using a pneumatic impact device. Neurosurgery. 2002;50:1075–1081. doi: 10.1097/00006123-200205000-00024. discussion 1081–1072. [DOI] [PubMed] [Google Scholar]
- Sohn J, Natale J, Chew LJ, Belachew S, Cheng Y, Aguirre A, Lytle J, Nait-Oumesmar B, Kerninon C, Kanai-Azuma M, Kanai Y, Gallo V. Identification of Sox17 as a transcription factor that regulates oligodendrocyte development. J Neurosci. 2006;26:9722–9735. doi: 10.1523/JNEUROSCI.1716-06.2006. [DOI] [PMC free article] [PubMed] [Google Scholar]
- Sontheimer H, Trotter J, Schachner M, Kettenmann H. Channel expression correlates with differentiation stage during the development of oligodendrocytes from their precursor cells in culture. Neuron. 1989;2:1135–1145. doi: 10.1016/0896-6273(89)90180-3. [DOI] [PubMed] [Google Scholar]
- Sroga JM, Jones TB, Kigerl KA, McGaughy VM, Popovich PG. Rats and mice exhibit distinct inflammatory reactions after spinal cord injury. J Comp Neurol. 2003;462:223–240. doi: 10.1002/cne.10736. [DOI] [PubMed] [Google Scholar]
- Stallcup WB. The NG2 antigen, a putative lineage marker: immunofluorescent localization in primary cultures of rat brain. Dev Biol. 1981;83:154–165. doi: 10.1016/s0012-1606(81)80018-8. [DOI] [PubMed] [Google Scholar]
- Stallcup WB. The NG2 proteoglycan: past insights and future prospects. J Neurocytol. 2002;31:423–435. doi: 10.1023/a:1025731428581. [DOI] [PubMed] [Google Scholar]
- Sugimori M, Nagao M, Bertrand N, Parras CM, Guillemot F, Nakafuku M. Combinatorial actions of patterning and HLH transcription factors in the spatiotemporal control of neurogenesis and gliogenesis in the developing spinal cord. Development. 2007;134:1617–1629. doi: 10.1242/dev.001255. [DOI] [PubMed] [Google Scholar]
- Talbott JF, Loy DN, Liu Y, Qiu MS, Bunge MB, Rao MS, Whittemore SR. Endogenous Nkx2.2+/Olig2+ oligodendrocyte precursor cells fail to remyelinate the demyelinated adult rat spinal cord in the absence of astrocytes. Exp Neurol. 2005;192:11–24. doi: 10.1016/j.expneurol.2004.05.038. [DOI] [PMC free article] [PubMed] [Google Scholar]
- Tripathi R, McTigue DM. Prominent oligodendrocyte genesis along the border of spinal contusion lesions. Glia. 2007;55:698–711. doi: 10.1002/glia.20491. [DOI] [PubMed] [Google Scholar]
- Vautier F, Belachew S, Chittajallu R, Gallo V. Shaker-type potassium channel subunits differentially control oligodendrocyte progenitor proliferation. Glia. 2004;48:337–345. doi: 10.1002/glia.20088. [DOI] [PubMed] [Google Scholar]
- Woodruff RH, Tekki-Kessaris N, Stiles CD, Rowitch DH, Richardson WD. Oligodendrocyte development in the spinal cord and telencephalon: common themes and new perspectives. Int J Dev Neurosci. 2001;19:379–385. doi: 10.1016/s0736-5748(00)00083-6. [DOI] [PubMed] [Google Scholar]
- Wrathall JR, Li W, Hudson LD. Myelin gene expression after experimental contusive spinal cord injury. J Neurosci. 1998;18:8780–8793. doi: 10.1523/JNEUROSCI.18-21-08780.1998. [DOI] [PMC free article] [PubMed] [Google Scholar]
- Yamamoto S, Nagao M, Sugimori M, Kosako H, Nakatomi H, Yamamoto N, Takebayashi H, Nabeshima Y, Kitamura T, Weinmaster G, Nakamura K, Nakafuku M. Transcription factor expression and Notch-dependent regulation of neural progenitors in the adult rat spinal cord. J Neurosci. 2001;21:9814–9823. doi: 10.1523/JNEUROSCI.21-24-09814.2001. [DOI] [PMC free article] [PubMed] [Google Scholar]
- Yoo S, Wrathall JR. Mixed primary culture and clonal analysis provide evidence that NG2 proteoglycan-expressing cells after spinal cord injury are glial progenitors. Dev Neurobiol. 2007;67:860–874. doi: 10.1002/dneu.20369. [DOI] [PubMed] [Google Scholar]
- Yu WP, Collarini EJ, Pringle NP, Richardson WD. Embryonic expression of myelin genes: evidence for a focal source of oligodendrocyte precursors in the ventricular zone of the neural tube. Neuron. 1994;12:1353–1362. doi: 10.1016/0896-6273(94)90450-2. [DOI] [PubMed] [Google Scholar]
- Yuan X, Chittajallu R, Belachew S, Anderson S, McBain CJ, Gallo V. Expression of the green fluorescent protein in the oligodendrocyte lineage: a transgenic mouse for developmental and physiological studies. J Neurosci Res. 2002;70:529–545. doi: 10.1002/jnr.10368. [DOI] [PubMed] [Google Scholar]
- Yue T, Xian K, Hurlock E, Xin M, Kernie SG, Parada LF, Lu QR. A critical role for dorsal progenitors in cortical myelination. J Neurosci. 2006;26:1275–1280. doi: 10.1523/JNEUROSCI.4717-05.2006. [DOI] [PMC free article] [PubMed] [Google Scholar]
- Zai LJ, Wrathall JR. Cell proliferation and replacement following contusive spinal cord injury. Glia. 2005;50:247–257. doi: 10.1002/glia.20176. [DOI] [PubMed] [Google Scholar]
- Zai LJ, Yoo S, Wrathall JR. Increased growth factor expression and cell proliferation after contusive spinal cord injury. Brain Res. 2005;1052:147–155. doi: 10.1016/j.brainres.2005.05.071. [DOI] [PubMed] [Google Scholar]
Associated Data
This section collects any data citations, data availability statements, or supplementary materials included in this article.