Abstract
The interfacial properties of the negatively charged dimyristoyl-phosphatidylglycerol (DMPG) and the zwitterionic dimyristoyl-phosphatidylcholine (DMPC) vesicles mixed with the fusion inhibitor lysomyristoylphosphatidylcholine (LMPC) are investigated by electron paramagnetic resonance (EPR). At 35 °C, addition of 20 mole percent of LMPC to the DMPG vesicles increases the effective concentration of water in the interfacial layer of DMPG vesicles from 19.3 M to 27.7 M, whereas in the case of mixed DMPC-LMPC vesicle the effective water concentration in the interfacial layer of DMPC vesicles only changes, from 15.1 M to 18.4 M. The hydrogen bonding structure in both mixed DMPG-LMPC and mixed DMPC-LMPC vesicles becomes stronger with an increasing fraction of LMPC in the vesicles. The average area per phospholipid decreases in mixed DMPC-LMPC vesicles, while it increases in mixed DMPG-LMPC vesicles as the proportion of LMPC in the vesicle increases. The inhibitory nature of LMPC in both vesicle and biological fusion comes from the increase in surface hydration, as well as from the dynamic cone shape of LMPC in the phospholipid bilayer
Keywords: Electron Paramagnetic Resonance (EPR) spectroscopy, Surface Hydration, Lysomyristoylphosphatidylcholine (LMPC), Dimyristoyl-phosphatidylglycerol (DMPG), Dimyristoyl-phosphatidylcholine (DMPC), Spin probes
Introduction
Membrane fusion is a common stage in a wide range of cellular processes [1] [2] [3] [4] [5] [6], such as fertilization, cell-cell communication, viral infection and vesicular transport. Although we have gained an extensive amount of knowledge on membrane fusion, the detailed molecular mechanism of the membrane fusion process is still eluding us [6] [7] [8]. The lack of detailed understanding stems from the wide variety of cellular fusion processes and the larger number of cellular components required for the triggering and spatial and temporal control of the fusion event [4]. Despite the complexity and diversity of membrane fusion, recent studies have shown that there are some common features in all fusion processes [6]. According to Lentz at al, both fusion proteins and lipids are essential in the fusion event, so the fusion event can be viewed as protein machines operating on lipid assemblies [6]. Also, the energy barrier for fusion seems to be the same for both protein catalyzed membrane fusion of various biological membranes and protein-free fusion of phospholipid membranes [9]. The energy barrier independence of the presence of fusion proteins indicates that the fusion processes are strongly affected by the physics of lipid-lipid interactions [10] and the properties of membrane lipid bilayers [5].
The specificity and timing of membrane fusion is determined by membrane fusion proteins, which share important characteristics, of which the most important is a hydrophobic fusion peptide within the transmembrane-anchored polypeptide chain [3] [5] [11]. The rate and degree of proton mediated membrane fusion for both biological and model membranes has been found to depend on the lipid composition of membranes [5] [12]. The hydrophobicity of membrane fusion proteins and membrane lipid composition dependence of fusion indicate the importance of a detailed knowledge of the hydration state of the phospholipid bilayer. Also, it has been well established that one of the requirements for fusion of membranes is the hydrophobic attraction between the fusing membranes [4] [13] [14] [15]. Much of what we know about the molecular mechanisms of membrane fusion has been obtained from the study of model systems, such as phospholipid vesicles of controlled composition [2] [16].
By using non-bilayer lipids in the early stages of biological membrane fusion and vesicle fusion, it has been shown that the fusion can be either promoted or inhibited [5]. The inhibiting or promoting action of a non-bilayer lipid has been related to its spontaneous curvature [9]. It has been well established that a lipid possessing positive spontaneous curvature, such as lysophosphatidylcholine (LPC), inhibits hemagglutanin (HA) mediated fusion [17] [18]. Although the ability of LPC to inhibit fusion was correlated with its spontaneous curvature, it is not still clear which property of membrane lipid bilayers is altered by the addition of non-bilayer lipids. Chernomordik et al. [17] suggested that one of the possible properties of membrane lipid bilayers that could be altered by addition of non-bilayer lipids might be the hydrophobicity of membrane surfaces [14] [19].
For the last four decades, the spin probe electron paramagnetic resonance (EPR) method has successfully been used to gain insight into the dynamics and structures of biological systems [2] [20] [21]. Recently, the hydrophobic spin probe 2,2,6,6-tetramethyl-piperidin-1-oxyl-4-yl octadecanoate (TEMPO-stearate) has been used to study the physical properties of the interfacial layer of a variety of phospholipid vesicles above the phase transition, in the liquid crystal phase[22]. A detailed picture of the dynamics of the probe and its environment, as well as the hydration state of the interfacial layer of phospholipid vesicles, was constructed from the experimental EPR spectral parameters of high precision. The extraction of EPR spectral parameters with high precision has become possible due to the development of nonlinear spectral fitting [23] [24] [25] [26] [27]. Fitting offers precise resonance field measurements needed to yield precise values of hyperfine spacing, which are then used to estimate the effective water concentration in the polar shell of vesicles [22] [27]. The information on the motion of the spin probe is given by the rotational correlation times that can be found from the Lorentzian EPR linewidths [28]. Even though the Lorentzian linewidths are not directly available from the EPR spectrum of a spin probe due to inhomogeneous broadening caused by unresolved hyperfine structure, the effect of inhomogeneous broadening can now be treated successfully due to the correct knowledge of the EPR lineshape [28]. Although experimental EPR parameters can be obtained from the EPR spectrum using conventional EPR methods; EPR spectral line fitting offers more than one order of magnitude increase in precision, so it is now possible to measure small changes in hydration and rotational correlation times that were before obscured by the experimental error [22].
The objective of this paper is to explore what property of the interfacial layer of phospholipid vesicles is affected by the addition of the fusion inhibitor lysomyristoylphosphatidylcholine (LMPC), as well as how it is affected. In order to answer these questions we will here use two different types of phospholipids: (i) the negatively charged dimyristoyl-phosphatidylglycerol (DMPG) and (ii) the zwitterionic dimyristoyl-phosphatidylcholine (DMPC).
2. Materials and methods
The phospholipids DMPC (1,2-dimyristoyl-sn-glycero-3-phosphocholine) and DMPG (1,2-dimyristoyl-sn-glycero-3-[phospho-rac-(1-glycerol)] (Sodium Salt)), and the lysomyristoylphosphatidylcholine LMPC (1-myristoyl-2-hydroxy-sn-glycero-3-phosphocholine) were purchased from Avanti Polar Lipids (Birmingham, AL) and used as received. The spin label 2,2,6,6-tetramethyl-piperidin- 1-oxyl-4-yl octadecanoate (TEMPO stearate) was obtained from Molecular Probes, Inc. (Eugene, OR). PTFE (PolyTetraFluoroEthylene) tubing was bought from Zeus, Inc. (Orangeburg, SC).
The appropriate amount of TEMPO stearate chloroform solution was added to a given ratio of phospholipid/lysophospholipid powder to produce a molar ratio [lipid/lysolipid]/[spin probe] of 400. The completely clear solution was dried under a stream of N2. Thereafter, the dried films were kept under reduced pressure overnight to guarantee complete absence of chloroform. The phospholipid films were hydrated by the addition of 20 mM Hepes (4-(2-hydroxyethil)-1-piperizineethanesulfonic acid) aqueous solution at pH 7.4 until a 100 mM concentration of lipids was achieved. After 20 min of vortexing, opaque suspensions were obtained. The suspensions were finally transferred into PTFE capillary tubes, whose ends were folded and tightened with parafilm (American National Can, Greenwich, CT).
The experimental equipment and data analysis have been described in more detail previously [22]. Basically, EPR experiments were performed with a Bruker ESP 300 E spectrometer equipped with a Bruker variable temperature unit (Model B-VT-2000). Dispersions were prepared on the day of the experiment, and were placed in a porous PTFE tube to allow for nitrogen equilibration [29], which reduces the broadening of the EPR line caused by molecular oxygen. The temperature of the sample in the microwave cavity was held stable within ±0.2 °C.
Five first harmonic EPR spectra were obtained for each temperature using a sweep time of 84 s; microwave power, 5 mW; time constant, 20.5 ms; sweep width, 50.2 G; modulation amplitude, 1 G. The spectra were then transferred to a personal computer and were analyzed using the computer program Lowfit. As the fit function, the program uses a Lorentzian-Gaussian sum function, which is an excellent approximation of the Voigt shape [23] [28]. The program gives precise values of the EPR line positions, which are used in calculation of the nitrogen hyperfine coupling spacing, A+, which is sensitive to the amount of water in the surroundings of the nitroxide [27] [30]. To use the value of A+ as a measure of effective water concentration, the value of A+ of a nitroxide has to be measured in a series of aqueous mixtures in which the water fraction changes, ideally, from 0 to 100%. The hydration index of each solution mixture [31] defined as the ratio of the molar concentration of OH dipoles in the solution mixture to that of pure water can be calculated using Eq. (5) from Reference [27]. The hyperfine coupling spacing of TEMPO-stearate was measured in a series of mixtures of ethanol–water and ethanol–1,4-dioxane covering the water fraction range from 0 to 80 % (TEMPO-stearate is not water soluble). Since the hydration index is directly proportional to the molar concentration of water in the mixture, the effective water concentration [H2O] can be estimated using the calibration equation [22]:
| (1) |
where 55.345 M is the molar concentration of pure water at 25 °C.
Lowfit also separates the Lorentzian and Gaussian contributions to the observed spin probe lines, so that the Lorentzian linewidth can be used in the calculation of the rotational correlation times [28] [22]. The hydrocarbon chain of TEMPO stearate, which is anchored in the phospholipid bilayer, ensures that the NO· moiety resides in the hydration layer of the membrane which is more fluid than the hydrocarbon bilayer region. Since the nitroxide is attached to a hydrocarbon chain, its preferred axis of rotation is parallel to the hydrocarbon chain, or in terms of the nitroxide principal axis about its x axis, which is along the direction of the N–O [22]. This rotation is characterized by the parallel rotational correlation time τ||. As the nitroxide rotation is axial, the second rotational correlation time τ⊥ is necessary to characterize the rotation perpendicular to the molecular symmetry axis.
For anisotropic rotation which is axially symmetric about the nitroxide x axis, the correlation times τ20 and τ22 are first calculated from the following equations [32]:
| (2) |
| (3) |
where B and C are parameters that are calculated from the Lorentzian linewidths [33] [22], H is the magnetic field, and the hyperfine anisotropies ΔA and δA are given by:
| (4) |
| (5) |
and exactly similar equations for Δg and δg. As explained in Reference [22] the values of the principal components of g and A for TEMPO [34] can be used for TEMPO stearate. Thus, using Axx = 5.3 G, Ayy = 7 G and Azz = 35 G for the principal components of A, and gxx = 2.0099, gyy = 2.0061 and gzz = 2.0024 for the principal components of the g tensorwe get:
| (6) |
| (7) |
Finally, the rotational correlation times τ|| and τ⊥ are given by [32]
| (8) |
| (9) |
3. Results and Discussion
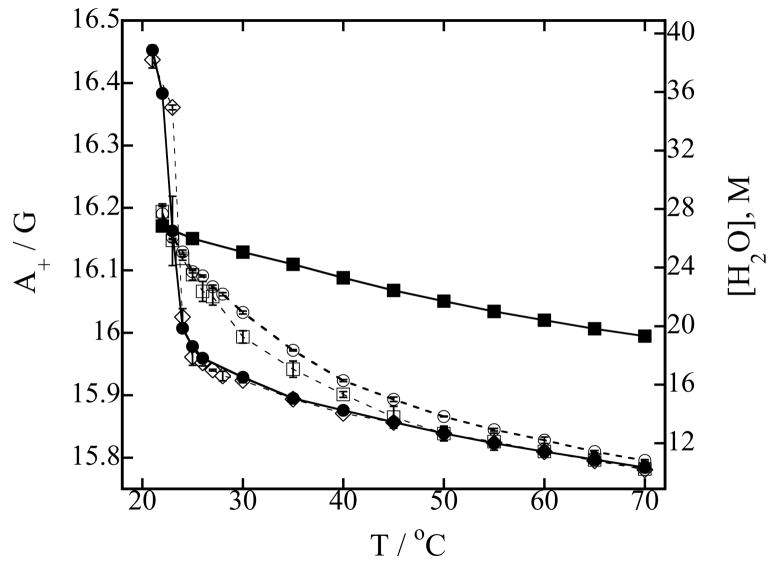
The hyperfine coupling spacing A+ in the polar shell of the vesicle and corresponding effective water concentration [H2O] sensed by TEMPO in pure DMPC vesicles and a series of DMPC vesicles mixed with different concentrations of LMPC as a function of temperature are shown in Figure 1. Also, the same quantities measured in pure LMPC micelles are shown in the same figure. The liquid crystal-gel phase transition of pure DMPC vesicles at about 23 °C is clearly observed. Addition of 1 % of LMPC to the DMPC vesicles does slightly increase the phase temperature, but the hydration properties of the polar shell remain the same. Addition of 10 % or 20 % of LMPC to the DMPC vesicles broadens the phase transition and increases the hydration of the polar shell. The change in hyperfine spacing A+ is biggest at the phase transition and decreases as the temperature increases. At higher temperatures the amount of water in the polar shell is not much affected by LMPC addition. Note that the effective water concentration, especially close to the phase transition, has to be interpreted carefully, since the position of the nitroxide moiety changes across the bilayer during the phase transition as explained in Ref. [22]. As expected, micelles are much more hydrated than vesicles [35].
Figure 1.
(a) Nitrogen hyperfine spacing A+ of 0.2 mM TEMPO-stearate in the presence of 100 mM of phospholipids in Hepes buffer equilibrated with N2 at pH 7.4 (left-hand ordinate) and corresponding effective water concentration [H2O] in the polar shell calculated from Eq. (1) (right-hand ordinate) as a function of temperature. Symbols used to identify the different lysophospholipid-phospholipid concentrations in mixed DMPC-LMPC vesicles are: (○) 20 mM LMPC, 80 mM DMPC; (□) 10 mM LMPC, 90 mM DMPC; (◇) 1 mM LMPC, 99 mM DMPC; (●) 100 mM DMPC (DMPC vesicles) and (■) 100 mM LMPC (LMPC micelles). Error bars are standard deviations of five measurements. Lines are to guide the eyes.
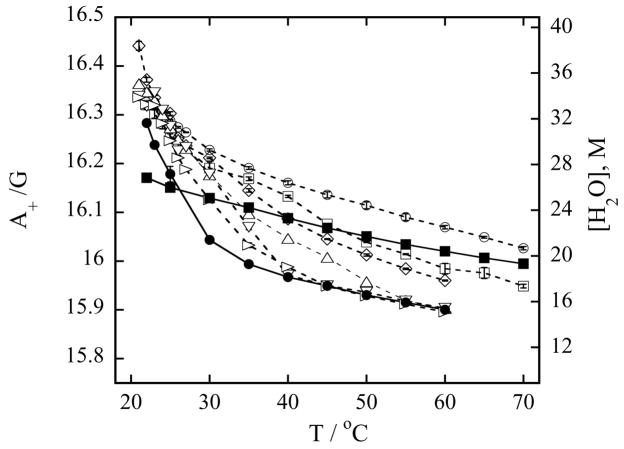
Figure 2 shows the hyperfine coupling spacing A+ in the polar shell of the vesicle and corresponding effective water concentration [H2O] sensed by TEMPO stearate in pure DMPG vesicles and a series of DMPG vesicles mixed with different concentrations of LMPC as a function of temperature. The effect of the zwitterionic LMPC on the negatively charged DMPG is much more pronounced than on the zwitterionic DMPC vesicles. Even a small addition of lysophospholipid to the DMPG vesicles broadens the phase transition and increases the concentration of water in the hydration layer of the vesicle. First, LMPC affects the hydration properties near the phase transition. Next, as the amount of added LMPC increases the effective water concentration increases across all temperatures. At about 10 % of LMPC in the DMPG vesicles, the vesicle interfacial layer becomes as hydrated as the interfacial layer of LMPC micelles. At 20 % LMPC in the DMPG vesicles the water concentration in the interfacial layer of the mixed DMPG-LMPC vesicles is much greater than in the case of pure LMPC micelles. At the physiological temperature of 35 °C, which is well above the phase transition temperature, the water concentration in the polar shell of the vesicles increases by 8.4 M (from 19.29 M to 27.69 M, Table 1) when the mole fraction of LMPC in DMPG vesicles increases by 20 %. On the other hand, the water concentration increase in the polar shell of the DMPC vesicles is only 3.3 M (from 15.06 M to 18.35 M, Table 2) for the same mole fraction increase. At the same time, the water concentration in the polar shell of mixed DMPG-LMPC vesicles is 9.3 M greater than in the polar shell of mixed DMPC-LMPC vesicles.
Figure 2.
(a) Nitrogen hyperfine spacing A+ of 0.2 mM TEMPO-stearate in the presence of 100 mM of phospholipids in Hepes buffer equilibrated with N2 at pH 7.4 (left-hand ordinate) and corresponding effective water concentration [H2O] in the polar shell calculated from Eq. (1) (right-hand ordinate) as a function of temperature. Symbols used to identify the different lysophospholipid-phospholipid concentrations in mixed DMPG-LMPC vesicles are: (○) 20 mM LMPC, 80 mM DMPG; (□) 10 mM LMPC, 90 mM DMPG; (◇) 5 mM LMPC, 95 mM DMPG; (△) 4 mM LMPC, 96 mM DMPG; (▽) 3.5 mM LMPC, 96.5 mM DMPG; (▷) 2 mM LMPC, 98 mM DMPG; (●) 100 mM DMPG (DMPG vesicles) and (■) 100 mM LMPC (LMPC micelles). Error bars are standard deviations of five measurements. Lines are to guide the eyes.
Table 1.
Hyperfine spacing, effective water concentration, and number of water molecules sensed by the spin probe in the polar shell of LMPC micelles, DMPG vesicles and DMPG-LMPC vesicles at 35 °C.
| Mole percentage of LMPC in DMPG vesicles | A+/G | [H2O]/M | ||
|---|---|---|---|---|
| 0 | 15.994 ± 0.006 | 19.29 ± 0.25 | 6.2 (9.0a) | |
| 2 | 16.033 ± 0.005 | 20.95 ± 0.21 | 6.8 | |
| 3.5 | 16.069 ± 0.005 | 22.49 ± 0.21 | 7.3 | |
| 4 | 16.097 ± 0.001 | 23.68 ± 0.04 | 7.6 | |
| 5 | 16.145 ± 0.003 | 25.73 ± 0.13 | 8.3 | |
| 10 | 16.169 ± 0.004 | 26.76 ± 0.17 | 8.6 | |
| 20 | 16.191 ± 0.003 | 27.69 ± 0.13 | 8.9 | |
| 100 | 16.110 ± 0.001 | 24.42 ± 0.04 | 9.8 (10.2b) |
Table 2.
Hyperfine spacing, effective water concentration and number of water molecules sensed by the spin probe in the polar shell of LMPC micelles, DMPC vesicles and DMPC-LMPC vesicles at 35 °C.
Although there is a negative charge on the DMPG headgroup and a sodium counterion in the vicinity of the nitroxide, these charges would produce a negligible direct effect on A+ for a rapidly tumbling NO· group. Small electrical effects can be observed due to charges inherent in the spin probe [36]. Small effects in bulk water are observed due to the charges’ ability to change the water structure [37]. Because the charges are moving randomly with respect to NO·, the first effect is not operable. By changing the nature of the counter ion in micelles; e.g. Li+ for Na+ or Br− for Cl−, the second effect has been shown to be negligible in micelles. Also, the hyperfine coupling spacing of the spin probe DTBN (di-tert-butylnitroxide) in the water in DMPC and DMPG vesicles as a function of NaCl concentration changes negligibly [27]. The small increase in hyperfine coupling spacing can be explained by the fact that Na+ is a marginally strong kosmotrope (water-structure maker) while Cl− is a weak chaotrope (water-structure breaker) [38].
Hydration of the polar shell of phospholipid vesicles is most often expressed in terms of the number of water molecules per phospholipid in the polar shell [39] [40] [41] [42], which can be easily calculated from the structural parameters of the phospholipid. If the average area per lipid A, the thickness of the polar shell h, and the volume of the phospholipid headgroup VL are known, then the number of water molecules per lipid in the polar shell nW is given by [39]:
| (10) |
VW where VW = 30 Å3 is the volume of a water molecule. The number of water molecules sensed by the spin probe can be calculated from the effective water concentration according to the following expression:
| (11) |
where is the number of water molecules in the volume traversed by the spin VSP probe, that is VSP/Vw. The ratio of nW to the number of water molecules in the volume A·h, , has the same form and is given by:
| (12) |
Unfortunately, the volume sampled by the nitroxide, VSP, is not known [37] and the nitroxide’s position slightly changes with temperature, so cannot be known. In other words, the EPR method is unable to separate the effect of the polar shell hydration from the effect of location of TEMPO [22]. Therefore, the absolute values of effective water concentration measured by the EPR method may not be exactly the same as the values in the same systems measured by deuterium nuclear magnetic resonance (2H NMR) [43] [42] and X-ray methods [40] [41]. Nevertheless, the relative effective water concentrations measured by the EPR method and water concentration trends correlate well with other methods, as demonstrated in Ref [22]. To convert molarity into effective number of waters we assume to be equal to . Then, using Eq. (11) and assuming that at 30 °C the polar shell thickness is 9 Å, the average area per lipid is 72.5 Å2 for DOPC and 59.6 Å2 for DMPC, and the volume of the lecithin headgroup is 319 Å3 [44], the effective numbers of water molecules sensed by the spin probe are 7.7 for DOPC ([H2O]DOPC = 19.6 M [22]) and 5.3 for DMPC. These numbers are slightly lower than the numbers measured by X-ray scattering at the same temperature, which are 11.1 for DOPC and 7.2 for DMPC shell [39].
In Tables 1 and 2 we present the effective number of water molecules per lipid in the polar shell of phospholipid vesicles calculated from the measured [H2O]. Although our results qualitatively indicate that the average area per lipid in both DMPC-LMPC and DPMG-LMC vesicles changes, for the purpose of the calculation of the number of water molecules sensed by the spin probe in the polar shell of phospholipid vesicle mixtures we assume that the average area remains the same, because there are no quantitative studies on the structure of DPMC-LMPC and DMPG-LMPC vesicles. To a first approximation this assumption should be reasonable since the molar fraction of LMPC is equal to or less than 20 %, and we just use it so that our measured values expressed in terms of molarity of water can be compared to number of water molecules per lipid measured by other methods. For DMPC-LMPC vesicles we used the same structural parameters as for DMPC vesicles, which implies that LMPC distributes evenly throughout the vesicle above the phase transition. Determining structural properties of fully hydrated vesicles from scattering techniques depends on high positional ordering of membrane components, which very often makes it a difficult task [42]; also fully hydrated negatively charged phospholipid vesicles have been less studied than fully hydrated zwitterionic phospholipid, such as phosphatidylcholine and phosphatidylethanolamine vesicles [44]. As we have do not have the structural data for fully hydrated DMPG vesicles, we will use the fact that the average areas per lipid for dipalmitoyl-phospahtidylcholine and -phosphatidylglycerol vesicles in the solid phase at 20 °C are about the same [45] and assume that the same holds for fully hydrated DMPG vesicles at 35 °C, that is we assume A to be 59.6 Å2. This assumption is supported by a recent work of Pabst et al [46] who found that the value of the lateral area for DPPG in the gel phase of 46.7 ± 0.7 Å2, although slightly smaller, is about the same within experimental error to that of 47.2 ± 0.5 Å2 measured for DPPC [47]. The thickness of the polar shell is 9 Å and the volume of the PG headgroup is 267 Å3, which is calculated using the volumes of the component groups from Table 2 in ref [39]. This value is also in good agreement with the value of 257 ± 10 Å3 measured by Pabst et al [46].
In Tables 1 and 2 we also present a theoretical estimate of the number of water molecules per phospholipid in the polar shell of LMPC micelles. The value was calculated according to the procedure in ref [35], where we assume that an LMPC micelle is, on average, a spherical structure composed of a hydrocarbon core and a hydration polar shell composed of headgroups and water. The radius of the hydrocarbon core rC can be found from the hydrocarbon core volume, which is the product of the aggregation number NA and the volume of one hydrocarbon tail VLMPC-t less 1.55 CH2 groups that may be wetted [48]. Using NA = 120 [35] molecules, VLMPC-t = 418 Å3 and VCH2 = 28.1 Å3 [39] we get the radius of micelle hydrocarbone core, rC = 22 Å. Assuming a thickness of 9 Å, the micelle radius is 31 Å. From these radii we calculated an average area per phospholipid of 74.2 Å2. Now, we can calculate nW and from Eqs. (10) and (11), respectively. Note, that VL should be enlarged by 1.55 VCH2 [35]. As can be seen, in the case of LMPC micelles, the number of water molecules sensed by the spin probe and the number of water molecules per lipid calculated from the structural parameters are very close. Due to the similarity in structure (one hydrocarbon tail and a head), the nitroxide moiety very likely samples a volume which is very close to the volume occupied by PC headgroup in LMPC micelles. This may be a reason for good agreement between the number of water molecules per lipid from the EPR measurement and the one calculated from the structural parameters, Tables 1 and 2.
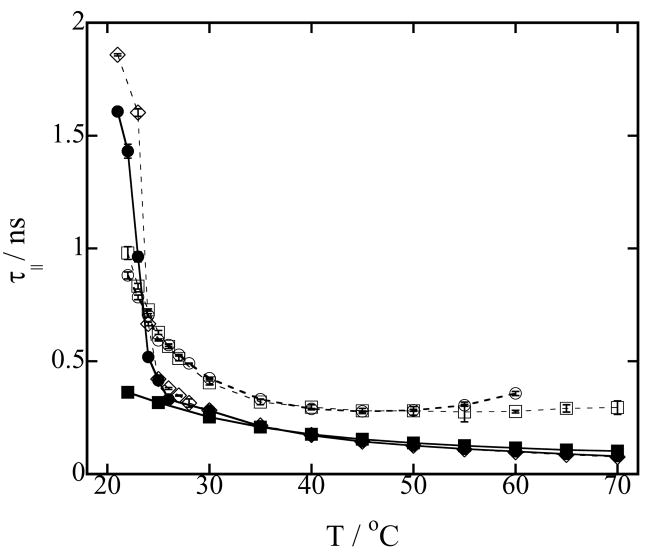
The rotational correlation times τ|| and τ⊥ characterize the axial rotation of the probe, and as such can give us valuable information about the probe’s environment. Figure 3 shows the parallel rotational correlation time τ||, characterizing the rotation about the hydrocarbon chain, for pure LMPC micelles, pure DMPC vesicles and a series of DMPC vesicles mixed with different concentrations of LMPC as a function of temperature. Again, the phase transition of pure DMPC vesicles is well defined. Addition of 1 % of LMPC slightly increases the phase transition temperature, but does not broaden it. Addition of 10 or 20 % of LMPC to the DMPC vesicles broadens the phase transition and increases τ||. Also, above the phase transition, the values of τ|| are the same in both DMPC vesicles and LMPC micelles. This similarity indicates that, although the polar shell of LMPC micelles is more hydrated than the polar shell of DMPC vesicles, the hydrogen bonding structure of water molecules surrounding the spin probe is very similar, so the rotation about the parallel axis is similar.
Figure 3.
(a) Rotational correlation time τ|| of 0.2 mM TEMPO-stearate in 100 mM phospholipid vesicles in Hepes buffer at pH 7.4 as a function of temperature. Symbols used to identify the different lysophospholipid-phospholipid concentrations in mixed DMPC-LMPC vesicles are: (○) 20 mM LMPC, 80 mM DMPC; (□) 10 mM LMPC, 90 mM DMPC; (◇) 1 mM LMPC, 99 mM DMPC; (●) 100 mM DMPC (DMPC vesicles) and (■) 100 mM LMPC (LMPC micelles). Error bars are standard deviations of five measurements. Lines are to guide the eyes.
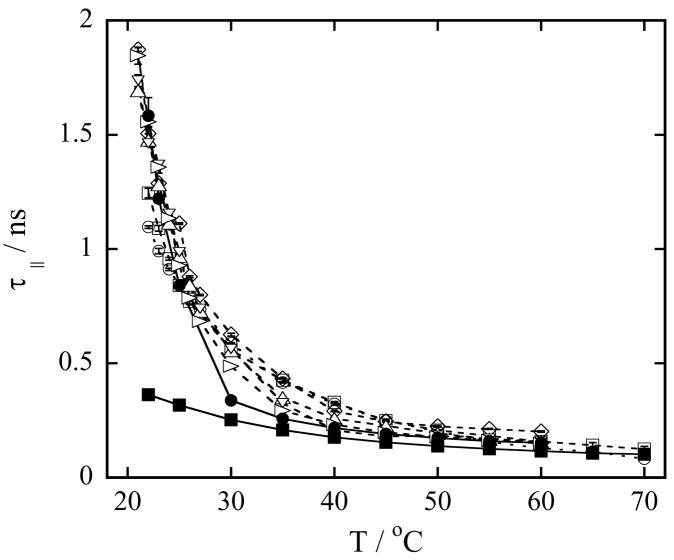
The parallel rotational correlation time τ|| for pure LMPC micelles, pure DMPG vesicles and a series of mixed DMPG-LMPC vesicles as a function of temperature is shown in Figure 4. From Figure 4, it can be observed that above the phase transition temperature the values of τ|| measured in DMPG vesicles are longer than the values of τ|| in LMPC micelles. This difference very likely comes from the increase in the number of hydrogen bonds in the polar shell of DMPG vesicles compared to those in the polar shells of both LMPC micelles and DMPC vesicles [49]. The increased hydrogen bond network slows the cylindrical rotation of the probe [22]. Also, addition of LMPC to the DMPG vesicle increases the parallel rotational correlation time. The greater the fraction of LMPC in the vesicles, the longer is the parallel rotational correlation time.
Figure 4.
(a) Rotational correlation time τ|| of 0.2 mM TEMPO-stearate in 100 mM phospholipid vesicles in Hepes buffer at pH 7.4 as a function of temperature. Symbols used to identify the different lysophospholipid-phospholipid concentrations in mixed DMPG-LMPC vesicles are: (○) 20 mM LMPC, 80 mM DMPG; (□) 10 mM LMPC, 90 mM DMPG; (◇) 5 mM LMPC, 95 mM DMPG; (△) 4 mM LMPC, 96 mM DMPG; (▽) 3.5 mM LMPC, 96.5 mM DMPG; (▷) 2 mM LMPC, 98 mM DMPG; (●) 100 mM DMPG (DMPG vesicles) and (■) 100 mM LMPC (LMPC micelles). Error bars are standard deviations of five measurements. Lines are to guide the eyes.
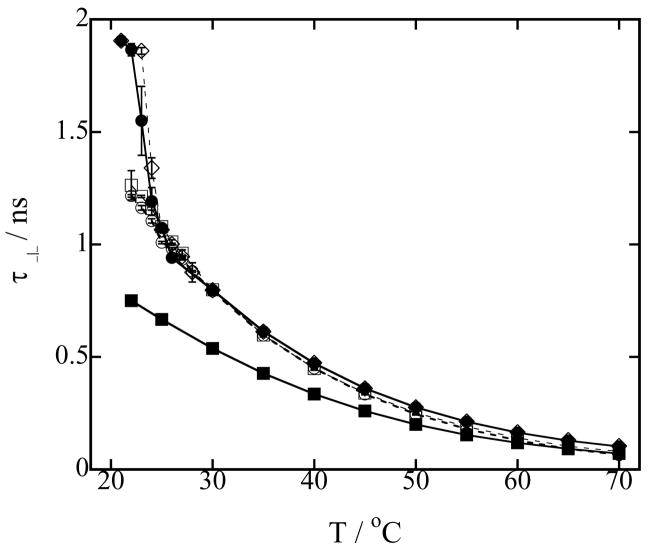
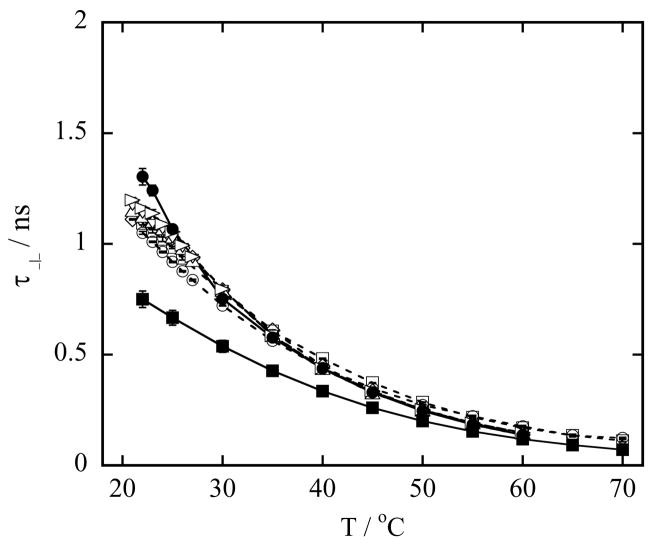
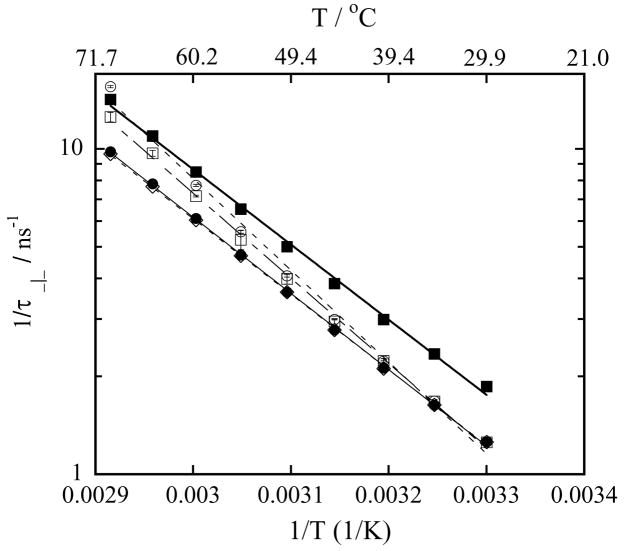
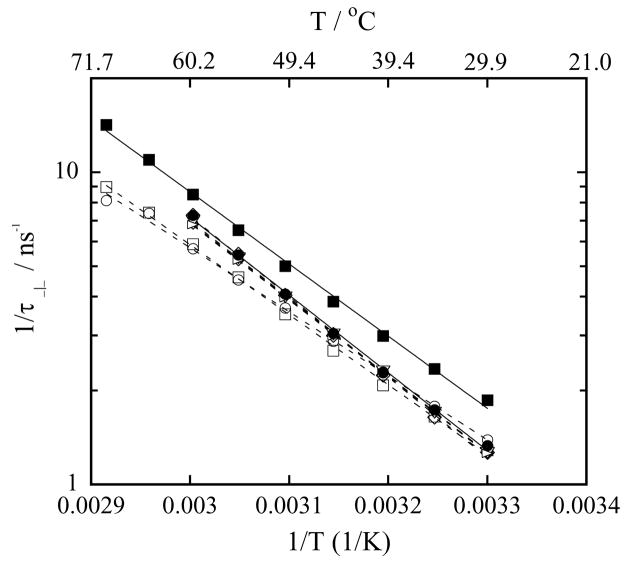
Next, we present the perpendicular rotational correlation time τ⊥, characterizing the rotation of the nitroxide perpendicular to the hydrocarbon chain, for LMPC micelles, DMPC vesicles and a series of mixed DMPC-LMPC vesicles, Figure 5, and LMPC micelles, DMPG vesicles and a series of mixed DMPG-LMPC vesicles, Figure 6, as a function of temperature. As expected, the value of τ⊥ is greater than the value of τ|| for a given temperature, and the value of τ⊥ in the vesicles is longer than in the micelles at all temperatures. Additional information from the τ⊥ data can be extracted if the reciprocal of τ⊥ is displayed as function of the reciprocal of temperature, and then that display is fitted to the Arrhenius equation:
| (13) |
where EA is the activation energy for the perpendicular rotation of TEMPO, and R is the universal gas constant. Since the activation energy across the phase transition is different than in the gel phase, to exclude the effect of phase transition only the temperatures above 30 °C are analyzed. Figures 7 and 8 show values of versus for LMPC micelles, DMPC-LMPC vesicles and DMPG-LMPC vesicles together with their fits to Eq. (13). Values of the activation energies extracted from the fits of the DMPC series are given in Table 3, while the values of EA of the DMPG series are given in Table 4. Values of the correlation coefficients show that the fits are excellent. The values of EA corroborate many of the conclusions drawn from the hyperfine coupling spacing and rotational correlation times data. Firstly, the values of EA for DMPC vesicles and LMPC micelles are similar, 44.9 kJ/mol and 44.2 kJ/mol, respectively. Again, this very possibly indicates the same hydrogen bonding structure in those two polar shells. The value of EA for DMPG vesicles of 47.6 kJ/mol suggests that the rotation of the spin probe TEMPO is more restricted in the polar shell of the negatively charged DMPG vesicles. Secondly, 1% addition of LMPC to the DPMC vesicles does not change the activation energy, while 10 % or 20 % addition of LMPC noticeably increases the activation energy to 50.1 kJ/mol and 53.9 kJ/mol, respectively. The same trend is observed in the τ|| data, Figure 3. As the polar heads are the same and the only difference between LMPC and DMPC is in the hydrocarbon chain, the hydration of the polar shell above 30 °C only negligibly change, Figure 1, while the value of τ|| increases, Figure 3. A likely explanation for this increase might be that at the higher concentrations of LMPC in the DMPC vesicles there is a slightly better packing of the phospholipid molecules. Thirdly, the activation energy for the perpendicular rotation of TEMPO in mixed DMPG-LMPC vesicles decreases with an increasing fraction of LMPC. Although, the value of τ|| increases with an increasing LMPC fraction, indicating stronger hydrogen bonding, the water concentration increase is even greater, Figure 2, which undoubtedly increases the area per phospholipid molecule. Thus, the final result is that the surface of the vesicle becomes less compact, so the barrier to the perpendicular rotation decreases from 47.6 kJ/mol (0 % of LMPC) to 39.3 kJ/mol (20 % of LMPC)
Figure 5.
(a) Rotational correlation time τ⊥ of 0.2 mM TEMPO-stearate in 100 mM phospholipid vesicles in Hepes buffer at pH 7.4 as a function of temperature. Symbols used to identify the different lysophospholipid-lysophospholipid concentrations in mixed DMPC-LMPC vesicles are: (○) 20 mM LMPC, 80 mM DMPC; (□) 10 mM LMPC, 90 mM DMPC; (◇) 1 mM LMPC, 99 mM DMPC; (●) 100 mM DMPC (DMPC vesicles) and (■) 100 mM LMPC (LMPC micelles). Error bars are standard deviations of five measurements. Lines are to guide the eyes.
Figure 6.
(a) Rotational correlation time τ⊥ of 0.2 mM TEMPO-stearate in 100 mM phospholipid vesicles in Hepes buffer at pH 7.4 as a function of temperature. Symbols used to identify the different lysophospholipid-phospholipid concentrations in mixed DMPG-LMPC vesicles are: (○) 20 mM LMPC, 80 mM DMPG; (□) 10 mM LMPC, 90 mM DMPG; (◇) 5 mM LMPC, 95 mM DMPG; (△) 4 mM LMPC, 96 mM DMPG; (▽) 3.5 mM LMPC, 96.5 mM DMPG; (▷) 2 mM LMPC, 98 mM DMPG; (●) 100 mM DMPG (DMPG vesicles) and (■) 100 mM LMPC (LMPC micelles). Error bars are standard deviations of five measurements. Lines are to guide the eyes.
Figure 7.
The reciprocal of rotational correlation time τ⊥ of 0.2 mM TEMPO-Stearate in 100 mM phospholipid vesicles in Hepes buffer at pH 7.4 as a function of the reciprocal of temperature. Symbols used to identify the different lysophospholipid-lysophospholipid concentrations in mixed DMPC-LMPC vesicles are: (○) 20 mM LMPC, 80 mM DMPC; (□) 10 mM LMPC, 90 mM DMPC; (◇) 1 mM LMPC, 99 mM DMPC; (●) 100 mM DMPC (DMPC vesicles) and (■) 100 mM LMPC (LMPC micelles). Solid and dashed lines are exponential fits to the data, Eq. (13).
Figure 8.
The reciprocal of rotational correlation time τ⊥ of 0.2 mM TEMPO-Stearate in 100 mM phospholipid vesicles in Hepes buffer at pH 7.4 as a function of the reciprocal of temperature. Symbols used to identify the different lysophospholipid-phospholipid concentrations in mixed DMPG-LMPC vesicles are: (○) 20 mM LMPC, 80 mM DMPG; (□) 10 mM LMPC, 90 mM DMPG; (◇) 5 mM LMPC, 95 mM DMPG; (△) 4 mM LMPC, 96 mM DMPG; (▽) 3.5 mM LMPC, 96.5 mM DMPG; (▷) 2 mM LMPC, 98 mM DMPG; (●) 100 mM DMPG (DMPG vesicles) and (■) 100 mM LMPC (LMPC micelles). Solid and dashed lines are exponential fits to the data, Eq. (13).
Table 3.
Activation energies of the perpendicular rotational correlation times for LMPC micelles, DMPC vesicles and mixed DMPC-LMPC vesicles, Eq. (13)
| Mole percentage of LMPC in DMPC vesicles | EA kJ/mol | Correlation coefficient |
|---|---|---|
| 0 | 44.9 | 0.9999 |
| 1 | 44.4 | 0.9999 |
| 10 | 50.1 | 0.9994 |
| 20 | 53.9 | 0.9964 |
| 100 | 44.2 | 0.9990 |
Table 4.
Activation energies of the perpendicular rotational correlation times for LMPC micelles, DMPG vesicles and mixed DMPG-LMPC vesicles, Eq. (13).
| Mole percentage of LMPC in DMPG vesicles | EA kJ/mol | Correlation coefficient |
|---|---|---|
| 0 | 47.6 | 0.9992 |
| 2 | 47.0 | 0.9999 |
| 3.5 | 47.7 | 0.9998 |
| 4 | 47.1 | 0.9999 |
| 5 | 49.4 | 0.9995 |
| 10 | 42.9 | 0.9994 |
| 20 | 39.3 | 0.9962 |
| 100 | 44.2 | 0.9990 |
Our data indicate that the average area per lipid in both DMPC and DMPG vesicles is a function of LMPC molar fraction. The decrease in average area per phospholipid in DMPC-LMPC vesicles implies that the small increase in the number of water molecules in the polar shell, Table 2, may be smaller or even go in the opposite direction. On the other hand, the increase in average area per phospholipid in DMPG-LMPC vesicles implies that the increase in the number of water molecules in the polar shell, Table 1, may be even greater. If we assume a change in area of 10%, the difference in terms of number of water molecules is at most two molecules, which would not change the main conclusion suggested by the experimental EPR evidence that the addition of LMPC affects more the hydration of DMPG vesicles than the hydration of DMPC vesicles.
According to our experimental data the structure of the polar shell (hydration layer) of DMPC-LMC vesicles hardly changes, because the polar heads are the same. The hydrocarbon part of the bilayer changes, but it still remains devoid of water. This change mostly affects the dynamics of the chains at the phase transition, that is, the increase in the concentration of LMPC interferes with the cooperative behavior of the hydrocarbon chains. On the other hand, addition of LMPC to the DMPG vesicles produces many more changes. The major change comes from the fact that the phospholipid DMPG is negatively charged and the lysolipid LMPC is zwitterionic, the negative charge located on the phosphate group of DMPG attracts the positive charge on the choline of LMPC. It is very likely that this attraction either pulls the LMPC molecule deeper into the bilayer or changes the conformation of both headgroups [45], so water molecules now can fill the space around the LMPC molecule, and the concentration of water in the polar shell increases as observed in Figure 2. Molecular dynamics simulations of the system could be a good way to study these changes. Also, it is very likely that the LMPC molecule acts as a cone wedge among phospholipid molecules, because its polar head has a greater cross section than the hydrocarbon chain and it is embedded slightly deeper in the bilayer. The cone shape of LPC has been used to explain the inhibition of stalk formation in both fusion of purely phospholipid bilayers and fusion of biological membranes [5]. The increased hydration can also account for part of the inhibitory nature of LMPC, because one of the prerequisites for membrane fusion is the hydrophobic interaction of fusing membranes [4] [13]. Our rotational correlation time results also indicate that the hydrogen bonding structure in the polar changes in both DMPG-LMPC and DMPC-LMPC vesicles.
4. Conclusions
Our experimental data clearly indicate that the addition of lysophosphatidylcholine to the negatively DMPG vesicles increases the hydration of the polar shell, whereas the hydration of the polar shell of the zwitterionic DMPC vesicles does not noticeably change. At 35 °C, addition of 20 mole percent of LMPC to the DMPG vesicles increases the concentration of water in the interfacial layer of DMPG vesicles by 8.4 M, whereas in the case of mixed DMPC-LMPC vesicle the water concentration in the interfacial layer of DMPC vesicles changes only by 3.3 M. The negative charge of DMPG electrostatically attracts the positively charged choline group of the LMPC molecule, either pulling the LMPC molecule deeper into the bilayer or changes the conformation of both headgroups. The space above and around the LMPC molecule is then filled with water molecules, so the concentration of water in the polar shell increases. Due to the presence of negative and positive charges located on DMPC and LMPC molecules, sodium counterions and polar water molecules, the hydrogen bonding structure in the polar shell also changes. The increase in the values of τ|| with an increasing fraction of LMPC in DMPG vesicles indicates that the hydrogen bonding structure becomes stronger. The decrease in activation energy to perpendicular rotation as a function of the LMPC concentration in DMPG vesicles can be explained by an increase in surface area per phospholipid. The inhibitory nature of LMPC in both vesicle and biological fusion comes from the increase in surface hydration, as well as from the dynamic cone shape of LMPC in the phospholipid bilayer. In the case of DMPC molecules, the hydrogen bonding structure strengthens, while the area per phospholipid decreases as a function of LMPC concentration. The slight increase in hydration just above the phase transition likely comes from the change in phospholipid packing.
Acknowledgments
The authors gratefully acknowledge support from NIH Grants 5 S06 GM48680-09 (BLB), 3 S06 GM48680-10S1 (MA and MP) and 2 S06 GM48680-12A1 (MP) One of us (MP) acknowledges discussion with Dr. Georg Pabst during the 48th International Conference on the Bioscience of Lipids, Turku, Finland.
Footnotes
Publisher's Disclaimer: This is a PDF file of an unedited manuscript that has been accepted for publication. As a service to our customers we are providing this early version of the manuscript. The manuscript will undergo copyediting, typesetting, and review of the resulting proof before it is published in its final citable form. Please note that during the production process errors may be discovered which could affect the content, and all legal disclaimers that apply to the journal pertain.
References
- 1.Sowers AE. Cell Fusion. Plenum; New York: 1987. [Google Scholar]
- 2.Cevc G, editor. Phospholipids Handbook. New York: Marcel Dekker; 1993. [Google Scholar]
- 3.White JM. Membrane Fusion. Science. 1992;258:917–924. doi: 10.1126/science.1439803. [DOI] [PubMed] [Google Scholar]
- 4.Arnold K. Cation-Induced Vesicle Fusion Modulated by Polymers and Proteins. In: Lipovsky R, Sackman E, editors. Structure and Dynamics of Membranes: Generic and Specific Interactions. 1B. Amsterdam: Elsevier; 1995. pp. 903–957. [Google Scholar]
- 5.Chernomordik L. Non-Bilayer Lipids and Biological Fusion Intermediates. Chem Phys Lipids. 1996;81:203–213. doi: 10.1016/0009-3084(96)02583-2. [DOI] [PubMed] [Google Scholar]
- 6.Lentz BR, Malinin V, Haque ME, Evans K. Protein Machines and Lipid Assemblies: Current Views of Cell Membrane Fusion. Curr Opin Struct Biol. 2000;10:607–615. doi: 10.1016/s0959-440x(00)00138-x. [DOI] [PubMed] [Google Scholar]
- 7.Lee JK, Lentz BR. Secretory and Viral Fusion May Share Mechanistic Events with Fusion between Curved Lipid Bilayers. Proc Natl Sci USA. 1998;95:9274–9279. doi: 10.1073/pnas.95.16.9274. [DOI] [PMC free article] [PubMed] [Google Scholar]
- 8.Zimmerberg J. How Can Proteolipids be Central Players in Membrane Fusion? Trends Cell Biol. 2001;11:233–235. doi: 10.1016/s0962-8924(01)02003-7. [DOI] [PubMed] [Google Scholar]
- 9.Zimmerberg J, Chernomordik LV. Membrane Fusion. Advan Drug Delivery Rev. 1999;38:197–205. doi: 10.1016/s0169-409x(99)00029-0. [DOI] [PubMed] [Google Scholar]
- 10.Marrink SJ, Mark AE. The Mechanism of Vesicle Fusion as Revealed by Molecular Dynamics Simulations. J Am Chem Soc. 2003;125:11144–11145. doi: 10.1021/ja036138+. [DOI] [PubMed] [Google Scholar]
- 11.Martin I, Epand RM, Ruysschaert JM. Structural Properties of the Putative Fusion Peptide of Fertilin, a Protein Active in Sperm-Egg Fusion, upon Interaction with the Lipid Bilayer. Biochemistry. 1998;37:17030–17039. doi: 10.1021/bi980909i. [DOI] [PubMed] [Google Scholar]
- 12.Shangguan T, Alford D, Bentz J. Influenza Virus-Liposome Lipid Mixing is Leaky and Largely Insensitive to the Material Properties of the Target Membrane. Biochemistry. 1996;35:4956–4965. doi: 10.1021/bi9526903. [DOI] [PubMed] [Google Scholar]
- 13.Helm CA, Isrealachvili JN, McGuiggan PM. Role of Hydrophobic Forces in Bilayer Adhesion and Fusion. Biochemistry. 1992;31:1794–1805. doi: 10.1021/bi00121a030. [DOI] [PubMed] [Google Scholar]
- 14.Ohki S. A Mechanism of Divalent Ion-Induced Phosphatidylserine Membrane Fusion. Biochim Bipohys Acta. 1982;689:1–11. doi: 10.1016/0005-2736(82)90182-1. [DOI] [PubMed] [Google Scholar]
- 15.Rand RP, Parsegian VA. Hydration Forces between Phospholipid Bilayers. Biochim Biophys Acta. 1989;988:351–376. [Google Scholar]
- 16.Lipowsky R, Sackmann E, editors. Structure and Dynamics Of Membranes: From Cells to Vesicles. 1A. Amsterdam: North-Holland; 1995. [Google Scholar]
- 17.Chernomordik LV, Leikina E, Frolov V, Bronk P, Zimmerberg J. An Early Stage of Membrane Fusion Mediated by the Low pH Conformation of Influenza Hemagglutinin Depends upon Membrane Lipids. J Cell Biol. 1997;136:81–93. doi: 10.1083/jcb.136.1.81. [DOI] [PMC free article] [PubMed] [Google Scholar]
- 18.Chernomordik LV, Melikyan GB, Chizmadzhev YA. Biomembrane Fusion: A New Concept Derived from Model Studies Using Two Interacting Planar Lipid Bilayers. Biochim Biophys Acta. 1987;906:309–352. doi: 10.1016/0304-4157(87)90016-5. [DOI] [PubMed] [Google Scholar]
- 19.Ohki S, Arnold K. A Mechanism for Ion-induced Lipid Vesicle Fusion. Colloids Surf. 2000;18:83–97. [Google Scholar]
- 20.Dalton LR, editor. EPR and Advanced EPR Study of Biological Systems. Boca Raton: CRC Press; 1984. [Google Scholar]
- 21.Berliner JL, Reuben J, editors. Spin Labeling: Theory and Applications. New York: Plenum Press; 1989. [Google Scholar]
- 22.Alves M, Peric M. An EPR Study of the Interfacial Properties of Phosphatidylcholine Vesicles with Different Lipid Chain Lengths. Biophys Chem. 2006;122:66–73. doi: 10.1016/j.bpc.2006.02.003. [DOI] [PubMed] [Google Scholar]
- 23.Halpern HJ, Peric M, Yu C, Bales BL. Rapid Quantitation of Parameters from Inhomogeneously Broadened EPR Spectra. J Magn Reson. 1993;A103:13–22. [Google Scholar]
- 24.Smirnov AI, Belford RI. Rapid Quantitation from Inhomogeneously Broadened EPR Spectra by a Fast Convolution Algorithm. J Magn Reson A. 1995;113:65–73. [Google Scholar]
- 25.Bales BL, Peric M. EPR Line Shifts and Line Shape Changes Due to Spin Exchange of Nitroxide Free Radicals in Liquids. J Phys Chem B. 1997;101:8707–8716. doi: 10.1021/jp8093947. [DOI] [PMC free article] [PubMed] [Google Scholar]
- 26.Robinson BH, Mailer C, Reese AW. Linewidth Analysis of Spin Labels in Liquids; I Theory and Data Analysis. J Magn Reson. 1999;138:199–209. doi: 10.1006/jmre.1999.1737. [DOI] [PubMed] [Google Scholar]
- 27.Peric M, Alves M, Bales BL. Precision Parameters from Spin-Probe Studies of Membranes Using a Partitioning Technique. Application to Two Model Membrane Vesicles. Biochim Biophys Acta. 2005;1669:116–124. doi: 10.1016/j.bbamem.2005.01.012. [DOI] [PubMed] [Google Scholar]
- 28.Bales BL. Inhomogeneously Broadened Spin-Label Spectra. In: Berliner JL, Reuben J, editors. Spin Labeling: Theory and Applications. Volume 8, Biological Magnetic Resonance. New York: Plenum; 1989. pp. 77–130. [Google Scholar]
- 29.Plachy WZ, Windrem DA. A Gas-permeable ESR Sample Tube. J Mag Reson. 1977;27:237–239. [Google Scholar]
- 30.Bales BL, Messina L, Vidal A, Peric M, Nascimento OR. Precision Relative Aggregation Number Determinations of SDS Micelles Using a Spin Probe. A Model of Micelle Surface Hydration. J Phys Chem B. 1998;102:10347–10358. [Google Scholar]
- 31.Mukerjee P, Ramachandran C, Pyter RA. Solvent Effects on the Visible Spectra of Nitroxides and Relation to Nitrogen Hyperfine Splitting Constants. Nonempirical Polarity for Aprotic and Hydroxilic Solvents. J Phys Chem. 1982;86:3189–3197. [Google Scholar]
- 32.Marsh D. Experimental Methods in Spin-Label Spectral Analysis. In: Berliner LJ, Reuben J, editors. Spin Labeling Theory and Applications. Volume 8, Bilogical Magnetic Resonance. New York: Plenum; 1989. pp. 255–303. [Google Scholar]
- 33.Schreier S, Polnaszek CF, Smith ICP. Spin Labels in Membranes Problems in Practice. Biochim Biophys Acta. 1978;515:375–436. doi: 10.1016/0304-4157(78)90011-4. [DOI] [PubMed] [Google Scholar]
- 34.Tabak M, Alonso A, Nascimento OR. Single Crystal ESR Studies of a Nitroxide Spin Label. I. Determination of G and A Tensors. J Chem Phys. 1983;79:1176–1184. [Google Scholar]
- 35.Peric M, Alves M, Bales BL. Combining Precision Spin-Probe Partitioning with Time-Resolved Fluorescence Quenching to Study Micelles. Application to Micelles of Pure Lysomyristoylphosphatidylcholine (LMPC) and LMPC Mixed with Sodium Dodecyl Sulfate. Chem Phys Lipids. 2006;142:1–13. doi: 10.1016/j.chemphyslip.2006.02.003. [DOI] [PubMed] [Google Scholar]
- 36.Schwartz RN, Peric M, Smith SA, Bales BL. Simple Test of the Effect of an Electric Field on the 14N-Hyperfine Coupling Constant in Nitroxide Spin Probes. J Phys Chem B. 1997;101:8735–8739. [Google Scholar]
- 37.Malik NA, Smith EA, Symons MCR. Solvation Spectra. 82. Solvent Effects on the Nitrogen-14 Hyperfine Coupling Constants and Spin Exchange Rates for Di-tert-butyl Nitroxide and Peroxylamidisulfonate Ions [(O3S)2NO2−] J Chem Soc Faraday Trans 1. 1989;85:3245–3256. [Google Scholar]
- 38.Collins KD. Sticky Ions in Biological Systems. Proc Nat Acad Sci USA. 1995;92:5553–5557. doi: 10.1073/pnas.92.12.5553. [DOI] [PMC free article] [PubMed] [Google Scholar]
- 39.Nagle JF, Tristram-Nagle S. Structure of Lipid Bilayers. Biochim Biophys Acta. 2000;1469:159–195. doi: 10.1016/s0304-4157(00)00016-2. [DOI] [PMC free article] [PubMed] [Google Scholar]
- 40.Kucerka N, Liu Y, Chu N, Petrache HI, Tristram-Nagle S, Nagle JF. Structure of Fully Hydrated Fluid Phase DMPC and DLPC Lipid Bilayers Using X-Ray Scattering from Oriented Multilamellar Arrays and from Unilamellar Vesicles. Biophys J. 2005;88:2626–2637. doi: 10.1529/biophysj.104.056606. [DOI] [PMC free article] [PubMed] [Google Scholar]
- 41.Kucerka N, Tristram-Nagle S, Nagle JF. Structure of Fully Hydrated Fluid Phase Lipid Bilayers with Monounsaturated Chains. J Membrane Biol. 2005;208:193–202. doi: 10.1007/s00232-005-7006-8. [DOI] [PubMed] [Google Scholar]
- 42.Petrache HI, Dodd SW, Brown MF. Area per Lipid and Acyl Length Distributions in Fluid Phosphatidylcholines Determined by 2H NMR Spectroscopy. Biophys J. 2000;79:3172–3192. doi: 10.1016/S0006-3495(00)76551-9. [DOI] [PMC free article] [PubMed] [Google Scholar]
- 43.Faure C, Bonakdar L, Dufourc EJ. Determination of DMPC Hydration in the Lα and Lβ′ Phases by 2H solid state NMR of D2O. FEBS Lett. 1997;405:263–266. doi: 10.1016/s0014-5793(97)00201-9. [DOI] [PubMed] [Google Scholar]
- 44.Petrache HI, Tristram-Nagle S, Gawrisch K, Harries D, Parsegian VA, Nagle JF. Structure and Fluctuations of Charged Phosphatidylserine Bilayers in the Absence of Salt. Biophys J. 2004;86:1574–1586. doi: 10.1016/S0006-3495(04)74225-3. [DOI] [PMC free article] [PubMed] [Google Scholar]
- 45.Sixl F, Watts A. Interactions between Phospholipid Head Groups at Membrane Interfaces: A Deuterium and Phosphorus Nuclear Magnetic Resonance and Spin-Label Electron Spin resonance Study. Biochemistry. 1982;21:6446–6452. doi: 10.1021/bi00268a020. [DOI] [PubMed] [Google Scholar]
- 46.Pabst G, Danner S, Karmakar S, Deutsch G, Raghunathan VA. On the Propensity of Phospatidylglycerol to Form Interdigitated Phases. Biophys J. 2007;93:513–525. doi: 10.1529/biophysj.106.101592. [DOI] [PMC free article] [PubMed] [Google Scholar]
- 47.Tristram-Nagle S, Zhang R, Suter RM, Worthington CR, Sun WJ, Nagle JF. Measurement of Chain Tilt Angle in Fully Hydrated Bilayers of Gel Phase Lecithins. Biophys J. 1993;64:1097–1109. doi: 10.1016/S0006-3495(93)81475-9. [DOI] [PMC free article] [PubMed] [Google Scholar]
- 48.Ranganathan R, Peric M, Medina R, Garcia U, Bales BL, Almgren M. Size, Hydration, and Shape of SDS/Heptane Micelles Investigated by Time-Resolved Fluorescence Quenching and Electron Spin Resonance. Langmuir. 2001;17:6765–6770. [Google Scholar]
- 49.Pasenkiewicz-Gierula M, Takaoka Y, Miyagawa H, Kitamura K, Kusumi A. Hydrogen Bonding of Water to Phosphatidylcholine in the Membrane As Studied by a Molecular Dynamics Simulation: Location, Geometry, and Lipid-Lipid Bridging via Hydrogen-Bonded Water. J Phys Chem A. 1997;101:3677–3691. [Google Scholar]


