

Abstract
Background and purpose:
Early soluble epoxide hydrolase inhibitors (sEHIs) such as 12-(3-adamantan-1-yl-ureido)-dodecanoic acid (AUDA) are effective anti-hypertensive and anti-inflammatory agents in various animal models. However, their poor metabolic stability and limited water solubility make them difficult to use pharmacologically. Here we present the evaluation of four sEHIs for improved pharmacokinetic properties and the anti-inflammatory effects of one sEHI.
Experimental approach:
The pharmacokinetic profiles of inhibitors were determined following p.o. (oral) administration and serial bleeding in mice. Subsequently the pharmacokinetics of trans-4-[4-(3-adamantan-1-yl-ureido)-cyclohexyloxy]-benzoic acid (t-AUCB), the most promising inhibitor, was further studied following s.c. (subcutaneous), i.v. (intravenous) injections and administration in drinking water. Finally, the anti-inflammatory effect of t-AUCB was evaluated by using a lipopolysaccharide (LPS)-treated murine model.
Key“ results:
Better pharmacokinetic parameters (higher Cmax, longer t1/2 and greater AUC) were obtained from the tested inhibitors, compared with AUDA. Oral bioavailability of t-AUCB (0.1 mg·kg−1) was 68 ± 22% (n = 4), and giving t-AUCB in drinking water is recommended as a feasible, effective and easy route of administration for chronic studies. Finally, t-AUCB (p.o.) reversed the decrease in plasma ratio of lipid epoxides to corresponding diols (a biomarker of soluble epoxide hydrolase inhibition) in lipopolysaccharide-treated mice. The in vivo potency of 1 mg·kg−1 of t-AUCB (p.o.) was better in this inflammatory model than that of 10 mg·kg−1 of AUDA-butyl ester (p.o) at 6 h after treatment.
Conclusions and implications:
t-AUCB is a potent sEHI with improved pharmacokinetic properties. This compound will be a useful tool for pharmacological research and a promising starting point for drug development.
Keywords: bioavailability, efficacy, LC-MS/MS, LPS, murine, oxylipin mediators, pharmacokinetics, sEH inhibitor
Introduction
Epoxyeicosatrienoic acids (EETs) are a group of four physiologically and/or pharmacologically active regioisomers derived from metabolism of arachidonic acid (AA) by cytochrome P450 (Spector et al., 2004). These mediators are vasodilators in various animal models (Carroll et al., 1987a,b; Imig et al., 1995; Pomposiello et al., 2003; Seubert et al., 2007) and play an important role in regulation of blood pressure as well as control and prevention of heart disease (Sarkis and Roman, 2004; Doggrell, 2005; Imig, 2005; Elbekai and El-Kadi, 2006; Seubert et al., 2007). EETs also have potent anti-inflammatory properties mediated through the nuclear factor kappa B (NF-κB) and IκB kinase system (Node et al., 1999; Campbell, 2000; Xu et al., 2006). Metabolism of EETs by soluble epoxide hydrolase (sEH) results in their conversion to the more polar and less active dihydroxyeicosatrienoic acids (DHETs) (Newman et al., 2005; Morisseau et al., 2006b). Thus, stabilizing or increasing the concentration of EETs through inhibition of sEH with sEH inhibitors (sEHIs) is a novel and effective approach to prevention and/or treatment of hypertension (Imig et al., 2002; 2005; Zhao et al., 2002; Imig, 2006), inflammation (Olearczyk et al., 2005; Schmelzer et al., 2005; Smith et al., 2005) and other cardiovascular diseases (Imig, 2005; Davis et al., 2006; Jin et al., 2006; Ng et al., 2006; Schmelzer et al., 2006; Seubert et al., 2006; Xu et al., 2006; Inceoglu et al., 2007). Although treatment with sEHIs reduces blood pressure in several animal models of hypertension, high doses of sEHIs have not been observed to reduce blood pressure in normotensive animals. Interestingly, the same compounds can raise blood pressure in acute hypotension, such as that following treatment with lipopolysaccharide (LPS) (Schmelzer et al., 2005). The anti-hypertensive and anti-hypotensive effects occur by different mechanisms of EET action (Node et al., 1999; Fleming and Busse, 2006). However, stabilization of EETs by sEHI are the same for both treating hypertension and in this study, hypotension.
N,N′-Disubstituted ureas and related compounds lead to the attenuation of the hydrolysis of lipid epoxides in many in vitro and in vivo models at low concentrations (Morisseau et al., 1999; Dorrance et al., 2005; Imig et al., 2005; Schmelzer et al., 2005; Davis et al., 2006; Inceoglu et al., 2006; Olearczyk et al., 2006b; Xu et al., 2006). Early urea-based inhibitors having two hydrophobic substituents on both nitrogen atoms, such as N,N′-dicyclohexylurea (DCU) or N-adamantyl-N′-cyclohexylurea (ACU), are potent sEHIs, but their poor water solubility has limited their use in vivo (Morisseau et al., 1999; 2002). Thus, compounds with a polar functional group(s) on one side of the urea, such as 1-adamantanyl-3-{5-[2-(2-ethoxyethoxy)ethoxy]pentyl]}urea (AEPU), 12-(3-adamantan-1-yl-ureido)-dodecanoic acid (AUDA) and its n-butyl ester (AUDA-BE), were found to have improved water solubility while maintaining their potency (Morisseau et al., 2002; 2006a; Kim et al., 2004; 2005). These three compounds were found to be potent inhibitors of the sEH in several animal models (Dorrance et al., 2005; Schmelzer et al., 2005; 2006; Smith et al., 2005; Olearczyk et al., 2006a).
AUDA and its esters represented improvements in development of sEHIs but retained poor water solubility. They require careful formulation for oral administration and are rapidly metabolized by beta-oxidation. The improved water solubility and high oral availability of AEPU made it a useful compound. In several systems, its biological activity in vivo was greater than that predicted by its potency and blood levels. However, its very rapid cytochrome P450-mediated hydroxylation limits its utility in small animals with a rapid heartbeat. We hypothesized that a long alkyl chain on these inhibitors was metabolically susceptible. Accordingly, the sEHIs with conformationally restricted N,N′-Disubstituted ureas harbouring polar groups were synthesized; they are potent sEHIs having better water solubility and greater in vivo stability (Jones et al., 2006).
In addition to the in vitro potency, the assessment of pharmacokinetic properties and in vivo efficacy are deemed critical for the evaluation of a drug candidate. In this paper, we compare the pharmacokinetic profile of four conformationally restricted sEHIs with high in vitro potency on both murine and human sEHs. In addition to the use of a conformationally restricted group rather than a long chain alkyl group on the 3 position of the urea, we also evaluated a trifluoromethoxyphenyl group to replace the sometimes metabolically labile adamantane in the 1 position of the urea. Trans-4-[4-(3-adamantan-1-yl-ureido)-cyclohexyloxy]-benzoic acid (t-AUCB) and its cis-isomer (c-AUCB) (Hwang et al., 2007), as well as two piperidine-containing inhibitors 1-(1-acetypiperidin-4-yl)-3-adamantanylurea (APAU) and 1-trifluoromethoxyphenyl-3-(1-acetylpiperidin-4-yl) urea (TPAU) (Jones et al., 2006; Hwang et al., 2007) were evaluated in mice following administration by oral gavage (Figure 1). Subsequently, the pharmacokinetics of t-AUCB, the most promising inhibitor, was further determined following s.c. (subcutaneous) or i.v. (intravenous) injections and being provided in the drinking water. Finally, the in vivo efficacy of t-AUCB was evaluated by using a murine model of LPS-challenged inflammation.
Figure 1.
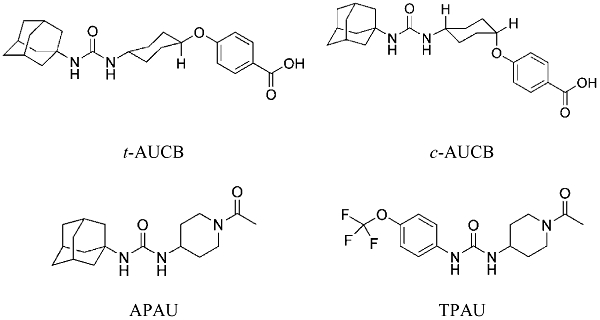
The structures of the inhibitors tested. Chemical names and synonyms of the four compounds are provided in the abbreviations. APAU, 1-(1-acetypiperidin-4-yl)-3-adamantanylurea; c-AUCB, cis-4-[4-(3-adamantan-1-yl-ureido)-cyclohexyloxy]-benzoic acid; t-AUCB, trans-AUCB; TPAU, 1-trifluoromethoxyphenyl-3-(1-acetylpiperidin-4-yl) urea.
Methods
Animals
All animal procedures and experiments were performed according to protocols approved by the Animal Use and Care Committee of University of California-Davis. Mice (male CFW strain, 7 weeks old, 24–30 g; and male C57BL/6 strain, 8 weeks old, 22–25 g) were purchased from Charles River Laboratories.
Determination of in vitro IC50
The in vitro IC50 values of the four inhibitors of human, rat and mouse sEHs were determined by using previously reported methods using cyano(2-methoxynaphthalen-6-yl)methyl(3-phenyloxiran-2-yl)methyl carbonate (CMNPC) as substrate. Human, mouse and rat sEHs were incubated with inhibitors for 5 min in 25 mmol·L−1 Bis-Tris/HCl buffer (200 µL; pH 7.0) at 30°C before addition of the fluorescent substrate (CMNPC; 5 µmol·L−1). In each case, the appropriate affinity purified recombinant enzyme was used (Morisseau et al., 1999; Jones et al., 2005; Morisseau and Hammock, 2007). The rates of formation of the fluorescent product were linear for the duration of the assay. Results are averages of three separate measurements, each based on a range of concentrations both above and below the IC50.
Determination of water solubility
Each inhibitor (3 mg) was suspended in 2 mL of nanopure water in a 4 mL glass vial by strong mixing on a Vortex mixer for 5 min and then followed by sonication for 1 h in a 40°C water bath. The suspension was then shaken at 250 r.p.m. with an L.E.D. orbit shaker (Lab-Line Instruments, Inc. Melrose Park, IL) at room temperature for 2 days. The suspension was allowed to settle for 1 day at room temperature, and then it was centrifuged at 10 956× g for 15 min. An aliquot of supernatant was diluted with methanol (1000–5000-fold) for LC-MS/MS analysis. Each sample was analysed in triplicate.
Pharmacokinetic protocols
Male CFW mice (7 week old, 24–30 g) were used for pharmacokinetic studies. Inhibitors for oral administration were dissolved in triolein or triolein containing 1% ethanol to give a clear solution. For s.c. injection, t-AUCB was dissolved in 100 mmol·L−1 sodium phosphate buffer (pH = 7.4) containing 10% alpha-tocopherol polyethylene glycol succinate and 20% 2-hydroxypropyl-β-cyclodextrin. For i.v. injection, the t-AUCB (dose: 0.1 mg·kg−1) was dissolved in 100 mmol·L−1 sodium phosphate buffer (pH = 7.4). Blood (10 µL) was collected from the tail vein by using a pipette tip rinsed with 7.5% EDTA(K3) at 0, 30, 60, 90, 120, 240, 360, 480 and 1440 min after dosing with the inhibitor. The number of animals in each group was presented in Tables 2, 4 and 5. For the drinking water study, t-AUCB was delivered the drinking water at 4 mg·L−1 containing 0.4% [volume in volume (v/v)] ethanol. Each mouse was housed in a separate cage in order to monitor the daily water and drug intake. Blood (10 µL) was collected daily, and the water intake was recorded. Each blood sample was immediately transferred to a tube containing 50 µL of water and mixed followed by addition of 200 µL of ethyl acetate. After mixing strongly on a Vortex for 1 min, all samples were stored at −80°C until analysis. In a separate previous study, no difference was observed if the ethyl acetate was added before freezing or after thawing.
Table 2.
Pharmacokinetic parameters of sEH inhibitors after oral gavage with a non-compartmental analysis
| Inhibitors (animal number) | Dose (mg·kg−1) | R2a | Tmaxa(min) | Cmaxa(nmol·L−1) | MRTa(min) | TOIC50a(h) |
|---|---|---|---|---|---|---|
| t-AUCBb (n = 4) | 1.0 (2.43e) | 0.5223 ± 0.1043 | 30 ± 0 | 150 ± 23 | 1200 ± 250 | >24 |
| 0.5 (1.21e) | 0.6440 ± 0.0750 | 30 ± 0 | 100 ± 13 | 900 ± 180 | >24 | |
| 0.1 (0.24e) | 0.4125 ± 0.2045 | 40 ± 15 | 30 ± 5 | 900 ± 190 | 2 ± 0 | |
| c-AUCBb (n = 4) | 1.0 (2.43e) | 0.3073 ± 0.3273 | 40 ± 15 | 55 ± 11 | 2000 ± 800 | >24 |
| 0.5 (1.21e) | 0.3898 ± 0.1594 | 30 ± 0 | 30 ± 3 | 1800 ± 400 | >24 | |
| 0.1 (0.24e) | 0.6367 ± 0.2821 | 40 ± 15 | 3.6 ± 0.3 | 240 ± 30 | 0 | |
| APAUb (n = 4) | 1.0 (3.12e) | 0.3596 ± 0.1056 | 30 ± 0 | 53 ± 28 | 1300 ± 500 | 8 ± 0 |
| 0.5 (1.56e) | 0.5095 ± 0.2606 | 60 ± 14 | 30 ± 6 | 900 ± 200 | 5.5 ± 2.4 | |
| 0.1 (0.31e) | 0.3548 ± 0.1024 | 200 ± 90 | 25 ± 15 | 1400 ± 700 | 0.6 ± 0.6 | |
| TPAUb (n = 4) | 1.0 (2.90e) | 0.4410 ± 0.4074 | 280 ± 150 | 273 ± 8 | 1900 ± 1000 | 21 ± 1 |
| 0.5 (1.45e) | 0.5516 ± 0.3719 | 230 ± 200 | 80 ± 8 | 1000 ± 1300 | 0 | |
| 0.1 (0.29e) | 0.4992 ± 0.2874 | 260 ± 220 | 30 ± 1 | 380 ± 10 | 0 | |
| AUDAc (n = 3) | 5.0 (12.7e) | 0.7980 | 42 ± 12 | 66 ± 31 | 550 ± 160 | 1.5 |
| AUDA-BEc,d (n = 3) | 5.0 (11.15e) | 0.8143 | 60 | 100 | 480 | 2.5 |
APAU, 1-(1-acetypiperidin-4-yl)-3-adamantanylurea; AUDA, 12-(3-adamantan-1-yl-ureido)-dodecanoic acid; AUDA-BE, 12-(3-adamantan-1-yl-ureido)-dodecanoic acid butyl ester; c-AUCB, cis-4-[4-(3-adamantan-1-yl-ureido)-cyclohexyloxy]-benzoic acid; sEH, soluble epoxide hydrolase; t-AUCB, trans-AUCB; TPAU, 1-trifluoromethoxyphenyl-3-(1-acetylpiperidin-4-yl) urea.
R2 is the square of the correlation coefficient between predicted and observed value; Tmax, time of maximum concentration; Cmax, the maximum blood concentration; MRT, mean residence time; and TOIC50, time of blood concentration over IC50. Additional pharmacokinetic parameters with non-compartmental model are presented in Table S4.
Data represent the mean ± s.d. of four mice; 10 ul of blood was collected from the tail vein of mice at 0, 30, 60, 90, 120, 240, 360, 480 and 1440 min after dosing with the inhibitors.
Data represent the mean ± s.d. or mean of three mice from previous work (Watanabe et al., 2006; Kim et al., 2007).
AUDA is the predominant metabolite with little or none of the parent ester detected in the blood, thus the parameters were calculated on the basis of the blood concentration of AUDA.
The dose expressed as µmol·kg−1.
Table 4.
Pharmacokineticparameters of t-AUCB (Trans-4-[4-(3-adamantan-1-yl-ureido)-cyclohexyloxy]-benzoic acid) after s.c. injection with non-compartmental analysis
| Dose (mg·kg−1) (animal number) | R2a | Tmaxa(min) | Cmaxa(nmol·L−1) | MRTa(min) | TOIC50a(h) |
|---|---|---|---|---|---|
| 10 (24.25b, n = 3) | 0.6791 ± 0.0528 | 40 ± 14 | 3600 ± 1100 | 70 ± 20 | 8 |
| 3 (7.28b, n = 3) | 0.8590 ± 0.0908 | 60 ± 0 | 2700 ± 2700 | 79 ± 9 | 8 |
| 1 (2.43b, n = 3) | 0.8928 ± 0.0338 | 40 ± 14 | 245 ± 70 | 110 ± 20 | 4 |
Data represent the mean ± s.d. of three mice; 10 µL of blood was collected from the tail vein of mice at 0, 30, 60, 90, 120, 240, 360, 480 and 1440 min after dosing with the inhibitor.
R2 is the square of the correlation coefficient between predicted and observed values; Tmax, time of maximum concentration; Cmax, maximum concentration; MRT, mean residence time; λz, elimination rate constant; Vd, apparent volume distribution; TOIC50, the time of blood concentration over IC50. Additional pharmacokinetic parameters are presented in Table S6.
The dose expressed as µmol·kg−1.
Table 5.
Pharmacokinetic parameters of t-AUCB (Trans-4-[4-(3-adamantan-1-yl-ureido)-cyclohexyloxy]-benzoic acid) following i.v. injection by 2-compartment analysis
| Pharmacokinetic parameters | Units | Valuesa |
|---|---|---|
| AICb | – | 64.5 ± 4.6 |
| Corrb | – | 0.9650 ± 0.01400 |
| t1/2αb | min | 70 ± 30 |
| t1/2βb | min | 600 ± 120 |
| Cl**b | L·h−1·kg−1 | 0.7 ± 0.1 |
| AUCtb | µmol·L−1·min | 22 ± 4 |
| Vdssb | L·kg−1 | 17 ± 7 |
Data represent average ± s.d of three mice. The dose treated was 0.1 mg·kg−1 (0.24 µmol·kg−1); 10 µL of blood was collected from the tail vein of mice at 0, 30, 60, 90, 120, 240, 360, 480 and 1440 min after dosing with the inhibitors.
AIC, Akaike information criterion; AUCt, area under the concentration–time curve to terminal time; Corr, correlation coefficient between observed values and predicted values; t1/2α,half life of distribution phase; t1/2β,half life of elimination phase; Cl, clearance; Vdss, volume distribution at steady state; The pharmacokinetic parameters with a non-compartmental model are presented in Table S4.
Preparation of blood samples for the pharmacokinetic study
The extraction of sEHIs from blood was performed by a slight modification of a previous method (Watanabe et al., 2006). Specifically, surrogate solution [10 µL, 250 ng of 1-(5-butoxypentyl)-3-adamantylurea (BPAU) in 1 mL of methanol] was added to each thawed blood sample. Samples were mixed on a Vortex mixer for 1 min followed by centrifugation at 10 956 × g for 5 min. The supernatant was transferred to a new tube, and the residue was extracted with a second 200 µL of ethyl acetate. The supernatants were then combined, and the mixture was evaporated to dryness by using a centrifugal vacuum concentrator. Finally, 50 µL of internal standard solution [100 ng·mL−1 of 1-adamantanyl-3-decylurea (ADU) in methanol] was used to reconstitute the residue for LC-MS/MS analysis. The internal standard ADU was used to analyse the surrogate's recovery and monitor the instrument response, which varied slightly varying from run to run. Here the surrogate standard BPAU was a chemically similar compound to the four tested sEHIs, but not present in the blood samples. The recovery of BPAU was used to monitor the gross sample processing errors. The recovery is determined by comparing the measured concentration with the amount added to the sample. The use of both a surrogate that monitors sample work-up from extraction and an internal standard that monitors actual analytical conditions provides tight control of the process and facilitates rapid trouble-shooting. Only slight differences were observed in the accuracy of interest analytes between the treatments with addition of the surrogate (BPAU) prior to and after addition of ethyl acetate by calibration with interest analytes spike.
Analysis of sEH inhibitors in blood samples
The blood concentration of sEHIs was determined by using a UPLC-MS/MS method, which was validated to assure acceptable accuracy and precision (accuracy more than 95% with RSD less than 10%). Specifically, chromatographic separation was performed on an ACQUITY ultra performance liquid chromatography (UPLC) instrument equipped with a 2.1 × 50 mm ACQUITY UPLC BEH C18 1.7 µm column (Waters, Milford, MA) held at 25°C. The solvent system consisted of water/acetonitrile/formic acid (899/100/1 v/v, solvent A) and acetonitrile/water/formic acid (899/100/1 v/v; solvent B). The gradient was begun at 30% solvent B and was gradually increased in a linear manner to 100% solvent B in 5 min. This was maintained for 3 min, then returned to 30% solvent B in 2 min. The flow rate was 0.4 mL·min−1. The injection volume was 5 µL, and the samples were kept at 4°C in the auto sampler. Analytes were detected by positive mode electrospray ionization tandem quadrupole mass spectrometry in multiple reaction-monitoring mode (MRM) on a Quattro Premier Mass Spectrometer (Waters, Milford, MA). The flow rate of nitrogen gas was fixed for the cone gas flow of 50 L·h−1 and the desolvation gas flow of 650 L·h−1. Electrospray ionization was performed with a capillary voltage set at 1.00 kV and an extractor fixed at 3.0 V. The source temperature was set at 120°C and the desolvation temperature at 300°C respectively. Collision gas (argon) was set at 3.0 × 10⁻³ Torr. Cone voltage and collision voltage were optimized by acquisition of precursor and production ions respectively. The precursor and dominant daughter ions were used to set up the transition monitored in the MRM mode (See supporting information, Table S1).
Pharmacokinetic analysis
The pharmacokinetic parameters of individual mice were first calculated by fitting the time dependent curve of blood concentration data to a non-compartmental analysis with the WinNonlin software (Pharsight, Mountain View, CA). Further, the pharmacokinetic parameters of individual mice were calculated with 1- or 2-compartment analyses with WinNolin software. A first order absorption model was used for s.c. and p.o. (oral) administration, and an i.v.-bolus model was used for i.v. injection respectively. The compartmental model used was selected by comparison of Akaike information criterion (AIC) and/or the correlation coefficient between the observed values and predicted values from different compartmental models. The model associated with the smallest AIC is regarded as giving the best fit. Parameters estimated include the elimination rate constant (λz), time of maximum concentration (Tmax), maximum concentration (Cmax), half life (t1/2), half life of distribution phase (t1/2α), half life of elimination phase (t1/2β), area under the concentration–time curve extrapolated to infinity (AUCi), area under the concentration–time curve to terminal time (AUCt), clearance (Cl), apparent volume distribution (Vd), volume distribution at steady state (Vdss), the mean residence time (MRT) and the time of blood concentration over IC50 (TOIC50). AUCt was calculated by the linear/log trapezoidal rule.
Evaluation of the in vivo efficacy of t-AUCB
C57BL/6 mice were used in all treatments. Four animals were assigned at random to each group. t-AUCB or AUDA-butyl ester (AUDA-BE) were given by oral gavage immediately after i.p. (intraperitoneal) injection of LPS (10 mg·kg−1) in saline. Mice receiving oral gavage of triolein after i.p. injection of LPS or saline served as positive and negative controls respectively. Mice were killed 6 h after treatment. Blood was collected by cardiac puncture by using an EDTA-rinsed syringe. In order to stabilize the oxylipins, 10 µL combinations of antioxidants (EDTA (0.2 mg·L−1), butylated hydroxytoluene (0.2 mg·L−1), triphenyphosphine (2 mg·L−1)) and the non-selective cyclooxygenase inhibitor indomethacin (2 mg·L−1) in MeOH/H2O (1/1, v/v) were added to each collection tube. Each sample was centrifuged immediately at 685 × g for 10 min, and the plasma was separated. All samples were stored at −80°C until analysis. Blood pressure was determined 4 h after treatment with non-invasive tail cuff methods by using a Visitech BP-2000 (Visitech Systems, Apex, NC) (Schmelzer et al., 2005).
Plasma sample preparation for the analysis of oxylipin profiling
Aliquots of plasma (250 µL) were spiked with a set of odd chain length analogues and deuterated isomers of several target analytes including hydroxyeicosatetraenoic acids (HETEs), prostaglandins, thromboxanes, epoxides [epoxyoctadecamonoeneoic acids (EpOMEs) and EETs] and diols [dihydroxy octadecamonoeneoic acids (DHOMEs) and DHETs] contained in 10 µL of methanol, and then were extracted by solid phase extraction by using Oasis HLB cartridges (Waters, Milford, MA). The HLB columns (1 cc, 60 mg) were washed with 2 mL methanol and pre-conditioned with 2 mL water/methanol/acetic acid (95/5/0.1, v/v). Samples were then mixed with 250 µL of the pre-conditioning solution and loaded onto the column. The loaded column was then washed with 2 mL of the pre-conditioning solution and then dried for 5 min in vacuo. Target analytes were then eluted with 2 mL of ethyl acetate. The collected eluents were evaporated to dryness by using a centrifugal vacuum concentrator and re-dissolved in 50 µL of methanol containing internal standards (Table S2). The spiked samples were vigorously mixed with a Vortex mixer for 1 min, centrifuged at 10 956 × g for 5 min and then transferred to analytical vials containing 150 µL inserts for analysis.
Analysis of oxylipin profiling
The oxylipin profiling was performed by using a modification of previously published methods (Newman et al., 2002; Luria et al., 2007). The separation of plasma oxylipins was conducted in a Shimadzu LC-10ADVP instrument (Shimadzu Corp., Kyoto, Japan) equipped with a 2.1 mm × 150 mm Pursuit XRs-C18 5 µm column (Varian Inc, Palo Alto, CA) held at 40°C. A gradient of water containing 0.1% acetic acid (v/v, solvent A) and acetonitrile/methanol/acetic acid (800/150/1, v/v; solvent B) was used to elute the column with the flow rate of 0.4 mL·min−1 (Table S3). The injection volume was 20 µL, and the samples were kept at 4°C in the auto sampler. Analytes were detected by negative mode electrospray ionization tandem quadrupole mass spectrometry in MRM mode on a Quattro Ultima Mass Spectrometer (Micromass, Manchester, UK). Nitrogen gas flow rates were fixed with the cone gas flow of 50 L·h−1 and the desolvation gas flow of 750 L·h−1. Electrospray ionization was performed with a capillary voltage set at 3.20 kV and an extractor fixed at 3.0 V. The source temperature was set at 125°C and the desolvation temperature at 400°C respectively. Collision gas argon was set at 3.0 × 10⁻³ Torr. Cone voltage and collision voltage were optimized by acquisition of precursor and production ions respectively. The precursor and dominant daughter ions were used to set up the transition monitored in the MRM mode (Table S2).
Statistical analysis
All results were expressed as mean ± s.d. unless other noted. The experimental results of in vivo efficacy study were analysed by anova by using the software spss 10.0 (SPSS Inc., Chicago, IL) with P < 0.05 as the significance level.
Materials
Methanol, acetonitrile, ethyl acetate and ethanol were purchased from Fisher Scientific (Pittsburgh, PA). Formic acid, acetic acid and LPS (Escherichia coli serotype 0111:B4) were purchased from Sigma-Aldrich (St. Louis, NJ). EDTA(K3) was purchased from Tyco Health Group LP (Mansfield, MA). Water (>18.0 MΩ) was purified by a NANO pure system (Barnstead, Newton, MA). All the sEHIs used in this study were synthesized in our laboratory, and their structures and purity were supported by chromatographic and spectral analysis (TLC, MS, NMR and LC-MS). The abbreviations and/or nomenclature of chemicals conform with the BJP's guide to Receptors and Channels (Alexander et al., 2008).
Results
In vitro inhibitory activity and water solubility of four sEH inhibitors
As shown in Table 1, c- and t-AUCBs were of similar in vitro potency to AUDA while APAU and TPAU were somewhat less potent. Compared with AUDA and AUDA-BE, all four compounds had significantly better water solubility, suggesting that these new sEHIs would be easier to formulate and would have higher oral bioavailability.
Table 1.
In vitro activity and water solubility of the sEH inhibitors
| Inhibitors |
IC50 (nmol·L−1) |
Water solubility (mg·L−1) | ||
|---|---|---|---|---|
| Human sEH | Mouse sEH | Rat sEH | ||
| t-AUCB | 1.3 ± 0.1 | 8 ± 1 | 8 ± 1 | 160 ± 20 |
| c-AUCB | 0.9 ± 0.1 | 4 ± 0.5 | 7 ± 1 | 220 ± 2 |
| APAU | 7.0 ± 0.5 | 9 ± 1 | 6 ± 0.5 | 310 ± 60 |
| TPAU | 12 ± 1 | 97 ± 8 | 79 ± 6 | 73 ± 9 |
| AUDA | 3.0 ± 0.5 | 10 ± 1 | 11 ± 2 | 29 ± 5 |
| AUDA-BE | 0.8 ± 0.2 | 4 ± 1 | 5 ± 1 | 5a |
Data represent mean ± s.d. (n = 3).
Human, mouse and rat sEHs were incubated with inhibitors for 5 min in 25 mmol·L−1 Bis-Tris/HCl buffer (200 µL; pH 7.0) at 30°C before addition of fluorescent substrate [cyano(2-methoxynaphthalen-6-yl)methyl(3-phenyloxiran-2-yl)methyl carbonate; 5 µmol·L−1]. Results in the table are averages of three separate measurements each based on multiple concentrations both above and below the IC50.
APAU, 1-(1-acetypiperidin-4-yl)-3-adamantanylurea; AUDA, 12-(3-adamantan-1-yl-ureido)-dodecanoic acid; AUDA-BE, 12-(3-adamantan-1-yl-ureido)-dodecanoic acid butyl ester; c-AUCB, cis-4-[4-(3-adamantan-1-yl-ureido)-cyclohexyloxy]-benzoic acid; sEH, soluble epoxide hydrolase; t-AUCB, trans-AUCB; TPAU, 1-trifluoromethoxyphenyl-3-(1-acetylpiperidin-4-yl) urea.
Value is from Kim et al. (2007).
Pharmacokinetic profile of the four inhibitors following oral administration
The use of both an internal standard (DCU) and a surrogate standard (BPAU) in the analytical procedure for the sEHIs in blood resulted in data with high accuracy (more than 95%) and precision (RSD ≤ 10%). The recovery of the surrogate standard BPAU for each extracted sample was more than 85%, indicating high extraction efficiency and minimal loss in transfer. Figure 2 illustrated the blood concentration following oral administration throughout the complete time course (1440 min) for all four inhibitors. As expected, large variations (RSD up to 180%) were observed at most time points between individuals. Interestingly, t-AUCB (Figure 2A) had far higher blood concentrations than the corresponding cis-isomer (Figure 2B). In the case of the compounds containing a piperidine group, the replacement of an adamantyl group (APAU, Figure 2C) with a trifluoromethoxyphenyl group (TPAU, Figure 2D) resulted in higher blood concentrations. These results suggested that the pharmacokinetic properties can be easily affected by a minor structural change and that there is some metabolic lability to the adamantane.
Figure 2.
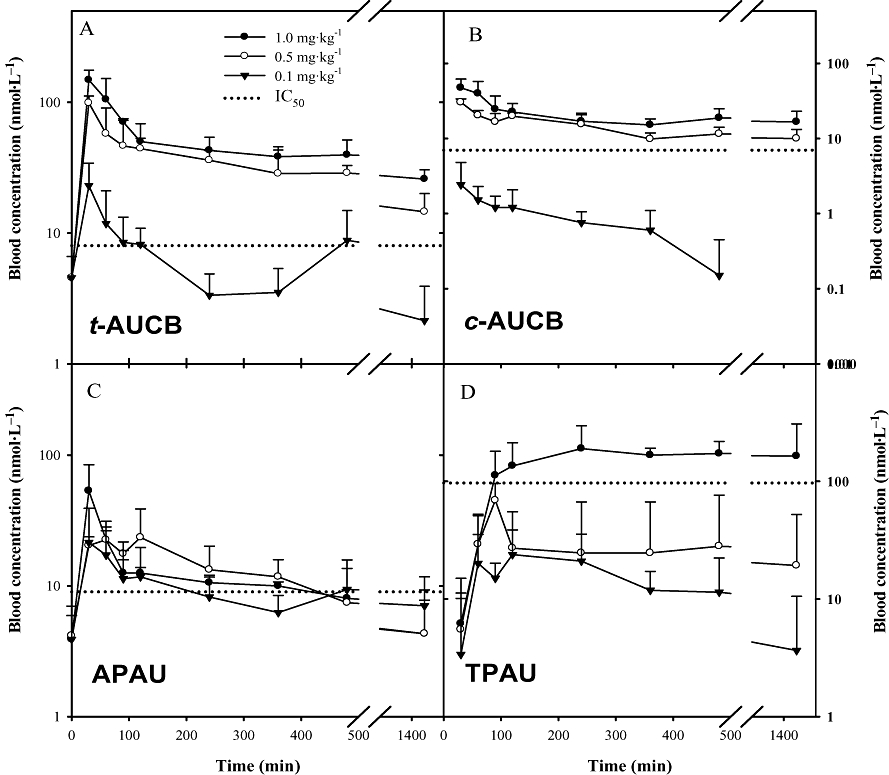
Blood concentration–time course of four inhibitors after administration by oral gavage to mice. (A) t-AUCB, (B) c-AUCB, (C) APAU and (D) TPAU. Each point represents the mean ± s.d. of four mice plotted in a log/linear scale. Blood was collected from the tail vein of mice at 0, 30, 60, 90, 120, 240, 360, 480 and 1440 min after dosing with the inhibitors respectively. The dotted line represents the IC50 of the respective inhibitor with the murine soluble epoxide hydrolase. APAU, 1-(1-acetypiperidin-4-yl)-3-adamantanylurea; c-AUCB, cis-4-[4-(3-adamantan-1-yl-ureido)-cyclohexyloxy]-benzoic acid; t-AUCB, trans-AUCB; TPAU, 1-trifluoromethoxyphenyl-3-(1-acetylpiperidin-4-yl) urea.
Table 2 summarizes the pharmacokinetic parameters on the basis of non-compartmental analysis. R2 was used to evaluate the correlation between the observed and predicted values. Overall, even at a dose of 1 mg·kg−1, blood levels and pharmacokinetic parameters obtained from the four tested inhibitors were better than those obtained from AUDA and AUDA-BE at 5 mg·kg−1 doses. Tmax and Cmax roughly reflect the average rate of inhibitor absorption. Except for TPAU, the Cmaxs of the other three inhibitors were above their in vitro IC50s for the murine sEH at all three investigated doses. For these three compounds, their Tmaxs occurred at approximately 30 min, suggesting these compounds are rapidly absorbed. However, TPAU had a Cmax higher than its IC50 for the murine sEH only at the highest tested dose, and its Tmax was almost 4 h for all three doses, suggesting that this derivative is more slowly absorbed. The relatively poor in vitro inhibition of murine sEH and the large inter-individual variations in blood levels made TPAU less desirable for use in murine disease models. However, it should be noted that TPAU had desirable properties in other species including primates.
A 2-compartment model is the best fit model for t-AUCB and c-AUCB, while a 1-compartment model is the best one for APAU and TPAU on basis of comparison of AICs and the correlation coefficients between observed and predicted values. Table 3 summarizes AUCs and t1/2s of the inhibitors from 1- or 2-compartment model analyses. AUC is used to evaluate the systemic exposure of inhibitors. The large AUCs of the four novel inhibitors were most likely due to improved absorption and/or slow elimination. Replacing the metabolically susceptible long alkyl chain in AUDA with a conformationally restricted group as in APAU as well as in c- and t-AUCB resulted in longer terminal t1/2s. The same conclusion was supported by the average time of inhibitors residing in the body (MRT).
Table 3.
Key pharmacokinetic parameters of t-AUCB and c-AUCB following p.o. or s.c. administration with 1- or 2-compartment analysis
| Inhibitors | Dose (mg·kg−1) | Compartmental(s) | AICa | Corra | AUCta(µmol·L−1min) | t1/2αa(min) | t1/2βa(min) | t 1/2a(min) |
|---|---|---|---|---|---|---|---|---|
| t-AUCBd (p.o.) | 1.0 (2.43g) | 2 | 60.7 ± 10.0 | 0.9894 ± 0.0086 | 155 ± 50 | 15 ± 10 | >1440b | – |
| 0.5 (1.21g) | 2 | 56.1 ± 9.0 | 0.9913 ± 0.0050 | 60 ± 35 | 30 ± 10 | 1100 ± 500c | – | |
| 0.1 (0.24g) | 2 | 60.1 ± 10.0 | 0.8660 ± 0.1064 | 15 ± 5 | 20 ± 8 | >1440b | – | |
| c-AUCBd (p.o.) | 1.0 (2.43g) | 2 | 32.2 ± 12.9 | 0.9972 ± 0.0014 | 55 ± 3 | 30 ± 20 | >1440b | – |
| 0.5 (1.21g) | 2 | 57.9 ± 18.1 | 0.9648 ± 0.0020 | 30 ± 10 | 40 ± 30 | >1440b | – | |
| 0.1 (0.24g) | 2 | 22.6 ± 12.6 | 0.9076 ± 0.0355 | 2 ± 1 | 45 ± 15 | 180 ± 40 | – | |
| APAUd (p.o.) | 1.0 (3.12g) | 1 | 62.0 ± 1.1 | 0.7522 ± 0.2110 | 12 ± 7 | – | – | 310 ± 250 |
| 0.5 (1.56g) | 1 | 56.0 ± 6.8 | 0.8305 ± 0.0974 | 11 ± 5 | – | – | 180 ± 80 | |
| 0.1 (0.31g) | 1 | 48.9 ± 8.8 | 0.6732 ± 0.2152 | 9 ± 1 | – | – | 560 ± 490 | |
| TPAUd (p.o.) | 1.0 (2.90g) | 1 | 78.9 ± 14.2 | 0.9533 ± 0.0371 | 390 ± 180 | – | – | 1440h |
| 0.5 (1.45g) | 1 | 72.3 ± 7.1 | 0.7593 ± 0.1462 | 48 ± 40 | – | – | 800i | |
| 0.1 (0.29g) | 1 | 48.3 ± 8.2 | 0.9214 ± 0.0481 | 11 ± 5 | – | – | 240 | |
| t-AUCBd (s.c.) | 10.0 (24.25) | 1 | 123.3 ± 7.7 | 0.9753 ± 0.0156 | 320 ± 90 | – | – | 75 ± 55 |
| 3.0 (7.28g) | 1 | 91.7 ± 11.6 | 0.9616 ± 0.0373 | 100 ± 40 | – | – | 85 ± 35 | |
| 1.0 (2.43g) | 1 | 80.7 ± 4.5 | 0.9761 ± 0.0003 | 25 ± 10 | – | – | 60 ± 40 | |
| AUDAe (p.o.) | 5.0 (12.7g) | 2 | 52.2 | 0.9916 | 24 | 13 | 575 | |
| AUDA-BEe,f (p.o.) | 5.0 (11.15g) | 2 | 58.0 | 0.9956 | 16 | 30 | 260 |
APAU, 1-(1-acetypiperidin-4-yl)-3-adamantanylurea; AUDA, 12-(3-adamantan-1-yl-ureido)-dodecanoic acid; AUDA-BE, 12-(3-adamantan-1-yl-ureido)-dodecanoic acid butyl ester; c-AUCB, cis-4-[4-(3-adamantan-1-yl-ureido)-cyclohexyloxy]-benzoic acid; t-AUCB, trans-AUCB; TPAU, 1-trifluoromethoxyphenyl-3-(1-acetylpiperidin-4-yl) urea.
AIC, Akaike information criterion; AUCt, area under the concentration–time curve to terminal time; Corr, correlation coefficient between observed values and predicted values; t1/2α, half life of α phase (note that this phase is not a distribution phase, but a combined result of distribution and absorption); t1/2β, half life of elimination phase; the absorption rate constants are presented in Table S7.
The calculated value is more than the maximum sampling time, 1440 min.
The sampling time approaches the calculated t1/2s, so these calculated data are approximate results.
Data represent average ± s.d of three or four mice. Oral treatments were as same as that in Table 2, and s.c. injection was as same as that in Table 4.
Data represent the mean of three mice. The parameters are from Kim et al. (2007) and Watanabe et al. (2006).
AUDA is the predominant metabolite with little or none of the parent ester detected in the blood, thus the parameters were calculated on the basis of the blood concentration of AUDA.
The dose expressed as µmol·kg−1.
This value is an estimate as it should be more than 1440 min. We would need a longer sampling time to calculate a firm value.
This is an approximate result, as it is based on the last two time points only.
The two phases of the blood kinetics of t-AUCB were more defined than those of c-AUCB. However, it should be noted that the α phase is not a simple distribution phase but a combined result of the distribution and absorption. Among the three other tested inhibitors, the highest Cmax and the biggest AUCs were obtained from t-AUCB among the doses tested. Even though the similar blood t1/2αs and t1/2βs were obtained to c-AUCB, the lowest inter-individual variations were obtained for t-AUCB. Lacking quantitative in vivo efficacy comparing these inhibitors, the in vitro IC50s were used as cursory predictors of the biological effects. The blood concentrations of t-AUCB and c-AUCB were higher than their IC50s at doses of 0.5 and 1 mg·kg−1 even after 24 h treatment. Based on these results, along with its suitable t1/2 of 10–14 h and its relative species-independent potency on the sEH target (human, rats and mice), t-AUCB appeared to be the best of the derivatives tested as an sEHI, with good blood kinetics, for further investigation in murine inflammation and possibly other disease models.
Pharmacokinetic profile of t-AUCB following s.c. injection
Figure 3 illustrates the time course of blood concentration following s.c. injection at three different doses of 1, 3 and 10 mg·kg−1 respectively. The pharmacokinetic parameters from non- and 1-compartment model analyses are summarized in Tables 3 and 4 respectively. The blood Cmax of t-AUCB is achieved in 40–60 min after its administration, as it was for the oral route (Table 4). Subcutaneous injection resulted in a higher Cmax but a shorter t1/2 than those from oral gavage. For the dose of 1 mg·kg−1, s.c injection resulted in a blood concentration above the IC50 for 4 h and below IC50 after 6 h, whereas oral gavage resulted in a blood concentration above IC50 through the whole investigated 24 h. This observation suggests that administration by oral gavage releases the drug more slowly than s.c. injection, and thus is better at maintaining an effective drug concentration. For both oral gavage and s.c. injection, we observed a linear increase in the AUC as a function of the dose given (Figure 3 insert).
Figure 3.
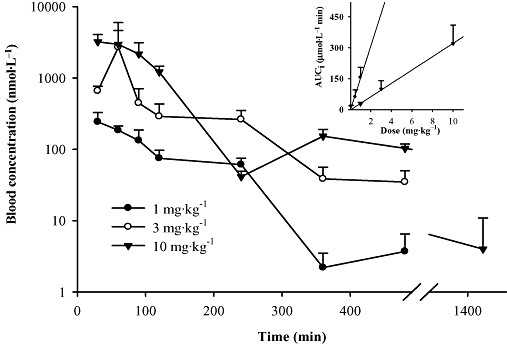
Blood concentration–time course of t-AUCB (Trans-4-[4-(3-adamantan-1-yl-ureido)-cyclohexyloxy]-benzoic acid) after s.c. administration to mice. Each point represents the mean ± s.d. of three mice. Insert: dependence of the AUCi (area under the concentration–time curve extrapolated to infinity) on dose given to the animal for p.o. (data from Figure 2, R2 = 0.9825) and s.c. administrations (R2 = 0.9989). Blood was collected from the mice through the tail vein at 0, 30, 60, 90, 120, 240, 360, 480 and 1440 min after dosing with the inhibitors respectively.
Pharmacokinetic profile of t-AUCB following i.v. injection
Figure 4 illustrates the pharmacokinetic profile of t-AUCB following i.v. injection. The pharmacokinetic parameters from non-compartmental analysis are included in Table S4. However, it is clearly observed that t-AUCB has two phases of excretion including distribution (α) and elimination (β) phases. Table 5 summaries the pharmacokinetic parameters on the basis of 2-compartment model analysis. Specifically, the distribution phase had a sharp slope with t1/2α of 70 min, while the elimination phase had a flat slope with t1/2β of around 10 h. Vdss was used to roughly evaluate the extensive tissue distribution of t-AUCB. Vdss was 17 L·kg−1 indicating a high peripheral tissue distribution of t-AUCB in vivo. This may result from the lipophilicity of t-AUCB. The blood clearance of t-AUCB was 0.7 L·kg−1··h−1, corresponding to the long elimination half life.
Figure 4.
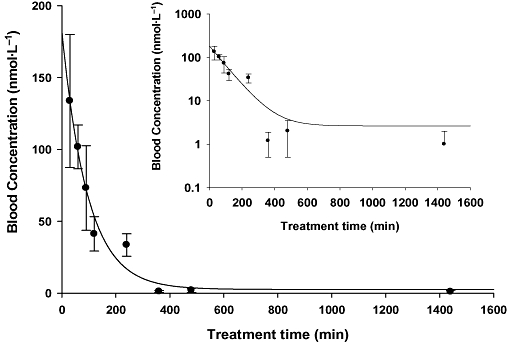
Blood concentration–time course of Trans-4-[4-(3-adamantan-1-yl-ureido)-cyclohexyloxy]-benzoic acid (t-AUCB) with i.v. administration to mice. Insert: blood concentration–time course of t-AUCB with i.v. administration to mice plotted in a log/linear scale. Each point represents the mean ± s.d. of three animals. Blood was collected from the tail vein of mice at 0, 30, 60, 90, 120, 240, 360, 480 and 1440 min after dosing with the inhibitor respectively.
Bioavailability of t-AUCB
Bioavailability is calculated from the time course of blood concentrations (estimated as AUC) following non-intravenous administration relative to that following i.v. injection with a dose that yields appropriate blood concentrations. The AUCts of t-AUCB following p.o., s.c. and i.v. injection are summarized in Tables 3 and 5. Accordingly, its oral bioavailabilities were 70 ± 23%, 55 ± 32% and 68 ± 22% for the doses of 1.0, 0.5 and 0.1 mg·kg−1 respectively. The s.c. bioavailabilities were 14 ± 4%, 15 ± 6% and 11 ± 4% for the doses of 10, 3 and 1 mg·kg−1 respectively.
Pharmacokinetic profile of t-AUCB administered in drinking water
A simple method of giving the sEHIs over several days, was required to evaluate the biological function of these inhibitors in a chronic model. This should be best achieved by giving the sEHI in drinking water which would result in a fairly steady blood level over the time of treatment. In order to test this proposal, t-AUCB at a dose of 4 mg·L−1 was provided in drinking water, which is roughly equivalent to an oral dose of 1 mg·kg−1 per day per mouse, assuming that a 30 g mouse drinks 7.5 mL of water a day. As expected, a relatively stable blood level of 70 nmol·L−1t-AUCB was attained after 1 day administration and maintained for the following days. The t-AUCB was totally washed out in 3 days with an apparent half life of 18 h, which corresponded to the elimination half life obtained from p.o. administration. This suggests that this simple method of administration is feasible and is probably suitable for many chronic studies in a murine model. However, it should be noted that ‘diseased’ mice may drink much more or less water than the normal controls in some disease models.
Regulation of hypotension in LPS-treated mice by oral gavage of t-AUCB
Hypotension is a critical feature of models of septic shock challenged by LPS. As illustrated in Figure 5, the systolic blood pressure dramatically decreased below our reliable detection limit (40 mm Hg) 4 h after giving LPS (10 mg·kg−1). As expected, doses of 0.5 and 1 mg·kg−1t-AUCB dramatically reversed the systolic blood pressure up to ∼60% and 90% of the normal level respectively. However, 1 mg·kg−1 of t-AUCB, without LPS treatment, had no significant effect on the blood pressure. These observations suggest that t-AUCB ameliorates the LPS-induced hypotension in a dose-dependent manner. In comparison with t-AUCB, oral administration of 10 mg·kg−1 of the early potent sEHI AUDA-BE to four mice given LPS resulted in systolic blood pressure of ∼45% of the normal level with no significant difference from the LPS control. These results suggest that t-AUCB is at least 10-fold more potent than AUDA-BE 4 h after treatment. AUDA-BE is metabolized to the free acid AUDA by esterase soon after administration, and a previous study showed that oral administration of 5 mg·kg−1 of AUDA-BE resulted in a similar blood concentration profile of AUDA to that of oral administration of 5 mg·kg−1 of AUDA (Table 2) (Kim et al., 2007). Together, these data indicate that t-AUCB is more potent than AUDA in this murine sepsis model.
Figure 5.
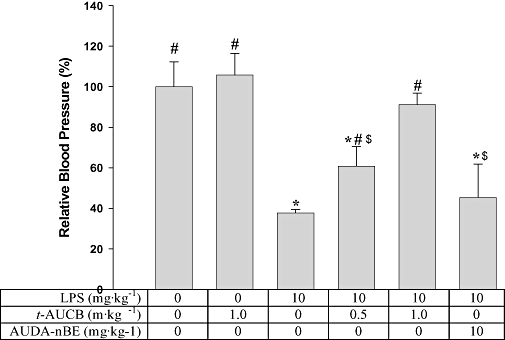
t-AUCB administration increases the systolic blood pressure of LPS-treated mice. This is a hypotensive model. Successful therapy is shown by a reversal to the normotensive state. Each bar represents the mean ± s.d. (n = 4).The blood pressure reported here was determined 4 h post treatment. In the group receiving LPS and AUDA-BE, the blood pressure of two mice was under the limit of detection, so we recorded the data as the limit of detection (40 mm Hg). *Significantly different from the control group receiving vehicle only (P < 0.05); #significantly different from the group receiving LPS only (P < 0.05); $significantly different from the group receiving LPS and t-AUCB (1 mg·kg−1). Significant differences were determined by anova followed by Tukey's test. AUDA-BE, 12-(3-adamantan-1-yl-ureido)-dodecanoic acid butyl ester; LPS, lipopolysaccharide; t-AUCB, Trans-4-[4-(3-adamantan-1-yl-ureido)-cyclohexyloxy]-benzoic acid.
In vivo efficacy of t-AUCB inhibiting the sEH in mice treated with LPS
P450 monooxygenases catalyse the formation of EET and EpOMEs from AA and linoleic acid respectively. The mono epoxy EETs and EpOMEs are further metabolized by sEH to their 1,2-diols (DHETs and DHOMEs). Therefore, sEHI has the ability to inhibit the production of diols (DHETs and DHOMEs) and/or increase the stability of epoxides (EETs and EpOMEs), resulting in an increase in the epoxide to diol ratios. These alterations are critical to evaluation of the in vivo efficacy of sEHIs. Following treatment with LPS, there is a dramatic increase in the pro-inflammatory mediators including TXB2, PGE2 and 5-HETE, accompanied by a large increase in NO from inducible NO synthase (iNOS), indicating that these mice are in an inflammatory state (Schmelzer et al., 2005). This is consistent with the dramatic fall in systolic blood pressure.
The total epoxides, total diols and the ratio of epoxides to diols from our present experiments are shown in Table 6. LPS dramatically stimulated the production of diols including DHOMEs and DHETs, and thus significantly decreased the ratio of epoxides to corresponding diols. As expected, both doses of t-AUCB significantly reduced the production of diols in the DHOME and DHET families, and significantly increased the ratios of epoxides to diols in a dose-related manner. Overall, these results showed that the inhibition of sEH by t-AUCB was certainly associated with the regulation of hypotension in mice treated with LPS. Furthermore, LPS, with or without t-AUCB, changed the production of diols and the ratio of epoxides to diols. This indicates that the ratio of epoxides to diols could be a valuable biomarker of LPS-induced inflammation and the potency of sEHI to address inflammation. In the control animals receiving only 1 mg·kg−1 of t-AUCB, there was just a slight increase in the sum of EETs, as well as in the EET/DHET ratio. As in previous studies, the effects of sEHI in normal animals on blood epoxides and diols are much smaller than that in animals with inflammation (Schmelzer et al., 2006).
Table 6.
Total oxylipin epoxides and diols in murine plasma
| Groups | LPS (mg·kg−1) | t-AUCB (mg·kg−1) | ΣEpOMEa(nmol·L−1) | ΣDHOMEb(nmol·L−1) | ΣEpOMEc/ΣDHOME | ΣEETd(nmol·L−1) | ΣDHETe(nmol·L−1) | ΣEETc/ΣDHET |
|---|---|---|---|---|---|---|---|---|
| t-AUCB control | 0 | 1.0 | 43 ± 14 | 32 ± 2 | 1.4 ± 0.1 | 7.4 ± 1.7 | 6.2 ± 0.3 | 1.2 ± 0.3 |
| Control | 0 | 0 | 50 ± 30 | 34 ± 13 | 1.4 ± 0.4 | 5.8 ± 2.1 | 5.9 ± 1.0 | 1.0 ± 0.4 |
| LPS control | 10 | 0 | 26 ± 6g | 190 ± 60f,g | 0.15 ± 0.04f,g | 4.0 ± 1.6g | 14.5 ± 3.0f,g | 0.3 ± 0.1f,g |
| t-AUCB (dose 1) | 10 | 0.5 | 16 ± 3g,h | 63 ± 7f,g,h | 0.26 ± 0.08f,g | 3.3 ± 1.0g | 5.7 ± 1.2h | 0.6 ± 0.1g,h |
| t-AUCB (dose 2) | 10 | 1.0 | 40 ± 20 | 80 ± 30f,g,h | 0.5 ± 0.2f,g,h | 4.6 ± 1.5 | 5.8 ± 1.4g,h | 0.8 ± 0.1g,h |
| AUDA-BE | 10 | 10 | 29 ± 7 | 60 ± 12h | 0.5 ± 0.1h | 3.0 ± 1.0 | 4.7 ± 0.8h | 0.7 ± 0.3h |
Each value represents the mean ± s.d. of four mice. Mice were killed 6 h post treatment. For the concentration of individual epoxide or diol regioisomers see Table S5.
AUDA-BE, 12-(3-adamantan-1-yl-ureido)-dodecanoic acid butyl ester; DHOME, dihydroxy octadecamonoeneoic acid; EET, epoxyeicosatrienoic acid; EpOME, epoxyoctadecamonoeneoic acid; HETE, hydroxyeicosatetraenoic acid; LPS, lipopolysaccharide; sEH, soluble epoxide hydrolase; t-AUCB, trans-4-[4-(3-adamantan-1-yl-ureido)-cyclohexyloxy]-benzoic acid.
Concentration of combined regioisomers of linoleate (18:2) epoxides.
Concentration of combined regioisomers of linoleate diols.
Epoxide to diol ratios in the linoleate (18:2) and arachidonate series (20:4) are apparent biomarkers of the inhibition of sEH.
Concentration of combined regioisomers of arachidonate (20:4) epoxides. The 5,6-isomer is not included as it forms a lactone during sample preparation and analysis.
Concentration of combined regioisomers of arachidonate diols.
Significantly different from the control group (second row) (P < 0.05);
Significantly different from the t-AUCB control (first row) (P < 0.05);
Significantly different from the LPS control group (third row) (P < 0.05). All significant differences were determined by anova followed by Tukey's test.
AUDA-BE (10 mg·kg−1) significantly inhibited the production of diols and increased the ratio of epoxides to diols in LPS-treated mice (Table 6). This potency is similar to that of 1 mg·kg−1 of t-AUCB. These results also suggest that t-AUCB is at least 10-fold more potent in vivo than AUDA-BE, 6 h after treatment.
Discussion
Inspection of the structures of the four inhibitors shown in Figure 1 reveals that APAU has the same ‘left side’ of an adamantanyl urea as t-AUCB and c-AUCB and has the same ‘right side’ of an acetyl piperidine as TPAU. Both t-AUCB and c-AUCB have shorter Tmax and higher AUC than APAU, which indicates that the right side of AUCB (cyclohexyloxy-benzoic acid) may be more favourable than acetyl piperidine for higher blood levels in this model. Interestingly, higher Cmax and overall blood concentrations were obtained for t-AUCB than its cis-isomer, although the difference was small. In comparison with APAU, the replacement of the ‘left side’ adamantyl by a 4-trifluoromethoxy-phenyl in TPAU results in far higher Cmax and AUC, but a longer Tmax, suggesting a slower but more efficient absorption, and/or slower metabolism and distribution of the compound. However, TPAU is far less potent than APAU with respect to in vitro inhibition of sEH in rodents. Because the potency of the two piperidines is similar for human sEH, TPAU could be more effective and long lasting in humans and other primates than APAU or t- and c-AUCB. These observations could be valuable for the design of new potent sEHIs, bearing in mind that blood levels for pharmaceutical agents often do not correlate with efficacy. For example, the early sEHI, AUDA, has been shown to penetrate the blood-brain barrier and to show benefits in a stroke model (Zhang et al., 2007). Another early sEHI, AEPU, attenuated inflammation induced cardiac hypertrophy without detectable amounts in the blood, indicating that its biological effects were due to the rapid tissue distribution of sEHI or active metabolite (Xu et al., 2006). Although adamantane has a near perfect fit in the sEH catalytic site based on X-ray crystallography (Jones et al., 2006), with some sEHI, it provides metabolic lability. The higher AUC of TPAU suggests that replacement of adamantane should be considered if a larger AUC is desired. In both the cyclohexylbenzyl ether series and the acetylpiperidine series, blood half-lives should be easily adjusted by replacing adamantane. For the inhibitors t-AUCB, c-AUCB and TPAU, their AUCs with oral administration are approximately proportional to the doses used. However, the fact that the AUCs of the inhibitor APAU are not proportional to the low doses used, indicates there is a process that is non-linear during the drug absorption and/or metabolism. For the dose of 1 mg·kg−1 of t-AUCB, the difference in bioavailability following administration by p.o. and s.c. injection demonstrate that formulation and treatment methods affect drug release, absorption and metabolism.
The intensity of the pharmacological effect of sEH inhibition is a function of the drug potency and the effective amount of drug at the target site. The IC50 value, the blood concentration, AUC and the time for which the blood concentration of compounds is above the IC50 (TOIC50 in Table 2), suggest characteristics for the effectiveness of a compound. Among the four inhibitors investigated, both t-AUCB and c-AUCB were better than APAU and TPAU because of their longer TOIC50s and more potent IC50s. Regarding the geometric isomerism of AUCB, the trans-isomer gives both a higher Cmax and larger AUC than the cis-isomer; while their t1/2s are not significantly different at the highest concentration. Data with t-AUCB also show less variability. Thus t-AUCB was selected for further study in the murine model.
The pharmacokinetic properties of t-AUCB were also studied by using i.v. and oral administration (via drinking water). For the i.v. injection, a much shorter t1/2β was obtained than that obtained by oral gavage suggesting that even though oral gavage gave a Cmax after 40 min, there is probably a slow absorption from the gut and/or slow appearance in the bloodstream from tissue depots. This is also supported by the fact that the blood concentration of t-AUCB at 8 h was more (or not less) than those at 6 h following oral gavage (Figure 2). Following oral administration in the drinking water, a fairly stable concentration of t-AUCB was maintained for several days. While these results are preliminary to establishing a proper dose regimen, they are helpful for the selection of proper administration methods for various murine models of disease.
With the oral dose of 1 mg·kg−1, all four inhibitors showed higher AUCs and longer TOIC50s than those exhibited by AUDA and AUDA-BE with oral doses of 5 mg·kg−1 (Tables 2 and 3). It should be noted that AUDA is the only metabolite of AUDA-BE (through esterase action) and is the only metabolite detected with significant potency on the sEH (Kim et al., 2007). A previous study demonstrated that oral administration of 5 mg·kg−1 of AUDA-BE resulted in a Cmax of 100 nmol·L−1 for AUDA at the Tmax of 1 h post treatment in mice, and the blood concentration of AUDA exceeded the IC50 for less than 4 h (Kim et al., 2007). Compared with oral gavage of 5 mg·kg−1 of AUDA or AUDA-BE, oral administration of 0.5 mg·kg−1 of t-AUCB showed better pharmacokinetic properties such as Tmax, Cmax, t1/2, AUC and TOIC50. These results suggest that t-AUCB should be a better candidate to use for studies in vivo than AUDA or AUDA-BE. In addition, its increased water solubility makes t-AUCB easier to formulate (Table 1).
The substrate of P450 monooxygenase for the production of EETs is arachidonic acid, which is stored in the cell membrane phospholipids and is released in response to stimuli such as LPS. In a large number of experiments of differing design, we routinely find that the concentrations of epoxides and diols and epoxide to diol ratios are changed slightly or not at all in control animals receiving sEHI only, but the changes are often dramatic in animals with inflammation. LPS dramatically increases the release of arachidonic acid and leads to induction of COX-2 and 5-LOX (Schmelzer et al., 2005; 2006). The resulting inflammatory eicosanoids have a major impact on pain and inflammatory symptoms. There also is a massive increase in iNOS resulting in morbid hypotension. The sEHIs increase EETs and other epoxylipids that repress the induction of COX-2 and 5-LOX. Although EETs dilate some vessels, in this case their repression of the induction of iNOS dominates the biological outcome, and there is a net rise in blood pressure towards normotensive levels. In general, increased EETs and thus sEHIs quell the propagation of severe inflammation and shift the eicosanoid profile towards active resolution of inflammation. In addition to a significant shift in production of epoxides and diols, t-AUCB significantly inhibited the production of TXB2 and 5-HETE (Table S5) in our LPS model. Our hypothesis is that small changes in EETs can result in large changes in TXB2 and 5-HETE by transcriptional regulation of their biosynthetic enzymes. Through the combination of the preservation of systolic blood pressure and the shift in production of epoxides and diols, t-AUCB was anti-inflammatory in LPS-treated mice. A previous study showed that AUDA-BE significantly preserved the systolic blood pressure and reversed the decrease in the ratio of epoxides to diols, 24 h after LPS challenge (Schmelzer et al., 2005). The fact that AUDA-BE did not significantly restore the systolic blood pressure in our model, although it affected the epoxides to diols ratio suggest that 4 h may be not the most appropriate time to assess the effects of AUDA-BE on blood pressure. The current study shows that t-AUCB was more potent than AUDA-BE not only in reversing the LPS-induced hypotension 4 h after LPS challenge, but also in reversing the decrease in the epoxides to diols ratio, 6 h after LPS treatment. Lipid epoxide concentrations and their ratios to their respective diols are suggested biomarkers for the action of sEHI and alterations in sEHI message. Furthermore, t-AUCB afforded higher Cmax, faster Tmax, longer t1/2, and larger AUC than AUDA-BE and AUDA. It is therefore reasonable to suggest that t-AUCB is more potent as a sEHI in vivo than AUDA or AUDA-BE, in this murine model.
In conclusion, our study showed that t-AUCB is a better sEHI than AUDA and AUDA-BE in terms of in vivo potency and pharmacokinetic properties. This is reflected in the improvement in efficacy of t-AUCB over AUDA-BE in reversing both LPS-challenged hypotension and the decreased ratio of epoxides to diols. We predict that t-AUCB will be a better pharmacological tool than AUDA for testing the role of sEH in a variety of inflammatory and possibly other disease models in mice.
Acknowledgments
The authors thank Dr Christine Hegedus for language review and Pharsight Corporation for providing us the free software of WinNonLin. This work was supported in part by NIEHS grant ES02710, NIEHS Superfund P42 ES04699 and NIH R01 HL85727.
Glossary
Abbreviations:
- ADU
1-adamantanyl-3-decylurea
- AEPU
1-adamantanyl-3-{5-[2-(2-ethoxyethoxy)ethoxy]pentyl}urea
- AIC
Akaike information criterion
- c-AUCB
cis-4-[4-(3-adamantan-1-yl-ureido)-cyclohexyloxy]-benzoic acid
- t-AUCB
trans-AUCB
- APAU
1-(1-acetypiperidin-4-yl)-3-adamantanylurea
- AUDA
12-(3-adamantan-1-yl-ureido)-dodecanoic acid
- AUDA-BE
12-(3-adamantan-1-yl-ureido)-dodecanoic acid butyl ester
- BPAU
1-(5-butoxypentyl)-3-adamantylurea
- CMNPC
cyano(2-methoxynaphthalen-6-yl)methyl(3-phenyloxiran-2-yl)methyl carbonate
- EET
epoxyeicosatrienoic acid
- DHET
dihydroxyeicosatrieneoic acid
- DHOME
dihydroxy octadecamonoeneoic acid
- EpOME
epoxyoctadecamonoeneoic acid
- HETE
hydroxyeicosatetraenoic acid
- NF-κB
nuclear factor kappa B
- LPS
lipopolysaccharide
- PG
prostaglandin
- PK
pharmacokinetic
- sEH
soluble epoxide hydrolase
- sEHI
sEH inhibitor
- TOIC50
time of blood concentration over IC50
- TPAU
1-trifluoromethoxyphenyl-3-(1-acetylpiperidin-4-yl) urea
Conflict of interest
HJT, SHH, PDJ, CM and BDH are authors of composition of matter and use patents in this area. BDH is the founder of Arête Therapeutics. This company is moving sEHI through clinical trials for treating hypertension, inflammation and other disorders.
Supporting Information
Additional Supporting Information may be found in the online version of this article:
Table S1 Optimum tandem mass conditions and key fragmentation of the soluble epoxide hydrolase inhibitors
Table S2 Optimum tandem mass conditions of targeted oxylipin mediators
Table S3 The solvent gradient programme for chromatographic separation of oxylipin mediators
Table S4 Pharmacokinetic parameters of soluble epoxide hydrolase inhibitors after oral gavage and i.v. injection with non-compartmental analysis
Table S5 Plasma levels of individual oxylipins in a murine sepsis model
Table S6 Pharmacokinetic parameters of t-AUCB (after s.c. injection with non-compartmental analysis
Table S7 The absorption rate constant of soluble epoxide hydrolase inhibitors following oral or s.c. administration
Appendix S1 The equations for pharmacokinetic parameters with compartmental analysis
Please note: Wiley-Blackwell are not responsible for the content or functionality of any supporting materials supplied by the authors. Any queries (other than missing material) should be directed to the corresponding author for the article.
References
- Alexander SPH, Mathie A, Peters JA. Guide to Receptors and Channels (GRAC), 3rd edn. Br J Pharmacol. 2008;153:S1–S209. doi: 10.1038/sj.bjp.0707746. [DOI] [PMC free article] [PubMed] [Google Scholar]
- Campbell WB. New role for epoxyeicosatrienoic acids as anti-inflammatory mediators. Trends Pharmacol Sci. 2000;21:125–127. doi: 10.1016/s0165-6147(00)01472-3. [DOI] [PubMed] [Google Scholar]
- Carroll MA, Schwartzman M, Capdevila J, Falck JR, McGiff JC. Vasoactivity of arachidonic acid epoxides. Eur J Pharmacol. 1987a;138:281–283. doi: 10.1016/0014-2999(87)90445-6. [DOI] [PubMed] [Google Scholar]
- Carroll MA, Schwartzman ML, Capdevila J, Falck JR, Carrara MC, Mcgiff JC. Vascular activity of 5,6 epoxyeicosatrienoic acid. Clin Res. 1987b;35:A266–A266. [Google Scholar]
- Davis BB, Morisseau C, Newman JW, Pedersen TL, Hammock BD, Weiss RH. Attenuation of vascular smooth muscle cell proliferation by 1-cyclohexyl-3-dodecyl urea is independent of soluble epoxide hydrolase inhibition. J Pharmacol Exp Ther. 2006;316:815–821. doi: 10.1124/jpet.105.091876. [DOI] [PubMed] [Google Scholar]
- Doggrell SA. Cytochrome P-450: a new target in the heart and coronary circulation. Drugs Future. 2005;30:261–269. [Google Scholar]
- Dorrance AM, Rupp N, Pollock DM, Newman JW, Hammock BD, Imig JD. An epoxide hydrolase inhibitor, 12-(3-adamantan-1-yl-ureido)dodecanoic acid (AUDA), reduces ischemic cerebral infarct size in stroke-prone spontaneously hypertensive rats. J Cardiovasc Pharmacol. 2005;46:842–848. doi: 10.1097/01.fjc.0000189600.74157.6d. [DOI] [PMC free article] [PubMed] [Google Scholar]
- Elbekai RH, El-Kadi AOS. Cytochrome P450 enzymes: central players in cardiovascular health and disease. Pharmacol Ther. 2006;112:564–587. doi: 10.1016/j.pharmthera.2005.05.011. [DOI] [PubMed] [Google Scholar]
- Fleming I, Busse R. Endothelium-derived epoxyeicosatrienoic acids and vascular function. Hypertension. 2006;47:629–633. doi: 10.1161/01.HYP.0000208597.87957.89. [DOI] [PubMed] [Google Scholar]
- Hwang SH, Tsai HJ, Liu JY, Morisseau C, Hammock B. Orally bioavailable potent soluble Epoxide Hydrolase (sEH) inhibitors. J Med Chem. 2007;50:3825–3840. doi: 10.1021/jm070270t. [DOI] [PMC free article] [PubMed] [Google Scholar]
- Imig JD. Epoxide hydrolase and epoxygenase metabolites as therapeutic targets for renal diseases. Am J Physiol Renal Physiol. 2005;289:F496–F503. doi: 10.1152/ajprenal.00350.2004. [DOI] [PubMed] [Google Scholar]
- Imig JD. Cardiovascular therapeutic aspects of soluble epoxide hydrolase inhibitors. Cardiovasc Drug Rev. 2006;24:169–188. doi: 10.1111/j.1527-3466.2006.00169.x. [DOI] [PubMed] [Google Scholar]
- Imig JD, Falck JR, Navar LG. 11,12-Epoxyeicosatrienoic acid (11,12-Eet) is a potent vasodilator of the renal microvasculature. J Am Soc Nephrol. 1995;6:679–679. [Google Scholar]
- Imig JD, Zhao XY, Capdevila JH, Morisseau C, Hammock BD. Soluble epoxide hydrolase inhibition lowers arterial blood pressure in angiotensin II hypertension. Hypertension. 2002;39:690–694. doi: 10.1161/hy0202.103788. [DOI] [PubMed] [Google Scholar]
- Imig JD, Zhao XY, Zaharis CZ, Olearczyk JJ, Pollock DM, Newman JW, et al. An orally active epoxide hydrolase inhibitor lowers blood pressure and provides renal protection in salt-sensitive hypertension. Hypertension. 2005;46:975–981. doi: 10.1161/01.HYP.0000176237.74820.75. [DOI] [PMC free article] [PubMed] [Google Scholar]
- Inceoglu B, Schmelzer K, Jinks S, Waite T, Hammock B. Soluble epoxide hydrolase inhibitors and/or epoxyeicosatrianoic acids attenuate hyperalgesia and allodynia in a rat model. FASEB J. 2006;20:A687–A687. [Google Scholar]
- Inceoglu B, Schmelzer KR, Morisseau C, Jinks SL, Hammock BD. Soluble epoxide hydrolase inhibition reveals novel biological functions of epoxyeicosatrienoic acids (EETs) Prostaglandins Other Lipid Mediat. 2007;82:42–49. doi: 10.1016/j.prostaglandins.2006.05.004. [DOI] [PMC free article] [PubMed] [Google Scholar]
- Jin LM, Foss CE, Zhao XY, Mills TM, Wang MH, McCluskey LP, et al. Cytochrome P450 epoxygenases provide a novel mechanism for penile erection. FASEB J. 2006;20:539–541. doi: 10.1096/fj.05-4341fje. [DOI] [PubMed] [Google Scholar]
- Jones PD, Wolf NM, Morisseau C, Whetstone P, Hock B, Hammock BD. Fluorescent substrates for soluble epoxide hydrolase and application to inhibition studies. Anal Biochem. 2005;343:66–75. doi: 10.1016/j.ab.2005.03.041. [DOI] [PMC free article] [PubMed] [Google Scholar]
- Jones PD, Tsai HJ, Do ZN, Morisseau C, Hammock BD. Synthesis and SAR of conformationally restricted inhibitors of soluble epoxide hydrolase. Bioorg Med Chem Lett. 2006;16:5212–5216. doi: 10.1016/j.bmcl.2006.07.009. [DOI] [PMC free article] [PubMed] [Google Scholar]
- Kim IH, Morisseau C, Watanabe T, Hammock BD. Design, synthesis, and biological activity of 1,3-Disubstituted ureas as potent inhibitors of the soluble epoxide hydrolase of increased water solubility. J Med Chem. 2004;47:2110–2122. doi: 10.1021/jm030514j. [DOI] [PubMed] [Google Scholar]
- Kim IH, Heirtzler FR, Morisseau C, Nishi K, Tsai HJ, Hammock BD. Optimization of amide-based inhibitors of soluble epoxide hydrolase with improved water solubility. J Med Chem. 2005;48:3621–3629. doi: 10.1021/jm0500929. [DOI] [PMC free article] [PubMed] [Google Scholar]
- Kim IH, Nishi K, Tsai HJ, Bradford T, Koda Y, Watanabe T, et al. Design of bioavailable derivatives of 12-(3-adamantan-1-yl-ureido)dodecanoic acid, a potent inhibitor of the soluble epoxide hydrolase. Bioorganic. Med Chem. 2007;15:312–323. doi: 10.1016/j.bmc.2006.09.057. [DOI] [PMC free article] [PubMed] [Google Scholar]
- Luria A, Weldon SM, Kabcenell AK, Ingraham RH, Matera D, Jiang HP, et al. Compensatory mechanism for homeostatic blood pressure regulation in Ephx2 gene-disrupted mice. J Biol Chem. 2007;282:2891–2898. doi: 10.1074/jbc.M608057200. [DOI] [PMC free article] [PubMed] [Google Scholar]
- Morisseau C, Hammock BD. Measurement of soluble epoxide hydrolase (sEH) activity. Curr Protoc Toxicol. 2007;33:1–18. doi: 10.1002/0471140856.tx0423s33. [DOI] [PubMed] [Google Scholar]
- Morisseau C, Goodrow MH, Dowdy D, Zheng J, Greene JF, Sanborn JR, et al. Potent urea and carbamate inhibitors of soluble epoxide hydrolases. Proc Natl Acad Sci USA. 1999;96:8849–8854. doi: 10.1073/pnas.96.16.8849. [DOI] [PMC free article] [PubMed] [Google Scholar]
- Morisseau C, Goodrow MH, Newman JW, Wheelock CE, Dowdy DL, Hammock BD. Structural refinement of inhibitors of urea-based soluble epoxide hydrolases. Biochem Pharmacol. 2002;63:1599–1608. doi: 10.1016/s0006-2952(02)00952-8. [DOI] [PubMed] [Google Scholar]
- Morisseau C, Newman JW, Tsai HJ, Baecker PA, Hammock BD. Peptidyl-urea based inhibitors of soluble epoxide hydrolases. Bioorg Med Chem Lett. 2006a;16:5439–5444. doi: 10.1016/j.bmcl.2006.07.073. [DOI] [PMC free article] [PubMed] [Google Scholar]
- Morisseau C, Schmelzer K, Pedersen T, Eiserich J, Pinkerton K, Imig J, et al. Physiological roles of soluble epoxide hydrolase and therapeutic prospects of its inhibition. FASEB J. 2006b;20:A669–A669. [Google Scholar]
- Newman JW, Watanabe T, Hammock BD. The simultaneous quantification of cytochrome P450 dependent linoleate and arachidonate metabolites in urine by HPLC-MS/MS. J Lipid Res. 2002;43:1563–1578. doi: 10.1194/jlr.d200018-jlr200. [DOI] [PubMed] [Google Scholar]
- Newman JW, Morisseau C, Hammock BD. Epoxide hydrolases: their roles and interactions with lipid metabolism. Prog Lipid Res. 2005;44:1–51. doi: 10.1016/j.plipres.2004.10.001. [DOI] [PubMed] [Google Scholar]
- Ng VY, Morisseau C, Falck JR, Hammock BD, Kroetz DL. Inhibition of smooth muscle proliferation by urea-based alkanoic acids via peroxisome proliferator-activated receptor alpha-dependent repression of cyclin D1. Arterioscler Thromb Vasc Biol. 2006;26:2462–2468. doi: 10.1161/01.ATV.0000242013.29441.81. [DOI] [PMC free article] [PubMed] [Google Scholar]
- Node K, Huo YQ, Ruan XL, Yang BC, Spiecker M, Ley K, et al. Anti-inflammatory properties of cytochrome P450 epoxygenase-derived eicosanoids. Science. 1999;285:1276–1279. doi: 10.1126/science.285.5431.1276. [DOI] [PMC free article] [PubMed] [Google Scholar]
- Olearczyk JJ, Kim IH, Hammock BD, Imig JD. Inhibition of the soluble epoxide hydrolase decreases the expression of pro-inflammatory genes in hypertensive Goto-Kakizaki rats. Hypertension. 2005;46:856–856. [Google Scholar]
- Olearczyk JJ, Field MB, Kim IH, Morisseau C, Hammock BD, Imig JD. Substituted adamantyl-urea inhibitors of the soluble epoxide hydrolase dilate mesenteric resistance vessels. J Pharmacol Exp Ther. 2006a;318:1307–1314. doi: 10.1124/jpet.106.103556. [DOI] [PubMed] [Google Scholar]
- Olearczyk JJ, Field MB, Kim IH, Morisseau C, Hammock BD, Imig JD. Urea-based soluble epoxide hydrolase inhibitors dilate mesenteric resistance vessels. FASEB J. 2006b;20:A669–A669. doi: 10.1124/jpet.106.103556. [DOI] [PubMed] [Google Scholar]
- Pomposiello SI, Quilley J, Carroll MA, Falck JR, McGiff JC. 5,6-epoxyeicosatrienoic acid mediates the enhanced renal vasodilation to arachidonic acid in the SHR. Hypertension. 2003;42:548–554. doi: 10.1161/01.HYP.0000090095.87899.36. [DOI] [PubMed] [Google Scholar]
- Sarkis A, Roman RJ. Role of cytochrome P450 metabolites of arachidonic acid in hypertension. Curr Drug Metab. 2004;5:245–256. doi: 10.2174/1389200043335603. [DOI] [PubMed] [Google Scholar]
- Schmelzer KR, Kubala L, Newman JW, Kim IH, Eiserich JP, Hammock BD. Soluble epoxide hydrolase is a therapeutic target for acute inflammation. Proc Natl Acad Sci USA. 2005;102:9772–9777. doi: 10.1073/pnas.0503279102. [DOI] [PMC free article] [PubMed] [Google Scholar]
- Schmelzer KR, Inceoglu B, Kubala L, Kim IH, Jinks SL, Eiserich JP, et al. Enhancement of antinociception by coadministration of nonsteroidal anti-inflammatory drugs and soluble epoxide hydrolase inhibitors. Proc Natl Acad Sci USA. 2006;103:13646–13651. doi: 10.1073/pnas.0605908103. [DOI] [PMC free article] [PubMed] [Google Scholar]
- Seubert JM, Sinal CJ, Graves J, DeGraff LM, Bradbury JA, Lee CR, et al. Role of soluble epoxide hydrolase in postischemic recovery of heart contractile function. Circ Res. 2006;99:442–450. doi: 10.1161/01.RES.0000237390.92932.37. [DOI] [PMC free article] [PubMed] [Google Scholar]
- Seubert JM, Zeldin DC, Nithipatikom K, Gross GJ. Role of epoxyeicosatrienoic acids in protecting the myocardium following ischemia/reperfusion injury. Prostaglandins Other Lipid Mediat. 2007;82:50–59. doi: 10.1016/j.prostaglandins.2006.05.017. [DOI] [PMC free article] [PubMed] [Google Scholar]
- Smith KR, Pinkerton KE, Watanabe T, Pedersen TL, Ma SJ, Hammock BD. Attenuation of tobacco smoke-induced lung inflammation by treatment with a soluble epoxide hydrolase inhibitor. Proc Natl Acad Sci USA. 2005;102:2186–2191. doi: 10.1073/pnas.0409591102. [DOI] [PMC free article] [PubMed] [Google Scholar]
- Spector AA, Fang X, Snyder GD, Weintraub NL. Epoxyeicosatrienoic acids (EETs): metabolism and biochemical function. Prog Lipid Res. 2004;43:55–90. doi: 10.1016/s0163-7827(03)00049-3. [DOI] [PubMed] [Google Scholar]
- Watanabe T, Schulz D, Morisseau C, Hammock BD. High-throughput pharmacokinetic method: Cassette dosing in mice associated with minuscule serial bleedings and LC/MS/MS analysis. Anal Chim Acta. 2006;559:37–44. doi: 10.1016/j.aca.2005.11.049. [DOI] [PMC free article] [PubMed] [Google Scholar]
- Xu D, Li N, He Y, Timofeyev V, Lu L, Tsai HJ, et al. Prevention and reversal of cardiac hypertrophy by soluble epoxide hydrolase inhibitors. Proc Natl Acad Sci USA. 2006;103:18733–18738. doi: 10.1073/pnas.0609158103. [DOI] [PMC free article] [PubMed] [Google Scholar]
- Zhang WR, Koerner IP, Noppens R, Grafe M, Tsai HJ, Morisseau C, et al. Soluble epoxide hydrolase: a novel therapeutic target in stroke. J Cerebral Blood Flow Metab. 2007;27:1931–1940. doi: 10.1038/sj.jcbfm.9600494. [DOI] [PMC free article] [PubMed] [Google Scholar]
- Zhao XY, Inscho EW, Morisseau C, Hammock BD, Imig JD. Soluble epoxide hydrolase regulates renal microvascular angiotensin II reactivity in hypertension. FASEB J. 2002;16:A418–A418. [Google Scholar]
Associated Data
This section collects any data citations, data availability statements, or supplementary materials included in this article.