Abstract
A wide range of methods exist for the on-plate detection of lipids resolved by thin layer chromatography. Fluorescence generally offers improvements in sensitivity over methods that use colorimetric or simple densitometric detection. In this paper, we report that a classic cupric sulfate charring protocol produces a fluorescent signal that sensitively and quantitatively detects a wide range of phospholipids, neutral lipids, and sterols after automated, multi-development high performance thin layer chromatography. The measured lower limits of detection and quantification, respectively, were, on average, 80 and 210 pmol for phospholipids and 43 fmol and 8.7 pmol for sterols. The simple, inexpensive, and highly sensitive approach described here was used to quantitatively analyze the lipid and sterol composition of sea urchin cortical vesicles, a stage-specific model system used to study the mechanism of regulated membrane fusion.
Keywords: Cholesterol, Nile Red, Densitometry, Quantification
Introduction
Detection of lipids on thin layer chromatography (TLC) plates by charring in the presence of copper salts is a well-established analytical technique originally used for densitometric detection [1]. Later improvements to the technique included the use of cupric sulfate in place of cupric acetate [2, 3] to address shortcomings in detection—specifically with regard to the differential sensitivity to saturated and unsaturated lipids [4, 5]. The technique has since been largely unchanged and remains a routine, widely used method for detecting lipids on TLC plates [6–9].
A variety of methods exist for the fluorescent detection of lipids on silica TLC plates. The most common fluorometric detection is based on impregnating the silica gel with a fluorescent indicator [10, 11], resulting in a negative staining, with fluorescence maxima on the plate background and minima at the lipid peaks. Staining with Nile Red has also proven to be an effective fluorescent method for quantitatively detecting lipids and sterols on TLC plates, with reported lower limits of detection in the range of 25–100 ng [12]. Other fluorescent stains, including 1,6-diphenylhexatriene, yield comparable detection sensitivities [13, 14]. These would appear to be the most sensitive of currently available reagents.
Isolated cortical vesicles (CV) from sea urchin oocytes are a well-established, stage-specific model for native Ca2+-triggered membrane fusion [15–19]. As they are able to undergo triggered fusion with liposomes, CV contain the minimal molecular machinery for vesicle attachment, Ca2+ sensing, and membrane merger [20]. Recent studies have highlighted the important contribution of lipids to the process of Ca2+-triggered membrane fusion [21–23], consistent with the stalk-pore hypothesis [24–29]. In this paper, we report the quantitative analysis of the lipid and sterol composition of fusion-ready CV membranes using high-performance TLC (HPTLC) and a fluorescent detection method based on the classic cupric sulfate charring technique. The optimized protocol yields detection of phospholipids and neutral lipids with sensitivities approximately three to eightfold better than existing densitometric and fluorescent methods and the detection of biologically relevant sterols with two to five orders of magnitude of improvement over existing on-plate methods. On-plate fluorescent detection of lipids and sterols with cupric sulfate charring is comparable to the sensitivity of mass-spectrometry-based methods of lipid analysis [30–32].
Materials and methods
Materials
Mixed fatty acids were purchased from Doosan Serdary Research Labs (Toronto, Ontario, Canada). Nile Red, copper (II) sulfate heptahydrate, cholesteryl stearate, and cholesteryl oleate were from Sigma (St. Louis, MO, USA). Sterols, except cholesterol and CE, were purchased from Steraloids Inc. (Newport, RI, USA). Cholesterol and all other lipid standards were purchased from Avanti Polar Lipids (Alabaster, AL, USA). Silica gel 60 HPTLC plates and solvents were from EMD Chemicals (Gibbstown, NJ, USA). All other chemicals were of at least analytical grade; bleach was a standard commercial brand (Javex).
Preparation and isolation of cortical vesicles
CV were isolated from Strongylocentrotus purpuratus (Westwind Sea Labs, Victoria, BC, Canada) as previously described [15, 16]. Vesicles were lysed hypotonically as described [22, 33] and membranes collected by ultracentrifugation (100,000 × g, 3 h). Parallel membrane samples were dissolved into 2% sodium dodecyl sulfate (for total protein analysis), 1× reaction buffer (for enzymatic cholesterol determination: 50 mM NaCl, 5 mM cholic acid, 0.1% Triton X-100, 100 mM potassium phosphate pH 7.4), or extracted according to Bligh and Dyer [34] with modifications [35]. Lipid extracts were stored under N2 (−30 °C) until required. For HPTLC, lipids were dissolved into chloroform/methanol (2:1, v/v) and loaded onto HPTLC plates with a parallel dilution series of lipid standards. Unless otherwise stated, all lipid standards were the oleic acid (18:1Δ9) esters.
Cholesterol and protein quantification
CV membrane cholesterol was determined using the Amplex Red cholesterol assay kit (Invitrogen, Carlsbad, CA, USA) according to manufacturer’s instructions. Total protein was determined using the EZQ Protein Quantitation Kit (Invitrogen) with modifications as previously described [36].
High-performance thin layer chromatography
Plates were pre-washed with methanol/ethyl acetate (6:4, v/v) and activated at 110 °C for at least 30 min before loading. Dilution series of both native extract and lipid standards in chloroform/methanol (2:1) were loaded onto HPTLC plates under N2 using the CAMAG Linomat IV and developed in the CAMAG AMD2 (CAMAG, Wilmington, NC, USA) as described [21, 23]. For neutral lipids and sterols, HPTLC plates were developed twice with CH2Cl2/ethyl acetate/acetone (80:16:4, v/v/v) to 40 and 55 mm, then sequentially three times with hexanes/ethyl acetate to 68 mm (90:10, v/v), 80 mm (95:5), and 90 mm (100:0). Phospholipids were developed essentially according to Weerheim [37] with modifications. Briefly, HPTLC plates were developed to 90 mm with CH2Cl2/ethyl acetate/acetone (80:16:4, v/v/v), dried under vacuum for 6 min, then developed again to 90 mm with CHCl3/ethyl acetate/acetone/isopropanol/ethanol/methanol/water/acetic acid (30:6:6:6:16:28:6:2, by volume).
Chromatogram staining
After development, plates were stained with Nile Red according to the method of Fowler [12]. Briefly, plates were dipped into 8 μg/ml Nile Red in 80% methanol for 3 s and dried for 10 min at 110 °C. Plates were destained with 1:2,500 bleach by dipping for 1 s and dried at 110 °C for 30 min. Alternately, plates were sprayed uniformly with 10% cupric sulfate in 8% aqueous phosphoric acid, allowed to dry 10 min at room temperature, and then placed into a 145 °C oven for 10 min [2, 3].
Chromatogram visualization
Densitometric detection of cupric-sulfate-charred plates was carried out using the CAMAG TLC Scanner 3 (CAMAG). Initial scans were carried out using the spectral analysis option, enabling determination of an absorbance maximum of 535 nm; subsequent scans used a monochromator setting of 535 nm. Fluorescence was quantitatively assessed using the ProExpress multi-wavelength imager (Perkin Elmer, Boston, MA, USA). Nile Red signal was assessed optimally with excitation and emission filters of 540/30 and 620/25, respectively, while the cupric-sulfate-based signal was optimally detected with the 540/30 and 590/20 filter sets. Images were also acquired using a simple UV trans-illuminator and digital camera (BioDoc-It system, UVP, Upland, CA, USA).
Image analysis
Digital images of the chromatograms were analyzed using ImageQuant 5.2 (GE Healthcare, Piscataway, NJ, USA). To quantify the samples on the plate, a uniform rectangular grid was drawn to encompass each band per dilution series at a given Rf value. The uncorrected pixel volume per band was measured by taking the sum of the pixels (16-bit grayscale image) that were encompassed within the grid.
Lower limits of detection and quantification
Here, we used the lower limit of detection (LLD) and quantification (LLQ) as being a predetermined level of statistical difference from the background noise on the plate. Background for each resolved lipid was calculated using the average pixel volume of three empty lanes with the same development Rf as the lipid in question. LLD and LLQ were determined as being the first dilution lanes in which the pixel volume exceeded three and ten standard deviations of the background measurements, respectively [38].
Spectrofluorometry
To generate a large quantity of the fluorophore, cholesterol was loaded in a uniform 180-mm-wide band every ~2 mm across a pre-washed and activated TLC plate using the CAMAG Linomat IV. Two such plates were vacuum-dried and subsequently visualized with cupric sulfate as described above. Fluorescence on the plates was verified by imaging with the ProXpress scanner before scraping and pooling the silica layer from each plate. The fluorophore was extracted from the silica gel by adding 25 ml of glacial acetic acid and rocking for 1 h at room temperature. Silica gel was removed from the solution by a series of three centrifugation steps (4,500 × g, 40 min, 4 °C), and the solution was concentrated by vacuum centrifugation for 16 h. The fluorescence of the resulting concentrate was verified using the Wallac Victor II Multilabel Fluorometer (Perkin Elmer). Fluorescence spectra were recorded on an SLM Series 2 luminometer (SLM Instruments, Urbana, IL, USA) with excitation at 540 nm and emission at 590 nm for the emission and excitation spectra, respectively.
Results and discussion
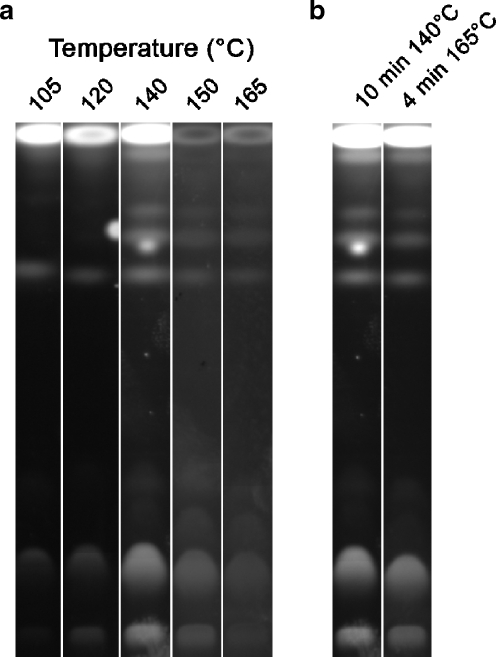
As literature reports vary somewhat regarding the time and temperature of charring, tests were done to identify ideal charring temperatures and times for cupric sulfate. Maximal fluorescence intensity was observed when the developed plate was sprayed with a thin coat of cupric sulfate, allowed to dry for 10 min at room temperature (tilted to prevent pooling of excess reagent), and then charred at 140–145 °C for 10 min (Fig. 1a). This was selected as the standard protocol for all subsequent analyses; however, it should be noted that comparable charring results were observed using shorter charring times at higher temperatures (Fig. 1b). The 10-min drying step did not affect the final fluorescent signal but tended to increase reproducibility between plates. Charring at temperatures below 140 °C was consistently less effective (Fig. 1a).
Fig. 1.
Effects of charring temperature on chromatogram fluorescence. a Ten-minute incubations at varied temperatures resulted in a maximal signal at 140 °C. b Comparable detection was observed with 10 min at 140 °C and 4 min at 165 °C. Images are representative of three separate experiments
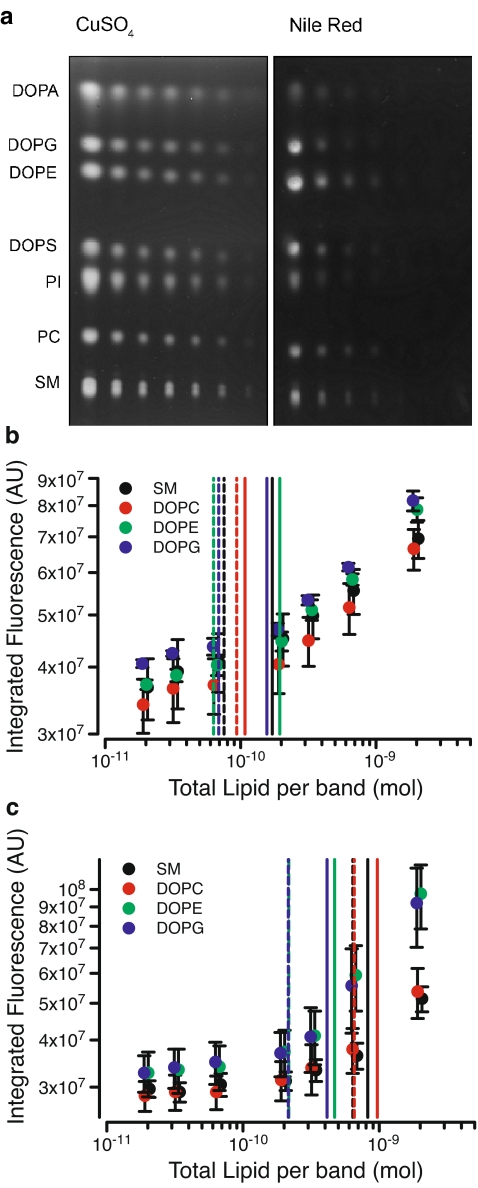
Staining of HPTLC plates with cupric sulfate yielded reproducible detection of a wide range of phospholipids with higher sensitivity than the commonly used fluorescent reagent Nile Red (Fig. 2). Comparable visualization of plates was also obtained using a simple UV light box and camera. On average, detection of phospholipids with cupric sulfate showed ~5.8-fold lower LLD and ~4.0-fold lower LLQ compared to Nile Red (Table 1). Relative to Nile Red, cupric sulfate also yielded reduced background staining and reduced staining of solvent fronts (data not shown). Moreover, the cupric sulfate protocol is simpler and considerably less expensive, with an estimated cost of 18¢ per plate.
Fig. 2.
Detection and quantification of phospholipids. a Fluorescence detection of the indicated phospholipids loaded (from left) with 150, 50, 25, 15, 5, 2.5, and 1.5 ng of each lipid per lane. Representative of three separate experiments. b Analysis of indicated phospholipids by cupric sulfate staining to determine LLD (dashed vertical lines) and LLQ (solid vertical lines). c Analysis of indicated phospholipids by Nile Red staining to determine LLD (dashed vertical lines) and LLQ (solid vertical lines); n = 3
Table 1.
Lower limits of detection and quantification of various phospholipid and sterol species (n = 3)
| CuSO4 detection method | Nile Red detection method | |||
|---|---|---|---|---|
| LLDa (pmol) | LLQb (pmol) | LLD (pmol) | LLQ (pmol) | |
| Lipid species | ||||
| SM | 75.4 ± 35.1 | 171.4 ± 34.3 | 637.8 ± 373.7 | 823.0 ± 379.0 |
| DAPC | 93.8 ± 12.6 | 108.1 ± 39.3 | 655.1 ± 339.8 | 966.7 ± 392.8 |
| DAPI (bovine brain) | 85.6 ± 35.7 | 264.7 ± 90.3 | 526.0 ± 310.5 | 715.8 ± 258.8 |
| DAPS | 99.1 ± 36.8 | 374.1 ± 112.5 | 618.5 ± 323.1 | 1271.5 ± 361.8 |
| DAPE | 63.2 ± 34.7 | 194.9 ± 64.1 | 216.4 ± 60.4 | 470.4 ± 82.3 |
| DAPG | 69.0 ± 30.5 | 156.8 ± 50.6 | 214.5 ± 109.1 | 414.0 ± 90.0 |
| DAPA | 73.3 ± 34.5 | 207.5 ± 71.4 | 368.3 ± 167.2 | 1262.2 ± 428.8 |
| Average | 79.9 ± 11.5 | 211.1 ± 34.3 | 462.4 ± 99.2 | 846.2 ± 122.6 |
| Sterol species | ||||
| Stigmasterol | 6.3 ± 11 × 10−3 | 3.9 ± 1.1 | N.D. | N.D. |
| Lanosterol | 2.6 ± 1.9 × 10⁻² | 15.6 ± 6.4 | 72.6 ± 18.7 | 515.6 ± 194.7 |
| Cholesterol | 9.7 ± 3.2 × 10⁻² | 6.5 ± 1.5 | 45.3 ± 12.4 | 646.6 ± 0 |
| Average | 4.3 ± 1.6 × 10⁻² | 8.7 ± 2.9 | 59.0 ± 12.3 | 581.1 ± 109.8 |
aThree standard deviations above background
bTen standard deviations above background
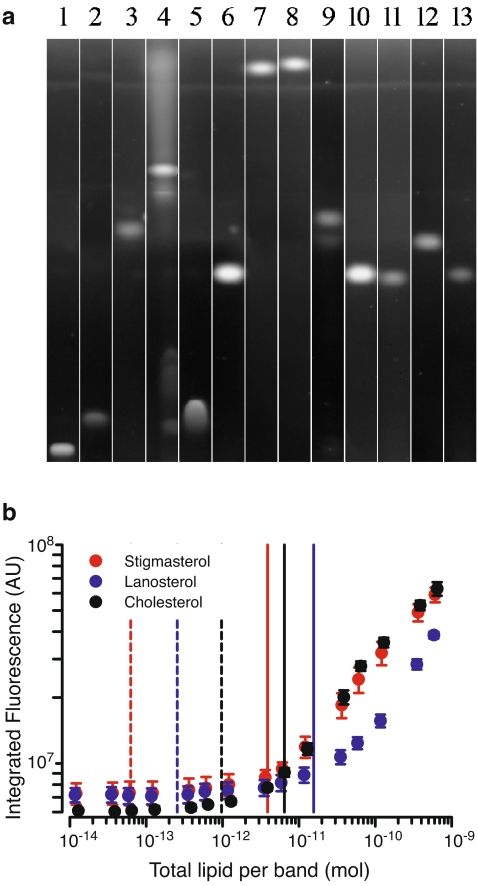
Despite previous results indicating that cupric sulfate was relatively insensitive to the degree of unsaturation using densitometric detection [4, 5, 39], we were not able to visualize fully saturated lipids using cupric-sulfate-based fluorescence detection (nor by densitometric detection; data not shown). Additionally, unsaturated hydrocarbons, such as the steroid precursor squalene, were detected, suggesting that the minimal requirement for fluorescent detection is at least one unsaturated carbon–carbon bond (data not shown). There was, however, a pronounced staining affinity for sterols (Fig. 3a). When resolved in parallel with neutral lipids, several sterols as well as saturated (18:0) and unsaturated (18:1Δ9) cholesteryl esters showed increased signal on plate. The average LLD of cholesterol, stigmasterol, and lanosterol were over three orders of magnitude more sensitive than for the same sterols detected by Nile Red and for phospholipids detected by cupric sulfate (Table 1, Fig. 3b). The average LLQ for sterols was 70-fold lower than for detection with Nile Red and 25-fold lower than that for phospholipids. Quantification of cholesterol using standard scanning densitometry after cupric sulfate charring yielded a LLD of ~9 pmol, approximately two orders of magnitude higher than that determined using fluorescent detection.
Fig. 3.
Detection and quantification of neutral lipids and sterols. a Cupric sulfate visualization of 750 μg each (1) CER, (2) MOG, (3) DOG, (4) TOG, (5) FA, and 50 μg each of (6) cholesterol, (7) 18:1 CE, (8) 18:0 CE, (9) lanosterol, (10) stigmasterol, (11) ergosterol, (12) cholestanol, (13) 7-dehydrocholesterol. Representative of five separate experiments. b Analysis of sterol staining to determine LLD (dashed vertical lines) and LLQ (solid vertical lines) for stigmasterol, lanosterol, and cholesterol (n = 4–5)
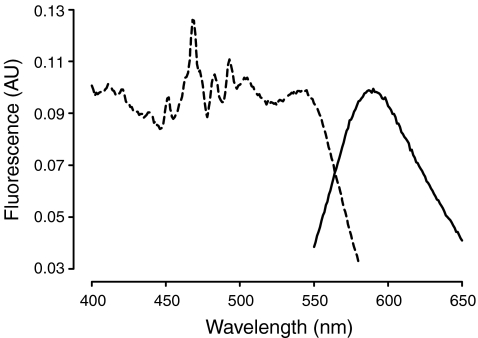
Extraction from silica gel of the fluorescent agent formed during cupric sulfate charring was possible using glacial acetic acid as a solvent. Spectrofluorometic measurements (Fig. 4) determined a single broad emission peak at 590 nm and multiple broad excitation peaks from 400 to 540 nm, with a prominent peak at 540 nm and a cluster of peaks from 450 to 505 nm (452, 468, 483, 493, 505 nm). All peaks below 540 nm were likely due to artifacts of the extraction process or degradation products from extended handling, as only the major peak at 540 nm was observed in direct excitation scans on plate (not shown).
Fig. 4.
Excitation (broken line) and emission spectra (solid line) of the fluorophore isolated from cupric-sulfate-treated TLC plate
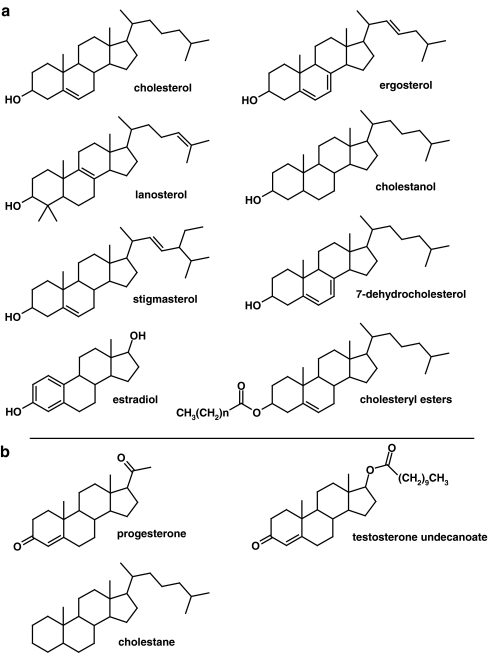
Assessment of fluorescence after cupric sulfate thus offers an improvement over existing techniques for the detection of various natural lipidic membrane components. This is a particularly marked improvement for the simple quantification of sterols and offers possible improvement in the detection of clinically relevant steroids. To this end, we investigated the use of cupric sulfate to detect the steroids estradiol, progesterone, and an esterified testosterone. Estradiol was detected with sensitivity comparable to cholesterol, but neither progesterone nor testosterone undecanoate were detected; unesterified testosterone was not readily available for analysis. To resolve this disparity, we sought to elucidate the sensitivity of this reagent for specific structural elements of sterols. The cupric sulfate method was observed to stain a wide range of sterols, including ergosterol (a yeast sterol), stigmasterol (a plant sterol), lanosterol, 7-dehydrocholesterol (metabolic precursors to cholesterol), and cholesteryl esters (Figs. 3a, 5a). In addition to the two steroids mentioned previously, cupric sulfate was unable to detect cholestane (Fig. 5b). These results suggest that the sterol ring structure alone is insufficient for detection, but the presence of either an OH or ester group at the C3 position is. Unlike phospholipids, detection of sterols was independent of the presence of double bonds within the molecule, as demonstrated by similar detection of cholestanol (having no double bonding within the ring structure) and 7-dehydrocholesterol (having two carbon–carbon double bonds within the ring structure; Fig. 3a). Unsaturation in either the C17 hydrocarbon tail of the sterols or the fatty acid ester of the cholesteryl esters also had little effect on staining, as is evident from comparable detection of both ergosterol and 7-dehydroergosterol and both cholesteryl stearate and cholesteryl oleate. Altering the staining solution to simply 8% phosphoric acid without cupric sulfate retained the ability to detect sterols on plate; however, the sensitivity towards neutral and phospholipids was dramatically reduced. This suggests that fluorophore generation is acid-dependent, but is augmented by inclusion of cupric sulfate, perhaps in a catalytic role.
Fig. 5.
Structural variation in sterols detected by cupric sulfate fluorescence. a Sterols detected by the cupric sulfate method. b Sterols not detected with the cupric sulfate method
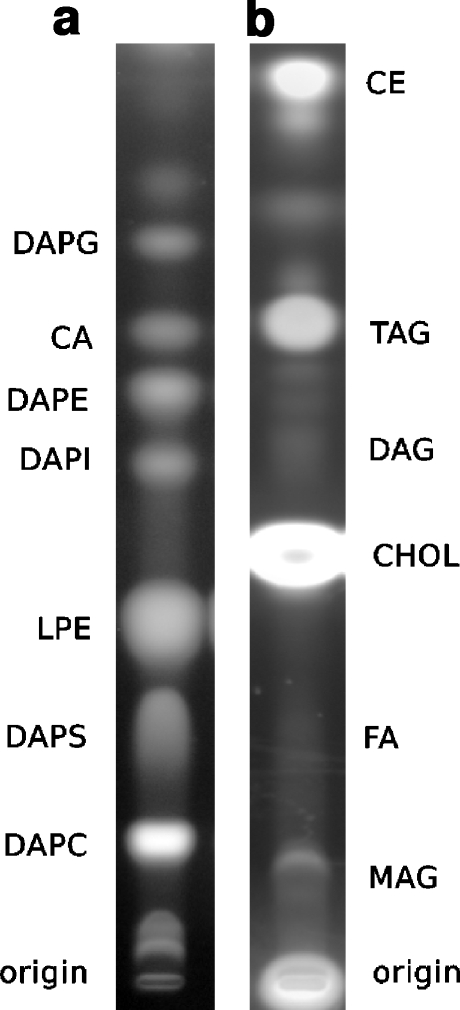
The analysis of CV membrane lipids by HPTLC and fluorescent cupric sulfate detection (Fig. 6, Table 2) showed enrichment in cholesterol, as previously reported [21]. Other high abundance lipids include triglycerides and phosphatidylcholines. To verify the efficacy of the method, parallel determinations of cholesterol were carried out on-plate with cupric sulfate and using a sensitive standardized enzymatic quantification. Both methods gave identical results (Table 3), and the measured cholesterol to phospholipid ratios were consistent with earlier reports in CV and with published values for other secretory vesicle types [21, 31]. Phosphatidylcholine was the most abundant phospholipid, and despite the high enrichment in cholesterol, cholesteryl esters quantitatively constitute <1% of total CV lipid. The total phospholipid to protein ratio was 0.41 ± 0.03 (w/w). These data are consistent with the measured phospholipid to protein ratio, cholesterol to phospholipid ratio, and the general phospholipid makeup of rat brain synaptic vesicles (SV) as analyzed by nano-electrospray ionization tandem mass spectrometry [31]. The relative enrichment of CV and SV in negative curvature lipids, including cholesterol and DAPE [21, 31], is consistent with the demonstrated significance of their negative curvature contribution to the formation of the hemi-fusion stalk intermediate during membrane merger [22]. In total, lipids of high negative curvature (including cholesterol, CA, DAPE, and DAG) constitute ~35% of the total lipids, and if probable roles of FA are added to this, we find an initial total of ~42% of lipids potentially capable of directly supporting and facilitating the bilayer merger mechanism—and we have not yet begun to analyze the endogenous tocopherols/tocotrienols [40]. At ~2% of total lipids (~5% of phospholipids), DAPI may contribute either as a signaling molecule or as the precursor to DAG, thereby potentially increasing negative curvature lipid plus FA levels to almost 45%. Alternately, if DAPI is considered with other anionic species (DAPS, DAPG, CA), these total ~15% of all lipid species, suggesting that their potential roles in membrane merger should be further analyzed, as should the contributions of other major species such as TAG and MAG that together constitute almost 30% of the total lipid.
Fig. 6.
High-resolution HPTLC analysis of CV membrane phospholipids (a) and neutral lipids and sterols (b)
Table 2.
Total CV neutral lipid, phospholipid, and sterol composition (n = 3)
| Distribution (mol %) | |
|---|---|
| Lipid | |
| CHOL | 23.6 ± 0.9 |
| TAG | 23.2 ± 1.1 |
| DAPC | 14.5 ± 2.2 |
| FA | 6.9 ± 0.2 |
| DAPS | 5.9 ± 0.9 |
| MAG | 5.8 ± 0.3 |
| LPE | 5.6 ± 0.3 |
| CA | 5.6 ± 0.9 |
| DAPE | 4.0 ± 0.4 |
| DAPI | 2.0 ± 0.1 |
| DAPG | 1.8 ± 0.3 |
| CE | 0.60 ± 0.03 |
| DAG | 0.54 ± 0.01 |
| SM | <0.15 |
| Phospholipid | |
| DAPC | 36.9 ± 5.5 |
| DAPS | 14.9 ± 2.3 |
| LPE | 14.3 ± 0.8 |
| CA | 14.1 ± 2.2 |
| DAPE | 10.2 ± 0.9 |
| DAPI | 5.1 ± 0.4 |
| DAPG | 4.6 ± 0.8 |
| SM | <0.4 |
Table 3.
Analysis of CV cholesterol content by on-plate or enzymatic detection
| Analytical method | Molar CV cholesterol to phospholipid ratio | CV cholesterol to protein ratio (w/w) |
|---|---|---|
| HPTLC | 0.58 ± 0.02 | 0.096 ± 0.003 |
| Cholesterol assay | 0.61 ± 0.02 | 0.101 ± 0.003 |
The use of cupric sulfate as a fluorometric staining reagent thus offers reproducible improvements over existing fluorescent reagents and the classic densitometric assessments after charring. Compared to the fluorescent reagent Nile Red, cupric sulfate offers significantly improved sensitivity of detection, ease of use, and reduced cost. This method is able to sensitively detect a wide range of biologically relevant sterols, requiring only a 3′-OH or ester linkage: This includes cholesterol, stigmasterol, lanosterol, ergosterol, cholestanol, and the cholesteryl esters. Similarly, the method is able to quantitatively detect unsaturated lipids, including phospholipids, neutral lipids, fatty acids, and hydrocarbons (such as squalene). Quantitative analyses of lipids and sterols are also possible using mass spectrometry (triple quadrupole instrument equipped with a nano-electrospray ionization source) [30–32, 41], though exhaustive characterization of the LLD and LLQ of different lipidic species has not been published. Relative to the on-plate method presented here, it would appear that sensitivities for quantification by mass spectrometry are comparable for phospholipids, but not as sensitive for cholesterol [30, 32]. Thus, as a straightforward routine technique, the on-plate detection method presented here, coupled with high-resolution automated multiple development HPTLC (or even more standard TLC protocols), will be an important complementary analytical tool for future large-scale lipid characterizations. To fully dissect underlying molecular mechanisms, one must be able to both identify and quantify essential molecules. Coupled with our development of a simple, high-sensitivity immunodetection protocol for quantitative protein analysis [42], the new approach presented here fully enables comparable analyses of lipids without the need for highly specialized infrastructure.
Acknowledgments
The authors wish to thank Paul P.M. Schnetkamp and Haider F. Altimimi for assistance with spectrofluorometry and Andrew Tang and Lauren Harris for helpful discussions. JRC acknowledges support from NSERC, CIHR, and AHFMR. MAC and DMB acknowledge support from NSERC.
Abbreviations
- CV
cortical vesicles
- DAPC
diacylphosphatidylcholine
- MAG
monoacylglycerol
- DAG
diacylglycerol
- TAG
triacylglycerol
- DAPE
diacylphosphatidylethanolamine
- DAPS
diacylphosphatidylserine
- DAPI
diacylphosphatidylinositol
- DAPA
diacylphosphatidic acid
- DAPG
diacylphosphatidylglycerol
- FA
fatty acids
- CE
cholesterol esters
- SM
sphingomyelin
- CER
ceramides
- CA
cardiolipin
- HPTLC
High-performance thin layer chromatography
Footnotes
Matthew A. Churchward and David M. Brandman contributed equally to the study.
References
- 1.Fewster ME, Burns BJ, Mead JF. Quantitative densitometric thin-layer chromatography of lipids using copper acetate reagent. J Chromatogr. 1969;43:120–126. doi: 10.1016/S0021-9673(00)99173-8. [DOI] [PubMed] [Google Scholar]
- 2.Touchstone JC, Levin SS, Dobbins MF, Matthews L, Beers PC, Gabbe SG. (3-sn-Phosphatidyl)cholines (lecithins) in amniotic fluid. Clin Chem. 1983;29:1951–1954. [PubMed] [Google Scholar]
- 3.Entezami AA, Venables BJ, Daugherty KE. Analysis of lipids by one-dimensional thin-layer chromatography. J Chromatogr. 1987;387:323–331. doi: 10.1016/S0021-9673(01)94535-2. [DOI] [PubMed] [Google Scholar]
- 4.Baron CB, Coburn RF. Comparison of two copper reagents for detection of saturated and unsaturated neutral lipids by charring densitometry. J Liquid Chromatogr. 1984;7:2793–2801. doi: 10.1080/01483918408067046. [DOI] [Google Scholar]
- 5.Touchstone JC, Levin SS, Dobbins MF, Carter PJ. Differentiation of saturated and unsaturated phospholipids on thin layer chromatograms. J High Resolut Chromatogr Commun. 1981;4:423–424. doi: 10.1002/jhrc.1240040816. [DOI] [Google Scholar]
- 6.Wang X, Xu L, Zheng L. Cloning and expression of phosphatidylcholine-hydrolyzing phospholipase D from Ricinus communis L. J Biol Chem. 1994;269:20312–20317. [PubMed] [Google Scholar]
- 7.Moe MK, Anderssen T, Strom MB, Jensen E. Total structure characterization of unsaturated acidic phospholipids provided by vicinal di-hydroxylation of fatty acid double bonds and negative electrospray ionization mass spectrometry. J Am Soc Mass Spectrom. 2005;16:46–59. doi: 10.1016/j.jasms.2004.09.014. [DOI] [PubMed] [Google Scholar]
- 8.Flieger A, Gong S, Faigle M, Northoff H, Neumeister B. In vitro secretion kinetics of proteins from Legionella pneumophila in comparison to proteins from non-pneumophila species. Microbiology. 2001;147:3127–3134. doi: 10.1099/00221287-147-11-3127. [DOI] [PubMed] [Google Scholar]
- 9.Bitsanis D, Crawford MA, Moodley T, Holmsen H, Ghebremeskel K, Djahanbakhch O. Arachidonic acid predominates in the membrane phosphoglycerides of the early and term human placenta. J Nutr. 2005;135:2566–2571. doi: 10.1093/jn/135.11.2566. [DOI] [PubMed] [Google Scholar]
- 10.Kirchner JG, Miller JM, Keller GJ. Separation and identification of some terpenes by new chromatographic technique. Anal Chem. 1951;23:420–425. doi: 10.1021/ac60051a008. [DOI] [Google Scholar]
- 11.Miller JM, Kirchner JG. Apparatus for preparation of chromatostrips. Anal Chem. 1954;26:2002. doi: 10.1021/ac60096a051. [DOI] [Google Scholar]
- 12.Fowler SD, Brown WJ, Warfel J, Greenspan P. Use of Nile Red for the rapid in situ quantitation of lipids on thin-layer chromatograms. J Lipid Res. 1987;28:1225–1232. [PubMed] [Google Scholar]
- 13.Muthing J, Radloff M. Nanogram detection of phospholipids on thin-layer chromatograms. Anal Biochem. 1998;257:67–70. doi: 10.1006/abio.1997.2504. [DOI] [PubMed] [Google Scholar]
- 14.Hyslop PA, York DA. The use of 1,6-diphenylhexatriene to detect lipids on thin-layer chromatograms. Anal Biochem. 1980;101:75–77. doi: 10.1016/0003-2697(80)90042-1. [DOI] [PubMed] [Google Scholar]
- 15.Coorssen JR, Blank PS, Tahara M, Zimmerberg J. Biochemical and functional studies of cortical vesicle fusion: the SNARE complex and Ca2+ sensitivity. J Cell Biol. 1998;143:1845–1857. doi: 10.1083/jcb.143.7.1845. [DOI] [PMC free article] [PubMed] [Google Scholar]
- 16.Coorssen JR, Blank PS, Albertorio F, Bezrukov L, Kolosova I, Chen X, Backlund PS, Jr, Zimmerberg J. Regulated secretion: SNARE density, vesicle fusion and calcium dependence. J Cell Sci. 2003;116:2087–2097. doi: 10.1242/jcs.00374. [DOI] [PubMed] [Google Scholar]
- 17.Vacquier VD. The isolation of intact cortical granules from sea urchin eggs: calcium ions trigger granule discharge. Dev Biol. 1975;43:62–74. doi: 10.1016/0012-1606(75)90131-1. [DOI] [PubMed] [Google Scholar]
- 18.Zimmerberg J, Blank PS, Kolosova I, Cho MS, Tahara M, Coorssen JR. A stage-specific preparation to study the Ca(2+)-triggered fusion steps of exocytosis: rationale and perspectives. Biochimie. 2000;82:303–314. doi: 10.1016/S0300-9084(00)00215-7. [DOI] [PubMed] [Google Scholar]
- 19.Vogel SS, Delaney K, Zimmerberg J. The sea urchin cortical reaction. A model system for studying the final steps of calcium-triggered vesicle fusion. Ann NY Acad Sci. 1991;635:35–44. doi: 10.1111/j.1749-6632.1991.tb36479.x. [DOI] [PubMed] [Google Scholar]
- 20.Vogel SS, Chernomordik LV, Zimmerberg J. Calcium-triggered fusion of exocytotic granules requires proteins in only one membrane. J Biol Chem. 1992;267:25640–25643. [PubMed] [Google Scholar]
- 21.Churchward MA, Rogasevskaia T, Hofgen J, Bau J, Coorssen JR. Cholesterol facilitates the native mechanism of Ca2+-triggered membrane fusion. J Cell Sci. 2005;118:4833–4848. doi: 10.1242/jcs.02601. [DOI] [PubMed] [Google Scholar]
- 22.Churchward MA, Rogasevskaia T, Brandman DM, Khosravani H, Nava P, Atkinson JK, Coorssen J. Specific lipids supply critical intrinsic negative curvature—an essential component of native Ca2+-triggered membrane fusion. Biophys J. 2008;94:3976–3986. doi: 10.1529/biophysj.107.123984. [DOI] [PMC free article] [PubMed] [Google Scholar]
- 23.Rogasevskaia T, Coorssen JR. Sphingomyelin-enriched microdomains define the efficiency of native Ca(2+)-triggered membrane fusion. J Cell Sci. 2006;119:2688–2694. doi: 10.1242/jcs.03007. [DOI] [PubMed] [Google Scholar]
- 24.Efrat A, Chernomordik LV, Kozlov MM. Point-like protrusion as a prestalk intermediate in membrane fusion pathway. Biophys J. 2007;92:L61–L63. doi: 10.1529/biophysj.106.103341. [DOI] [PMC free article] [PubMed] [Google Scholar]
- 25.Kozlov MM, Markin VS. Possible mechanism of membrane fusion. Biofizika. 1983;28:242–247. [PubMed] [Google Scholar]
- 26.Kozlovsky Y, Efrat A, Siegel DP, Kozlov MM. Stalk phase formation: effects of dehydration and saddle splay modulus. Biophys J. 2004;87:2508–2521. doi: 10.1529/biophysj.103.038075. [DOI] [PMC free article] [PubMed] [Google Scholar]
- 27.Leikin SL, Kozlov MM, Chernomordik LV, Markin VS, Chizmadzhev YA. Membrane fusion: overcoming of the hydration barrier and local restructuring. J Theor Biol. 1987;129:411–425. doi: 10.1016/S0022-5193(87)80021-8. [DOI] [PubMed] [Google Scholar]
- 28.Markin VS, Kozlov MM, Borovjagin VL. On the theory of membrane fusion. The stalk mechanism. Gen Physiol Biophys. 1984;3:361–377. [PubMed] [Google Scholar]
- 29.Siegel DP. The modified stalk mechanism of lamellar/inverted phase transitions and its implications for membrane fusion. Biophys J. 1999;76:291–313. doi: 10.1016/S0006-3495(99)77197-3. [DOI] [PMC free article] [PubMed] [Google Scholar]
- 30.Brugger B, Erben G, Sandhoff R, Wieland FT, Lehmann WD. Quantitative analysis of biological membrane lipids at the low picomole level by nano-electrospray ionization tandem mass spectrometry. Proc Natl Acad Sci U S A. 1997;94:2339–2344. doi: 10.1073/pnas.94.6.2339. [DOI] [PMC free article] [PubMed] [Google Scholar]
- 31.Takamori S, Holt M, Stenius K, Lemke EA, Gronborg M, Riedel D, Urlaub H, Schenck S, Brugger B, Ringler P, Muller SA, Rammner B, Grater F, Hub JS, Groot BL, Mieskes G, Moriyama Y, Klingauf J, Grubmuller H, Heuser J, Wieland F, Jahn R. Molecular anatomy of a trafficking organelle. Cell. 2006;127:831–846. doi: 10.1016/j.cell.2006.10.030. [DOI] [PubMed] [Google Scholar]
- 32.Sandhoff R, Brugger B, Jeckel D, Lehmann WD, Wieland FT. Determination of cholesterol at the low picomole level by nano-electrospray ionization tandem mass spectrometry. J Lipid Res. 1999;40:126–132. [PubMed] [Google Scholar]
- 33.Hibbert JE, Butt RH, Coorssen JR. Actin is not an essential component in the mechanism of calcium-triggered vesicle fusion. Int J Biochem Cell Biol. 2006;38:461–471. doi: 10.1016/j.biocel.2005.10.008. [DOI] [PubMed] [Google Scholar]
- 34.Bligh EG, Dyer WJ. A rapid method of total lipid extraction and purification. Can J Biochem Physiol. 1959;37:911–917. doi: 10.1139/o59-099. [DOI] [PubMed] [Google Scholar]
- 35.Pettitt TR, Dove SK, Lubben A, Calaminus SD, Wakelam MJ. Analysis of intact phosphoinositides in biological samples. J Lipid Res. 2006;47:1588–1596. doi: 10.1194/jlr.D600004-JLR200. [DOI] [PubMed] [Google Scholar]
- 36.Churchward MA, Butt RH, Lang JC, Hsu KK, Coorssen JR. Enhanced detergent extraction for analysis of membrane proteomes by two-dimensional gel electrophoresis. Proteome Sci. 2005;3:5. doi: 10.1186/1477-5956-3-5. [DOI] [PMC free article] [PubMed] [Google Scholar]
- 37.Weerheim AM, Kolb AM, Sturk A, Nieuwland R. Phospholipid composition of cell-derived microparticles determined by one-dimensional high-performance thin-layer chromatography. Anal Biochem. 2002;302:191–198. doi: 10.1006/abio.2001.5552. [DOI] [PubMed] [Google Scholar]
- 38.Long GL, Winefordner JD. Limit of detection. Anal Chem. 1983;55:A712–&. doi: 10.1021/ac00258a001. [DOI] [Google Scholar]
- 39.Spillman T, Cotton DB, Lynn SC, Jr, Bretaudiere JP. Influence of phospholipid saturation on classical thin-layer chromatographic detection methods and its effect on amniotic fluid lecithin/sphingomyelin ratio determinations. Clin Chem. 1983;29:250–255. [PubMed] [Google Scholar]
- 40.Rodríguez-Bernaldo De Quirós A, López-Hernández J, Simal-Lozano J. Determination of carotenoids and liposoluble vitamins in sea urchin (Paracentrotus lividus) by high performance liquid chromatography. European Food Research and Technology. 2001;212:687–690. doi: 10.1007/s002170100316. [DOI] [Google Scholar]
- 41.Brugger B, Sandhoff R, Wegehingel S, Gorgas K, Malsam J, Helms JB, Lehmann WD, Nickel W, Wieland FT. Evidence for segregation of sphingomyelin and cholesterol during formation of COPI-coated vesicles. J Cell Biol. 2000;151:507–518. doi: 10.1083/jcb.151.3.507. [DOI] [PMC free article] [PubMed] [Google Scholar]
- 42.Coorssen JR, Blank PS, Albertorio F, Bezrukov L, Kolosova I, Backlund PS, Jr, Zimmerberg J. Quantitative femto-to attomole immunodetection of regulated secretory vesicle proteins critical to exocytosis. Anal Biochem. 2002;307:54–62. doi: 10.1016/S0003-2697(02)00015-5. [DOI] [PubMed] [Google Scholar]


