

Abstract
Joint loading is a recently developed loading modality that induces anabolic responses by lateral loads applied to a synovial joint such as an elbow and a knee. The present study extended this loading modality to an ankle and addressed a question: does ankle loading promote bone formation in the tibia? If so, what signaling pathways are involved in the anabolic responses? Using C57BL/6 female mice as a model system, lateral loads of 0.5 N were applied to the ankle at 5 Hz for 3 min/day for 3 consecutive days and load-driven bone formation was evaluated at three tibial cross-sections (the proximal, middle, and distal diaphysis). Furthermore, total RNA was isolated for 3 pairs of microarray experiments as well as quantitative real-time PCR analyses. The histomorphometric results revealed that in all cross-sections ankle loading elevated the cortical area and thickness as well as the calcein-labeled surface. Signaling pathway analysis from microarray-derived whole-genome mRNA expression profiles and quantitative real-time PCR predicted that molecules in phosphoinositide 3-kinase (PI3K), ECM-receptor interactions, TGFβ signaling, and Wnt signaling were involved in the joint-loading driven responses. Since ankle loading stimulates bone formation throughout the tibia both in the endosteum and the periosteum, it may provide a non-pharmacological approach to effectively activate molecular signaling necessary for preventing bone loss.
Keywords: mechanical loading, anabolic responses, microarray, molecular signaling
Introduction
Mechanical stimuli play an important role in regulating bone shape and strength [1-3]. Various loading modalities such as whole-body vibration [4, 5], axial loading [6], and bending [7, 8] have been employed to increase bone mass and also to understand the mechanisms that underlay load-driven bone remodeling. Joint loading is one of the more recently developed modalities, in which non-habitual loads are applied to a synovial joint to stimulate bone formation in long bones. Knee loading [9, 10] and elbow loading [11], producing small mechanical strains (< 50 μstrain), have been demonstrated as an effective means to activate bone formation in the tibia, femur and ulna, respectively. Unlike other loading modalities such as axial loading and four-point bending, it does not appear to depend on load-induced strain at a site of bone formation. The present study was designed to examine loading of the ankle joint focusing on load-driven signaling pathways predicted from genome-wide mRNA expression profiles as well as efficacy in inducing cortical bone formation on the periosteal and endosteal surfaces of the tibia.
Previous mouse studies show that bone formation at the periosteum can be induced by most loading modalities, but their efficacy at the endosteum is not consistently demonstrated (Table 1). In tibiae, loading modalities that provoke a significant increase in bone formation rate both in the periosteal and endosteal surfaces include axial [14] and knee loading [9, 20] in mouse studies together with four-point bending in rat studies [21, 22]. In our previous mouse studies, we observed that sensitivity of the endosteum to knee loading differed among the proximal, middle, and distal cross sections [9, 20]. We also noticed that the basal bone formation rate of control animals (no loading) was variable among the sections [9, 20]. Those results suggest that homeostasis of the tibial endosteum is not uniform along its length.
Table 1.
Summary of loading effects on the periosteum and endosteum in the mouse diaphysis
| loading method | target bone | mouse strain | bone formation rate | reference | |
|---|---|---|---|---|---|
| periosteum | endosteum | ||||
| axial loading | ulna | CD1 | p < 0.01 | p < 0.05 | [12] |
| C57BL/6 | p < 0.01 | no data | [6] | ||
| C3H/He, C57BL/6, DBA/2 | p < 0.01 | no data | [13] | ||
| tibia | C57BL/6 | p < 0.05 (proximal) | n.s. | ||
| p < 0.05 (middle) | n.s. | [14] | |||
| p < 0.01 (distal) | p < 0.05 (distal) | ||||
| bending | tibia | C57BL/6 | p < 0.05 | n.s. | [8, 15] |
| vibration | tibia | BALB/cByJ | n.s. | n.s. | [16] |
| climbing | femur | C57BL/6 | p < 0.05 | n.s. | [17] |
| running | femur | ddY | p < 0.05 | n.s. | [18] |
| jumping | tibia | C57BL/6 | p < 0.05 | n.s. | [19] |
| C3H/He | n.s. | n.s. | |||
| elbow loading* | ulna | C57BL/6 | p < 0.01 | no data | [11] |
| knee loading* | tibia | C57BL/6 | p < 0.01 (proximal) | n.s. (proximal) | [9, 20] |
| p < 0.01 (middle) | n.s. (middle) | ||||
| p < 0.01 (distal) | p < 0.01 (distal) | ||||
| femur | p < 0.01 (middle) | n.s. (middle) | [10] | ||
Note: The asterisk (*) indicates that p values vary depending on loading frequencies. n.s. = no statistical significance.
Focusing on load-driven bone formation in the tibiae, we addressed two questions in the current study. The first question was: Does ankle loading induce bone formation in a tibial diaphysis on the periosteal and endosteal surfaces? More specifically, are anabolic responses stronger in the distal cross-section closer to the ankle or in the proximal cross-section away from the ankle? Previous knee loading studies suggest two possibilities: 1) responsiveness of both the periosteal and endosteal surfaces is greatest close to the loading site; and 2) regardless of the loading site, specific tibial sites are always more sensitive to the loading stimulus. The ankle is tightly bound by the deltoid ligament together with three lateral ligaments and less surrounded by soft connective tissues than the knee. In addition, the talus and the tibia are articulated without inclusion of the fibula in mouse [23]. We thus hypothesized that ankle loading would offer a potent stimulus for induction of bone formation throughout the tibia on the periosteum and endosteum.
The second question was: What signaling pathways are involved in joint loading? The approach employed in the current study was a whole-genome microarray analysis using 3 sets of RNA samples. In response to ankle loading for 3 consecutive days, 3 pairs of tibia samples (control and loaded) were harvested at 49 h after the first loading (i.e., 1 h after the third loading). We hypothesized that in those samples mRNA expression levels of both stress responsive genes (such as c-fos and egr1) and anabolic genes (such as type I collagen and osteocalcin) would be elevated. We also hypothesized that joint loading would activate signal pathways that are considered to be involved in mechanotransduction and bone metabolism. Molecular pathways were predicted using Pathway-Express software, and the temporal expression patterns of the selected stress-responsive and anabolic genes were evaluated with quantitative real-time PCR using the samples harvested at 1 h, 1 week, and 2 weeks after the last loading.
Materials and methods
Experimental design
Experimental procedures were approved by the Indiana University Animal Care and Use Committee and were in compliance with the Guiding Principles in the Care and Use of Animals endorsed by the American Physiological Society. Thirty-nine C57BL/6 female mice (∼ 14 weeks of age, and a body weight of ∼ 20 g; Harlan Sprague-Dawley, Inc., Indianapolis, IN) were used. Four to five mice were housed per cage and they were fed with mouse chow and water ad libitum. The animals were allowed to acclimate for 2 weeks before the experiment.
Ankle loading
The mouse was placed in an anesthetic induction chamber to cause sedation and then mask-anesthetized using 1.5% isoflurane. Ankle loading was conducted with the custom-made piezoelectric mechanical loader that was previously used for knee loading [9, 10]. In brief, loads were applied for 3 min/day for 3 consecutive days to the left ankle in the lateral-medial direction. The loading rod and the stator were in contact with the distal end of the tibia (lateral and medial malleoli), and 0.5 N force (peak-to-peak) was applied at 5 Hz (Fig. 1). The right hindlimb was used as a sham loading control, where the right ankle was placed under the loading rod for 3 min in the same procedure used for the left ankle without applying a voltage signal to the loader. After loading, the mouse was allowed normal cage activities. On days 2 and 7 after the third loading, the mice were given an intraperitoneal injection of calcein (Sigma, St. Louis, MO), a fluorochrome dye, at 30 μg/g body mass.
FIG. 1.
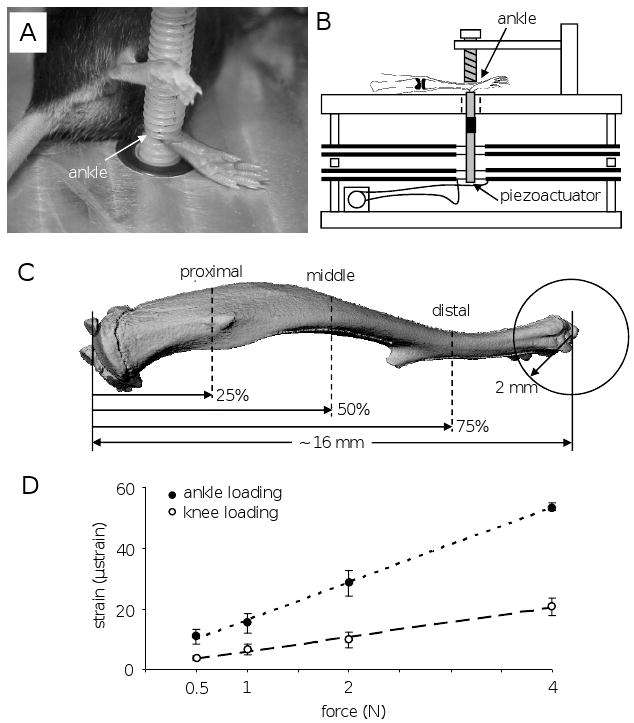
Experimental setup. (A) Mouse on a loading table for ankle loading. (B) Schematic diagram illustrating the piezoelectric mechanical loader. (C) Location of three cross-sections for bone morphometry. (D) Strain measurements with ankle and knee loading. The best-fit regression line is: y = 12.4 x + 3.7 with ankle loading (r2 = 0.99), and y = 4.8 x + 1.2 with knee loading (r2 = 0.99).
Strain measurements with ankle loading and knee loading
To evaluate in situ strains in the tibia, strain measurements were conducted using four mice and the procedure previously described [9, 10]. A strain gauge of a single element type with 0.7 mm in width and 2.8 mm in length (Model EA-06-015DJ-120, Measurements Group Inc., NC, USA) was glued to the medial periosteal surface at the middle site (50% from the both ends). The ankle was loaded at 5 Hz with 0.5, 1, 2 and 4 N (peak-to-peak) in the lateral-medial direction. Strain data in response to knee loading were also collected using the same loading condition. The measurement was repeated 5 times and the peak-to-peak voltage was converted to the strain value.
Bone sample preparation
Eighteen animals were sacrificed 2 weeks after the third loading for bone histomorphometry. The left and right tibiae were harvested and cleaned of soft tissues. The proximal and distal ends were cleaved to allow infiltration of fixative containing 10% neutral buffered formalin. After 48 hours in the fixatives samples were transferred to 70% alcohol for storage.
Bone histomorphometry
Bone histomorphometry was conducted as reported previously [9, 10]. Specimens were embedded in methyl methacrylate (Aldrich Chemical Co., Milwaukee, WI) and transverse sections were prepared at ∼ 4 mm (proximal cross-section), ∼ 8 mm (middle cross-section), and ∼ 12 mm (distal cross-section) distant from the proximal end of the tibia (Fig. 1). The cross-sectional cortical area was determined by subtracting the bone medullary area from the total bone cross-sectional area. The cortical thickness was defined as the mean distance between the endosteal and periosteal surfaces on three tibial sides (medial, lateral, and posterior). From fluorescent labeling, the calcein-labeled surface was defined as “percentage of labeled surface to total bone surface” [18, 24]. Using measurements such as total perimeter (B.Pm), single-labeled perimeter (sL.Pm), double-labeled perimeter (dL.Pm), and double-labeled area (dL.Ar), we derived mineralizing surface (MS/BS = [1/2sL.Pm + dL.Pm]/B.Pm in %), mineral apposition rate (MAR = dL.Ar/dL.Pm divided by 5 days in μm/day), and bone formation rate (BFR/BS = MAR × MS/BS × 365 in μm3/μm2 per year). The relative values were calculated as ([L - N]//N X 100 in %), where L = “loaded” and N = “non-loaded.”
mRNA isolation
Seventeen mice were used for determining mRNA expression profiles. Bone samples were harvested from the left (loaded) and right (non-loaded) tibiae at 1 hr (7 mice), 1wk (7 mice) or 2 wks (3 mice) after the third loading on day 3. Note that since loading was conducted for 3 consecutive days, the harvest time defined above from the third loading did not include 2 loading days on days 1 and 2. Soft surrounding tissues were dissected out from the samples, which were then ground with a mortar and pestle in an RNeasy Plus lysis buffer. Tissue debris was removed using a QIA shredder spin column (Qiagen), and total RNA was isolated using a standard procedure with an RNeasy plus mini kit (Qiagen) [25].
Microarray analysis
Three pairs of the isolated RNA (loaded and non-loaded samples) at 1 h from the third loading (49 h from the first loading) were independently labeled with Agilent low RNA input fluorescent linear amplification kits and hybridized to six Agilent whole mouse genome microarrays (G4122F; 41,174 unique probes). Data were filtered to remove background noise, and a modified t-test was performed to identify a group of genes that were altered > 1.2-fold or < 0.8-fold with statistical significance at p < 0.05. The list of 441 genes identified above was imported into Pathway-Express, which was used to predict molecular signaling pathways through evaluation of an impact factor that accounts for contributions of the proportion of differentially regulated genes on the pathway [26].
Quantitative real-time PCR
Quantitative real-time PCR was conducted to validate the microarray data for the selected genes at 1 h after the third loading. It was also employed to examine the temporal expression profiles of the selected genes at 1 h, 1 week, and 2 weeks after the third loading. Using approximately 50 ng of total RNA, reverse transcription was conducted with high capacity cDNA reverse transcription kits (Applied Biosystems). Quantitative real-time PCR was performed using ABI 7500 with Power SYBR green PCR master mix kits (Applied Biosystems) [27]. We evaluated the mRNA levels of 3 transcription factors (fbj osteosarcoma oncogene – c-fos, early growth response 1 – egr1, and activating transcription factor 3 – atf3) at 1 h from the third loading (49 h from the first loading), and 5 osteogenesis linked genes (type I collagen α1 -col1α, bone morphogenetic protein 2 – bmp2, osteopontin - opn, osteocalcin - ocn, and bone sialoprotein - bsp) at 1 h, 1 wk, and 2 wks. The PCR primers are listed in Table 2. The mRNA level of gapdh was used as an internal control to calibrate potential variations in cDNA concentrations. The relative mRNA levels were obtained with respect to the mRNA level of gapdh for each sample, and fold-changes were determined as a ratio of the mRNA levels in the loaded tibia to those in the non-loaded tibia. The ratio of 1, for instance, implies that there is no difference in mRNA levels between the two tibiae.
Table 2.
Real-time PCR primers employed in the study
| Gene | forward primer | backward primer |
|---|---|---|
| c-fos | 5′-AGGCCCAGTGGCTCAGAGA-3′ | 5′-CCAGTCTGCTGCATAGAAGGAA-3′ |
| egr1 | 5′-TCCGTTCCACCTGCTTTCC-3′ | 5′-GGAGAAAAGGTCCTGTCATG-3′ |
| atf3 | 5′-CGAAGACTGGAGCAAAATGATG-3′ | 5′-CAGGTTAGCAAAATCCTCAAATAC-3′ |
| col 1α1 | 5′- AAACTCCCTCCACCCCAATCT -3′ | 5′- TTTGGGTTGTTCGTCTGTTTCC -3′ |
| bmp2 | 5′-ACACAGGGACACACCAACCAT-3′ | 5′-TGTGACCAGCTGTGTTCATCTTG-3′ |
| osteopontin | 5′-ACACTTTCACTCCAATCGTCC-3′ | 5′-TGCCCTTTCCGTTGTTGTCC-3′ |
| osteocalcin | 5′-CCGGGAGCAGTGTGAGCTTA-3′ | 5′-AGGCGGTCTTCAAGCCATACT-3′ |
| bsp | 5′-ACCCCAAGCACAGACTTTTGA-3′ | 5′-CTTTCTGCATCTCCAGCCTTCT-3′ |
| gapdh | 5′- TGCACCACCAACTGCTTAG -3′ | 5′- GGATGCAGGGATGATGTTC -3′ |
Statistical analysis
The data were expressed as mean ± SEM. Statistical significance among the three cross-sections was examined using one-way ANOVA. For pair-wise comparisons a post-hoc test was conducted using Fisher's protected least significant difference. A paired t-test was employed to evaluate statistical significance between the loaded samples and non-loaded control samples. All comparisons were two-tailed and statistical significance was assumed at p < 0.05. The asterisks (*, **, and ***) represent p < 0.05, p < 0.01, and p < 0.001, respectively.
Results
The animals used for bone histomorphometry tolerated the procedures, and abnormal behavior including weight loss and diminished food intake were not observed. No bruising or tissue damage was detected at the loading site.
Strain measurements with ankle loading and knee loading
The strain in the middle tibia (50% from the both ends) was determined in response to ankle loading and knee loading using 0.5, 1, 2 and 4 N force at 5 Hz (Fig. 1D). The strain induced by ankle loading was approximately 2.6 times larger than that by knee loading, and it was 11 ± 3 μstrain (0.5 N), 15 ± 3 μstrain (1 N), 28 ± 4 μstrain (2 N), and 54 ± 1 μstrain (4 N). The slope of the best-fit regression line was 12.4 μstrain/N (ankle loading), and 4.8 μstrain/N (knee loading). In bone morphometry, we used the sinusoidal loads with 0.5 N.
Load-driven alteration in skeletal geometry
An enhancement in the cortical area and cortical thickness was observed with ankle loading (Fig. 2). Compared to the non-loaded control, the cross-sectional cortical area was increased approximately by 10% in all three sections (p < 0.001). Ankle loading increased it from 0.70 ± 0.01 mm2 to 0.77 ± 0.01 mm2 at the proximal site, 0.52 ± 0.01 mm2 to 0.57 ± 0.01 mm2 at the middle site, and 0.51 ± 0.01 mm2 to 0.56 ± 0.01 mm2 at the distal site. Similarly, the cortical thickness was increased from 0.143 ± 0.002 mm to 0.153 ± 0.002 mm at the proximal site (p <0.001), 0.177 ± 0.003 mm to 0.192 ± 0.002 mm at the middle site (p <0.001), and 0.209 ± 0.003 mm to 0.230 ± 0.002 mm at the distal site (p <0.001). Among the three sections, there was no statistical difference in the percent change in the cross-sectional cortical area (p = 0.99) or thickness (p = 0.53).
FIG. 2.
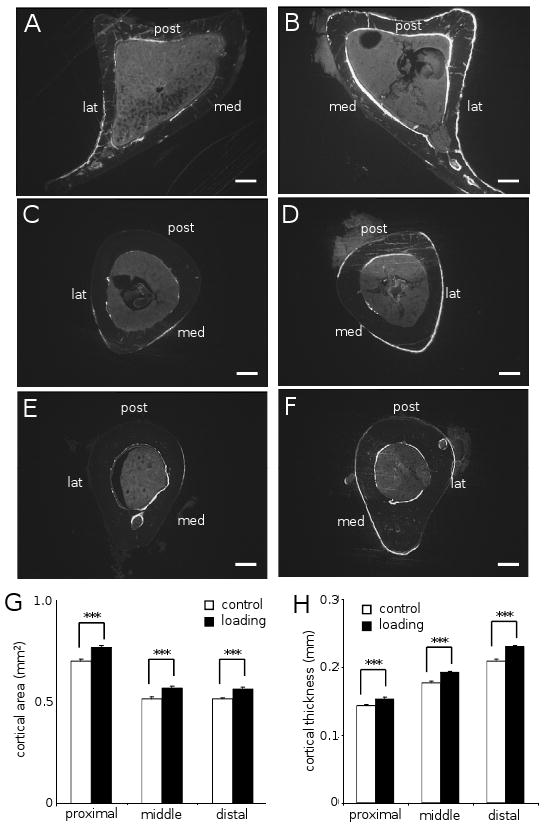
Tibial cross-sections and measurements of cortical area and thickness (n = 18). The labels in (A-F) are: medial surface (med), lateral surface (lat), and posterior surface (post). White bar = 200 μm. The results in (G & H) are expressed as mean ± SEM, and the triple asterisk indicates p < 0.001. (A) Control proximal section. (B) Loaded proximal section. (C) Control middle section. (D) Loaded middle section. (E) Control distal section. (F) Loaded distal section. (G) Cross-sectional area (mm2). (H) Cortical thickness (mm).
Elevation in calcein-labeled surface
Ankle loading promoted the calcein-labeled surface on both the periosteal and endosteal surfaces. On the periosteal surface, the calcein-labeled surface was increased from 22.8 ± 1.2% to 32.3 ± 1.9% (p < 0.001) in the proximal section, 44.0 ± 3.2% to 64.4 ± 1.4% (p < 0.001) in the middle section, and 34.1 ± 3.8% to 51.7 ± 4.2% (p < 0.01) in the distal section (Fig. 3A). On the endosteal surface, the calcein-labeled surface was elevated from 54.7 ± 4.0% to 77.2 ± 2.6% (p < 0.001) at the proximal site, and 45.7 ± 2.5% to 56.1 ± 2.7% (p < 0.01) at the middle site. Interestingly, no significant changes were observed on the endosteal surface of the distal site (Fig. 3B). Among the three cross-sections the distal site on the periosteal surface showed the highest calcein labeling. The p-values were, however, 0.08 (distal vs. proximal) and 0.19 (distal vs. middle), while the proximal site on the endosteal surface presented higher labeling than the distal (p < 0.01) and middle (p < 0.05) sites (Fig. 3C).
FIG. 3.

Percentage of the calcein-labeling surface to bone surface in the periosteum and the endosteum (n = 18). The results are expressed as mean ± SEM, and the asterisks show statistical significance at p < 0.05 (*), p < 0.01 (**) and p < 0.001 (***). (A) Periosteal labeling (%). (B) Endosteal labeling (%). (C) Increase in labeling (% of control) in the periosteum and the endosteum.
Bone formation in periosteal and endosteal surfaces
Ankle loading elevated bone formation both on the periosteal and endosteal surfaces, and load-driven bone formation was observed at the three cross-sections (Table 3). Compared to the non-loaded control, the maximum bone formation rate on the periosteal surface was observed at the distal site (2.4 times; p < 0.01). On the endosteal surface, however, the largest rate of bone formation was detected at the proximal site (2.4 times; p < 0.001). In order to further evaluate the effects of ankle loading, an increase in rMS/BS, rMAR, and rBFR/BS were determined and the percent change in three parameters was calculated (Fig. 4). On the periosteal surface, the distal site resulted in a significantly greater value of rMS/BS and rBFR/BS than the middle and proximal sites (all p < 0.05). The endosteal surface presented a larger rMAR in the proximal site (p < 0.05) and the middle site (p < 0.05) than the distal site. The change in rBFR/BS on the endosteal surface was significantly higher at the proximal site than that at the distal site (p < 0.05).
Table 3.
Increase in bone morphometric parameters with ankle loading
| MS/BS (%) | fold change (p value) | MAR (μm/day) | fold change (p value) | BFR/BS (μm3/μm2/yr) | fold change (p value) | ||
|---|---|---|---|---|---|---|---|
| Proximal section (near the knee) | |||||||
| periosteum | control | 16.76±1.94 | 1.5 X (<0.05) | 0.25±0.01 | 1.2 X (<0.001) | 16.01±2.48 | 1.7 X (<0.05) |
| loading | 24.65±3.19 | 0.30±0.01 | 26.77±3.29 | ||||
| endosteum | control | 55.67±8.27 | 1.8 X (<0.01) | 0.26±0.01 | 1.4 X (<0.001) | 53.61±8.67 | 2.4 X (<0.001) |
| loading | 97.52±11.73 | 0.35±0.02 | 127.52±18.15 | ||||
| Middle section | |||||||
| periosteum | control | 45.17±4.58 | 1.4 X (<0.01) | 0.28±0.01 | 1.2 X (<0.01) | 47.23±4.92 | 1.7 X (<0.001) |
| loading | 64.05±4.57 | 0.34±0.01 | 81.65±7.52 | ||||
| endosteum | control | 30.41±1.89 | 1.7 X (<0.01) | 0.25±0.01 | 1.3 X (<0.001) | 28.09±2.59 | 2.3 X (<0.01) |
| loading | 51.47±6.83 | 0.33±0.01 | 65.84±11.86 | ||||
| Distal section (near the ankle) | |||||||
| periosteum | control | 23.15±3.07 | 2.1 X (<0.001) | 0.25±0.01 | 1.2 X (<0.05) | 23.36±4.80 | 2.4X (<0.01) |
| loading | 47.60±4.95 | 0.31±0.02 | 55.76±7.80 | ||||
| endosteum | control | 31.79±3.03 | 1.4 X (<0.01) | 0.25±0.01 | 1.2 X (<0.05) | 30.09±3.58 | 1.6 X (<0.01) |
| loading | 45.64±2.97 | 0.29±0.01 | 49.53±4.60 | ||||
FIG. 4.

Increase in the morphometric parameters (n = 18). The results are expressed as mean ± SEM. The single asterisk indicates p < 0.05. (A) Increase in relative MS/BS (% of the control MS/BS value). (B) Increase in relative MAR (% of the control MAR value). (C) Increase in relative BFR/BS (% of the control BFR/BS value).
Prediction of molecular signaling pathways
Microarray analysis for the samples at 1 h after the third loading (49 h after the first loading) revealed that the mRNA levels of 242 genes and 199 genes were upregulated 1.2-fold or more (p < 0.05) and downregulated 0.8-fold or less (p < 0.05), respectively. In Fig. 5 that list 50 genes with a fold change either > 2.8-fold (25 genes) or < 0.29-fold (25 genes), the mRNA levels of three stress responsive transcription factors such as c-fos (3.2 fold; p = 0.02), egr1 (3.1 fold; p = 0.007), and atf3 (3.0 fold; p = 0.02) were elevated. Furthermore, the genes involved in ECM remodeling such as matrix metalloproteinase 3 (5.3 fold; p = 0.01), hyaluronan synthase 1 (4.1 fold; p = 0.006), tissue inhibitor of metalloproteinase 1 (3.6 fold; p = 0.02), and procollagen type IIIα (3.6 fold; p = 0.01) were also upregulated.
FIG. 5.
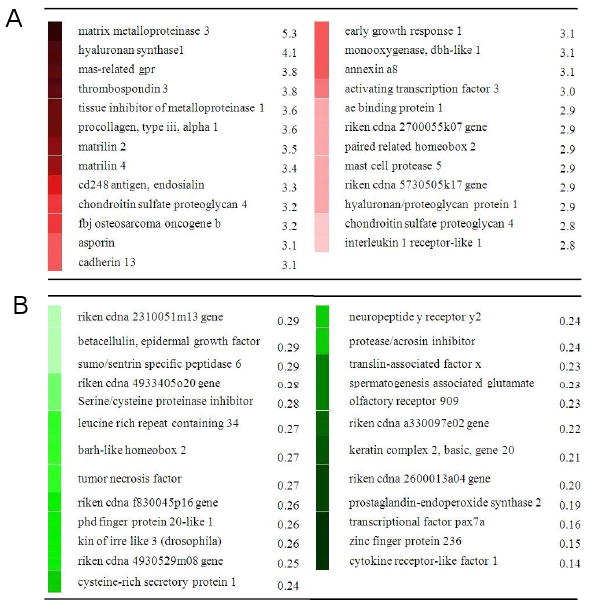
List of 50 genes significantly upregulated or downregulated in microarray-derived data. (A) Mostly upregulated 25 genes with ankle loading and their fold change. (B) Mostly downregulated 25 genes with ankle loading and their fold change.
Prediction with Pathway-Express based on a list of 441 genes highlighted four potential pathways including PI3K pathway (impact factor = 16.8), ECM-receptor interaction (16.3), TGFβ signaling pathway (13.6), and Wnt signaling pathway (8.3) (Fig. 6). Genes highlighted in those pathways include inositol 1,4,5-triphosphate 3-kinase and phospholipase C (plc) in PI3K, collagen (col3α1, col4α1, col6α1), integrin β4, and thrombospondin 3 in ECM-receptor interaction, TGFβ receptor 1 and smad1in TGFβ signaling pathway, and wnt2, frizzled 2 and Wnt1-inducible protein 2 in Wnt signaling pathway.
FIG. 6.
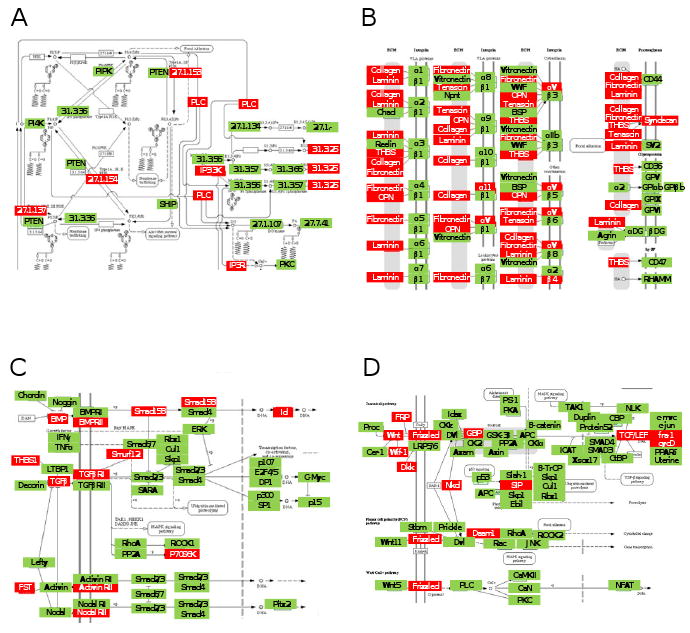
Load-driven signaling pathways predicted with ankle loading at 1 h after the last loading. In the network diagrams the mRNA levels of the genes in the red boxes were altered by ankle loading. (A) PI3K pathway. (B) ECM-receptor interaction. (C) TGFβ signaling pathway. (D) Wnt signaling pathway.
Evaluation of load-driven alterations in mRNA levels with real-time PCR
The mRNA levels of three transcription factors (c-fos, egr1, and atf3), whose upregulation at 1 h after the third loading was identified with microarrays, were evaluated by quantitative real-time PCR using 7 pairs of loaded and non-loaded tibia samples (Fig. 7A). The results were consistent to the microarray data. The mRNA levels in 7 mice were increased by 6.6 ± 1.7 times (mean ± SD; c-fos, p < 0.001), 3.5 ± 1.2 (egr1, p < 0.01), and 5.3 ± 3.5 (atf3, p < 0.05). Furthermore, the mRNA levels of the selected anabolic genes (col1α, bmp2, opn, ocn, and bsp) were evaluated at three time points (1h, 1 week, and 2 weeks after the third loading; Fig. 7B). At 1 hr after ankle loading (7 mice), col1α (p < 0.05) were upregulated. At 1 week after ankle loading (7 mice), significant increases were observed in the level of col1α (p < 0.01), opn (p < 0.05), ocn (p < 0.05), and bsp (p < 0.05). No significant change was, however, found for the selected genes at 2 weeks after loading (3 mice).
FIG. 7.

Alterations of mRNA levels with ankle loading. The harvest time (1 h, 1 week, or 2 weeks) is indicated from the last loading (day 3). (A) Elevated mRNA levels of c-fos, egr1, and atf3 at 1 h after the last loading for 7 mice. The amount of increases and decreases is color-coded in red and green, respectively. (B) Altered mRNA levels of col1α (type I collagen 1α), bmp2 (bone morphogenic protein 2), opn (osteopontin), ocn (osteocalcin), and bsp (bone sialoprotein) at three different time points after the last loading (7 mice at 1 h, 7 mice at 1 week, and 3 mice at 2 weeks). Upregulation and downregulation are colored coded in red and green, respectively.
Discussion
The present study describes histological and molecular analyses of load-driven responses with a novel form of joint loading – ankle loading – in the mouse tibia. Compared to knee loading, ankle loading induced approximately 2.6-fold larger strain on the periosteal surface and was more effective at inducing cortical bone formation on the endosteal surface [9, 20]. Since it is less surrounded by soft connective tissue with a fewer degrees of rotational freedom, the ankle may transmit lateral loads more effectively to the tibia than the knee [23]. Whole-genome microarray analyses predicted that signaling pathways such as PI3K, ECM-receptor interactions, TGFβ signaling, and Wnt signaling are involved in ankle loading-driven responses at 1 h after the third loading (49 h after the first loading). Quantitative real-time PCR showed that the mRNA levels of type Iα collagen, osteopontin, osteocalcin, and bone sialoprotein are elevated at 1 week after the third loading.
The present study reveals that responsiveness to ankle loading differs in the periosteum and the endosteum (Fig. 8A). Together with the previous knee loading studies using the same loading condition of 0.5 N at 5 Hz, our observation indicates dependence to the loading site was observed only in the periosteum. In the periosteum, the cross section closer to the loading site is more sensitive. It is the distal section close to the ankle with ankle loading and the proximal section near the knee with knee loading. In the endosteum, however, the proximal section near the knee is more responsive than the two other sections regardless of ankle or knee loading. The results show that in the endosteum the baseline rate of bone formation for control animals varies among the three sections and the highest rate is observed in the proximal section. The largest load-driven increase of bone formation rate in the endosteum apparently correlates to the highest baseline rate with both ankle and knee loading (Fig. 8B).
FIG. 8.

Summary of bone formation rate with joint loading. (A) Bone formation rate with ankle loading. Three cross-sections in the proximal, middle, and distal sites illustrate the rate of bone formation on the periosteal and endosteal surfaces. (B) Bone formation rate (BFR/BS) in the endosteum with ankle loading (n = 18) and knee loading (n = 8). The data with knee loading were taken from the studies published in (9, 20). All load-driven increases are statistically significant except for the proximal and middle sections with knee loading (p = 0.051 and 0.062, respectively).
The exact mechanism for the observed differential responses of the periosteal and endosteal surfaces is uncertain. It has been shown with knee loading that alterations in intramedullary pressure and load-driven molecular transport in the lacunocanalicular network are involved in anabolic responses [20, 28-30]. Namely, loads produce strains in the mineralized matrix of bone, and load-driven strains generate interstitial fluid flow in lacunocanalicular spaces [31]. We speculate that the enhanced bone formation on the periosteal surface could be due to pressure fluctuation in the medullary cavity and a subsequent increase in molecular transport and fluid flow in the lacunocanalicular network. The pressure fluctuation seems the strongest at the loading site and it attenuates as the distance from the loading site increases. We observed differential loading effects on the periosteal and endosteal surfaces. On the endosteal surface, we postulate that a local cellular or structural environment dominates over the distance from the loading site. The baseline bone formation rate without ankle or knee loading is highest in the proximal endosteum (Fig. 8B & Table 3), indicating that homeostasis of the endosteum is not identical along the length of the tibia [10, 32]. In response to ground-based vertical oscillation using sheep, an increase in the trabecular (and not cortical) bone density in the proximal femur is reported [5]. Since the proximal femur is not the closest to the site of stimulation, our site-dependent bone formation along the tibia presents similarity regarding the linkage to the loading site. Further investigation is needed to determine the exact mechanism of differential sensitivities [33-35].
The current study presents for the first time whole-genome mRNA expression profiles in response to joint loading. First, PI3K is known to be activated in response to various extracellular signals such as peptide growth factors, insulin, and insulin-like growth factors [36]. Insulin-like growth factors 1 and 2, for instance, can stimulate bone formation and healing of bone fracture [37-39]. Signaling pathways downstream of PI3K affect a wide range of cellular activities including cell growth, cell survival, and cell movement [40]. Second, mRNA levels of many collagens together with integrin, fibronectin, and laminin are altered in the pathway linked to ECM-receptor interactions [41]. Thus, our pathways analysis supports the notion that ankle loading stimulates remodeling of ECM. Note that previous mouse studies using four-point bending have identified signaling pathways that were linked to EGF receptors, fibronectins, and proteolysis [25], where fibronectins and proteolysis are involved in remodeling of ECM. Third, TGFβ signaling is known to influence diverse processes in embryogenesis, angiogenesis, inflammation, and wound healing. It also plays a major role in development and maintenance of cartilage and bone metabolism [42]. Lastly, Wnt signaling is one of the central pathways in regulating bone formation [43]. Mice with nonfunctional Lrp5 receptor in this pathway respond poorly to mechanical loading with significant reduction in bone formation compared with wildtype controls [44, 45]. In C57BL/6 osteoblasts it is reported that up-regulation of the Wnt pathway together with estrogen receptor, insulin-like growth factor-I, and bone morphogenetic protein pathways are involved in shear-induced mechanotransduction [46].
Real-time PCR results indicated that the mRNA levels of type Iα collagen and osteocalcin were continuously elevated from one hour to one week after the last loading (two to 9 days after the first loading), although the degree of alterations varied among individual mice. Two weeks after loading, however, no significant alterations of the selected genes were observed. Further analysis on temporal expression profiles should provide useful information on linkages of multiple signaling pathways. In addition, whole tibiae samples were employed in the current mRNA expression analysis, but mRNA expression patterns could vary depending on the locations along the length of the tibia as well as periosteal and endosteal surfaces. Note that the RNA samples were collected from the total tibia that included multiple cell types (e.g. osteocytes, osteoclasts, osteoblasts, and stromal cells). Thus, further studies are needed for investigation of potential pathway interactions among various types of cells [25].
In summary, the current study demonstrates that ankle loading is an effective means to induce bone formation throughout the tibial periosteal and endosteal diaphysis and it potentially induces multiple signaling pathways involved in mechanotransduction and bone metabolism. For preventing bone loss in the patients with osteoporosis, it is important to increase bone mass in the endosteum since a greater proportion of bone is remodeled on its endosteal surface [47, 48]. Ankle loading could with further research provide potential for slowing bone loss on the endosteal surface in the tibia while simultaneously adding more bone on the periosteal surface. Although the scope of the present study was limited to one loading condition (0.5 N at 5 Hz) and genome-wide molecular analysis at one time point, the data support the efficacy of ankle loading and its characteristic effects throughout the tibia. Understanding the mechanism of bone formation with ankle loading would contribute to future treatments and therapies for improving bone strength.
Acknowledgments
The authors thank M.X. Cui and D. Yang for sample preparation, E. Shmukler for data analysis, A. Hsu for useful discussion, and G.M. Malacinski for critical reading of the manuscript. This research is funded in part by grants NIH R03AR55322 to PZ and NIH R01AR52144 to HY.
Footnotes
Publisher's Disclaimer: This is a PDF file of an unedited manuscript that has been accepted for publication. As a service to our customers we are providing this early version of the manuscript. The manuscript will undergo copyediting, typesetting, and review of the resulting proof before it is published in its final citable form. Please note that during the production process errors may be discovered which could affect the content, and all legal disclaimers that apply to the journal pertain.
References
- 1.Burr DB, Robling AG, Turner CH. Effects of biomechanical stress on bones in animals. Bone. 2002;30:781–6. doi: 10.1016/s8756-3282(02)00707-x. [DOI] [PubMed] [Google Scholar]
- 2.Rubin J, Rubin C, Jacobs CR. Molecular pathways mediating mechanical signaling in bone. Gene. 2006;367:1–16. doi: 10.1016/j.gene.2005.10.028. [DOI] [PMC free article] [PubMed] [Google Scholar]
- 3.Rubin C, Turner AS, Muller R, Mittra E, McLeod K, Lin W, et al. Quantity and quality of trabecular bone in the femur are enhanced by a strongly anabolic, noninvasive mechanical intervention. J Bone Miner Res. 2002;17:349–57. doi: 10.1359/jbmr.2002.17.2.349. [DOI] [PubMed] [Google Scholar]
- 4.Flieger J, Karachalios T, Khaldi L, Raptou P, Lyritis G. Mechanical stimulation in the form of vibration prevents postmenopausal bone loss in ovariectomized rats. Calcif Tissue Int. 1998;63:510–4. doi: 10.1007/s002239900566. [DOI] [PubMed] [Google Scholar]
- 5.Rubin C, Turner AS, Bain S, Mallinckrodt C, McLeod K. Anabolism. Low Mechanical signals strengthen long bones. Nature. 201(412):603–4. doi: 10.1038/35088122. [DOI] [PubMed] [Google Scholar]
- 6.Warden SJ, Turner CH. Mechanotransduction in cortical bone is most efficient at loading frequencies of 5-10 Hz. Bone. 2004;34:261–70. doi: 10.1016/j.bone.2003.11.011. [DOI] [PubMed] [Google Scholar]
- 7.Kesavan C, Mohan S, Srivastava AK, Kapoor S, Wergedal JE, Yu H, et al. Identification of genetic loci that regulate bone adaptive response to mechanical loading in C57BL/6J and C3H/HeJ mice intercross. Bone. 2006;39:634–43. doi: 10.1016/j.bone.2006.03.005. [DOI] [PubMed] [Google Scholar]
- 8.LaMothe JM, Hamilton NH, Zernicke RF. Strain rate influences periosteal adaptation in mature bone. Med Eng Phys. 2008;27:277–84. doi: 10.1016/j.medengphy.2004.04.012. [DOI] [PubMed] [Google Scholar]
- 9.Zhang P, Tanaka S, Jiang H, Su M, Yokota H. Diaphyseal bone formation in murine tibiae in response to knee loading. J Appl Physiol. 2006;100:1452–9. doi: 10.1152/japplphysiol.00997.2005. [DOI] [PubMed] [Google Scholar]
- 10.Zhang P, Su M, Tanaka S, Yokota H. Knee loading causes diaphyseal cortical bone formation in murine femurs. BMC Musculoskel Dis. 2006;73:1–12. doi: 10.1186/1471-2474-7-73. [DOI] [PMC free article] [PubMed] [Google Scholar]
- 11.Yokota H, Tanaka S. Osteogenic potentials with joint-loading modality. J Bone Miner Metab. 2005;23:302–8. doi: 10.1007/s00774-005-0603-x. [DOI] [PubMed] [Google Scholar]
- 12.Lee KC, Maxwell A, Lanyon LE. Validation of a technique for studying functional adaptation of the mouse ulna in response to mechanical loading. Bone. 2002;31:407–12. doi: 10.1016/s8756-3282(02)00842-6. [DOI] [PubMed] [Google Scholar]
- 13.Robling AG, Turner CH. Mechanotransduction in bone: Genetic effects on mechanosensitivity in mice. Bone. 2002;31:562–9. doi: 10.1016/s8756-3282(02)00871-2. [DOI] [PubMed] [Google Scholar]
- 14.De Souza RL, Matsuura M, Eckstein F, Rawlinson SC, Lanyon LE, Pitsillides AA. Noninvasive axial loading of mouse tibiae increases cortical bone formation and modifies trabecular organization: a new model to study cortical and cancellous compartments in a single loaded element. Bone. 2005;37:810–8. doi: 10.1016/j.bone.2005.07.022. [DOI] [PubMed] [Google Scholar]
- 15.LaMothe JM, Zernicke RF. Rest insertion combined with high-frequence loading enhances osteogenesis. J Appl Physiol. 2004;96:1788–93. doi: 10.1152/japplphysiol.01145.2003. [DOI] [PubMed] [Google Scholar]
- 16.Xie L, Jacobson JM, Choi ES, Busa B, Donahue LR, Miller LM, et al. Low-level mechanical vibrations can influence bone resorption and bone formation in the growing skeleton. Bone. 2006;39:1059–66. doi: 10.1016/j.bone.2006.05.012. [DOI] [PubMed] [Google Scholar]
- 17.Mori T, Okimoto N, Sakai A, Okazaki Y, Nakura N, Notomi T, et al. Climbing exercise increases bone mass and trabecular bone turnover through transient regulation of marrow osteogenic and osteoclastogenic potentials in mice. J Bone Miner Res. 2003;18:2002–9. doi: 10.1359/jbmr.2003.18.11.2002. [DOI] [PubMed] [Google Scholar]
- 18.Wu J, Wang XX, Higuchi M, Yamada K, Ishimi Y. High bone mass gained by exercise in growing male mice is increased by subsequent reduced exercise. J Appl Physiol. 2004;97:806–10. doi: 10.1152/japplphysiol.01169.2003. [DOI] [PubMed] [Google Scholar]
- 19.Kodama Y, Umemura Y, Nagasawa S, Beamer WG, Donahue LR, Rosen CR, et al. Exercise and mechanical loading increase periosteal bone formation and whole bone strength in C57BL/6J mice but not in C3H/Hej mice. Calcif Tissue Int. 2000;66:298–306. doi: 10.1007/s002230010060. [DOI] [PubMed] [Google Scholar]
- 20.Zhang P, Yokota H. Effects of surgical holes in mouse tibiae on bone formation induced by knee loading. Bone. 2007;40:1320–8. doi: 10.1016/j.bone.2007.01.018. [DOI] [PMC free article] [PubMed] [Google Scholar]
- 21.Hagino H, Kuraoka M, Kameyama Y, Okano T, Teshima R. Effect of a selective agonist for prostaglandin E receptor subtype EP4 (ONO-4819) on the cortical bone response to mechanical loading. Bone. 2005;36:444–53. doi: 10.1016/j.bone.2004.12.013. [DOI] [PubMed] [Google Scholar]
- 22.Kameyama Y, Hagino H, Okano T, Enokida M, Fukata S, Teshima R. Bone response to mechanical loading in adult rats with collagen-induced arthritis. Bone. 2004;35:948–56. doi: 10.1016/j.bone.2004.05.002. [DOI] [PubMed] [Google Scholar]
- 23.Cook MJ. The anatomy of the laboratory mouse. London, New York: Academic press; 1965. [Google Scholar]
- 24.Nagashima M, Sakai A, Uchida S, Tanaka S, Tanaka M, Nakamura T. Bisphosphonate (YM529) delays the repair of cortical bone defect after drill-hole injury by reducing terminal differentiation of osteoblasts in the mouse femur. Bone. 2005;36:502–11. doi: 10.1016/j.bone.2004.11.013. [DOI] [PubMed] [Google Scholar]
- 25.Xing W, Baylink D, Kesavan C, Hu Y, Kapoor S, Chadwick RB, et al. Global gene expression analysis in the bones reveals involvement of several novel genes and pathways in mediating an anabolic response of mechanical loading in mice. J Cell Biochem. 2005;96:1049–60. doi: 10.1002/jcb.20606. [DOI] [PubMed] [Google Scholar]
- 26.Cho JY, Lee WB, Kim HJ, Mi Woo K, Baek JH, Choi JY, et al. Bone-related gene profiles in developing calvaria. Gene. 2006;372:71–81. doi: 10.1016/j.gene.2005.12.010. [DOI] [PubMed] [Google Scholar]
- 27.Kesavan C, Mohan S, Oberholtzer S, Wergedal JE, Baylink DJ. Mechanical loading-induced gene expression and BMD changes are different in two inbred mouse strains. J Appl Physiol. 2005;99:1951–7. doi: 10.1152/japplphysiol.00401.2005. [DOI] [PubMed] [Google Scholar]
- 28.Zhang P, Su M, Liu Y, Hus A, Yokota H. Knee loading dynamically alters intramedullary pressure in mouse femora. Bone. 2007;40:538–43. doi: 10.1016/j.bone.2006.09.018. [DOI] [PMC free article] [PubMed] [Google Scholar]
- 29.Su M, Jiang H, Zhang P, Liu Y, Wang E, Hsu A, et al. Load-driven molecular transport in mouse femur with knee-loading modality. Ann Biomed Eng. 2006;34:1600–6. doi: 10.1007/s10439-006-9171-z. [DOI] [PubMed] [Google Scholar]
- 30.Zhang P, Hamamura K, Yokota H, Malacinski GM. Potential applications of pulsating joint loading in sports medicine. Exerc Sport Sci Rev. 2009;37:52–6. doi: 10.1097/JES.0b013e31819121c6. [DOI] [PMC free article] [PubMed] [Google Scholar]
- 31.Warden SJ. Breaking the rules for bone adaptation to mechanical loading. J Appl Physiol. 2006;100:1441–2. doi: 10.1152/japplphysiol.00038.2006. [DOI] [PubMed] [Google Scholar]
- 32.Zhang P, Tanaka S, Sun Q, Turner CH, Yokota H. Frequency-dependent enhancement of bone formation in murine tibiae and femora with knee loading. J Bone Miner Metab. 2007;25:383–91. doi: 10.1007/s00774-007-0774-8. [DOI] [PMC free article] [PubMed] [Google Scholar]
- 33.Zhang P, Malacinski GM, Yokota H. Joint Loading Modality: Its Application to Bone Formation and Fracture Healing. Br J Sport Med. 2008;42:556–60. doi: 10.1136/bjsm.2007.042556. [DOI] [PMC free article] [PubMed] [Google Scholar]
- 34.Zhang P, Hamamura K, Yokota H. A brief review of bone adaptation to unloading. Geno Prot Bioinfo. 2008;6:4–7. doi: 10.1016/S1672-0229(08)60016-9. [DOI] [PMC free article] [PubMed] [Google Scholar]
- 35.Zhang P, Sun Q, Turner CH, Yokota H. Knee loading accelerates bone healing in mice. J Bone Miner Res. 2007;22:1979–87. doi: 10.1359/jbmr.070803. [DOI] [PMC free article] [PubMed] [Google Scholar]
- 36.Harrington LS, Findlay GM, Lamb RF. Restraining PI3K: mTOR signalling goes back to the membrane. Trends Biochem Sci. 2005;30:35–42. doi: 10.1016/j.tibs.2004.11.003. [DOI] [PubMed] [Google Scholar]
- 37.Fowlkes JL, Thrailkill KM, Liu L, Wahl EC, Bunn RC, Cockrell GE, et al. Effects of systemic and local administration of recombinant human IGF-I (rhIGF-I) on de novo bone formation in an aged mouse model. J Bone Miner Res. 2006;21:1359–66. doi: 10.1359/JBMR.060618. [DOI] [PMC free article] [PubMed] [Google Scholar]
- 38.Wang Y, Nishida S, Elalieh HZ, Long RK, Halloran BP, Bikle DD. Role of IGF-I signaling in regulating osteoclastogenesis. J Bone Miner Res. 2006;21:1350–8. doi: 10.1359/jbmr.060610. [DOI] [PMC free article] [PubMed] [Google Scholar]
- 39.Leach RM, Richards MP, Praul CA, Ford BC, McMurtry JP. Investigation of the insulin-like growth factor system in the avian epiphyseal growth plate. Domest Anim Endocrinol. 2007;33:143–53. doi: 10.1016/j.domaniend.2006.04.010. [DOI] [PubMed] [Google Scholar]
- 40.Cantley LC. The phosphoinositide 3-kinase pathway. Science. 2002;296:1655–7. doi: 10.1126/science.296.5573.1655. [DOI] [PubMed] [Google Scholar]
- 41.Lallier TE, Yukna R, Moses RL. Extracellular matrix molecules improve periodontal ligament cell adhesion to anorganic bone matrix. J Dent Res. 2001;80:1748–52. doi: 10.1177/00220345010800081301. [DOI] [PubMed] [Google Scholar]
- 42.Janssens K, ten Dijke P, Janssens S, Van Hul W. Transforming growth factor-beta1 to the bone. Endocr Rev. 2005;26:743–74. doi: 10.1210/er.2004-0001. [DOI] [PubMed] [Google Scholar]
- 43.Baron R, Rawadi G. Targeting the Wnt/beta-catenin pathway to regulate bone formation in the adult skeleton. Endocrinology. 2007;148:2635–43. doi: 10.1210/en.2007-0270. [DOI] [PubMed] [Google Scholar]
- 44.Sawakami K, Robling AG, Ai M, Pitner ND, Liu D, Warden SJ, et al. The Wnt co-receptor LRP5 is essential for skeletal mechanotransduction but not for the anabolic bone response to parathyroid hormone treatment. J Biol Chem. 2006;281:23698–711. doi: 10.1074/jbc.M601000200. [DOI] [PubMed] [Google Scholar]
- 45.Robling AG, Niziolek PJ, Baldridge LA, Condon KW, Allen MR, Alam I, et al. Mechanical stimulation of bone in vivo reduces osteocyte expression of Sost/sclerostin. J Biol Chem. 2007;283:5866–75. doi: 10.1074/jbc.M705092200. [DOI] [PubMed] [Google Scholar]
- 46.Lau KH, Kapur S, Kesavan C, Baylink DJ. Up-regulation of the Wnt, estrogen receptor, insulin-like growth factor-I, and bone morphogenetic protein pathways in C57BL/6J osteoblasts as opposed to C3H/HeJ osteoblasts in part contributes to the differential anabolic response to fluid shear. J Biol Chem. 2006;281:9576–88. doi: 10.1074/jbc.M509205200. [DOI] [PubMed] [Google Scholar]
- 47.Seeman E. Invited Review: Pathogenesis of osteoporosis. J Appl Physiol. 2003;95:2142–51. doi: 10.1152/japplphysiol.00564.2003. [DOI] [PubMed] [Google Scholar]
- 48.Aguado F, Revilla M, Villa LF, Rico H. Cortical bone resorption in osteoporosis. Calicif Tissue Int. 1997;60:323–6. doi: 10.1007/s002239900236. [DOI] [PubMed] [Google Scholar]