Abstract
Accurate ab initio simulation of protein folding is a critical step toward elucidation of protein folding mechanisms. In this report, we demonstrate highly accurate folding of the 35-residue villin headpiece subdomain (HP35) by all-atom molecular dynamics simulations using AMBER ff03 and the generalized-Born solvation model. In a set of twenty microsecond-long simulations, the protein folded to the native state in multiple trajectories with the lowest Cα-RMSD being 0.39 Å for residues 2–34 (excluding residues 1 and 35). The native state had the highest population among all sampled conformations and the center of most populated cluster had a Cα-RMSD of 1.63 Å. Folding of this protein can be described as a two-stage process that followed a well-defined pathway. In the first stage, formation of helices II and III as a folding intermediate constituted the rate-limiting step and was initiated at a folding nucleus around residues Phe17 and Pro21. The folding intermediate further acted as a template that facilitated the folding and docking of helix I in the second stage. Detailed descriptions of the folding kinetics and the roles of key residues are presented.
Keywords: protein folding, molecular dynamics, generalized-Born, AMBER ff03, villin headpiece
Introduction
The greatest challenge confronting ab initio protein folding is the small amount of folding free energy that is usually only a few kcal/mol for a typical protein, comparable to the energy of a single hydrogen bond. The complexity of the energetic surface and the enormous number of energy minima further underscore the need of an exquisite level of accuracy1–3. Built upon the physical energetics of small peptide fragments, the physics-based atomistic model is considered a promising approach that is naturally suitable to model the protein folding process. Due to the high spatial and temporal resolutions, a successful simulation of the protein folding with such a model can potentially provide a detailed description of the process and enhance the understanding of the mechanisms of protein folding4; 5.
Encouraging progress has been made by many groups in the ab initio simulations of protein folding. Highlights of the recent accomplishments included simulations of small fast-folding proteins by a number of groups6–17. Yet, despite the encouraging progress, with the Trpcage being the only exception6–9, ab initio simulations on all other small proteins have remained at the level of 2–4 Å Cα-RMSD from the experimental structures which are generally considered as the so-called “native-like” states. The complete lack of observations of the native high-resolution experimental structures in ab initio simulations on proteins of non-trivial topology underscores the challenge confronting ab initio protein folding simulations and reinforces the notion that direct simulations of protein folding to the native state using the physics-based models remain a “Holy Grail”18.
The villin headpiece subdomain (HP35) is a naturally existing 35-residue helical protein19. Both the NMR and X-ray structures20–22 show that its native structure forms a unique fold. The three helices are arranged so that helix I (residues 2–11) is nearly perpendicular to the plane formed by helices II and III (residues 13–20 and 21–33, respectively). HP35 can spontaneously fold without the assistance of disulfide bonds, metal ions, or non-natural amino acids. Its nontrivial topology, small size, and robust and fast folding (4.3 ± 0.6 μs)23; 24 has made it an ideal prototypical system to investigate the folding mechanisms. It is one of the most studied small proteins by kinetic experiments and computer simulations17; 23–40. Among which, the first all-atom simulation of protein folding to a microsecond with an explicit solvent reached a native-like state 33. Based on the simulation, Lee, Duan and Kollman23 predicted the folding time of 4.2 μs which remains as the most accurate prediction of folding time thus far. Pande and coworkers attempted to fold this protein using folding@home to a cumulated 300 μs with continuum solvation and the best Cα-RMSD was close to 3.8 Å35. Despite the effort, the best sampling on HP35 has been 1.29 Å Cα-RMSD for residues 9–32 (i.e., folded helices II and III except helix I) by Pande and coworkers in their recent work41 and the lowest overall RMSD in the majority of other works has remained above 3.0 Å. The lack of global folding to the native state once again illustrates the level of challenge confronting the ab initio folding simulations. In our previous work, the free energy landscape of HP35 was examined42. In this work, we focus on the folding processes.
Results and Discussion
Folding of HP35 to sub-angstrom accuracy
We now report a set of twenty simulations on HP35 (1.0 μs each) in which the native state has been consistently reached to within 1.0 Å Cα-RMSD in multiple trajectories to as close as 0.39 Å (in this work, unless otherwise specified, the Cα-RMSD refers to residues 2–34, excluding residues 1 and 35, and relative to the X-ray structure (PDB code 1YRF)22). Furthermore, the native conformation was notably the most populated among all conformations sampled during the simulations. Started from the fully denatured states, the protein folded to the native state in a majority of the simulation trajectories. The Cα-RMSD reached below 1.0 Å from the X-ray crystal structure in seven trajectories. In comparison, the Cα-RMSD between X-ray and NMR structures are 1.33 Å - 2.18 Å (see Figure S1 in supplementary material), suggesting the level of thermal fluctuation of the molecule, particularly on helix I. In addition to the sub-angstrom folding, Cα-RMSD reached below 2.5 Å in five more trajectories for a total of twelve of the twenty trajectories.
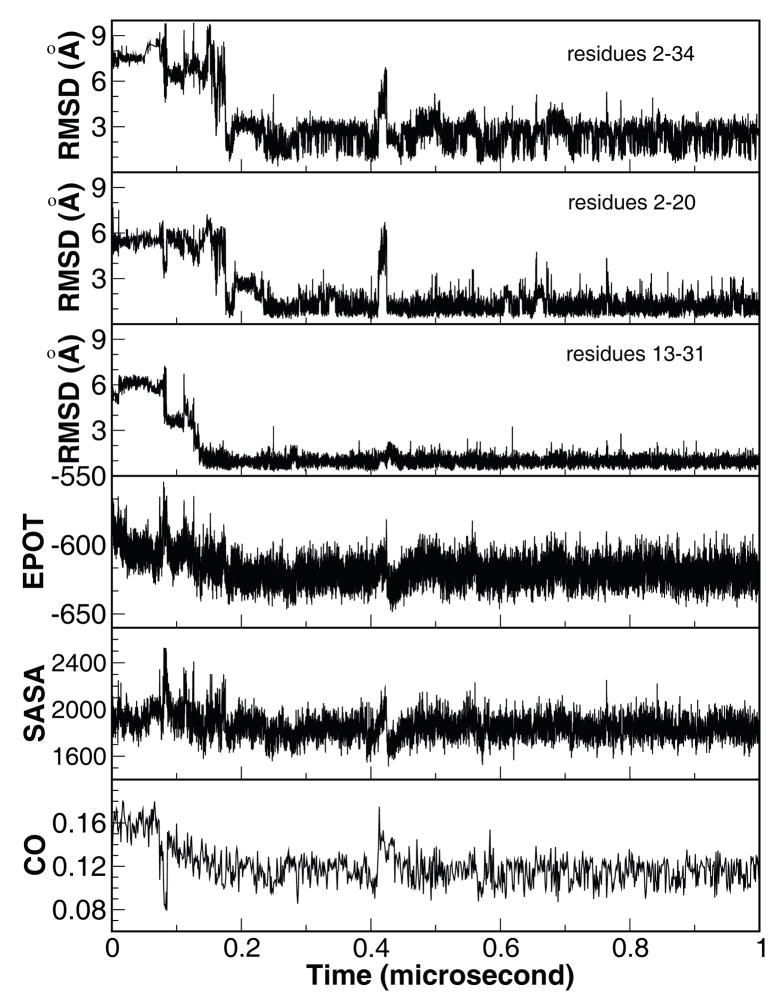
Because of the lack of solvent viscosity in the continuum solvent model, the time scales observed in the simulations are expected to be faster than experimental observations. Shown in Figure 1 is the Cα-RMSD from the X-ray structure22 in a representative trajectory in which the native state was reached within 200 ns. Notably in this trajectory, the protein remained in the native state basin for most of the time after it reached the native state. Residues 13–31 (helices II and III) folded near 130 ns and stayed folded throughout the rest of the folding trajectory. The docking of helix I to the pre-folded helices II/III segment resulted in folding of the entire protein. Apparently, the folding took place in two distinct stages. The folding events demonstrated good correlation with the change of the potential energy, solvent accessible surface area, and the contact order value (lower panels in Fig 1).
Figure 1.
Time history of structural properties of a representative folding trajectory. From top to bottom, Cα-RMSD of the whole protein relative to the X-ray structure (PDB code 1YRF) and the two structural segments, segment A encompassing helices I and II (residues 2–20), and segment B encompassing helices II and III (residues 13–31), potential energy (kcal/mol), solvent accessible surface area (Å2), and contact order. The X-ray structure of HP35 was used as reference for RMSD calculations.
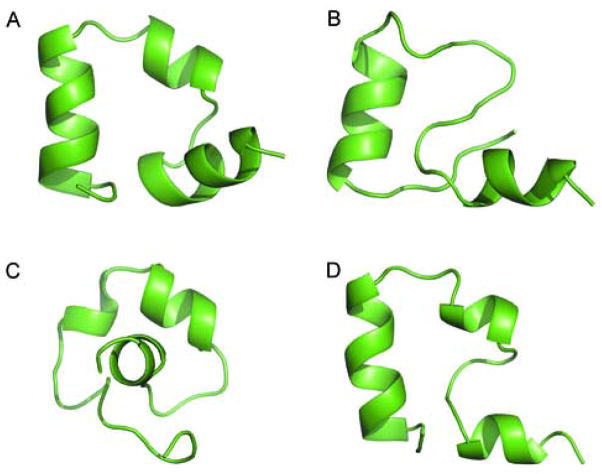
Shown in Figure 2 are the representative structures (i.e., the structure with most neighbors) for four of the most populated clusters. The native conformation was consistently the most visited among those sampled during the simulations as shown by its highest population among all clusters. The native cluster, with a 1.63 Å Cα-RMSD and 10.8% population of the total snapshots, was notably more populated than any other clusters. This 1.63 Å Cα-RMSD structure is our unbiased structure prediction based on population. In contrast, the highest population of the non-native states was only 4.3%, less than half of the native cluster. There was a native-like cluster with 2.0% population and the center of the cluster was 3.23 Å. We should note that the simulated structures are consistent with both the X-ray structure and the NMR structure ensemble. When the center of the most sampled conformation was compared against the experimental structures, the Cα-RMSDs were 1.63 Å and 1.78 Å when the references were X-ray and NMR structures, respectively. Overall, the simulation comprised the lowest free energy structure captured by X-ray crystallography and the dynamic features captured by NMR.
Figure 2.
Representative structures for four of the most populated clusters. One native cluster (No.1), one near native cluster (No.9), and two non-native clusters (No. 2 & 3) are shown. The center of each cluster, i.e. the structure with the most neighbors, was chosen to represent the cluster.
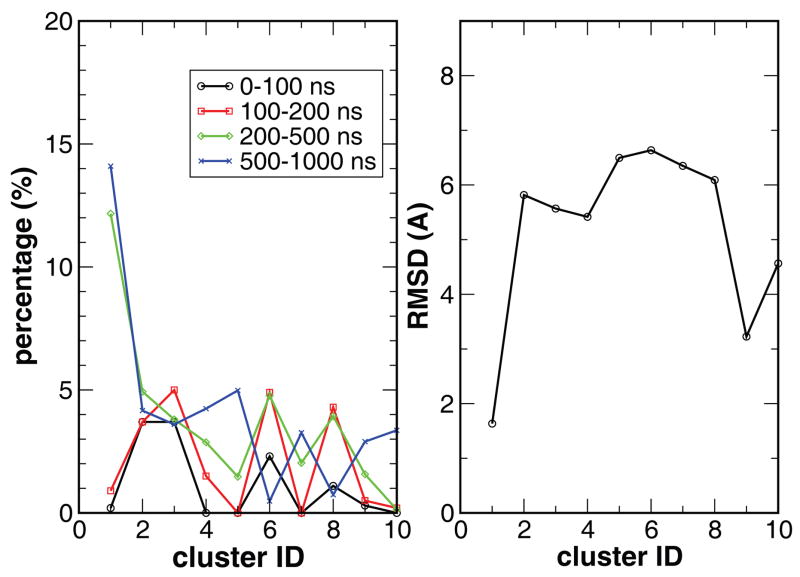
Not only the native cluster was the most populated, the population shifted progressively toward the native state during the simulations as illustrated by the populations among the top ten clusters shown in Figure 3 in four time frames (0–0.1 μs, 0.1–0.2 μs, 0.2–0.5 μs, and 0.5–1.0 μs). During the first 100 ns, the non-native clusters were notably more populated (3.7%) than the native (0.3%) and native-like (0.2%) clusters. In the next 100 ns, the populations in the native and native-like clusters were slightly improved to 0.9% and 0.5%, respectively, while the first non-native cluster was populated by 3.7%. During the 200–500 ns time frame, the native conformation became the most populated with a population of 12.2% and the native-like cluster reached 1.6%. In contrast, the population of the most populated non-native cluster was only 4.9%. In the second half of the simulation, 500–1000 ns, the protein displayed similar features as in the 200–500 ns time frame while the native cluster population grew to 14.1% and the native-like cluster grew to 2.9% and, in comparison, the most populated non-native cluster was 4.2%, about three times less populated than the native cluster. The growing trend of the native cluster population, particularly in comparison to the non-native clusters, indicates that the native state is the most stable state.
Figure 3.
Left: the population of the ten most populated clusters in four time frames (0–0.1 μs, 0.1–0.2 μs, 0.2–0.5 μs, and 0.5–1.0 μs). The dominance in population for the native cluster (No. 1) after 200 ns is clearly demonstrated. Right: RMSD for each of the top ten clusters.
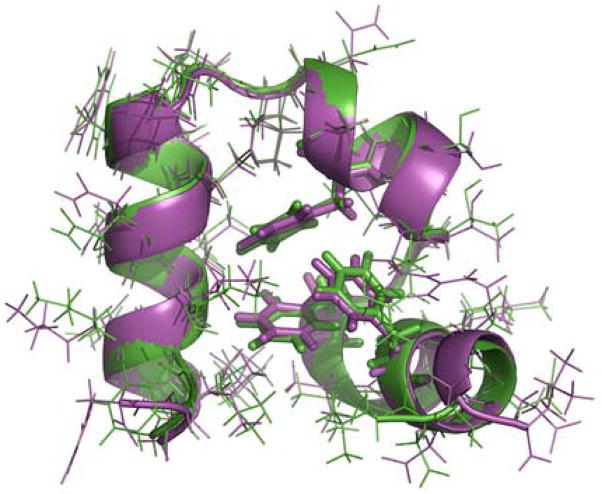
To highlight the sampling of the experimental high-resolution X-ray structure during the simulations, the best folded structure obtained from the native cluster is overlaid with the X-ray crystal structure and is shown in Figure 4. The close resemblance between the simulated and the X-ray structures is readily apparent. Their Cα-RMSD was 0.39 Å and heavy-atom RMSD (including side chain heavy atoms) was only 1.25 Å. Remarkably, the backbones of the two structures are almost indiscernible from each other. Some of the salient features include identical characteristic packing patterns of the hydrophobic core where the three phenylalanine residues are tightly packed and Phe6 is sandwiched between Phe10 and Phe17 to form the crucial contact responsible for stabilizing the protein native structures. Other core residues, including Val9, Leu20, Gln25, and Leu28, are also tightly packed against each other and almost in exactly the same patterns as those in the X-ray structure. The majority of other side chains also adopted the native conformations.
Figure 4.
Superposition of the best folded structure in the simulation (magenta) and the X-ray structure (PDB code 1YRF, green). Backbones are represented as ribbons. The three core phenylalanine residues (F6, F10 and F17) are shown as sticks. The Cα-RMSD is 0.39 Å. The all-atom RMSD is 1.25 Å. One residue of each of the terminii was excluded in the RMSD calculations due to the general nature of elevated dynamics.
A two-stage folding process
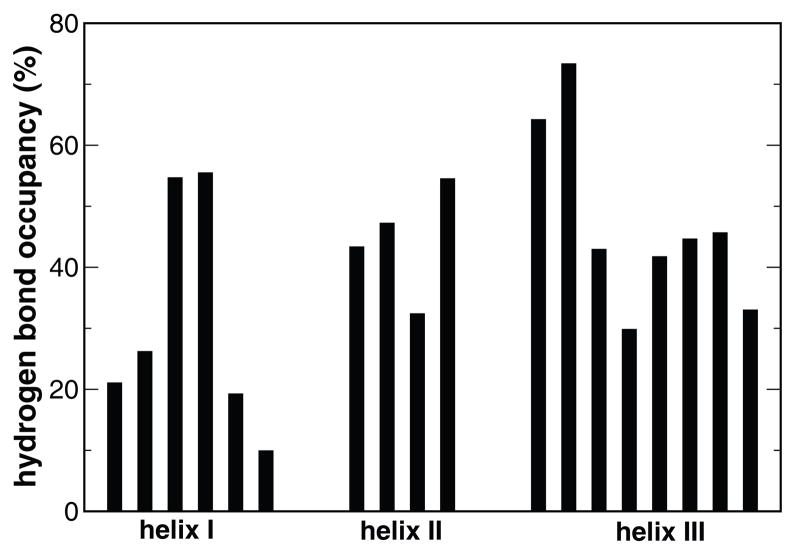
Because the continuum solvent model does not account for solvent viscosity, the initial collapse took place rather rapidly, marked by a substantial reduction in the radius of gyration, surface area and total energy in the first 10.0 ns. Nascent helices started to form in a few nanoseconds. Among the three helices, helix I initiated from the middle, whereas helix III started from its N-terminal. Overall, helices II and III were developed notably better than helix I (Figure 5). This has important consequence in folding because helices II and III can conceivably provide a template upon which helix I may fold. In contrast, completion of helix I mostly coincided with the folding of the entire protein and was stabilized by the three phenylalanine residues.
Figure 5.
The population of the individual native hydrogen bonds, grouped by the three helices.
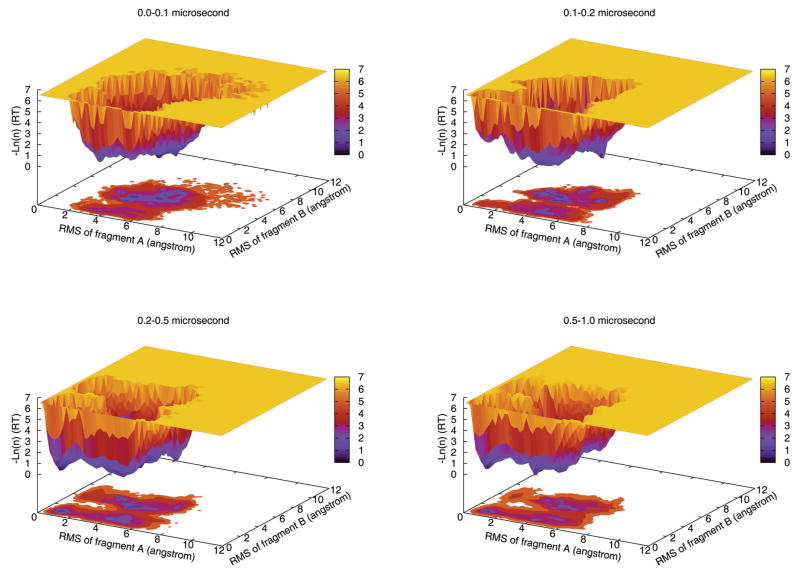
To characterize the folding process, we choose the Cα-RMSD’s of two overlapping segments A and B from the X-ray structure as the reaction coordinates, denoted as RA and RB, respectively (as shown in Figure 1). Segment A encompasses helices I & II (residues 2 to 20) and segment B encompasses helices II & III (residues 13 to 31), shown in Figure 6. By overlapping helix II in both segments we ensure that the native state of the entire protein is reached when both segments are in their respective native states. To demonstrate the overall folding events, the conformation distributions over four timeframes were constructed (Figure 7) that indicate the movement of the structural ensemble toward the most favorable state guided by the free energy landscape. Thus, these distributions allow a qualitative assessment of the free energy landscape which can be partitioned into four regions. The native basin (region F, RA <2.3 Å, RB <2.6 Å) is separated from the partially folded region (region I1, RA >2.3 Å, RB <2.6 Å) by a low free energy barrier (~0.6 kcal/mol). The denatured region (region D, RA >2.0 Å, RB >2.6 Å) is separated from the other two regions by a high free energy barrier (~1.2 kcal/mol). The fourth region with very low population is also partially folded (region I2, RA <2.0 Å, RB >2.6 Å). Representative structures of these regions are shown in Figure 6.
Figure 6.
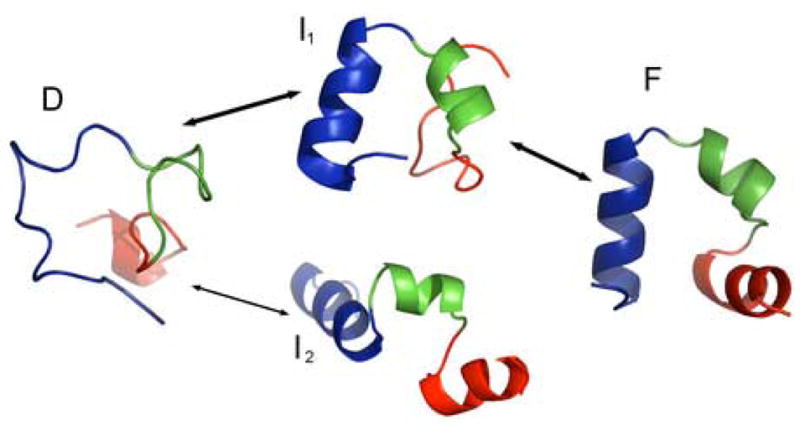
Representative structures of four main states. A: a random coil structure in the fully denatured D state. B: the on-pathway intermediate state I1 (segment B folded). C: off-pathway intermediate state I2 (segment A folded). D: fully folded native F state. Arrows indicate transitions observed in the simulations. The segments A and B are color-coded. Segment A includes red and green residues and segment B includes green and blue residues. The overlapping region (green) ensures that a global folding is achieved when both A and B segments are folded.
Figure 7.
Population shift during the simulations. The distribution histograms are in natural log scales for the time frames of 0–0.1 μs, 0.1–0.2 μs, 0.2–0.5 μs, and 0.5–1.0 μs. The Cα-RMSD of the two segments A (residues 2–20) and B (residues 13–31) are used as reaction coordinates. As simulation progressed, the population shifted to semi-folded and folded states and the overall conformational space also shrunk.
Judged from the evolution of the distributions, the structural ensembles demonstrated a clear tendency to move toward the native basin. In the first 0.1 μs, the formation of individual helices was observed and folding was dominated by non-specific chain collapse and formation of non-native contacts. During this period, most of the trajectories remained in the denatured region and only one trajectory crossed the high energy barrier and reached the partially folded region I1. The native basin was barely sampled in the first 0.1 μs. After the protein crossed the second barrier, it started to reach the native state F in one trajectory in the time frame of 0.1–0.2 μs. As simulations continued, an increasing number of trajectories reached the native basin leading to growing population in the native region F which became the most populated region in the second half of the simulations. The reduction of conformational space and the shift of population toward the native basin indicate that the folding process was “guided” by the free energy funnel where the folding events were depicted as a flux of the protein structure ensemble.
The intermediate region I1 is characterized by the formation of segment B (helices II and III). After region I1 was reached, the protein did not move to the native basin immediately. The delay in global folding was largely due to the packing of the core (of three Phe side chains) and the slow docking of helix I to the pre-folded segment B. In all cases, folding of the entire protein was preceded by formation of segment B (region I1), as illustrated in Figure 6. Therefore, region I1 is an obligatory on-pathway intermediate state.
On the other hand, region I2 is characterized by the formation of segment A (helices I and II). However, formation of region I2 never directly led to the folded native state in the simulation. Therefore, I2 is an off-pathway intermediate state. At the molecular level, segment A is unstable without the stacking interactions with segment B through the hydrophobic core residues, as seen in experiments36. Thus, the folding of segment A requires segment B as the template, an observation that is consistent with the cooperativity of protein folding.
The observed folding process exhibited an overall tendency to form individual helices which were incomplete or unstable prior to final folding, as envisaged by the diffusion-collision model43. On the other hand, the lack of stability of the individual helices before final folding is a notable deviation from the ideal framework mechanism which envisages a hierarchical folding scenario44. In fact, early formation of three helices led to the unproductive off-pathway intermediate state I2 as shown in Figure 6. The conformation distribution as depicted in Figure 7 indicates that the formation of segment B (region I1) from the denatured state D needs to cross the major free energy barrier. Paradoxically, segment B almost always folded first, largely due to the cooperative nature of the folding process as discussed earlier. Because overall folding depends closely on segment B, its formation and initiation (around residues Phe17 and Pro21) are the rate-limiting step which is in agreement with the nucleation-condensation model proposed by Fersht and co-workers45.
In the laser temperature-jump kinetic experiment24, the unfolding kinetics was fitted by a bi-exponential function, with slow (5 μs) and fast (70 ns) phases. The slower phase corresponds to the overall folding/unfolding and the fast phase was due to rapid equilibration between the native and nearby states. This is quite consistent with our observation in which the main barrier separates the denatured (D) state from both I1 and F states and the latter two are separated by a minor barrier, allowing fast exchange. Thus, our simulations suggest a two-stage folding process which is consistent with the observations by Havlin and Tycko28.
As we noted earlier, because of the lack of solvent viscosity in continuum solvent models, the time scales observed in the simulations are expected to be much faster than experimental observations. In addition to the very rapid initial collapse process discussed earlier, the overall folding was 100-ns scale events and took place in the second phase when the overall average energy decreased by 22.6 kcal/mol with a time constant of 0.11 μs. Similarly, the time constants of the native hydrogen bonds and the native side chain contacts were, respectively, 0.12 μs and 0.21 μs. Despite the complex process marked by the intermediate states, the slow phase can be fitted reasonably well by single exponential functions. Due to the lack of viscosity in our simulation, the observed “folding time” from the individual trajectories ranged from 180 ns to 610 ns which were notably faster than the experimental measurements. When high viscosity was applied in the folding studies by Pande and coworkers35, the predicted folding rate of 5 μs was in excellent agreement with experimentally determined folding rate. In an earlier study, Lee, Duan and Kollman analyzed the first microsecond folding trajectory of HP36. By analyzing the free energy changes, they concluded that the protein crossed the folding free energy barrier at 700 ns. They then extrapolated the free energy and were able to deduce that the protein might take additional 3.5 μs from the point immediately after crossing the transition state to reach the native state 23. Thus, the folding time, according to their calculation, should be close to 4.2 μs. This was confirmed three years later by the laser-induced temperature jump experiment of Eaton and co-workers24. In both cases, solvent viscosity was properly accounted. Clearly, it is necessary to represent the effect of viscosity for accurate prediction of the folding rates.
Critical residues and native contacts
Mutagenesis experiments have suggested that the three core phenylalanine residues (Phe6, Phe10 and Phe17) play important roles in stabilizing the native structure46. Among them, mutations of Phe17 are most destabilizing because it is involved in most of the core contacts between helices II and III and is critical for stabilizing the protein. Consistently, the region around Phe17 and Pro21 folded early and was quite stable. This contributed to the high stability of segment B which, in turn, acted as the folding template for helix I. The rigid Pro21 in the linker region between helices II & III plays roles in stabilizing segment B by restricting the movement of the two helices. Taken together, the core region around Phe17 and Pro21 was the initiation site of the folding of the entire protein. These observations were in agreement with the experimental findings that Pro21 plays crucial roles in stabilizing the native structures 47.
Flexibility near Gly11 in the linker region between helices I and II likely accounts for the notable differences between the X-ray and NMR structures20–22 and the dramatic swing of helix I in NMR structures, as shown in Figure S1. These experimental results were consistent with the observed flexible helix I in the simulations which caused fluctuation in Cα-RMSD and other measurements as seen in Figure 1. Similarly, Gly33 increases flexibility of the C-terminal that may lead to the formation of non-native hydrophobic contacts between the C-terminal and the core residues, inadvertently block the way of Phe6 and Phe10. In fact, escaping of the C-terminal tail from the core region led to global folding in some trajectories.
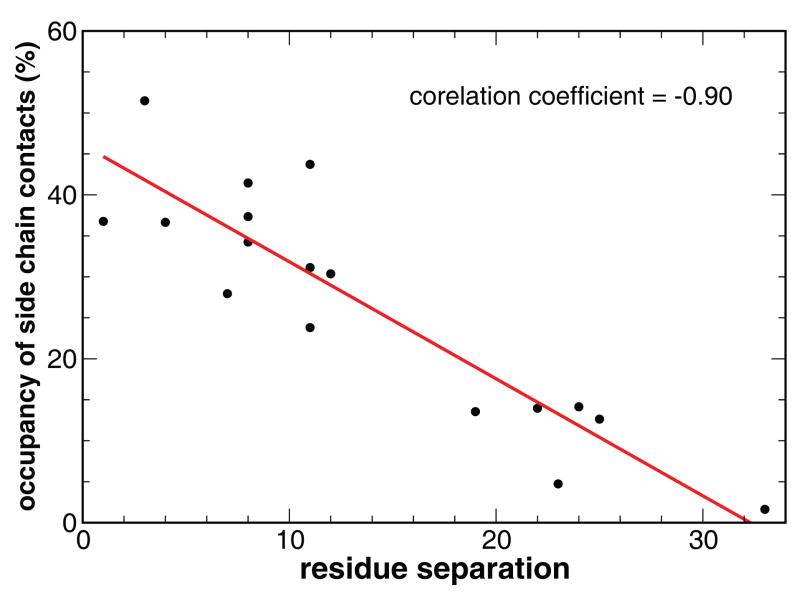
Seventeen tertiary native side chain contacts were extracted from the X-ray crystal structure among which twelve involve at least one of the three core phenylalanine residues (Phe6, Phe10, and Phe17). Six of these contacts were separated by more than fifteen residues along the primary chain. There was a notable correlation between the formation of the contacts and the distances along the main chain. As shown in Fig 8, the shorter range contacts formed with notably higher fractions than those longer range contacts, which is consistent with the contact order theory48. Underpinning the contact-order theory is the physical principle that the formation of contacts decreases the system entropy and is therefore subject to entropic penalty49; 50, as exemplified by the general hierarchical folding process in which short-range contacts form first to facilitate long-range contacts.
Figure 8.
The correlation between the occupancy of the native tertiary side chain contacts and the chain separation of the two residues in contact.
Our observed two-stage folding is different from other reports. In most published simulations, a hydrophobic-collapse like mechanism was observed. Although the fast collapse phase was also observed in this work, the distinct two-stage folding process was rather clear. The rate-limiting step was the formation of the aromatic core in the study by Pande and coworkers35, while it is the formation of helix II/III segment in our current study. A study by Freed and coworkers concluded that tertiary contact determined the secondary structures for HP3551. In contrast, we observed significantly populated individual helices with varied stability, and helix I was stabilized by tertiary contact. The notable differences from earlier simulation results can be attributed mainly to the different simulation force fields and solvent models. The lack of sampling to the native state in the earlier studies could also conceivably contribute.
It has been demonstrated that simulations with explicit and implicit solvent can produce different ensembles of structures52; 53. In fact, simulations with different implicit solvent models may also lead to distinct ensembles of structures. The force field FF03 used in this work was developed for general purpose simulation. In our previous works42; 54–57, we have successfully conducted simulations with both explicit and implicit solvent models. Nevertheless, it is rather difficult to speculate whether FF03 works better with either solvation model. However, we consider it more practical at this stage to choose implicit solvation models when it comes to ab initio protein folding for its notably reduced computational cost.
Concluding remarks
We have performed a set of twenty molecular dynamics simulations on the folding of HP35 to microsecond to the native state with Cα-RMSD as close as 0.39Å to the high-resolution X-ray structure. Our predicted folded structure for HP35 was the center of the most sampled conformation with 1.63 Å Cα-RMSD. The results demonstrated that ab initio folding simulations with physics-based models are capable of reaching the native conformations of small proteins with high accuracy. We observed a two-stage folding process in which formation of the folding intermediate constituted the rate-limiting step. Work is also in progress to simulate folding of other small proteins. Further advancements in the force fields58–68 continuum solvent models69; 70 provide constant improvement in simulation accuracy. We are optimistic that ab initio simulations of more fast-folding proteins to subatomic resolution are achievable in the near future.
METHODS
The simulations were conducted with AMBER simulation package71; 72. The all-atom point-charge force field FF03 was chosen to represent the protein59. The combined Generalized-Born (GB) 73; 74 and surface area model was chosen to mimic solvation effect (surface tension=0.05 kcal/mol/Å2). It is noteworthy that the simulation force field FF03 was developed using small peptides as model systems and the parameters were published in 2003 and distributed with AMBER simulation package in early 2004. In comparison, the experimental X-ray structure of HP35 became available in 2005.
Starting from the extended polypeptide chain of the wild type villin headpiece subdomain, short minimization (1000 steps) and equilibration (20 ps) were applied to the system. This equilibrated structure was the starting point for the twenty simulation trajectories with different initial random velocity assignment. Temperature was set to 300 K and was controlled by applying Berendsen’s thermostat with a coupling time constant of 2.0 ps. Ionic strength was set to 0.2 M. The cutoff for both general non-bonded interaction and GB pairwise summation were set to 12 Å. Time step was 2 fs. SHAKE was applied for bond constraint. Slow-varying terms were evaluated every four steps. The coordinates were saved every 10 ps for a total of 100,000 snapshots per trajectory.
The snapshots were clustered using a hierarchical clustering method. Two snapshots are considered as neighbors when their pairwise Cα-RMSD is below 2.5 Å. The N-terminal residue and C-terminal residues were excluded in the clustering due to high flexibility. The snapshot with the most neighbors was identified as the center of the cluster which comprised all snapshots neighboring the center. The process was iterated to identify other clusters from the remaining snapshots.
A standard criterion for hydrogen bond was used in the analyses where the cutoff for donor-acceptor distance was set to 3.5 Å and the donor-hydrogen-acceptor angle cutoff was set to 120°. To monitor tertiary side chain contact, the minimum distances between each pair of side chains were calculated and the cutoff 5.0 Å was applied. All reported Cα-RMSD’s, unless otherwise stated, refer to the difference from the native X-ray structure of Chiu et al22 and the calculation excluded the first residue at the N-terminal and the last residue at the C-terminal due to high flexibility.
Supplementary Material
Acknowledgments
Supercomputer time has been provided by Professor Bertrum Ludaescher and Department of Computer Science at UC Davis and by Pittsburgh Supercomputer Center (MCA06T028). We are in debt to AMBER development team led by Dr. D. Case whose effort has made this work possible, to Dr. Plaxco for providing programs to calculate the contact orders, to Nancy Duan for proof-reading the manuscript. This work was supported by research grants from NIH (Grant Nos. GM64458 and GM67168 to Y.D.). Usage of Pymol, VMD, ViewerPro and Rasmol graphics packages is gratefully acknowledged.
Footnotes
Publisher's Disclaimer: This is a PDF file of an unedited manuscript that has been accepted for publication. As a service to our customers we are providing this early version of the manuscript. The manuscript will undergo copyediting, typesetting, and review of the resulting proof before it is published in its final citable form. Please note that during the production process errors may be discovered which could affect the content, and all legal disclaimers that apply to the journal pertain.
References
- 1.Onuchic JN, Luthey-Schulten Z, Wolynes PG. Theory of protein folding: the energy landscape perspective. Annu Rev Phys Chem. 1997;48:545–600. doi: 10.1146/annurev.physchem.48.1.545. [DOI] [PubMed] [Google Scholar]
- 2.Onuchic JN, Wolynes PG. Theory of protein folding. Curr Opin Struct Biol. 2004;14:70–75. doi: 10.1016/j.sbi.2004.01.009. [DOI] [PubMed] [Google Scholar]
- 3.Dill KA, Chan HS. From Levinthal to pathways to funnels. Nat Struct Biol. 1997;4:10–19. doi: 10.1038/nsb0197-10. [DOI] [PubMed] [Google Scholar]
- 4.Skolnick J. Putting the pathway back into protein folding. Proc Natl Acad Sci U S A. 2005;102:2265–2266. doi: 10.1073/pnas.0500128102. [DOI] [PMC free article] [PubMed] [Google Scholar]
- 5.Liwo A, Khalili M, Scheraga HA. Ab initio simulations of protein-folding pathways by molecular dynamics with the united-residue model of polypeptide chains. Proc Natl Acad Sci U S A. 2005;102:2362–2367. doi: 10.1073/pnas.0408885102. [DOI] [PMC free article] [PubMed] [Google Scholar]
- 6.Simmerling C, Strockbine B, Roitberg AE. All-atom structure prediction and folding simulations of a stable protein. J Am Chem Soc. 2002;124:11258–11259. doi: 10.1021/ja0273851. [DOI] [PubMed] [Google Scholar]
- 7.Chowdhury S, Lee MC, Xiong G, Duan Y. Ab initio folding simulation of the Trp-cage mini-protein approaches NMR resolution. J Mol Biol. 2003;327:711–717. doi: 10.1016/s0022-2836(03)00177-3. [DOI] [PubMed] [Google Scholar]
- 8.Pitera JW, Swope W. Understanding folding and design: replica-exchange simulations of “Trp-cage” miniproteins. Proc Natl Acad Sci U S A. 2003;100:7587–7592. doi: 10.1073/pnas.1330954100. [DOI] [PMC free article] [PubMed] [Google Scholar]
- 9.Zhou R. Trp-cage: folding free energy landscape in explicit water. Proc Natl Acad Sci U S A. 2003;100:13280–13285. doi: 10.1073/pnas.2233312100. [DOI] [PMC free article] [PubMed] [Google Scholar]
- 10.Snow CD, Zagrovic B, Pande VS. The Trp cage: Folding kinetics and unfolded state topology via molecular dynamics simulations. J Am Chem Soc. 2002;124:14548–14549. doi: 10.1021/ja028604l. [DOI] [PubMed] [Google Scholar]
- 11.Schug A, Herges T, Wenzel W. Reproducible protein folding with the stochastic tunneling method. Phys Rev Lett. 2003;91:158102. doi: 10.1103/PhysRevLett.91.158102. [DOI] [PubMed] [Google Scholar]
- 12.Carnevali P, Toth G, Toubassi G, Meshkat SN. Fast protein structure prediction using Monte Carlo simulations with modal moves. J Am Chem Soc. 2003;125:14244–14245. doi: 10.1021/ja036647b. [DOI] [PubMed] [Google Scholar]
- 13.Vila JA, Ripoll DR, Scheraga HA. Atomically detailed folding simulation of the B domain of staphylococcal protein A from random structures. Proc Natl Acad Sci U S A. 2003;100:14812–14816. doi: 10.1073/pnas.2436463100. [DOI] [PMC free article] [PubMed] [Google Scholar]
- 14.Khalili M, Liwo A, Scheraga HA. Kinetic studies of folding of the B-domain of staphylococcal protein A with molecular dynamics and a united-residue (UNRES) model of polypeptide chains. J Mol Biol. 2006;355:536–547. doi: 10.1016/j.jmb.2005.10.056. [DOI] [PubMed] [Google Scholar]
- 15.Snow CD, Nguyen H, Pande VS, Gruebele M. Absolute comparison of simulated and experimental protein-folding dynamics. Nature. 2002;420:102–106. doi: 10.1038/nature01160. [DOI] [PubMed] [Google Scholar]
- 16.Jang S, Kim E, Pak Y. Free energy surfaces of miniproteins with a bba motif: replica exchange molecular dynamics simulation with an implicit solvation model. Proteins. 2006;62:663–671. doi: 10.1002/prot.20771. [DOI] [PubMed] [Google Scholar]
- 17.Jang S, Kim E, Shin S, Pak Y. Ab initio folding of helix bundle proteins using molecular dynamics simulations. J Am Chem Soc. 2003;125:14841–14846. doi: 10.1021/ja034701i. [DOI] [PubMed] [Google Scholar]
- 18.Berendsen HJ. A glimpse of the Holy Grail? Science. 1998;282:642–643. doi: 10.1126/science.282.5389.642. [DOI] [PubMed] [Google Scholar]
- 19.McKnight CJ, Doering DS, Matsudaira PT, Kim PS. A thermostable 35-residue subdomain within villin headpiece. J Mol Biol. 1996;260:126–134. doi: 10.1006/jmbi.1996.0387. [DOI] [PubMed] [Google Scholar]
- 20.McKnight CJ, Matsudaira PT, Kim PS. NMR structure of the 35-residue villin headpiece subdomain. Nat Struct Biol. 1997;4:180–184. doi: 10.1038/nsb0397-180. [DOI] [PubMed] [Google Scholar]
- 21.Meng J, Vardar D, Wang Y, Guo HC, Head JF, McKnight CJ. High-resolution crystal structures of villin headpiece and mutants with reduced F-actin binding activity. Biochemistry. 2005;44:11963–11973. doi: 10.1021/bi050850x. [DOI] [PubMed] [Google Scholar]
- 22.Chiu TK, Kubelka J, Herbst-Irmer R, Eaton WA, Hofrichter J, Davies DR. High-resolution x-ray crystal structures of the villin headpiece subdomain, an ultrafast folding protein. Proc Natl Acad Sci U S A. 2005;102:7517–7522. doi: 10.1073/pnas.0502495102. [DOI] [PMC free article] [PubMed] [Google Scholar]
- 23.Lee MR, Duan Y, Kollman PA. Use of MM-PB/SA in estimating the free energies of proteins: Application to native, intermediates, and unfolded villin headpiece. Proteins. 2000;39:309–316. [PubMed] [Google Scholar]
- 24.Kubelka J, Eaton WA, Hofrichter J. Experimental tests of villin subdomain folding simulations. J Mol Biol. 2003;329:625–630. doi: 10.1016/s0022-2836(03)00519-9. [DOI] [PubMed] [Google Scholar]
- 25.Tang Y, Rigotti DJ, Fairman R, Raleigh DP. Peptide models provide evidence for significant structure in the denatured state of a rapidly folding protein: the villin headpiece subdomain. Biochemistry. 2004;43:3264–3272. doi: 10.1021/bi035652p. [DOI] [PubMed] [Google Scholar]
- 26.Wang M, Tang Y, Sato S, Vugmeyster L, McKnight CJ, Raleigh DP. Dynamic NMR line-shape analysis demonstrates that the villin headpiece subdomain folds on the microsecond time scale. J Am Chem Soc. 2003;125:6032–6033. doi: 10.1021/ja028752b. [DOI] [PubMed] [Google Scholar]
- 27.Brewer SH, Vu DM, Tang Y, Li Y, Franzen S, Raleigh DP, Dyer RB. Effect of modulating unfolded state structure on the folding kinetics of the villin headpiece subdomain. Proc Natl Acad Sci U S A. 2005;102:16662–16667. doi: 10.1073/pnas.0505432102. [DOI] [PMC free article] [PubMed] [Google Scholar]
- 28.Havlin RH, Tycko R. Probing site-specific conformational distributions in protein folding with solid-state NMR. Proc Natl Acad Sci U S A. 2005;102:3284–3289. doi: 10.1073/pnas.0406130102. [DOI] [PMC free article] [PubMed] [Google Scholar]
- 29.Herges T, Wenzel W. Free-energy landscape of the villin headpiece in an all-atom force field. Structure. 2005;13:661–668. doi: 10.1016/j.str.2005.01.018. [DOI] [PubMed] [Google Scholar]
- 30.Srinivasan R, Fleming PJ, Rose GD. Ab initio protein folding using LINUS. Methods Enzymol. 2004;383:48–66. doi: 10.1016/S0076-6879(04)83003-9. [DOI] [PubMed] [Google Scholar]
- 31.Ripoll DR, Vila JA, Scheraga HA. Folding of the villin headpiece subdomain from random structures. Analysis of the charge distribution as a function of pH. J Mol Biol. 2004;339:915–925. doi: 10.1016/j.jmb.2004.04.002. [DOI] [PubMed] [Google Scholar]
- 32.Lin CY, Hu CK, Hansmann UH. Parallel tempering simulations of HP-36. Proteins. 2003;52:436–445. doi: 10.1002/prot.10351. [DOI] [PubMed] [Google Scholar]
- 33.Duan Y, Kollman PA. Pathways to a protein folding intermediate observed in a 1-microsecond simulation in aqueous solution. Science. 1998;282:740–744. doi: 10.1126/science.282.5389.740. [DOI] [PubMed] [Google Scholar]
- 34.Duan Y, Wang L, Kollman PA. The early stage of folding of villin headpiece subdomain observed in a 200-nanosecond fully solvated molecular dynamics simulation. Proc Natl Acad Sci U S A. 1998;95:9897–9902. doi: 10.1073/pnas.95.17.9897. [DOI] [PMC free article] [PubMed] [Google Scholar]
- 35.Zagrovic B, Snow CD, Shirts MR, Pande VS. Simulation of folding of a small alpha-helical protein in atomistic detail using worldwide-distributed computing. J Mol Biol. 2002;323:927–937. doi: 10.1016/s0022-2836(02)00997-x. [DOI] [PubMed] [Google Scholar]
- 36.Shen MY, Freed KF. All-atom fast protein folding simulations: the villin headpiece. Proteins. 2002;49:439–445. doi: 10.1002/prot.10230. [DOI] [PubMed] [Google Scholar]
- 37.Zagrovic B, Pande VS. Simulated unfolded-state ensemble and the experimental NMR structures of villin headpiece yield similar wide-angle solution X-ray scattering profiles. J Am Chem Soc. 2006;128:11742–11743. doi: 10.1021/ja0640694. [DOI] [PubMed] [Google Scholar]
- 38.Jayachandran G, Vishal V, Garcia AE, Pande VS. Local structure formation in simulations of two small proteins. J Struct Biol. 2007;157:491–499. doi: 10.1016/j.jsb.2006.10.001. [DOI] [PMC free article] [PubMed] [Google Scholar]
- 39.Colubri A, Jha AK, Shen MY, Sali A, Berry RS, Sosnick TR, Freed KF. Minimalist representations nearest neighbor effects in and the importance of protein folding simulations. J Mol Biol. 2006;363:535–557. doi: 10.1016/j.jmb.2006.08.035. [DOI] [PubMed] [Google Scholar]
- 40.Bandyopadhyay S, Chakraborty S, Bagchi B. Coupling between hydration layer dynamics and unfolding kinetics of HP-36. J Chem Phys. 2006;125:084912. doi: 10.1063/1.2335451. [DOI] [PubMed] [Google Scholar]
- 41.Jayachandran G, Vishal V, Pande VS. Using massively parallel simulation and Markovian models to study protein folding: Examining the dynamics of the villin headpiece. J Chem Phys. 2006;124:164902. doi: 10.1063/1.2186317. [DOI] [PubMed] [Google Scholar]
- 42.Lei H, Wu C, Liu H, Duan Y. Folding free-energy landscape of villin headpiece subdomain from molecular dynamics simulations. Proc Natl Acad Sci U S A. 2007;104:4925–4930. doi: 10.1073/pnas.0608432104. [DOI] [PMC free article] [PubMed] [Google Scholar]
- 43.Karplus M, Weaver DL. Protein-Folding Dynamics - the Diffusion-Collision Model and Experimental-Data. Protein Sci. 1994;3:650–668. doi: 10.1002/pro.5560030413. [DOI] [PMC free article] [PubMed] [Google Scholar]
- 44.Baldwin RL. Intermediates in Protein Folding Reactions and Mechanism of Protein Folding. Ann Rev of Biochem. 1975;44:453–475. doi: 10.1146/annurev.bi.44.070175.002321. [DOI] [PubMed] [Google Scholar]
- 45.Fersht AR. Optimization of rates of protein folding: the nucleation-condensation mechanism and its implications. Proc Natl Acad Sci U S A. 1995;92:10869–10873. doi: 10.1073/pnas.92.24.10869. [DOI] [PMC free article] [PubMed] [Google Scholar]
- 46.Frank BS, Vardar D, Buckley DA, McKnight CJ. The role of aromatic residues in the hydrophobic core of the villin headpiece subdomain. Protein Sci. 2002;11:680–687. doi: 10.1110/ps.22202. [DOI] [PMC free article] [PubMed] [Google Scholar]
- 47.Vermeulen W, Troys MV, Bourry D, Dewitte D, Rossenu S, Goethals M, Borremans FAM, Vandekerckhove J, Martins JC, Ampe C. Identification of the PXW Sequence as a Structural Gatekeeper of the Headpiece C-terminal Subdomain Fold. J Mol Biol. 2006;359:1277–1292. doi: 10.1016/j.jmb.2006.04.042. [DOI] [PubMed] [Google Scholar]
- 48.Plaxco KW, Simons KT, Baker D. Contact order, transition state placement and the refolding rates of single domain proteins. J Mol Biol. 1998;277:985–994. doi: 10.1006/jmbi.1998.1645. [DOI] [PubMed] [Google Scholar]
- 49.Weikl TR, Dill KA. Folding rates and low-entropy-loss routes of two-state proteins. J Mol Biol. 2003;329:585–598. doi: 10.1016/s0022-2836(03)00436-4. [DOI] [PubMed] [Google Scholar]
- 50.Jewett AI, Pande VS, Plaxco KW. Cooperativity, smooth energy landscapes and the origins of topology-dependent protein folding rates. J Mol Biol. 2003;326:247–253. doi: 10.1016/s0022-2836(02)01356-6. [DOI] [PubMed] [Google Scholar]
- 51.Fernandez A, Shen MY, Colubri A, Sosnick TR, Berry RS, Freed KF. Large-scale context in protein folding: Villin headpiece. Biochemistry. 2003;42:664–671. doi: 10.1021/bi026510i. [DOI] [PubMed] [Google Scholar]
- 52.Nymeyer H, Garcia AE. Simulation of the folding equilibrium of alpha-helical peptides: A comparison of the generalized born approximation with explicit solvent. Proc Natl Acad Sci U S A. 2003;100:13934–13939. doi: 10.1073/pnas.2232868100. [DOI] [PMC free article] [PubMed] [Google Scholar]
- 53.Zhou R, Berne BJ. Can a continuum solvent model reproduce the free energy landscape of a beta -hairpin folding in water? Proc Natl Acad Sci U S A. 2002;99:12777–12782. doi: 10.1073/pnas.142430099. [DOI] [PMC free article] [PubMed] [Google Scholar]
- 54.Chowdhury S, Lei H, Duan Y. Denatured-state ensemble and the early-stage folding of the G29A mutant of the B-domain of protein A. J phys chem B. 2005;109:9073–9081. doi: 10.1021/jp0449814. [DOI] [PubMed] [Google Scholar]
- 55.Lei H, Dastidar SG, Duan Y. Folding transition-state and denatured-state ensembles of FSD-1 from folding and unfolding simulations. J phys chem. 2006;110:22001–22008. doi: 10.1021/jp063716a. [DOI] [PMC free article] [PubMed] [Google Scholar]
- 56.Lei H, Duan Y. The role of plastic beta-hairpin and weak hydrophobic core in the stability and unfolding of a full sequence design protein. J Chem Phys. 2004;121:12104–12111. doi: 10.1063/1.1822916. [DOI] [PubMed] [Google Scholar]
- 57.Lei H, Wu C, Wang Z, Duan Y. Molecular dynamics simulations and free energy analyses on the dimer formation of an amyloidogenic heptapeptide from human beta2-microglobulin: implication for the protofibril structure. J Mol Biol. 2006;356:1049–1063. doi: 10.1016/j.jmb.2005.11.087. [DOI] [PubMed] [Google Scholar]
- 58.Ponder JW, Case DA. Force fields for protein simulations. Adv Prot Chem: Protein Simulations. 2003;66:27–85. doi: 10.1016/s0065-3233(03)66002-x. [DOI] [PubMed] [Google Scholar]
- 59.Duan Y, Wu C, Chowdhury S, Lee MC, Xiong G, Zhang W, Yang R, Cieplak P, Luo R, Lee T, Caldwell J, Wang J, Kollman P. A point-charge force field for molecular mechanics simulations of proteins based on condensed-phase quantum mechanical calculations. J Comput Chem. 2003;24:1999–2012. doi: 10.1002/jcc.10349. [DOI] [PubMed] [Google Scholar]
- 60.Roe DR, Hornak V, Simmerling C. Folding cooperativity in a three-stranded beta-sheet model. J Mol Biol. 2005;352:370–381. doi: 10.1016/j.jmb.2005.07.036. [DOI] [PMC free article] [PubMed] [Google Scholar]
- 61.Maple JR, Cao YX, Damm WG, Halgren TA, Kaminski GA, Zhang LY, Friesner RA. A polarizable force field and continuum solvation methodology for modeling of protein-ligand interactions. J Chem Theory and Comp. 2005;1:694–715. doi: 10.1021/ct049855i. [DOI] [PubMed] [Google Scholar]
- 62.Kaminski GA, Friesner RA, Tirado-Rives J, Jorgensen WL. Evaluation and reparametrization of the OPLS-AA force field for proteins via comparison with accurate quantum chemical calculations on peptides. J Phys Chem B. 2001;105:6474–6487. [Google Scholar]
- 63.Kaminski GA, Stern HA, Berne BJ, Friesner RA, Cao YXX, Murphy RB, Zhou RH, Halgren TA. Development of a polarizable force field for proteins via ab initio quantum chemistry: First generation model and gas phase tests. J Comput Chem. 2002;23:1515–1531. doi: 10.1002/jcc.10125. [DOI] [PMC free article] [PubMed] [Google Scholar]
- 64.Anisimov VM, Lamoureux G, Vorobyov IV, Huang N, Roux B, MacKerell AD. Determination of electrostatic parameters for a polarizable force field based on the classical Drude oscillator. J Chem Theory and Comp. 2005;1:153–168. doi: 10.1021/ct049930p. [DOI] [PubMed] [Google Scholar]
- 65.MacKerell AD, Feig M, Brooks CL. Improved treatment of the protein backbone in empirical force fields. J Am Chem Soc. 2004;126:698–699. doi: 10.1021/ja036959e. [DOI] [PubMed] [Google Scholar]
- 66.Grossfield A, Ren PY, Ponder JW. Ion solvation thermodynamics from simulation with a polarizable force field. J Am Chem Soc. 2003;125:15671–15682. doi: 10.1021/ja037005r. [DOI] [PubMed] [Google Scholar]
- 67.Ren PY, Ponder JW. Temperature and pressure dependence of the AMOEBA water model. J Phys Chem B. 2004;108:13427–13437. [Google Scholar]
- 68.Oostenbrink C, Villa A, Mark AE, van Gunsteren WF. A biomolecular force field based on the free enthalpy of hydration and solvation: the GROMOS force-field parameter sets 53A5 and 53A6. J Comput Chem. 2004;25:1656–1676. doi: 10.1002/jcc.20090. [DOI] [PubMed] [Google Scholar]
- 69.Bashford D, Case DA. Generalized born models of macromolecular solvation effects. Ann Rev Phys Chem. 2000;51:129–152. doi: 10.1146/annurev.physchem.51.1.129. [DOI] [PubMed] [Google Scholar]
- 70.Rizzo RC, Aynechi T, Case DA, Kuntz ID. Estimation of absolute free energies of hydration using continuum methods: Accuracy of partial, charge models and optimization of nonpolar contributions. J Chem Theory and Comp. 2006;2:128–139. doi: 10.1021/ct050097l. [DOI] [PubMed] [Google Scholar]
- 71.Case DA, Darden TA, Cheatham TEI, Simmerling CL, Wang J, Duke RE, Luo R, Merz KM, Wang B, Pearlman DA, Crowley M, Brozell S, Tsui V, Gohlke H, Mongan J, Hornak V, Cui G, Beroza P, Schafmeister C, Caldwell JW, Ross WS, Kollman PA. AMBER 8. University of California; San Francisco: 2004. [Google Scholar]
- 72.Case DA, Cheatham TE, Darden T, Gohlke H, Luo R, Merz KM, Onufriev A, Simmerling C, Wang B, Woods RJ. The Amber biomolecular simulation programs. J Comput Chem. 2005;26:1668–1688. doi: 10.1002/jcc.20290. [DOI] [PMC free article] [PubMed] [Google Scholar]
- 73.Onufriev A, Case DA, Bashford D. Effective Born radii in the generalized Born approximation: The importance of being perfect. J Comput Chem. 2002;23:1297–1304. doi: 10.1002/jcc.10126. [DOI] [PubMed] [Google Scholar]
- 74.Onufriev A, Bashford D, Case DA. Exploring protein native states and large-scale conformational changes with a modified generalized born model. Proteins. 2004;55:383–394. doi: 10.1002/prot.20033. [DOI] [PubMed] [Google Scholar]
Associated Data
This section collects any data citations, data availability statements, or supplementary materials included in this article.


