Abstract
Accumulating evidence suggests that characteristics of pre-treatment FDG-PET could be used as prognostic factors to predict outcomes in different cancer sites. Current risk analyses are limited to visual assessment or direct uptake value measurements. We are investigating intensity-volume histogram metrics and shape and texture features extracted from PET images to predict patient's response to treatment. These approaches were demonstrated using datasets from cervix and head and neck cancers, where AUC of 0.76 and 1.0 were achieved, respectively. The preliminary results suggest that the proposed approaches could potentially provide better tools and discriminant power for utilizing functional imaging in clinical prognosis.
Keywords: Positron emission tomography, treatment outcomes, uptake values, image morphology, intensity-volume histograms, co-occurrence matrix, tumor shape, tumor heterogeneity
1. Introduction
Recent years have witnessed increased use of positron emission tomography (PET) in radiotherapy treatment planning and monitoring. In particular, [18F] Fluoro-2-deoxy-d-glucose (FDG), a glucose metabolism analog, has been frequently used in clinical practice for tumor detection, staging, and radiotherapy target definition of different cancer sites [1-3]. Recently, there has been accumulating evidence that pre-treatment FDG uptake could be used as a prognostic factor for predicting radiotherapy treatment outcomes [4-10]. This was motivated by the fact that tumor uptake is dependent on the characteristics of its microenvironment [11]. More recently, heterogeneity in FDG uptake in head and neck tumors has been reported in animal models [12]. The heterogeneity was attributed to the distribution of different tissue components within the tumor region. Typically, quantitative analysis of FDG uptake is conducted based on observed changes in the standardized uptake value (SUV). However, sole SUV measurements are potentially impacted by the initial FDG uptake kinetics and radiotracer distribution, which are dependent on the initial dose and the elapsing time between injection and image acquisition. In addition, some commonly reported SUV measurements might be sensitive to changes in tumor volume definition (e.g., maximum SUV). These factors and others might make such approach prone to significant intra- and inter-observer variability [6, 7]. Alternatively, there have been some efforts in the literature directed towards utilizing variations in the FDG distribution, characterized by its heterogeneous shape and texture, as potentially more robust prognostic metrics. Visual assessment was investigated to evaluate heterogeneity in FDG for patients with locally advanced rectal carcinoma [6] and cervix cancer [13]. Another visual pattern analysis technique was applied in Hicks et al. [7] for grading tumor response and normal tissue toxicity in patients with non-small cell lung cancer. Spatial heterogeneity metric based on deviation from an idealized ellipsoid structure (i.e., eccentricity) was found to have strong association with survival in patients with sarcoma [14, 15].
In this work, we are exploring two feature-based approaches for summarizing and extracting reliable information from PET images. This information would be used to derive prognostic metrics in outcome analysis and could potentially be incorporated into the clinical planning process to modify patients' treatment based on their predicted failure risk. For instance, this could be done by intensifying the treatment dose for patients that at are high risk of failure and providing less toxic regimens than standard for patients who are at lower risk.
The first approach is a histogram-based approach referred to as intensity-volume histogram (IVH), which is analogous to the dose-volume histogram (DVH) concept used for evaluating treatment plan in radiotherapy [16, 17] but is applied to functional imaging datasets instead of dose distributions. The IVH approach would summarize the 3D functional imaging intensity information into a single curve for each anatomic structure of interest, which will be used to derive intensity-volume metrics, as discussed later. The IVH may be represented in two forms: the cumulative integral IVH and the differential IVH. Considered here is only the cumulative IVH, which is a plot of the volume of a given structure as a function of image intensity (or normalized SUV) that is equal to or higher than a certain value.
The second approach extracts shape and texture features from PET images to characterize anatomical structure of interest. This would provide the analyst with objective morphological descriptors of PET uptake in these regions. As a proof of principle, we will mainly focus on commonly well-established features in the pattern recognition community. Hence, in addition to geometrical shape features such as eccentricity and solidity for shape description [15, 18], we also explore second-order histogram statistics or co-occurrence matrix features for texture analysis [19]. These features possess strong discriminant power and ability to mimic human perception of texture variability. Therefore, they have been widely applied in many complex industrial and medical pattern recognition tasks [20-25]. In PET imaging, texture analysis has been previously applied to evaluate the performance of reconstruction algorithms [26]. In addition, we demonstrate that complementary information among extracted features could be combined to capture differences in tumor metabolic activities between patients who respond to treatment and patients who do not respond to treatment. To our knowledge, this is the first report that utilizes a systematic pattern analysis approach for predicting cancer patients' treatment outcomes based on PET imaging.
2. Methods and Materials
As demonstrative examples, we analyzed two datasets of cervix cancer patients and head and neck cancer patients who received chemoradiotherapy as part of their treatment. All patients, in both sets underwent pre-chemoradiotherapy diagnostic FDG-PET in our institute. The PET images were acquired using a hybrid PET/CT Siemens Biograph with an in-plane spatial resolution of 5.3×5.3 mm/pixel and a slice thickness of 3.4 mm. The images were reconstructed using ordered-subsets expectation maximization algorithm with compensation for attenuation using CT-derived μ-maps. The cervix cancer dataset consisted of 14 patients. The data was analyzed for the endpoint of disease persistence (i.e., tumor did not eradicate as a result of treatment) 3 months post-radiotherapy. Half of the cervix patients had persistent disease after chemoradiotherapy treatment as diagnosed on their follow-up PET scans. The head and neck dataset consisted of 9 patients. Each patient underwent a CT simulation scan and diagnostic PET/CT scan providing 3 images per case (27 images in total). The dataset was analyzed for endpoint of overall survival rate. The patients had a median follow-up period of 30 months (range: 9-48 months). Four of the head and neck patients died during the follow-up period. Note that traditional disease staging evaluation was not predictive of response in these patients. Interested reader could find review literature on the current role of PET imaging for cervix cancer in Grigsby et al. [8] and in head and neck cancer in Greven et al. [27].
The pre-treatment scans were transferred using the Digital Imaging and Communications in Medicine (DICOM) protocol into the research treatment planning system CERR, which stands for Computational Environment for Radiotherapy Research [28], where the intensity values were converted into SUV. SUV is a decay-corrected measurement of activity per unit volume of tissue (MBq/mL) adjusted for administered activity per unit of body weight (MBq/kg) [29]. All patients had a maximum SUV greater than 2. An experienced oncologist outlined and recorded the clinical target volume (CTV), which includes a margin around the tumor to account for subclinical invasion of microdisease extensions. The gross tumor volume (GTV) delineation in the cervix cancer case was performed by thresholding the SUVs within the CTV at 40% of the maximum value [30], which is the current standard clinical practice in our institute. Figure 1 shows samples of contoured PET images for the cervix cancer case. In the case of head and neck, the tumor delineation of the PET's GTV, was performed manually by the physician (see figure 2) because the 40% maximum SUV is implicated as an unreliable criteria for the head and neck case [31]. Contouring of head and neck target volumes was done using a CT simulation scan fused with a PET/CT scan with the PET window level set at 40% of the maximum value. Delineation of target volumes for head and neck cancer was based on institutional guidelines that have been developed for each head and neck subsite. The standard practice at our institution also includes review of all available information including physical examination, imaging evaluations (CT, PET/CT, MRI, etc), endoscopic findings, operative reports, and pathologic reports. The current GTV definition guidelines in our institute include the elective nodes beside the primary tumor as shown in figure 2.
Figure 1.
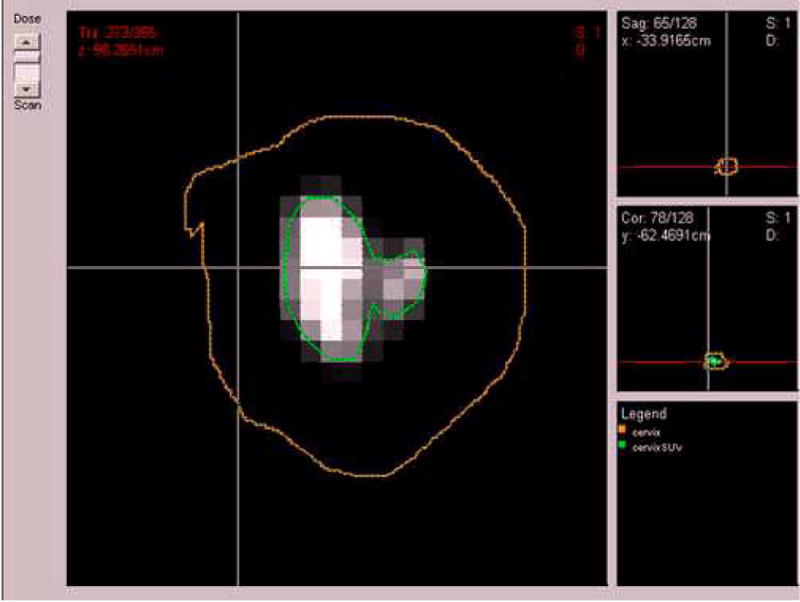
A pre-treatment PET scan of a cervix cancer case of a patient with persistent tumor at 3 months follow-up post-radiotherapy treatment. The cervix clinical tumor volume (CTV) was outlined by the physician (brown) and the 40% maximum SUV delineated tumor gross volume (GTV) (green).
Figure 2.
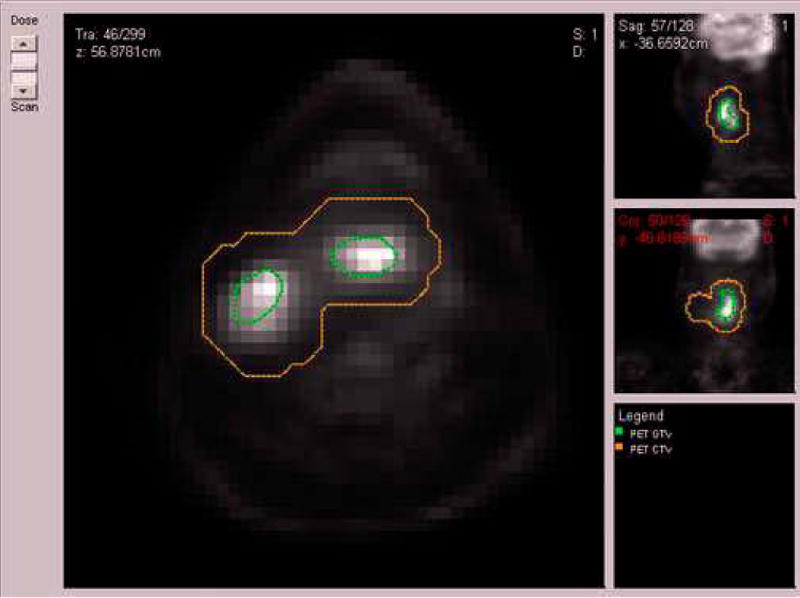
A pre-treatment PET scan of a head and neck cancer case of patient who died from disease after radiotherapy treatment. The head and neck clinical tumor volume (CTV) (brown) and the gross-tumor volume (GTV) (green) were outlined by the physician.
2.1 Intensity volume histogram
The typical role of the intensity volume histogram (IVH) is to reduce a complicated 3D data to a single easier to interpret curve, whereas in this case the volume of a selected structure is plotted as a function of image intensity (or normalized SUV) that is equal to or higher than a certain value.
The IVH method enables several useful metrics to be extracted from functional images for outcome analysis such as Ix (minimum intensity to x% highest intensity volume), Vx (percentage volume having at least x% intensity value), and other common descriptive statistics (mean, minimum, maximum, standard deviation, etc). Note in case of PET, the image intensity values are typically normalized into SUVs prior to calculations.
As potential measures for analyzing PET heterogeneity using this histogram-based approach, in addition to Ix and Vx, we also considered differential metrics such as (cf. tables 1, 2):
| (1) |
Table 1.
Association between different extracted features and treatment failures in a cohort of 14 cervix patients measured by Spearman's rank correlation (rs) and the area under the ROC curve (AUC).
| Variable | Spearman (rs) | AUC | |
|---|---|---|---|
| Tumor volume | -0.1074 | 0.5714 | |
| SUV Measurements | Maximum | -0.0886 | 0.4592 |
| Minimum | -0.0710 | 0.4592 | |
| Mean | -0.0886 | 0.4592 | |
| Standard deviation | -0.1240 | 0.5306 | |
| IVH Intensity-volume metrics | I10 | -0.1240 | 0.5306 |
| I90 | -0.0886 | 0.4592 | |
| I10-90 | -0.1595 | 0.5306 | |
| V10 | -0.3012 | 0.6122 | |
| V90 | 0.2304 | 0.6122 | |
| V10-90 | -0.3721 | 0.6531 | |
| Texture-based features | Energy | -0.4276 | 0.7245 |
| Contrast | 0.1949 | 0.6020 | |
| Local homogeneity | -0.3012 | 0.6224 | |
| Entropy | 0.2304 | 0.6531 | |
| Shape-based features | Eccentricity | 0.1949 | 0.6429 |
| Euler Number | -0.2747 | 0.6327 | |
| Solidity | 0.1949 | 0.7245 | |
| Extent | 0.2658 | 0.5612 | |
Table 2.
Association between different extracted features and overall survival in a cohort of 9 head and neck patients measured by Spearman's rank correlation (rs) and the area under the ROC curve (AUC).
| Variable | Spearman (rs) | AUC | |
|---|---|---|---|
| Tumor volume | 0.6928 | 0.8750 | |
| SUV Measurements | Maximum | 0.3464 | 0.7000 |
| Minimum | -0.2642 | 0.6000 | |
| Mean | 0.1732 | 0.6500 | |
| Standard deviation | 0.3464 | 0.6750 | |
| IVH Intensity-volume metrics | I10 | 0.1732 | 0.7000 |
| I90 | 0.0 | 0.5000 | |
| I10-90 | 0.2598 | 0.6750 | |
| V10 | -0.1732 | 0.5750 | |
| V90 | -0.7794 | 0.9500 | |
| V10-90 | 0.0866 | 0.5000 | |
| Texture-based features | Energy | 0.0866 | 0.5000 |
| Contrast | -0.5196 | 0.8000 | |
| Local homogeneity | 0.5196 | 0.8250 | |
| Entropy | -0.1732 | 0.5250 | |
| Shape-based features | Eccentricity | 0.2598 | 0.6500 |
| Euler Number | 0.6166 | 0.8500 | |
| Solidity | -0.6088 | 0.8500 | |
| Extent | -0.6062 | 0.8500 | |
Examples of IVH plots and these metrics for PET data in CERR are shown in figures 3 and 4. Note that the ‘x’ in Vx is chosen as a percentage of the maximum SUV for each patient because SUVs tend to have relatively large variability amongst patients. In our datasets, the maximum SUV range was 3-43 with a median of 12 for cervix patients and it had a range of 4-32 with a median of 16 for head and neck patients.
Figure 3.
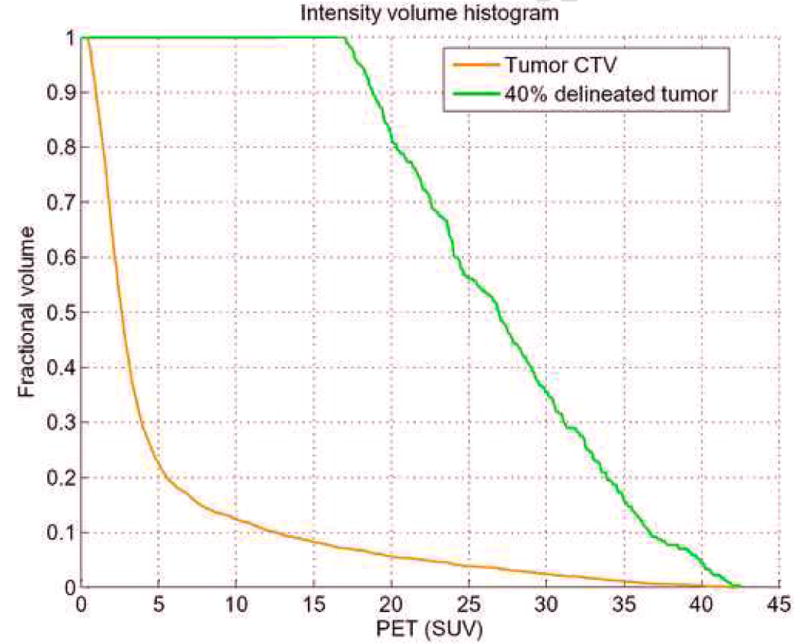
Intensity volume histogram (IVH) for cervix example showing the IVH plot for the clinical tumor region CTV (brown) and the 40% maximum SUV delineated tumor GTV (green). IVH-derived metrics such as Vx or Ix and their differentials could be extracted for outcome analysis.
Figure 4.
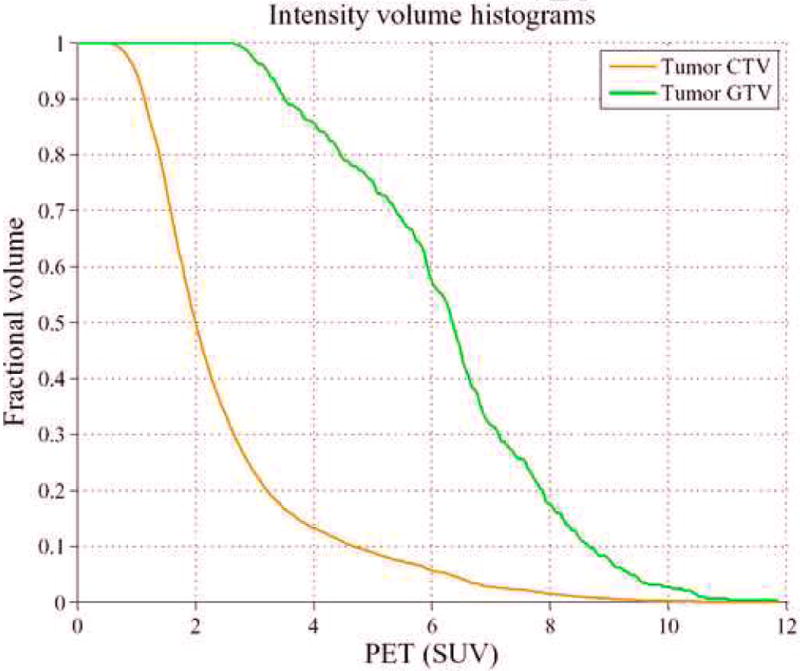
Intensity volume histogram (IVH) for the head and neck cancer example showing the IVH plot for the clinical tumor region CTV (brown) and the tumor GTV (green). IVH-derived metrics such as Vx or Ix, and their differentials could be extracted for analyzing outcomes.
2.2 Texture features using co-occurrence matrix
The co-occurrence features are based on the second-order joint conditional probability density function P(i,j;a,d) of a given texture image. The ith, jth element of the co-occurrence matrix for an anatomical structure of interest represents the number of times that intensity levels i and j occur in two voxels separated by distance (d) in direction (a). In our implementation d was set to a single voxel size, and a was selected to cover the 26-connected neighborhood in 3D space. For an image with M intensity levels, the co-occurrence matrix size is M × M. The M levels were obtained by applying a non-uniform quantization method (root-squared) to limit the size of the matrix and speedup computation. Note that in this case the main source of noise is actually due to quantization rather than the original image photon-limited count.a The values for M are typically selected in powers of 2 (8, 16, 32, etc). Shown in figures 5 and 6 are sample surface plots from clinical PET images.
Figure 5.
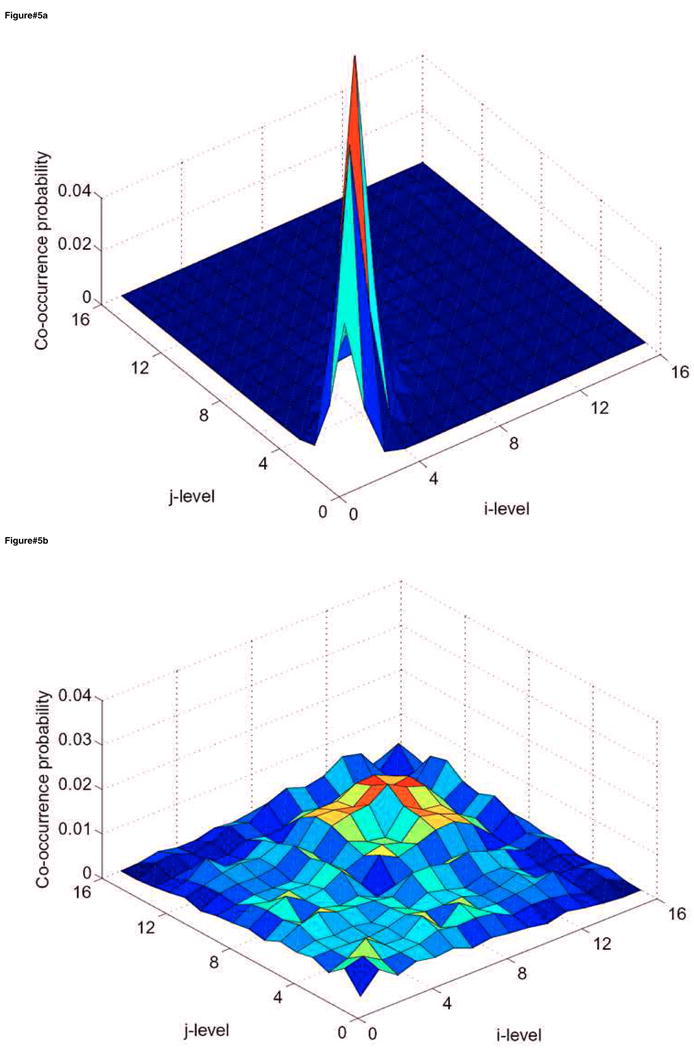
Surface plots of the co-occurrence matrix in the case of cervix cancer showing (a) the cervix tumor CTV and (b) 40% maximum SUV delineated tumor GTV. The texture pattern described by the co-occurrence matrix could be utilized to discriminate between homogeneous and heterogeneous tumors uptake. Note that the CTV is relatively smooth while the tumor is showing a ‘noisy’ texture pattern. The number of intensity levels (M) was selected to be 16 in this example.
Figure 6.
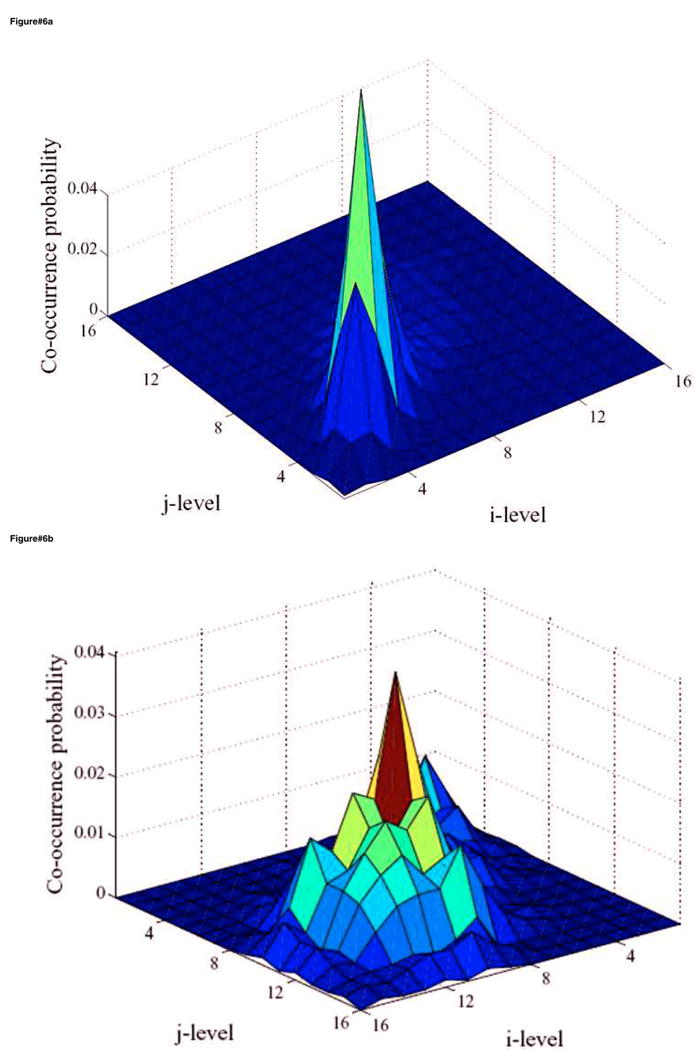
Surface plots of the co-occurrence matrix in the case of head and neck (H&N) cancer showing (a) the H&N tumor CTV and (b) the delineated tumor GTV. The texture pattern described by the co-occurrence matrix could be utilized to discriminate between homogeneous and heterogeneous tumors uptake. Note that the CTV is again relatively smooth while the tumor is showing a noisy pattern but less than that of the cervix case. The number of intensity levels (M) was selected to be 16 in this example.
Four co-occurrence features relevant to our application are defined as follows [19] (cf. Tables 1,2):
(2) (3) (4) (5)
These metrics are independent of tumor position, orientation, size, and brightness, and take into account the local intensity-spatial distribution [19, 32]. These are considered advantages of texture-based analysis over direct (first-order) histogram metrics (e.g., mean and standard deviation), which are currently practiced clinically in some institutes for analyzing PET metabolic uptake [8, 27]. Hence, these features can provide an intensity-spatially dependent map of the tumor metabolic uptake that can potentially be used a signature to characterize the tumor response to treatment.
2.3 Shape features
We computed the following geometrical shape features [18] (cf. tables 1,2):
-
Eccentricity (EC): is a measure of non-circularity defined in terms of the ratio of the minor axis to the major axis of the best-fitted ellipsoid to the structure of interest:
(6) where a is the semi-major axis and b is the semi-minor axis. EC values ranges from 0 (circle) to 1 (line).
Euler number (e): is the number of connected objects in a region minus the number of holes.
Solidity: this is a measurement of convexity and is defined as the proportion of pixels in the convex hull that are also in the region. The convex hull, defined as the smallest convex polygon that can contain the region, is computed using the Qhull algorithm [33].
Extent: is similar to solidity, however, it represents the proportion of pixels in the bounding box that are also in the region. The bounding box is defined as the smallest rectangle containing the region.
In our experiments, these features were mainly calculated for the tumor GTV region and in some cases; figures are presented for the surrounding CTV background for comparison purposes as discussed below.
2.4 Statistical analysis
We used Spearman's rank correlation (rs) and the area under the receiver-operating characteristics curve (AUC) to analyze the association between the extracted features and post-radiotherapy outcomes in cervix and head and neck cancers. Spearman's coefficient provides a simple yet robust nonparametric way to estimate bivariate increasing or decreasing trends that are not necessarily linear associations [34]. The receiver-operating characteristics (ROC) is a graph of the true positive fraction (sensitivity) versus the false positive fraction (1-specificity) for a continuum of threshold values. A value of the area under the curve (AUC) of 1 is ideal, while a value of 0.5 is equivalent to a random guess [35]. Figures 7 and 8 show ROC curves for outcome prediction based on PET analysis in cervix cancer and head and neck cancer, respectively. To improve the prediction power, we have adopted a multi-metric model building approach based on logistic regression and resampling methods to combine several prognostic factors [36], in which a logit transformation was used:
Figure 7.
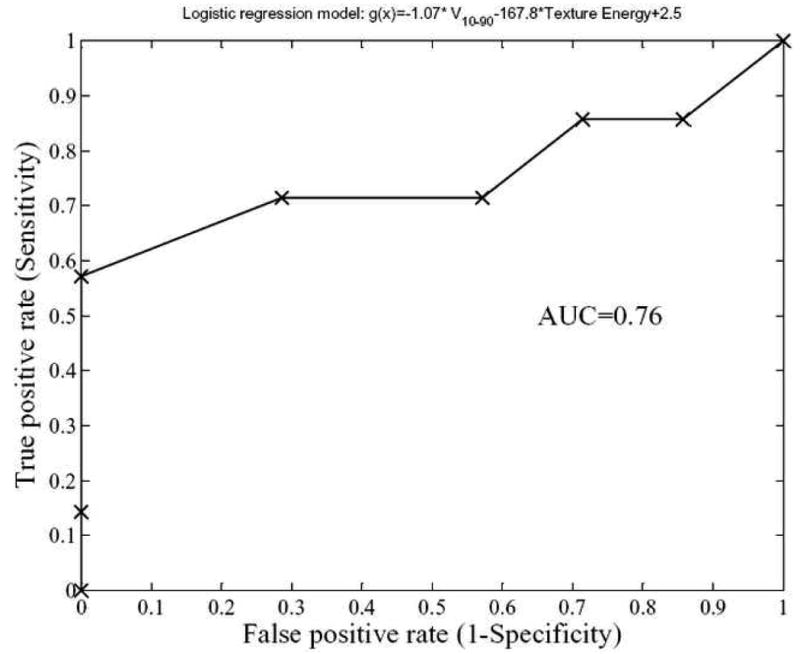
Receiver-operating characteristics (ROC) curve of a logistic regression model for cervix outcomes prediction composed of IVH-based and texture Energy. As demonstrated, the model has good prediction power with an area under the ROC curve (AUC) of 0.76.
Figure 8.
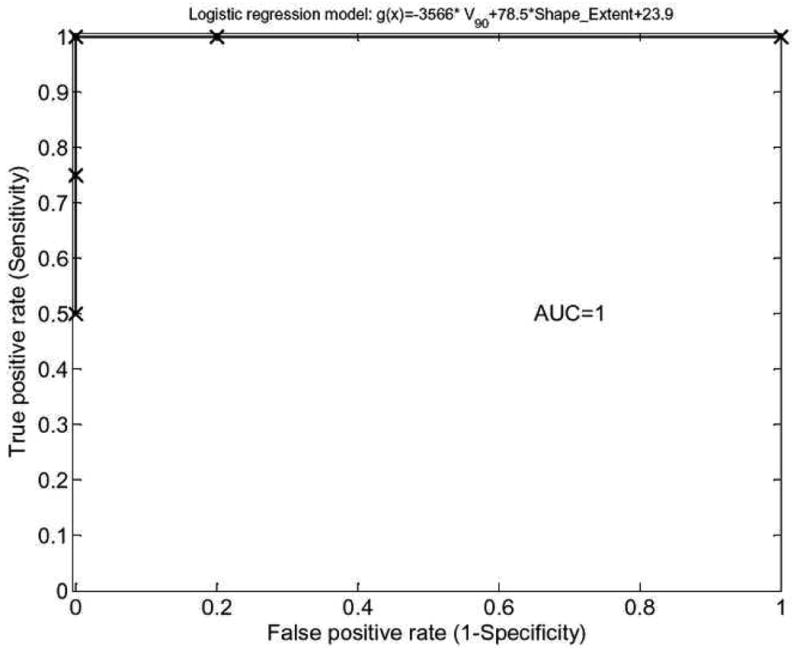
Receiver-operating characteristics (ROC) curve of a logistic regression model for head and neck outcomes prediction composed of IVH-based and shape extent characteristics. As demonstrated, the model possesses excellent prediction power with an area under the ROC curve (AUC) of 1.
| (7) |
where n is the number of patients, xi is a vector of the input variable values used to predict f(xi) for outcome yi of the ith patient. The ‘x-axis’ summation g (xi) is given by:
| (8) |
where p is in the number of selected feature metrics. The most relevant metrics are selected using a sequential forward search. The parameters of the model (βj) are estimated using maximum likelihood techniques. The validity of the derived logistic regression model was tested using the leave-one-out cross-validation resampling technique. The main rationale for using the logistic functional in (7) as a predictor is that treatment responses are thought to follow S-shaped curves [37]. This is in addition to its format simplicity for routine clinical evaluation.
3. Experimental results
As a demonstration of applying these methods to improve cancer treatment outcomes analysis in PET, we considered cohorts of 14 cervix cancer patients and 9 head and neck patients who were treated by chemoradiotherapy in our institute.
3.1 Cervix cancer example
In figure 3, we show the IVH plots for the clinical tumor volume (CTV) outlined by the oncologist and the 40% maximum SUV delineated cervix tumor corresponding to patient's PET scan of figure 1. Note that the IVH slope of the delineated tumor has a shallower slope compared to the CTV, indicating larger variability uptake values in the tumor region (due to spanning a wider range of intensities in the accumulative histogram). Shown in figure 5a, b are surface plots of co-occurrence matrix for the CTV and the cervix tumor. Note that the CTV is relatively smooth (entropy is 3.6) while the tumor is showing a ‘noisy’ pattern (entropy is 5.3), which is consistent with the shallow slope of the IVH (larger variability). Summarized in table 1 are the statistical analysis results. It is observed that the texture-based metrics in the table had the highest categorical prediction power of failure risk, while commonly used SUV descriptive statistics had the lowest predictive ability. Specifically, the IVH-based V10–90 and the texture energy were the most significant predictive features. A combined model of these two variables using logistic regression analysis is characterized by the following linear combination:
| (9) |
The model order was manually set to 2 and the variables were chosen by forward selection as explained in section 2.4. This model had an rs=0.49 (p=0.04) and an AUC=0.76 as shown in figure 7.
3.2 Head and neck cancer example
We carried out similar analysis for the head and neck case with an endpoint of overall survival. In figure 4, we show the IVH plots for the CTV and the tumor GTV outlined by the oncologist corresponding to patient's PET scan of figure 2. Note that the IVH slopes of the CTV and the GTV are more comparable in terms of their steepness/shallowness in contrast with the cervix case; this could be due to the relatively more heterogeneous nature of FDG uptake in surrounding normal tissues in head and neck cases. Shown in figure 6a, b are the surface plots of co-occurrence matrix for the CTV and the head and neck gross tumor. Notice that the texture map of the CTV is again less noisy than that of the tumor (entropy of 3.8 versus 4.7, respectively), but was less smooth than the cervix case (cf. figure 5a and figure 6a). Whereas the cervix tumor's texture map was noisier than that of the head and neck tumor (cf. figure 5b and figure 6b). Summarized results for statistical analysis of the head and neck data are found in table 2. It is interesting to notice from table 2, that shape-based metrics had the highest categorical prediction power of failure risk, while commonly used SUV descriptive statistics had the lowest predictive ability. The IVH-based V90 had the highest univariate predictive power of survival outcome. However, the tumor volume was also noted to be a good predictor of outcome, which is consistent with previous findings [38-40].
We have chosen again to build a two-metric logistic regression model. The IVH-based V90 and shape extent were chosen for constructing the model, which is characterized by the following linear combination:
| (10) |
This model had an rs=0.87 (p= 0.0012) and an AUC=1 as shown in figure 8, which is a perfect fit results for this small cohort of 9 patients. Larger datasets are needed to validate the prediction power of this model.
4. Discussion
In this work, we have investigated methods based on pattern recognition for analyzing functional imaging data to ameliorate reported shortcomings of relying on visual inspection or sole traditional standardized uptake value (SUV) measurements in assessing treatment relative risk. These methods would allow for extracting potential prognostic factors from functional imaging data that could be more robust, informative, and discriminative than simplistic SUV descriptive statistics to predict treatment outcomes.
Two distinct approaches were explored for analyzing functional imaging information. The first category is histogram-based reduction of 3D functional imaging data and is denoted as intensity-volume histogram (IVH). The IVH analysis of functional imaging information inherits the same advantages and disadvantages of histogram analyses in analyzing volumetric data. Metrics such an Ix and Vx are derived from IVH plots and could be used to build predictive models of outcomes as demonstrated in Section 3. Nevertheless, IVH like other first-order histogram approaches is limited by its spatial insensitivity. To overcome this limitation, we have also investigated image-based features such as texture and shape attributes.
Unlike SUV descriptive statistics and IVH metrics, image-based features would have spatial and topological information embedded in them. As a proof of principle, we have used the co-occurrence matrix features to represent texture information because of its relatively simple and intuitive structure. Surface plots of the co-occurrence matrix give a pictorial representation of the spatial-intensity distribution, which is typically masked by first-order histogram analyses. Several metrics could be derived from the co-occurrence matrix to characterize the texture features of the structure of interest. We have chosen only four features from this pool, which we thought were most relevant for analyzing PET prognostic value, mainly focused on characterizing uptake's heterogeneity texture patterns. However, other invariant texture features approaches could be investigated as well such as the multi-channel Gabor filter, wavelet transform, Markov model, etc, which may not suffer from information loss due to quantization. These methods and others are surveyed in [41].
For shape analysis, we have chosen geometric shape features such as eccentricity, Euler number, solidity, and extent. The Euler number is particularly useful for analyzing necrotic tumors or GTVs that include lymph nodes structures in addition to the primary tumor as noticed in figure 2. As this shape feature can capture the presence of multiple uptake regions within the region of interest.
We have selected two cancer sites for demonstrating our methods, other sites such as lung maybe good candidates as well, however, issues related to respiratory motion artifacts need to be addressed carefully. We observed from our preliminary analysis, that the predictive variables were site and endpoint specific. In both the cervix and the head and neck examples, an IVH-based variable was among the strongest correlates with outcome. However, the texture features seemed to be more relevant in the cervix case, while shape features appeared to be more prevalent in the head and neck case. The prevalence of shape features in this case might be affected by the GTV definition that included active lymph nodes. We noted that the prediction in the case of cervix cancer was modest compared to head and neck cancer. This could be attributed to inability of the selected features to fully characterize tumor persistence in cervix cancer based on heterogeneity of FDG-uptake only and possibly additional variables related to irradiation resistance such as oxygenation levels need to be included in analysis ass well. In general, we conjecture that heterogeneity metrics such as entropy and local homogeneity may be most relevant if texture matters, while eccentricity and shape convexity would be more prevalent if shape matters. The presented results are based on a small cohort of patients and are intended for demonstrative purposes. Analysis on larger data sets would be required to shed more light on role of these metrics and their clinical relevance. We expect that these imaging metrics will complement and enrich currently existing clinical knowledge.
For effective use of PET imaging as a biomarker and proper application of pattern recognition features, deliberate attempts should be made to ensure that the PET scanning of the patients follows the same standard with regard to blood glucose concentration, FDG dose, interval between FDG injection and imaging, and imaging duration. In addition, it should be noted that shape metrics are relatively more sensitive than texture metrics to delineation variations. Manual contouring is known to suffer from inter-observer variabities [42]. Therefore, automated methods would be preferred to manual contouring when possible. However, currently used threshold-based approaches may be prone to errors [43]. We have recently investigated an automated concurrent PET/CT image segmentation algorithm based on active contours that can potentially provide better performance than its counterparts by jointly analyzing the CT and the PET boundary information [44].
In our analysis, we have emphasized building a multi-metric model of relevant features to further improve the predictive power by exploiting complementary information in these features [36]. This approach has improved the prediction power for both cervix cancer and head and neck cancer cases in comparison to using a single metric (correlation in cervix case improved by about 14% and in head and neck by about 12%). However, other models based on machine learning [45, 46], which are able to capture nonlinear pattern relationships could provide better discriminant power as in our previous work in mammography [47].
We believe that using the proposed pattern analysis methodology would potentially enrich the set of tools available to the outcome analyst in oncology to extract the most relevant information from functional imaging data.
5. Conclusions
We have proposed a systematic pattern recognition approach for analyzing functional imaging data, in particular for FDG-PET. This would allow for extracting robust visual cues and features that could facilitate incorporation of PET imaging information to understand better patient's response to radiotherapy treatment and reduce the subjectivity induced by visual assessment. The intensity volume histogram (IVH) summarizes intensity-volume relationships in functional images, which could have clinical treatment implication regarding dose coverage adequacy for the oncologist. Image texture and shape features are valuable tools to mimic human perception of visual cues without being prone to inter- and intra-observer variability. In particular, texture features could significantly aid in summarizing tumor uptake characteristics in its microenvironment and its relation to treatment resistance in certain clinical scenarios. Our preliminary results are encouraging and suggest that the proposed methodologies could yield beneficial and more robust tools for treatment response assessment based on functional imaging information. However, further testing using larger datasets is required to validate the quality of extracted relevant features from PET images for clinical decision-making.
Acknowledgments
This work was supported in part by NIH grant R01 CA 85181 and American Cancer Society IRG-58-010-50.
Biographies
Issam El Naqa received his B.Sc. (1996) and M.Sc. (1995) in Electrical and Communication Engineering from the University of Jordan, Jordan, Ph.D. (2002) in Electrical Engineering from Illinois Institute of Technology, Chicago, IL, USA, and M.A. (2007) in Biology from Washington University in St. Louis, St. Louis, MO, USA. He is currently an assistant professor at department of Radiation Oncology at Washington University School of medicine, St. Louis, MO, USA. He is a member of IEEE, AAPM, and ASTRO. His current research interests include image processing, pattern recognition, machine learning, and treatment outcomes.
Perry W. Grigsby received his M.D. (1982) from University of Kentucky, Lexington, KY, USA. He is a board certified radiation oncologists at the Siteman Cancer of the Barnes-Jewish Hospital. He is currently a Professor of Radiation Oncology, Nuclear Medicine, and Gynecologic Oncology and a Director of the Brachytherapy & microRT Treatment Center. Dr. Grigsby is a fellow of the American Cancer Society and is an expert (America's best doctors) in the detection, diagnosis and treatment of gynecological and thyroid cancers, with numerous publications in these areas. His current research interests include gynecologic oncology, cervical cancer, thyroid cancer, gynecologic brachytherapy, and PET imaging.
Aditya Apte, M.Sc. is a software engineer and works on developing CERR an in-house research treatment planning system.
Elizabeth Kidd, M.D. is a medical resident in radiation oncology.
Eric Donnelly, M.D., is a medical fellow in radiation oncology.
Divya Khullar, M.Sc., is a software engineer and works on developing CERR an in-house research treatment planning system.
Summer Chaudhari, B.Sc., is a PhD candidate in medical physics
Deshan Yang received his B.Sc. (1992) in Electrical Engineering from Tsinghua University, Beijing, China, M.Sc. (2001) in Computer Science from Illinois Institute of Technologies, Chicago, IL, USA, Ph.D. (2005) in Biomedical Engineering from Wisconsin, Madison. He is currently a post-doctoral fellow at the department of Radiation Oncology at Washington University School of medicine, St. Louis, MO, USA. He is an IEEE and AAPM member. His current research interests include image processing, pattern recognition, an motion estimation.
Martin Schmitt, B.Sc., is a PET technologist at the Mallinckrodt Institute of Radiology at Washington University School of medicine, St. Louis, MO, USA.
Richard Laforest received his B.Sc. (1989), M.Sc. (1991), and Ph.D. (1994) in Experimental Nuclear Physics, Laval University, Quebec Canada. He is currently and associate professor and co-Director of the Small Animal Imaging Laboratory at the Mallinckrodt Institute of Radiology at Washington University School of medicine, St. Louis, MO, USA. His current research interest involves the developments of multimodality (PET/CT) small animal imaging instruments and techniques.
Wade L. Thorstad received his M.D. from the University of Texas Medical School, Houston, Texas, 1991. He is a board certified in radiation oncology and nuclear medicine at the Siteman Cancer of the Barnes-Jewish Hospital. He is an assistant professor of radiation oncology and specializes in head and neck cancer. His research interests include head and neck oncology, thoracic cancer, tumors, systemic radiotherapy, radioimmunotherapy, radioimmunodiagnosis, nuclear oncology, and PET imaging.
Joseph O. Deasy received his B.Sc (1984) in electrical engineering and his Ph.D. (1992) in physics from University of Kentucky, Lexington, KY, USA. He is currently a professor and director of the Bioinformatics and Outcomes Research division at department of Radiation Oncology at Washington University School of medicine, St. Louis, MO, USA. He is a member of IEEE, AAPM, and ASTRO. Dr. Deasy has been a principle investigator on many NIH funded projects. He is an associate Editor for Medical Physics journal and serves as the chair of the AAPM biological effects committee. He was the Co-chair of the joint NSF/NCI conference on Operations Research Applications in Radiation Therapy, Virginia, 2002. His current research interests include bioinformatics, statistical modeling, treatment planning optimization, and radiobiology.
Footnotes
For a uniform-quantizer, assuming uniformly distributed data, the signal-to-noise ratio is given by 6 dB/bit. This would be improved by about 2 dB for non-uniform case (Jain, 1989).
Publisher's Disclaimer: This is a PDF file of an unedited manuscript that has been accepted for publication. As a service to our customers we are providing this early version of the manuscript. The manuscript will undergo copyediting, typesetting, and review of the resulting proof before it is published in its final citable form. Please note that during the production process errors may be discovered which could affect the content, and all legal disclaimers that apply to the journal pertain.
References
- 1.Biersack HJ, Bender H, Palmedo H. FDG-PET in monitoring therapy of breast cancer. Eur J Nucl Med Mol Imaging. 2004;31 1:S112–7. doi: 10.1007/s00259-004-1533-x. [DOI] [PubMed] [Google Scholar]
- 2.Bradley J, Thorstad WL, Mutic S, et al. Impact of FDG-PET on radiation therapy volume delineation in non-small-cell lung cancer. Int J Radiat Oncol Biol Phys. 2004;59:78–86. doi: 10.1016/j.ijrobp.2003.10.044. [DOI] [PubMed] [Google Scholar]
- 3.Mutic S, Malyapa RS, Grigsby PW, et al. PET-guided IMRT for cervical carcinoma with positive para-aortic lymph nodes-a dose-escalation treatment planning study. Int J Radiat Oncol Biol Phys. 2003;55:28–35. doi: 10.1016/s0360-3016(02)03804-x. [DOI] [PubMed] [Google Scholar]
- 4.Brun E, Kjellen E, Tennvall J, et al. FDG PET studies during treatment: prediction of therapy outcome in head and neck squamous cell carcinoma. Head Neck. 2002;24:127–35. doi: 10.1002/hed.10037. [DOI] [PubMed] [Google Scholar]
- 5.Hope AJ, Saha P, Grigsby PW. FDG-PET in carcinoma of the uterine cervix with endometrial extension. Cancer. 2006;106:196–200. doi: 10.1002/cncr.21573. [DOI] [PubMed] [Google Scholar]
- 6.Kalff V, Duong C, Drummond EG, et al. Findings on 18F-FDG PET scans after neoadjuvant chemoradiation provides prognostic stratification in patients with locally advanced rectal carcinoma subsequently treated by radical surgery. J Nucl Med. 2006;47:14–22. [PubMed] [Google Scholar]
- 7.Hicks RJ, Mac Manus MP, Matthews JP, et al. Early FDG-PET imaging after radical radiotherapy for non-small-cell lung cancer: Inflammatory changes in normal tissues correlate with tumor response and do not confound therapeutic response evaluation. Int J Radiat Oncol Biol Phys. 2004;60:412–418. doi: 10.1016/j.ijrobp.2004.03.036. [DOI] [PubMed] [Google Scholar]
- 8.Grigsby PW, Siegel BA, Dehdashti F, et al. Posttherapy [18F] fluorodeoxyglucose positron emission tomography in carcinoma of the cervix: response and outcome. J Clin Oncol. 2004;22:2167–71. doi: 10.1200/JCO.2004.09.035. [DOI] [PubMed] [Google Scholar]
- 9.Allal AS, Slosman DO, Kebdani T, et al. Prediction of outcome in head-and-neck cancer patients using the standardized uptake value of 2-[18F]fluoro-2-deoxy-D-glucose. Int J Radiat Oncol Biol Phys. 2004;59:1295–300. doi: 10.1016/j.ijrobp.2003.12.039. [DOI] [PubMed] [Google Scholar]
- 10.Xue F, Lin LL, Dehdashti F, et al. F-18 fluorodeoxyglucose uptake in primary cervical cancer as an indicator of prognosis after radiation therapy. Gynecol Oncol. 2006;101:147–51. doi: 10.1016/j.ygyno.2005.10.005. [DOI] [PubMed] [Google Scholar]
- 11.Pugachev A, Ruan S, Carlin S, et al. Dependence of FDG uptake on tumor microenvironment. Int J Radiat Oncol Biol Phys. 2005;62:545–53. doi: 10.1016/j.ijrobp.2005.02.009. [DOI] [PubMed] [Google Scholar]
- 12.Henriksson E, Kjellen E, Wahlberg P, et al. 2-Deoxy-2-[18F] fluoro-D-glucose uptake and correlation to intratumoral heterogeneity. Anticancer Res. 2007;27:2155–9. [PubMed] [Google Scholar]
- 13.Miller TR, Pinkus E, Dehdashti F, et al. Improved prognostic value of 18F-FDG PET using a simple visual analysis of tumor characteristics in patients with cervical cancer. J Nucl Med. 2003;44:192–7. [PubMed] [Google Scholar]
- 14.O'Sullivan F, Roy S, Eary J. A statistical measure of tissue heterogeneity with application to 3D PET sarcoma data. Biostat. 2003;4:433–448. doi: 10.1093/biostatistics/4.3.433. [DOI] [PubMed] [Google Scholar]
- 15.O'Sullivan F, Roy S, O'Sullivan J, et al. Incorporation of tumor shape into an assessment of spatial heterogeneity for human sarcomas imaged with FDG-PET. Biostat. 2005;6:293–301. doi: 10.1093/biostatistics/kxi010. [DOI] [PubMed] [Google Scholar]
- 16.Drzymala RE, Mohan R, Brewster L, et al. Dose-volume histograms. Int J Radiat Oncol Biol Phys. 1991;21:71–8. doi: 10.1016/0360-3016(91)90168-4. [DOI] [PubMed] [Google Scholar]
- 17.Mohan R, Brewster LJ, Barest GD. A technique for computing dose volume histograms for structure combinations. Med Phys. 1987;14:1048–52. doi: 10.1118/1.595984. [DOI] [PubMed] [Google Scholar]
- 18.Jain AK. Fundamentals of digital image processing. Englewood Cliffs, NJ: Prentice Hall; 1989. [Google Scholar]
- 19.Haralick R, Shanmugam K, Dinstein I. Texture Features for Image Classification. IEEE Trans on Sys Man and Cyb SMC. 1973;3:610–621. [Google Scholar]
- 20.Andre Victor A, Wagner CAP, Antonio Fernando CI, et al. Complexity curve and grey level co-occurrence matrix in the texture evaluation of breast tumor on ultrasound images. Medical Physics. 2007;34:379–387. doi: 10.1118/1.2401039. [DOI] [PubMed] [Google Scholar]
- 21.Mudigonda NR, Rangayyan R, Desautels JEL. Gradient and texture analysis for the classification of mammographic masses. Medical Imaging, IEEE Transactions on. 2000;19:1032–1043. doi: 10.1109/42.887618. [DOI] [PubMed] [Google Scholar]
- 22.Soh LK, Tsatsoulis C. Texture analysis of SAR sea ice imagery using gray level co-occurrence matrices. Geoscience and Remote Sensing, IEEE Transactions on. 1999;37:780–795. [Google Scholar]
- 23.El-Naqa I, Yang Y, Wernick MN, et al. A support vector machine approach for detection of microcalcifications. IEEE Trans Med Imaging. 2002;21:1552–63. doi: 10.1109/TMI.2002.806569. [DOI] [PubMed] [Google Scholar]
- 24.Alvarenga A, Pereira W, Infantosi A, et al. Complexity curve and grey level co-occurrence matrix in the texture evaluation of breast tumor on ultrasound images. Med Phys. 2007;34:379–387. doi: 10.1118/1.2401039. [DOI] [PubMed] [Google Scholar]
- 25.Yu S, Guan L. A CAD system for the automatic detection of clustered microcalcifications in digitized mammogram films. IEEE Trans Med Imaging. 2000;19:115–26. doi: 10.1109/42.836371. [DOI] [PubMed] [Google Scholar]
- 26.Lucht R, Brix G, Lorenz WJ. Texture analysis of differently reconstructed PET images. Phys Med Biol. 1996;41:2207–19. doi: 10.1088/0031-9155/41/10/025. [DOI] [PubMed] [Google Scholar]
- 27.Greven KM. Positron-emission tomography for head and neck cancer. Semin Radiat Oncol. 2004;14:121–9. doi: 10.1053/j.semradonc.2003.12.005. [DOI] [PubMed] [Google Scholar]
- 28.Deasy JO, Blanco AI, Clark VH. CERR: A Computational Environment for Radiotherapy Research. Med Phys. 2003;30:979–985. doi: 10.1118/1.1568978. [DOI] [PubMed] [Google Scholar]
- 29.Strauss LG, Conti PS. The Applications of PET in Clinical Oncology. J Nucl Med. 1991;32:623–648. [PubMed] [Google Scholar]
- 30.Miller TR, Grigsby PW. Measurement of tumor volume by PET to evaluate prognosis in patients with advanced cervical cancer treated by radiation therapy. Int J Radiat Oncol Biol Phys. 2002;53:353–9. doi: 10.1016/s0360-3016(02)02705-0. [DOI] [PubMed] [Google Scholar]
- 31.Nestle U, Kremp S, Schaefer-Schuler A, et al. Comparison of Different Methods for Delineation of 18F-FDG PET-Positive Tissue for Target Volume Definition in Radiotherapy of Patients with Non-Small Cell Lung Cancer. J Nucl Med. 2005;46:1342–1348. [PubMed] [Google Scholar]
- 32.Castleman KR. Digital image processing. Englewood Cliffs, N.J.: Prentice Hall; 1996. [Google Scholar]
- 33.Bradford Barber C, Dobkin DP, Huhdanpaa H. The Quickhull Algorithm for Convex Hulls. ACM transactions on mathematical software. 1996;22:15. [Google Scholar]
- 34.Hollander M, Wolfe DA. Nonparametric statistical methods. 2nd. New York: Wiley; 1999. [Google Scholar]
- 35.Hanley J, McNeil B. The meaning and use of the area under a receiver operating characteristic (ROC) curve. Radiology. 1982;143:29–36. doi: 10.1148/radiology.143.1.7063747. [DOI] [PubMed] [Google Scholar]
- 36.El Naqa I, Bradley JD, Lindsay PE, et al. Multi-variable modeling of radiotherapy outcomes including dose-volume and clinical factors. Int J Radiat Oncol Biol Phys. 2006;64:1275–1286. doi: 10.1016/j.ijrobp.2005.11.022. [DOI] [PubMed] [Google Scholar]
- 37.Steel GG. Basic clinical radiobiology. 3rd. London: New York: Arnold; Oxford University Press; 2002. [Google Scholar]
- 38.Chao KSC, Ozyigit G, Blanco AI, et al. Intensity-modulated radiation therapy for oropharyngeal carcinoma: impact of tumor volume. Int J Radiat Oncol Biol Phys. 2004;59:43–50. doi: 10.1016/j.ijrobp.2003.08.004. [DOI] [PubMed] [Google Scholar]
- 39.Grabenbauer GG, Steininger H, Meyer M, et al. Nodal CT density and total tumor volume as prognostic factors after radiation therapy of stage III/IV head and neck cancer. Radiother Oncol. 1998;47:175–83. doi: 10.1016/s0167-8140(98)00016-4. [DOI] [PubMed] [Google Scholar]
- 40.Plataniotis GA, Theofanopoulou ME, Kalogera-Fountzila A, et al. Prognostic impact of tumor volumetry in patients with locally advanced head-and-neck carcinoma (non-nasopharyngeal) treated by radiotherapy alone or combined radiochemotherapy in a randomized trial. Int J Radiat Oncol Biol Phys. 2004;59:1018–26. doi: 10.1016/j.ijrobp.2004.01.021. [DOI] [PubMed] [Google Scholar]
- 41.Zhang J, Tan T. Brief review of invariant texture analysis methods. Pattern Recognition. 2002;35:735–747. [Google Scholar]
- 42.Riegel AC, Berson AM, Destian S, et al. Variability of gross tumor volume delineation in head-and-neck cancer using CT and PET/CT fusion. Int J Radiat Oncol Biol Phys. 2006;65:726–32. doi: 10.1016/j.ijrobp.2006.01.014. [DOI] [PubMed] [Google Scholar]
- 43.Hoffmann AL, van Dalen JA, Lee J, et al. Regarding Davis et al.: Assessment of 18F PET signals for automatic target volume definition in radiotherapy treatment planning. Radiother Oncol. 2007;83:102–103. doi: 10.1016/j.radonc.2006.11.020. [DOI] [PubMed] [Google Scholar]
- 44.El Naqa I, Yang D, Khullar D, et al. Concurrent Multimodality Image Segmentation by Active Contours for Radiotherapy Treatment Planning. Med Phys. 2007 doi: 10.1118/1.2799886. in press. [DOI] [PubMed] [Google Scholar]
- 45.Shawe-Taylor J, Cristianini N. Kernel methods for pattern analysis. Cambridge, UK; New York: Cambridge University Press; 2004. [Google Scholar]
- 46.Vapnik V. Statistical Learning Theory. New York: Wiley; 1998. [Google Scholar]
- 47.El-Naqa I, Yang Y, Wernick MN, et al. A support vector machine approach for detection of microcalcifications. Medical Imaging, IEEE Transactions on. 2002;21:1552–1563. doi: 10.1109/TMI.2002.806569. [DOI] [PubMed] [Google Scholar]


