Abstract
Noninvasive imaging of glucose in tissues could provide important insights about glucose gradients in tissue, the origins of gluconeogenesis, or perhaps differences in tissue glucose utilization in vivo. Direct spectral detection of glucose in vivo by 1H NMR is complicated by interfering signals from other metabolites and the much larger water signal. One potential way to overcome these problems is to use an exogenous glucose sensor that reports glucose concentrations indirectly through the water signal by chemical exchange saturation transfer (CEST). Such a method is demonstrated here in mouse liver perfused with a Eu3+-based glucose sensor containing two phenylboronate moieties as the recognition site. Activation of the sensor by applying a frequency-selective presaturation pulse at 42 ppm resulted in a 17% decrease in water signal in livers perfused with 10 mM sensor and 10 mM glucose compared with livers with the same amount of sensor but without glucose. It was shown that livers perfused with 5 mM sensor but no glucose can detect glucose exported from hepatocytes after hormonal stimulation of glycogenolysis. CEST images of livers perfused in the magnet responded to changes in glucose concentrations demonstrating that the method has potential for imaging the tissue distribution of glucose in vivo.
Keywords: glucose distribution, molecular imaging, CEST imaging using responsive agents, liver
The success of Gd3+ chelates as MRI contrast agents (CA) has stimulated interest in the development of a new generation of smart CA’s that report on their biological environment through specific molecular recognition mechanisms (1). Such agents could potentially provide more specific diagnostic information beyond that currently offered by T1 relaxation agents. Several recent pioneering molecular imaging papers have illustrated the concept of using a CA to report transgene activity in vivo through reporter molecules induced by exogenous mRNA (2), gene-encoded virus (3), and protein-combined nano-particles (4). So far, these applications have been largely limited to T1 or T2 relaxation agents and the reporter molecules have been over-expressed to achieve the required detection sensitivity.
An alternative way to alter contrast in an MR image is to change the total water signal detected in the experiment rather than the relaxation characteristics of water protons. This can be achieved in chemical exchanging systems by applying a presaturation pulse to saturate any mobile proton signals that have a different chemical shift from bulk water, as first demonstrated by Ward et al. (5) and McMahon et al. (6) in diamagnetic molecules (CEST) and by Aime et al. (7) and Zhang et al. (8) in paramagnetic lanthanide complexes (PARACEST). Recently, we reported that a phenylboronate-bearing PARACEST agent with remarkable binding affinity and selectivity toward glucose (Glc) (9,10). This finding offers the potential for a new venue through which glucose levels may be monitored in organs by CEST MRI.
Imaging the tissue distribution of glucose at high spatial resolution could prove invaluable for metabolic research. One could potentially map the distribution of glucose in various organs simultaneously, determine which tissues are producing glucose (if a gradient is detectable), or evaluate in real time any differences in glucose utilization by tissues. This could provide new insights regarding when and where glucose is produced, stored, transported, and used, and how glucose metabolism responds to various therapies. This information could be invaluable in studies of patients with diabetes (11). Glucose sensors have been the subject of active research in several areas. Positron emission tomography (PET) is widely used to monitor glucose metabolism in various cancers (12), but PET is limited by poor spatial resolution (>3 mm) and it depends on the use of the radio-isotope, fluorodeoxyglucose (FDG), as a tracer. 1H MRS is another potential tool because it can detect glucose directly in vivo (13) but it suffers interferences from the signals of other small metabolites having similar chemical shifts. 13C MRS offers excellent spectral resolution for studying glucose metabolism (14) but requires hardware that is not widely available on clinical MRI scanners. Ultraviolet, fluorescence, circular dichroism (CD), and electrochemical methods have also been used to sense sugars (15–17) but these methods cannot be applied in vivo in any imaging context. MRI has the advantage of allowing imaging of organs with exquisite resolution (18) so it would be desirable to combine clinical MRI with a molecular recognition technique that senses glucose and reports the concentration of glucose indirectly using of tissue water as a readout signal.
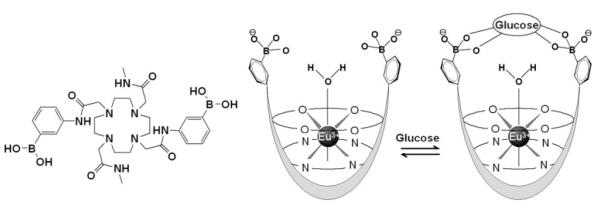
The glucose imaging technique reported here uses the PARACEST agent shown in Scheme 1. The agent contains the paramagnetic lanthanide ion, Eu3+, chelated by a macrocyclic ligand containing a glucose recognition site. DOTA-tetraamide ligands such as this form kinetically stable complexes with the trivalent lanthanide cations, an important consideration for safety of such agents in vivo. The Eu3+ ion, with one less unpaired electron than Gd3+, has little affect on the T1 or T2 of water protons because of the very short electronic correlation time (τe ∼ 10-12 s) of this ion. Complexation of glucose by the two phenylboronic acid moieties of the complex is reversible and surprising fast in solution. These features make this agent potentially useful for monitoring changes in glucose that may occur on the time-scale of a typical imaging experiment. The coordination sphere of the Eu3+ ion is occupied by eight donor atoms of the ligand (4 nitrogen and 4 oxygen donors) plus a single water molecule. This water coordination position lies on or near the fourfold symmetry axis of the complex, a position which gives rise to an unusually large hyperfine shift in the water protons (∼50 ppm at 25°C). This large chemical shift difference between the Eu3+-bound water proton signal and the bulk water protons allows for easy, selective RF saturation of the bound water protons with minimal indirect saturation of bulk water. In the presence of glucose, the phenylboronate groups of the agent capture a single glucose (9) and, in doing so, slow exchange of water from the inner coordination sphere of the Eu3+ ion with bulk water. This in turn causes a substantial change in CEST that is easily detected by MRI.
Scheme 1.
The chemical structure (left) and proposed binding model for EuDOTAM-2M-2PB with glucose.
METHODS
Materials
The perfusate used in the experiment was a modified Krebs-Henseleit bicarbonate buffer (95% O2 and 5% CO2) consisting of 118 mM NaCl, 5 mM KCl, 1.2 mM MgSO4, 25 mM NaHCO3, and 1.2 mM CaCl2 and 0.2 mM octanoate (oxidative fuel source) but no glucose (unless otherwise specified). The chemicals used were general lab agents with analytical or better purity grade (Sigma Aldrich). The complex, EuDOTAM-bis(methyl)-bis(phenylboronate), abbreviated EuDOTAM-2M-2PB, was synthesized as reported previously (9). 99% enriched [1-13C]-glucose was purchased from Cambridge Isotope Laboratories, MA.
Animals
All protocols were approved by the University of Texas Southwestern Medical Center Animal Care and Use Committee. For perfused liver studies, experiments were performed on two groups of healthy female C57BL6 mice (a total of 5 animals) weighing 22 ± 2 grams. One group of the animals were fasted for 24 hr with free access to water while the other group was given access to standard laboratory chow before removal of livers for perfusion. The isolated livers weighed on average 1.2 ± 0.1 grams.
Liver Perfusions
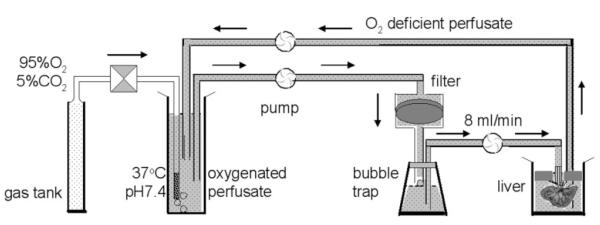
Briefly, animals were anesthetized by intramuscular injection of ketamine (Ketaset, Aveco, Fort Dodge, IA) before a mid-line laparotomy to expose the liver and portal circulatory system. The portal vein was cannulated, and heparin (50 IU) was injected into the portal vein to prevent the formation of blood clots. The hepatic vein and inferior vena cava were dissected and perfusate was pumped through the portal vein using peristaltic pump at 8 mL/min. The liver was carefully removed from the carcass and suspended in a container. The liver perfusion was carried out on the bench using the circulation system diagramed in Scheme 2. The effluent perfusate was siphoned off and discarded during the initial 10 min followed by recirculation of ∼100 mL of perfusate containing the glucose sensor (5 mM or 10 mM as indicated). The temperature of the isolated liver was maintained at 37°C by warm water from a controlled temperature bath circulating around the container holding the liver. In experiments involving glucagon, a 200 μL dose of freshly prepared glucagon (500 pg/mL) was added to the perfusate at the times indicated. The pH of the circulating perfusate was 7.4 ± 0.1 throughout the study.
Scheme 2.
Schematic of the liver perfusion apparatus.
High Resolution NMR Experiments
All high-resolution NMR spectra were collected using either a Varian INOVA 400 MHz or 500 MHz NMR spectrometer using 5 mm inverse-detect (ID) probes. Variable temperature 1H NMR spectra of Eu(DOTAM-2M-2PB) in the absence and presence (1:1) of glucose were collected over the temperature range 22–55°C. 2D 1H-1H and 13C-13C EXSY spectra of the Eu3+-based glucose sensor were collected using a mixing time 25 ms. Z-spectra were collected over the temperature range 4–50°C (277–323 K), and the samples were allowed to equilibrate in the probe for approximately 10 min at the set temperature before acquisition. A square-wave presaturation pulse (CW) of variable duration (0.5–6 s) and at power levels varying from 0.25–2 kHz was applied for 1–2 s. A 2-ms crusher gradient was used to remove the residual transverse magnetization before a 60° Z-magnetization readout pulse. Typically, the saturation offset frequency, ω, was varied over a spectral range, 120 ppm to -80 ppm, in 1-ppm steps. A 6-s delay between scans was sufficient for all magnetization to return to equilibrium after each scan. Ten preacquisition dummy scans were applied to allow establishment of the initial magnetization steady-state before recording each Z-spectrum. The data were collected with a single scan at each offset frequency and a total of 201 offset frequencies for each z-spectrum. The Z-magnetization was measured as the integral of the residual water peak after each presaturation pulse. The life-time of Eu3+-bound water was evaluated numerically by a three-pool exchange model as described previously using Matlab Software (Mathworks, Natick, MA, USA) (24).
Imaging Experiments
Images of excised livers were collected using a 4.7T Varian INOVA spectrometer in a 40-cm horizontal bore magnet and a 2.5-cm surface coil (DOTY scientific, Inc. Columbia, SC) positioned under a cylinder-shaped sample holder (ID 2.8 cm, height 1.5 cm) designed to hold two freshly perfused livers side-by-side during imaging. The sample was covered with a thermo-blanket which was connected to a recirculating water bath for temperature control at 37°C. For imaging of perfused livers in the magnet, water warmed to 37°C was circulated through the perfusion chamber. The pulse sequence for CEST imaging consists of a presaturation pulse, followed by a standard spin-echo imaging pulse sequence. Typically, a Gaussian-shaped presaturation pulse was used with duration of 2 s and power level (B1) of 1 kHz. The saturation frequency ω was set either set on the Eu3+-bound water resonance frequency (42 ppm at 37°C, “on-resonance”) or very far off resonance (at 120 ppm, “off-resonance”); subtraction of these two images on a pixel-by-pixel basis yields a CEST image. Other imaging parameters included a [FOV] = 40 × 40 mm, 128 × 128 matrix, single 2 mm slice, TR = 4s, TE = 13 ms, NA = 1 scan. The total scan time for collecting a set of “on-resonance” and “off-resonance” saturation images was 17 min.
For comparative purposes, two freshly perfused livers (one perfused with glucose and one without) were imaged side-by-side in the same experiment. Here, the signal intensity ratio (Iglucose / Icontrol) between the two livers was evaluated in regions of uniform intensity (avoiding blood vessels) and the average and standard deviation are reported from two independent imaging measurements. For livers perfused in the magnet with variable amounts of glucose in the perfusate, a baseline CEST image was collected before addition of glucose. Glucose was added incrementally to the perfusate as a solid, and after an equilibration period of 15 min, a CEST image was collected. The CEST image intensities and standard deviations were obtained from measurements of three selected regions of interest (ROIs) of equal-size and uniform appearance (region with visible vasculature were not selected). Postac-quisition image processing was performed on ImageJ (software free available on-line from NIH web site: http://rsb.info.nih.gov/ij/).
Glucose in effluent perfusate was measured by enzymatic assay (glucose oxidase) using a 8451 Diode Array Spectrophotometer (Hewlett-Packard). Perfusate oxygen and pH were measured by using a pH/blood gas analyzer (Instrumentation Laboratory, Lexington, MA).
RESULTS
1H and 13C NMR spectra
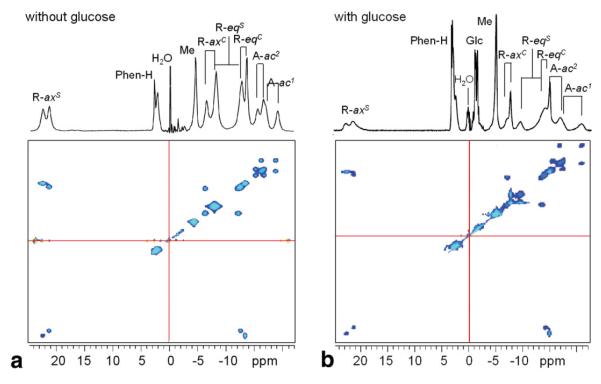
Figure 1 shows the 1H NMR spectra of the Eu3+-based glucose sensor in the absence (Fig. 1a) and presence (Fig. 1b) of 1:1 glucose (20 mM) in aqueous solution at 25°C, together with 2D EXSY spectra for illustrating the patterns of proton exchange in EuDOTAM-2M-2PB. The 12 magnetically nonequivalent CH2 ligand protons show six cross-peaks consistent with interconversion between two diastereomers having C2 symmetry. This pattern is similar to other EuDOTA-tetraamide complexes that have two different ligating side-chains (20). The chemical shifts of the ligand protons in this complex span ∼ 44 ppm (+23 ppm to -21 ppm with water set to 0 ppm), characteristic of a square antiprism (SAP) coordination isomer in solution. No evidence could be found for the presence of the twisted square anti-prism (TSAP) coordination isomer in solution, indicating that concentration of this coordination isomer must be well below the detection limits of the experiment (21,22). Nevertheless, the TSAP coordination isomer must be present at least as a short-lived intermediate through which the two SAP enantiomers interconvert by macrocyclic ring flips and pendant arm rotations (Scheme S1, Supporting Data) and this has implications concerning the rate of water exchange. The tentative assignments of ligand protons in the complex are given in Figure 1.
FIG. 1.
a,b: 1H EXSY NMR spectrum of 20 mM EuDOTAM-2M-2PB in D2O at 400 MHz with water suppression at 20°C in the absence (a) and presence (b) of 1:1 glucose. The mixing time was 25 ms. The chemical shift of water solvent is referenced to 0 ppm. [Color figure can be viewed in the online issue, which is available at www.interscience.wiley.com.]
The CEST spectra (described below) show that water exchange between the single Eu3+-bound water molecule in this complex and bulk water is quite temperature sensitive. Because the water exchange rate is a critical parameter in CEST imaging, we investigated the possible role of interchange between the two SAP enantiomers in solution as a contributing factor to water exchange. It is known that water exchange occurs faster in the less compact TSAP structures (22,23) so the fact that the TSAP structure is an intermediate in the interconversion of the two SAP enantiomers (Scheme S1, Supporting Data), one could hypothesize that slowing this interconversion by binding of glucose to the SAP isomer may contribute to slowing of water exchange. To test this hypothesis, high resolution 1H NMR spectra of the complex were collected as a function of temperature in the absence and presence of 1:1 glucose. Figure 2 shows the patterns of the two most highly shifted macrocyclic protons, labeled axial (axS) (Scheme S1, Supporting Data). It can be seen that, with an increase in temperature, these resonances shift toward higher field and broaden dramatically over this temperature range. The temperature-induced line-broadening is clearly smaller in the presence of glucose. Because the paramagnetic contribution to the linewidth should be smaller at higher temperatures, the line-broadening effects observed here must largely reflect the rate of interconversion rate between the two SAP enantiomers (axS interconverts with eqC, Scheme S1, Supplementary Materials, which can be viewed at http://www.interscience.wiley.com/jpages/1058-8388/suppmat). Clearly, this process slows when glucose is bound to the agent.
FIG. 2.
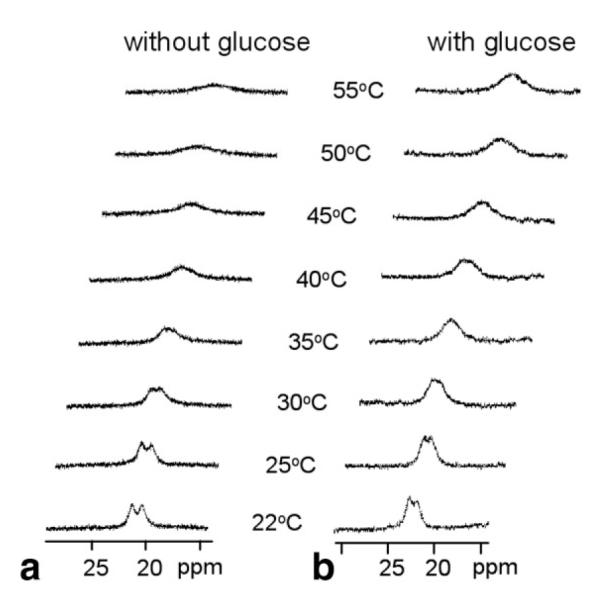
a,b: 1H NMR spectra of 20 mM EuDOTAM-2M-2PB cyclen axial protons in the most downfield region at various temperature in the absence (a) and presence (b) of 20 mM glucose, at 400 MHz, pH 7. The increased line broadening at higher temperatures is due to the more rapid intramolecular exchange process discussed in the text.
The binding of glucose to EuDOTAM-2M-2PB appears to be fast on the 1H NMR time scale because a separate set of resonances was not observed for free glucose when added in excess (data not shown). However, both free glucose and Eu3+-bound glucose resonances were observed in the 13C NMR spectra of the sensor mixed with 99%-enriched [1-13C]glucose (Fig. S1, Supporting Data). It is clear from the 13C NMR spectra that binding of glucose takes place at the boronate groups of EuDOTAM-2M-2PB as evidenced by the appearance of multiplets in the shifted resonances due to 2J-coupling between C1 of glucose and 11B(I = 3/2, natural abundance 80.1%) and 10B(I = 3, natural abundance 19.9%) of the extended phenylboronate side-arms. We presented data earlier to demonstrate that glucose forms a 1:1 complex with this agent and both phenylbor-onate groups contribute to binding (9,10).
CEST Spectra
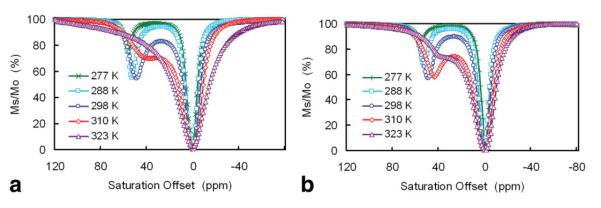
Figure 3 shows CEST spectra of EuDOTAM-2M-2PB at various temperatures between 4 and 50°C (277–323 K) in the absence (Fig. 3a) and presence (Fig. 3b) of glucose. These spectra are characterized by a peak in the 40–55 ppm region arising from exchange of a single Eu3+-bound water molecule with bulk solvent molecules and a large peak due to direct saturation of bulk water at 0 ppm. With an increase in temperature, the Eu3+-bound water CEST peak broadens due to exchange and shifts to lower frequency due to a decrease in effective magnetic moment of the paramagnetic Eu3+ ion at higher temperatures. Similar temperature dependencies have been reported for other Eu3+-based PARACEST agents (19). In the absence of glucose, the two exchange peaks merge when the temperature reaches ∼50°C (323 K). In the presence of the glucose, these same peaks are not fully merged at 50°C, indicative of slower water exchange when glucose is bound to the agent. Spectra such as these can be fit to the Bloch equations modified for exchange (24) to provide the rate of water exchange from EuDOTAM-2M-2PB in the absence and presence of glucose. A fit of these CEST spectra to a three-pool model (bulk water, Eu3+-bound water and exchanging —NH protons on the ligand) gives Eu3+-bound water lifetimes (τM)of 22 and 43 μs in the absence and presence of glucose, respectively.
FIG. 3.
a,b: Z-spectra of 10 mM EuDOTAM-2M-2PB at 500MHz and various temperatures in the absence (a) and presence (b) of 20 mM glucose. The presaturation pulse was a hard square pulse with a B1 power level of 1 kHz and duration of 2 s.
Depending on which temperature the CEST spectra are collected, the depth of the exchange peak (minimum in Ms/Mo) varies from 13 to 46% with a maximal effect occurring near 25°C. This may be attributed to optimal matching of the water exchange rate and the applied field (B1 = 1 kHz) at this temperature. However, the largest change in CEST intensity ± glucose coincidently occurs near the physiological temperature of 37°C where the observed CEST effect was 30 % and 42% in the absence and presence of glucose, respectively. This translates to a change in bulk water signal intensity of 17% ((0.70–0.58)/0.70) when glucose binds to EuDOTAM-2M-2PB at 37°C, a magnitude that should be easily detected by CEST imaging.
Optimizing the Presaturation Pulse Power and Duration
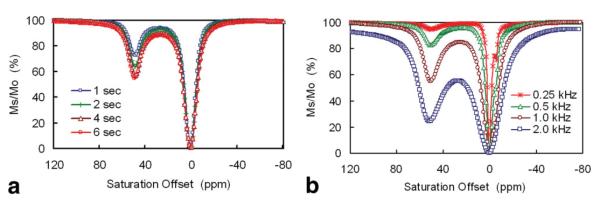
The CEST image intensities one can detect using this sensor depends of course upon sensor concentration, the pulse power (B1) and the length of presaturation time. As shown in Figure 4a, CEST increases with increasing presaturation time but reaches ∼80% maximum intensity after a presaturation period of 2 s. Therefore, a 2-s presaturation period was chosen for tissue studies. Similarly, CEST increases with increasing power of the presaturation pulse (B1) (24) as illustrated in Figure 4b. Under these experimental conditions, the minimal B1 power level to observe CEST was ∼250 Hz and the CEST intensity grew in proportion to power up to ∼1 kHz. Further increases in power resulted in substantial attenuation due to direct saturation of the bulk water peak at these high power levels. Thus, 1 kHz was chosen as the maximum power level for further in situ studies.
FIG. 4.
a: Z-spectra of 10 mM EuDOTAM-2M-2PB collected using various presaturation pulse lengths in the presence of 20 mM glucose, 500 MHz, 25°C. b: Z-spectra of 40 mM EuL at various saturation power levels (B1) in the absence of glucose, 400 MHz, 20°C, presaturation duration = 2 s. The small CEST peak at -5 ppm is from the ligand —NH protons.
Glucose Sensing in Perfused Livers
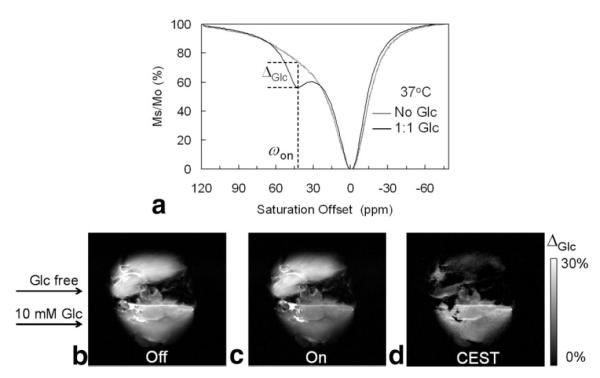
To investigate the effectiveness of EuDOTAM-2M-2PB as a PARACEST sensor for ex vivo glucose imaging, livers were isolated from standard laboratory mice and perfused in the presence of the sensor ± glucose. First, a liver was isolated from a fed mouse and perfused with buffer containing 10 mM EuDOTAM-2M-2PB and 10 mM glucose to mimic hyperglycemia (typical blood glucose levels in the diabetic state is 7–10 mM). A second liver (to serve as a control) was removed from a 24 hr fasted mouse and perfused an equivalent amount of sensor but no glucose. Both livers were perfused on the bench for 25 min to insure complete equilibration of the agent into all extracellular space. At the end of this perfusion period, a small amount of perfusate was collected from each liver for further characterization. The CEST spectrum of the perfusate lacking glucose (Fig. 5a) showed no clear exchange peak while the spectrum of the perfusate containing both glucose and agent showed a distinct CEST peak at the known Eu3+-bound water position (∼42 ppm at 37°C). Although the change in CEST intensity shown here ± glucose appears to differ from the data presented in Figure 3, this apparent difference can be completely attributed to the influence of NMR frequency on CEST (the CEST spectra shown in Figure 5a were collected using a 4.7 Tesla (T) animal scanner while the spectra reported in Figure 3 were collected using a 500 MHz NMR spectrometer). Quantitatively, however, the change in CEST intensity induced by glucose, ΔGlc, was exactly the same, 17%, here at 200 MHz as found previously at 500 MHz. To verify that the CEST differences reported in Figure 5a can indeed be traced to the difference in glucose levels between these two perfusate samples, glucose was also analyzed by enzymatic assay. Indeed, the glucose concentration in the perfusate collected from the fasted liver was measured at 0.03 mM while glucose in the effluent from the fed mouse liver originally perfused with 10 mM glucose was found to be 9.87 mM. Thus, the CEST differences shown in Figure 5a can be ascribed entirely to the differences in concentration of glucose in the two samples.
FIG. 5.
a: Z-spectra of fresh effluent from a perfused fed-mouse liver and a 24-hr fasted mouse liver at 37°C showing a glucose-induced CEST peak at ωon = 42 ppm. Both perfusates contained 10 mM EuDOTAM-2M-2PB agent, pH = 7.4. b,c: CEST images of a fed mouse liver (bottom) and a 24-hr fasted mouse liver (top) perfused with 10 mM EuDOTAM-2M-2PB agent in the presence (fed liver) and absence (fasted liver) of 10 mM glucose, 37°C. The “off-resonance” image (b) showed no contrast between the two livers while the “on-res-onance” image (c) showed image darkening of fed liver versus the fasted mouse liver with ωon = 42 ppm. d: The CEST image showed the glucose-induced CEST contrast between the fed and fasted mouse livers.
Given the reasonable assumption that the perfusate had fully equilibrated with all extracellular space in these livers during the 25 min perfusion period, a similar CEST difference should also be apparent in the tissue. Furthermore, given the sizable extracellular space in liver tissue (25), the effects should be nearly as large as those measured in the perfusate samples. MR images of these same livers were collected at the end of the 25-min perfusion period; the control image in Figure 5b was collected using a 2-s presaturation pulse far “off-resonance” while the image shown in Figure 5c was collected usinga1kHz presaturation pulse “on-resonance” at 42 ppm (ωon) for a period of 2 s. The CEST image (5d) illustrates the intensity differences between Figure 5a and b. For the “off-resonance” image, there were no apparent differences in contrast between the two livers with an average image intensity ratio (Iglucose/ Iglucose-free) of 0.95 ± 0.05 for two ROI positioned near the center of each liver. However, for the “on-resonance” image, the intensity of the liver perfused with glucose was substantially altered; now the intensity ratio in the images of the two livers was 0.75 ± 0.04. The CEST image (obtained by subtraction) shows that the liver lacking glucose very nearly cancels while the CEST image of the liver perfused with glucose is uniformly bright throughout the tissue. The CEST image is even brighter in the liver vasculature as expected because those regions contain more agent and glucose per unit volume and less tissue. These results suggest that the intensities in the solid tissue regions of the CEST image reflect the distribution of extracellular glucose.
Given these initial observations, a second set of experiments was designed to test whether this sensor is capable of detecting glucose being exported from liver, either as a result of glycogenolysis (breakdown of liver glycogen) or gluconeogenesis (synthesis of glucose from precursors). Given that liver can store a substantial amount of glucose in the form of glycogen, we chose to use the hormone, glucagon, to initiate glycogenolysis from a liver isolated from a well-fed mouse. Glucagon acts by binding to receptors on the hepatic cell membrane which, through a cas- cade of events, subsequently triggers release of glucose into the extracellular space (25). The liver from a 24-hr fasted mouse (no liver glycogen) was again used as control (26). Both livers were perfused with glucose-free KH buffer plus, in this case, 5 mM EuDOTAM-2M-2PB, for a period of 25 min before glucagon was administered to the liver from the well-fed animal. Five minutes later, the liver was removed from the perfusion apparatus and positioned in the holder for imaging. The livers were maintained at 37°C while positioned on the surface coil for a period of 43 min before a set of “on” and “off” images were collected (17 min). This was done to allow time for the liver to continue exporting glucose after removal from the perfusion apparatus and before data collection. Figure 6 shows images of the two livers without (Fig. 6a) and with (Fig. 6b) a presaturation pulse on the exchange resonance and the corresponding difference or CEST image. Again, the intensity ratio (Iglucagon / Icontrol) in selected ROI in the images collected without a presaturation pulse averaged 0.93 ± 0.05 and this ratio dropped to 0.84 ± 0.04 after application of the presaturation pulse. Although the CEST intensity difference is smaller in this case due to the lower concentration of EuDOTAM-2M-2PB and glucose, the CEST effect was still large enough to detect glucose being exported from the liver. The amount of glucose actually released into the extracellular space of this liver at the time the CEST image was collected is unknown but is likely well below 10 mM.
FIG. 6.
The 4.7T MR images of a glucagon-treated fed mouse liver (bottom) and a control 24-hr fasted mouse liver (top) perfused with a 5 mM EuDOTAM-2M-2PB at 37°C. The “on-resonance” image (ωon = 42 ppm with duration of 2 s and B1 power level of 1 kHz) showed CEST contrast between the glucagon-treated perfused mouse liver and the liver without glucagon. The CEST image shows the intensity differences between the “off” and “on” images. Other imaging parameters included a [FOV] = 40 × 40 cm, 128 × 128 matrix, single 2 mm slice, TR = 4s,TE = 13 ms.
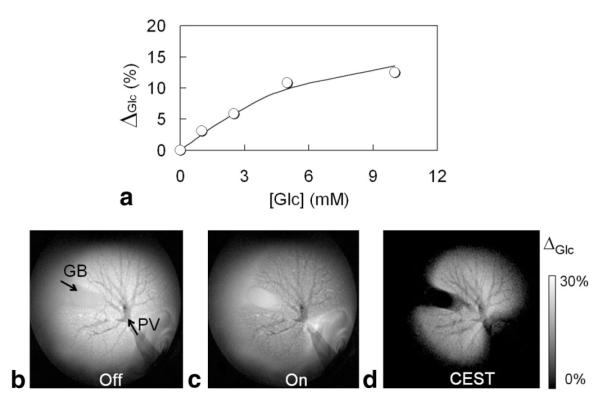
To evaluate the effects of flow on glucose imaging, individual livers were also perfused with 5 mM EuDOTAM-2M-2PB in the magnet. Initially, no glucose was present in solution so the resulting CEST image intensity (ΔGlc) was near zero. After addition of each incremental amount of glucose to the perfusate, the liver was perfused for 15 min to allow equilibration, followed by collection of a set of “on” and “off” images (17 min). As shown, ΔGlc increased in proportion to the amount of added glucose with a maximum CEST intensity of ∼12% at glucose-to-agent ratio of 2:1 (Fig. 7a). A least-squares fitting of these data to a 1:1 binding model gave an apparent limiting ΔGlc value of 15 ± 2% and a Ka of 656 ± 103 M-1, a value that is somewhat higher than the binding constant reported previously (339 ± 29 M-1) for an in vitro experiment at 25°C (9). The images in the bottom panel of Figure 7 were collected after the glucose concentration reached 10 mM; again, the data are presented as “off-resonance” (Fig. 7b) and “on-resonance” (Fig. 7c) images together with the corresponding CEST image (Fig. 7d). Here, the CEST image reveals features of liver vasculature not seen in the postperfused images of Figures 5 and 6. Now, the portal vein (PV), which was attached to a pump for administering perfusate, and the gallbladder (GB) are clearly delineated from the two hepatic lobes. The well-perfused lobes of liver appear uniformly hyper-intense in the CEST image, again indicating that the sensor and glucose are both uniformly distributed in all extracellular space. In comparison, the gallbladder was invisible in the CEST image because the sensor likely does not get distributed into the gallbladder during a short perfusion period such as this. The vascular beds in this case appear dark in all images because perfusate flow leads to loss of the magnetization during the image readout period, as commonly seen in the conventional black-blood images with relative long TEs. Overall, the data show that EuDOTAM-2M-2PB holds promise as a glucose sensor in tissues and that CEST imaging with this agent may allow differentiation of vascular versus extracellular glucose.
FIG. 7.
CEST images showing the distribution of glucose in a perfused mouse liver (37°C) using EuDOTAM-2M-2PB as the glucose sensor. The imaging parameters were identical to those given in Figure 6. The gallbladder (GB) and liver portal vein (PV) are marked by arrows. (Top panel) Glucose-induced CEST effect (ΔGlc) versus glucose concentration in the isolated, perfused liver. The data are averaged over three selected ROIs within the liver tissue. The solid curve represents a least-squares fitting of these data to a 1:1 binding model with an apparent limiting ΔGlc value of 15% and a binding constant (Ka) of 656 M-1.
DISCUSSION
Glucose, the most abundant sugar in the body and an essential source of energy in mammalian tissues, is also toxic when presented to cells in high concentrations for prolonged periods. Glucose in humans is largely derived from three major sources, dietary carbohydrate, break-down of stored glycogen (glycogenolysis, GLY) and gluconeogenesis (GNG) from lactate or amino acids. The predominant site of glucose production in the fasting human is liver and the energy necessary to drive glucose production from lactate or amino acids comes from excess NADH produced in the hepatic TCA cycle. The technologies currently available for sensing tissue glucose are largely based on implantable devices that detect glucose electrochemically (27), optically (29), enzymatically (29), or by using microdialysis (30). To our knowledge, this is the first report of a sensor method that allows imaging of glucose by MRI. Although FDG and PET imaging is commonly thought of as glucose imaging, the method presented here provides complimentary information to FDG. Like the PARACEST sensor, FDG distributes throughout all extracellular space but PET highlights only those tissue regions that accumulate excess FDG in cells in the form of phosphorylated FDG. Thus, the PET method detects relative glucose uptake by cells whereas the PARACEST method described here monitors only the extracellular distribution of glucose.
As demonstrated here, the utility of EuDOTAM-2M-2PB as a glucose sensor originates from its unique CEST properties at 37°C. The variable temperature CEST spectra (Fig. 3) show that the increase in intensity of the CEST exchange peak at 42 ppm can be attributed to slowing of exchange between a Eu3+-bound water molecule and bulk water molecules when glucose binds to the phenylboronate groups of the ligand. The mechanism responsible for slowing of water exchange in this system has not been fully delineated but likely has at least two contributions. Glucose clearly forms a “cap” directly over the Eu3+-bound water molecule and this may physically impair dissociation of water from its Eu3+ coordination position. This model is illustrated in Scheme 1. Second, bridging of glucose between the two phenylboronate side-chains certainly alters the molecular dynamics of the system and may slow interconversion of the two SAP enantiomers of the complex that are present in solution. The variable temperature NMR data reported here indicates that the water exchange parallels the rate of interconversion between the two enantiomers and that addition of glucose slows this process (Figs. 1, 2). Therefore, it is possible that binding of glucose to EuDOTAM-2M-2PB slows dissociation of the bound water molecule by slowing interconversion of coordination isomers (Scheme S1). A strong correlation between the intra-molecular isomer exchange and bound-water exchange process has been proposed for similar lanthanide complexes (26). Regardless of the exact mechanism, it is clear that both the blockage and interconversion mechanisms might be exploited to design even more efficient PARACEST imaging agents for glucose and perhaps other metabolites as well.
A 17% change CEST was observed between livers perfused with 0.03 mM (hypoglycemia) and 9.87 mM (hyperglycemia) glucose in the presence of 10 mM EuDOTAM-2M-2PB. Assuming an approximate linear response over this range, one would predict an 8.7% CEST effect at 5 mM (normal glucose = 70μ100 mg/dL) and a 13.9% CEST effect at 8 mM (diabetes = 140 mg/dL). Given the assumption that one should be able to detect a 2% change in CEST intensity, this translates to a change in glucose of ∼1mM using the agent presented here at 10 mM. However, if one can increase the affinity of the sensor for glucose by ∼10-fold, then one should be able to detect ∼1 mM changes in glucose using only 1 mM agent, a perfectly reasonable amount for in vivo use. One could take two approaches to increase the sensitivity of a PARACEST-based glucose sensor; first, one could increase the affinity of the sensor for binding to glucose as indicated above and second, one could redesign the system such that it has a more optimal water exchange rate for CEST than the current agent (so the CEST image intensities became larger per unit change in glucose concentration). The water exchange rate in EuDO-TAM-2M-2PB is clearly not optimal for achieving the most sensitive CEST imaging results. Bloch exchange theory predicts that the optimal water exchange rate for an applied power level of 1000 Hz would be 6283 s-1,aspredicted by the relationship, Cb = 2πB1 (24). This would require a sensor molecule with a Eu3+-bound water lifetime of 159 μs, approximately 2.7 times longer than the lifetime found in the present glucose sensor (τM = 43 μsat 37°C). This indicates that one could achieve a much larger CEST effect using EuDOTAM-2M-2PB with a higher applied B1 power but this was not done because of concerns of possible tissue heating. Alternatively and preferably, if one could create a glucose sensor with a longer Eu3+-bound water lifetime, perhaps by further hindering the known water exchange pathways, then the sensitivity for CEST imaging of glucose could be improved substantially. Our current estimate of this sensitivity limit indicates that, given the optimal sensor, one should be able to image the tissue distribution of glucose using this technology using sub-millimolar concentrations of sensor.
Another factor to consider is whether the sensor concentration will remain constant long enough in vivo to allow CEST imaging. At this point, little is known about the biodistribution of these agents in vivo or how quickly they are eliminated and by which route. If these agents have washout characteristics similar to typical Gd-based T1 imaging agents, then one should have sufficient time to perform CEST imaging in an adult subject after a single bolus injection of the glucose sensor, providing that the imaging data can be collected within a few minutes. A fast imaging sequence such as a single-shot gradient-echo with presaturation could used to improve temporal resolution and detection sensitivity with some loss in spatial resolution.
In summary, the feasibility CEST detection of glucose in isolated perfused livers was demonstrated by comparing CEST images of two isolated perfused livers under identical imaging conditions (Fig. 5). Using this procedure, we confirmed that the image contrast found in these livers was indeed due to the glucose content, because other endogenous exchanging protons in tissue and possible interactions between EuDOTAM-2M-2PB and sugars or other tissue glycoproteins were otherwise identical. Using a presaturation pulse at 42 ppm, the Eu3+-bound water pool dominates the contrast observed in the CEST images; the MT effect from endogenous macromolecules and CEST effect from glucose-OH residues is quite small in comparison. Small but significant intensity differences were also found between the CEST images obtained for a glucagon- treated liver compared with the control liver without glucagon treatment (Fig. 6). Although the amount of glucose exported from the glucagon-treated liver was not precisely known in the experiment described herein, the CEST image clearly arose from release of glucose from hepatic cells after degradation of tissue glycogen. Degradation of glycogen by addition of glucagon using conditions identical to those used here was recently confirmed in perfused mouse livers by 13C NMR (31). CEST imaging of livers while being perfused with variable amounts of glucose not only established the sensitivity of the CEST-based sensor for detection but it also delineated anatomical details of the perfused liver that were not visible in CEST images of livers post-perfusion. In the CEST images of perfused livers, the hepatic parenchyma was hyper-intense, clearly different from a similar contrast enhancement commonly seen on conventional T2w and proton-density weighted images caused by susceptibility and off-resonance saturation effect, while the tissues not perfused by the sensor and the hepatic vasculature were invisible. These observations suggest that in vivo CEST images may provide additional functional information in addition to the distribution of glucose. Such experiments were not performed using this glucose sensor because initial injections of the agent into mice revealed that this complex is somewhat toxic, likely due to the positive charge on the existing EuDOTAM-2M-2PB sensor. More recently, a modified sensor with additional negatively charged carboxyl groups on the nonfunctional amide side-chains was reported by our laboratory and preliminary studies using this modified agent indicates that it retains similar CEST sensitivity to glucose and shows no clinical signs of toxicity in mice (32). This modified sensor will be the subject of future in vivo CEST imaging experiments.
Supplementary Material
ACKNOWLEGMENTS
We thank Charles Storey and Angela Milde for their technical help with liver perfusions and the glucose assays. We also thank Drs. Donald Woessner, Matthew Merritt, and Angelo Lubag for helpful discussions.
Grant sponsor: National Institutes of Health; Grant number: RR-02584; Grant number: CA-115531; Grant number: CA-126608; Grant number: EB-04285; Grant number: DK-058398; Grant sponsor: the Robert A. Welch Foundation; Grant number: AT-584.
Footnotes
Additional supporting information may be found in the online version of this article.
REFERENCES
- 1.Chang Y-T, Cheng C-M, Su Y-Z, Lee W-T, Hsu J-S, Liu G-C, Cheng T-L, Wang Y-M. Synthesis and characterization of a new bioactivated paramagnetic gadolinium(III) complex [Gd(DOTA-FPG)(H2O)] for tracing gene expression. Bioconjug Chem. 2007;18:1716–1727. doi: 10.1021/bc070019s. [DOI] [PubMed] [Google Scholar]
- 2.Louie AY, Huber MM, Ahrens ET, Rothbacher U, Moats R, Jacobs RE, Fraser SE, Meade TJ. In vivo visualization of gene expression using magnetic resonance imaging. Nat Biotech. 2000;18:321–325. doi: 10.1038/73780. [DOI] [PubMed] [Google Scholar]
- 3.Genove G, DeMarco U, Xu H, Goins WF, Ahrens ET. A new transgene reporter for in vivo magnetic resonance imaging. Nat Med. 2005;11:450–454. doi: 10.1038/nm1208. [DOI] [PubMed] [Google Scholar]
- 4.Atanasijevic T, Shusteff M, Fam P, Jasanoff A. Calcium-sensitive MRI contrast agents based on superparamagnetic iron oxide nanoparticles and calmodulin. Proc Natl Acad Sci U S A. 2006;103:14707–14712. doi: 10.1073/pnas.0606749103. [DOI] [PMC free article] [PubMed] [Google Scholar]
- 5.Ward KM, Aletras AH, Balaban RS. A new class of contrast agents for MRI based on proton chemical exchange dependent saturation transfer (CEST) J Magn Reson. 2000;143:79–87. doi: 10.1006/jmre.1999.1956. [DOI] [PubMed] [Google Scholar]
- 6.McMahon MT, Gilad AA, Zhou J, Sun PZ, Bulte JWM, van Zijl PCM. Quantifying exchange rates in chemical exchange saturation transfer agents using the saturation time and saturation power dependencies of the magnetization transfer effect on the magnetic resonance imaging signal (QUEST and QUESP): pH calibration for poly-L-lysine and a starburst dendrimer. Magn Reson Med. 2006;55:836–847. doi: 10.1002/mrm.20818. [DOI] [PMC free article] [PubMed] [Google Scholar]
- 7.Aime S, Castelli DD, Terreno E. Novel pH-reporter MRI contrast agents. Angew Chem Int Ed Engl. 2002;41:4334–4336. doi: 10.1002/1521-3773(20021115)41:22<4334::AID-ANIE4334>3.0.CO;2-1. [DOI] [PubMed] [Google Scholar]
- 8.Zhang S, Winter P, Wu K, Sherry AD. A novel europium(III)-based MRI contrast agent. J Am Chem Soc. 2001;123:1517–1518. doi: 10.1021/ja005820q. [DOI] [PubMed] [Google Scholar]
- 9.Zhang S, Trokowski R, Sherry AD. A paramagnetic CEST agent for imaging glucose by MRI. J Am Chem Soc. 2003;125:15288–15289. doi: 10.1021/ja038345f. [DOI] [PubMed] [Google Scholar]
- 10.Trokowski R, Zhang S, Sherry AD. Cyclen-based phenylboronate ligands and their Eu(3+) complexes for sensing glucose by MRI. Bioconjug Chem. 2004;15:1431–1440. doi: 10.1021/bc0498976. [DOI] [PubMed] [Google Scholar]
- 11.Cameron JD, Cruickshank JK. Glucose, insulin, diabetes and mechanisms of arterial dysfunction. Clin Exp Pharmacol Physiol. 2007;34:677–682. doi: 10.1111/j.1440-1681.2007.04659.x. [DOI] [PubMed] [Google Scholar]
- 12.Cherk MH, Foo SS, Poon AM, Knight SR, Murone C, Papenfuss AT, Sachinidis JI, Saunder TH, O’Keefe GJ, Scott AM. Lack of correlation of hypoxic cell fraction and angiogenesis with glucose metabolic rate in non-small cell lung cancer assessed by 18F-Fluoromisonidazole and 18F-FDG PET. J Nucl Med. 2006;47:1921–1926. [PubMed] [Google Scholar]
- 13.Criego AB, Tkac I, Kumar A, Thomas W, Gruetter R, Seaquist ER. Brain glucose concentrations in healthy humans subjected to recurrent hypoglycemia. J Neurosci Res. 2005;82:525–530. doi: 10.1002/jnr.20654. [DOI] [PubMed] [Google Scholar]
- 14.Nabuurs C, Klomp D, Veltien A, Kan H, Heerschap A. Localized sensitivity enhanced in vivo 13C MRS to detect glucose metabolism in the mouse brain. Magn Reson Med. 2008;59:626–630. doi: 10.1002/mrm.21498. [DOI] [PubMed] [Google Scholar]
- 15.Der BS, Dattelbaum JD. Construction of a reagentless glucose biosensor using molecular exciton luminescence. Anal Biochem. 2008;375:132–140. doi: 10.1016/j.ab.2007.11.010. [DOI] [PubMed] [Google Scholar]
- 16.Takeuchi M, Mizuno T, Shinkai S, Shirakami S, Itoh T. Chirality sensing of saccharides using a boronic acid-appended chiral ferrocene derivative. Tetrahedron Asymmetry. 2000;11:3311–3322. [Google Scholar]
- 17.Wang J, Thomas DF, Chen A. Nonenzymatic electrochemical glucose sensor based on nanoporous PtPb networks. Anal Chem. 2008;80:997–1004. doi: 10.1021/ac701790z. [DOI] [PubMed] [Google Scholar]
- 18.Heyn C, Ronald JA, Mackenzie LT, MacDonald IC, Chambers AF, Rutt BK, Foster PJ. In vivo magnetic resonance imaging of single cells in mouse brain with optical validation. Magn Reson Med. 2006;55:23–29. doi: 10.1002/mrm.20747. [DOI] [PubMed] [Google Scholar]
- 19.Li AX, Wojciechowski F, Suchy M, Jones CK, Hudson RHE, Menon RS, Bartha R. A sensitive PARACEST contrast agent for temperature MRI: Eu3+-DOTAM-glycine (Gly)-phenylalanine (Phe) Magn Reson Med. 2008;59:374–381. doi: 10.1002/mrm.21482. [DOI] [PubMed] [Google Scholar]
- 20.Zhang S, Merritt M, Woessner DE, Lenkinski RE, Sherry AD. PARACEST agents: modulating MRI contrast via water proton exchange. Acc Chem Res. 2003;36:783–790. doi: 10.1021/ar020228m. [DOI] [PubMed] [Google Scholar]
- 21.Aime S, Barge A, Botta M, De Sousa A, Parker D. Direct NMR spectroscopic observation of a lanthanide-coordinated water molecule whose exchange rate is dependent on the conformation of the complexes. Angew Chem Int Ed Engl. 1998;37:2673–2675. doi: 10.1002/(SICI)1521-3773(19981016)37:19<2673::AID-ANIE2673>3.0.CO;2-#. [DOI] [PubMed] [Google Scholar]
- 22.Dunand FA, Dickins RS, Parker D, Merbach AE. Towards rational design of fast water-exchanging Gd(dota-like) contrast agents? Importance of the M/m ratio. Chemistry. 2001;7:5160–5167. doi: 10.1002/1521-3765(20011203)7:23<5160::aid-chem5160>3.0.co;2-2. [DOI] [PubMed] [Google Scholar]
- 23.Zhang S, Kovacs Z, Burgess SC, et al. [DOTA-bis(amide)]lanthanide complexes: NMR evidence for differences in water-molecule exchange rates for coordination isomers. Chem Eur J. 2001;7:288–296. doi: 10.1002/1521-3765(20010105)7:1<288::aid-chem288>3.0.co;2-6. [DOI] [PubMed] [Google Scholar]
- 24.Woessner DE, Zhang S, Merritt ME, Sherry AD. Numerical solution of the Bloch equations provides insights into the optimum design of PARACEST agents for MRI. Magn Reson Med. 2005;53:790–799. doi: 10.1002/mrm.20408. [DOI] [PubMed] [Google Scholar]
- 25.Estall JL, Drucker DJ. Glucagon and glucagon-like peptide receptors as drug targets. Curr Pharm Des. 2006;12:1731–1750. doi: 10.2174/138161206776873671. [DOI] [PubMed] [Google Scholar]
- 26.Dunand FA, Aime S, Merbach AE. First 17O NMR observation of coordinated water on both isomers of [Eu(DOTAM)(H2O)]3+: a direct access to water exchange and its role in the isomerization. J Am Chem Soc. 2000;122:1506–1512. [Google Scholar]
- 27.Kvist PH, Iburg T, Aalbaek B, Gerstenberg M, Schoier C, Kaastrup P, Buch-Rasmussen T, Hasselager E, Jensen HE. Biocompatibility of an enzyme-based, electrochemical glucose sensor for short-term implantation in the subcutis. Diabetes Technol Ther. 2006;8:546–559. doi: 10.1089/dia.2006.8.546. [DOI] [PubMed] [Google Scholar]
- 28.Ballerstadt R, Kholodnykh A, Evans C, Boretsky A, Motamedi M, Gowda A, McNichols R. Affinity-based turbidity sensor for glucose monitoring by optical coherence tomography: toward the development of an implantable sensor. Anal Chem. 2007;79:6965–6974. doi: 10.1021/ac0707434. [DOI] [PubMed] [Google Scholar]
- 29.Henninger N, Woderer S, Kloetzer H-M, Staib A, Gillen R, Li L, Yu X, Gretz N, Kraenzlin B, Pill J. Tissue response to subcutaneous implantation of glucose-oxidase-based glucose sensors in rats. Biosens Bioelectron. 2007;23:26–34. doi: 10.1016/j.bios.2007.03.016. [DOI] [PubMed] [Google Scholar]
- 30.Ekberg NR, Wisniewski N, Brismar K, Ungerstedt U. Measurement of glucose and metabolites in subcutaneous adipose tissue during hyperglycemia with microdialysis at various perfusion flow rates. Clin Chim Acta. 2005;359:53–64. doi: 10.1016/j.cccn.2005.03.033. [DOI] [PubMed] [Google Scholar]
- 31.van Zijl PC, Jones CK, Ren J, Malloy CR, Sherry AD. MRI detection of glycogen in vivo by using chemical exchange saturation transfer imaging (glycoCEST) Proc Natl Acad Sci U S A. 2007;104:4359–4364. doi: 10.1073/pnas.0700281104. [DOI] [PMC free article] [PubMed] [Google Scholar]
- 32.Ren J, Suh EH, Kovacs Z, Sherry AD. A new MRI PARACEST agent for sensing glucose. Proceedings of the 15th Annual Meeting of ISMRM; Berlin, Germany. 2007.p. 254. [Google Scholar]
Associated Data
This section collects any data citations, data availability statements, or supplementary materials included in this article.


