Abstract
Purpose: To evaluate inter- and intrareader agreement in breast percent density (PD) estimation on clinical digital mammograms and central digital breast tomosynthesis (DBT) projection images.
Materials and Methods: This HIPAA-compliant study had institutional review board approval; all patients provided informed consent. Breast PD estimation was performed on the basis of anonymized digital mammograms and central DBT projections in 39 women (mean age, 51 years; range, 31–80 years). All women had recently detected abnormalities or biopsy-proved cancers. PD was estimated by three experienced readers on the mediolateral oblique views of the contralateral breasts by using software; each reader repeated the estimation after 2 months. Spearman correlations of inter- and intrareader and intermodality PD estimates, as well as κ statistics between categoric PD estimates, were computed.
Results: High correlation (ρ = 0.91) was observed between PD estimates on digital mammograms and those on central DBT projections, averaged over all estimations; the corresponding κ coefficient (0.79) indicated substantial agreement. Mean interreader agreement for PD estimation on central DBT projections (ρ = 0.85 ± 0.05 [standard deviation]) was significantly higher (P < .01) than that for PD estimation on digital mammograms (ρ = 0.75 ± 0.05); the corresponding κ coefficients indicated substantial (κ = 0.65 ± 0.12) and moderate (κ = 0.55 ± 0.14) agreement for central DBT projections and digital mammograms, respectively.
Conclusion: High correlation between PD estimates on digital mammograms and those on central DBT projections suggests the latter could be used until a method for PD estimation based on three-dimensional reconstructed images is introduced. Moreover, clinical PD estimation is possible with reduced radiation dose, as each DBT projection was acquired by using about 22% of the dose for a single mammographic projection.
© RSNA, 2009
Identification of women with an increased risk of breast cancer is of high importance, because they may benefit from modified screening and diagnosis protocols (1). Current clinical standards for breast cancer risk estimation, the Gail (2) and Claus (3) statistical models, are used to predict the absolute risk of breast cancer over a defined age interval on the basis of standard risk factors (4), including age, age at menarche, age at first full-term pregnancy, number of previous biopsies with a benign result, and number of first-degree relatives with breast cancer. These models perform well on a population level but are limited in the prediction of individual cancer incidence (5) because the standard risk factors are practically nonmodifiable and cannot reflect changes in risk over time.
Breast density is considered to be an independent risk factor for cancer (6). It is also indicative of changes in modifiable risk factors (7–11). In mammography, breast density is quantified as percent density (PD), the percentage of the mammogram area occupied by nonfatty, dense tissue:
 |
(1) |
where AD and AB represent the area of dense tissue and the total breast area in a mammogram, respectively. PD has been used in a number of studies of breast cancer risk (12–22). Extension of the Gail risk model to include PD has been proposed (4).
PD can be also quantified by using either a continuous or a categoric scale. The most frequently used categoric approach is the Boyd six-class categorization system (23), defined as follows: category 1 indicates a PD of 0%; category 2, a PD greater than 0% but less than or equal to 10%; category 3, a PD greater than 10% but less than or equal to 25%; category 4, a PD greater than 25% but less than or equal to 50%; category 5, a PD greater than 50% but less than or equal to 75%; and category 6, a PD greater than 75%. The Boyd categorization system reflects the relationship between breast density and cancer risk; as evident in the literature (24), women in the highest PD category have a risk that is four to six times greater than that of women in the lowest PD category.
Mammographic PD estimation has certain limitations because of the projective nature of mammography. Estimation of volumetric breast density from mammograms has been proposed in the literature (25,26). Digital breast tomosynthesis (DBT) is a three-dimensional x-ray breast imaging modality with potential to replace mammography for early cancer screening (27). In DBT, high-spatial-resolution tomographic images of the breast are reconstructed from multiple low-dose projection images acquired within a limited range of x-ray tube angles. The total mean glandular dose for a DBT examination is comparable to the dose for a two-view mammographic examination. Results of early clinical trials with DBT (28,29) suggest that this technique is associated with improved sensitivity and specificity relative to projection mammography.
Currently, to our knowledge, no method exists for PD estimation on three-dimensional reconstructed DBT images. Until the emergence of such a method, PD can be estimated from DBT projection images on the basis of the same definition given in Equation (1). We have focused our analysis on the central DBT projection, acquired with the x-ray tube positioned orthogonal to the detector plane. The purpose of our study was to evaluate inter- and intrareader agreement in PD estimation on clinical digital mammograms and central DBT projection images.
MATERIALS AND METHODS
Study Population
Digital mammograms and DBT images acquired at our institution were analyzed as a part of an institutional review board–approved, Health Insurance Portability and Accountability Act–compliant National Institutes of Health–supported clinical study of multimodality breast imaging. As a part of this clinical study, 51 women (mean age, 52 years; range, 31–80 years) underwent a bilateral DBT examination during the period between August 2004 and April 2005; all women provided informed consent and had recently detected abnormalities or biopsy-proved cancer. The lifetime risks of breast cancer computed by using the Gail and Claus models and averaged over all 51 women were 10.5% and 6.0%, respectively. From among these 51 women, we selected 39 women for inclusion in this study (mean age, 51 years; range, 31–80 years). Images in 12 women were excluded because of the existence or suspicion of bilateral cancer (n = 3), the incomplete visualization of very large breasts (n = 3), or the unavailability of images of the breast contralateral to the breast with the existing abnormality (n = 6). The lifetime risk of breast cancer for the selected 39 women was, on average, 10.4% and 5.5%, as computed by using the Gail and Claus models, respectively.
Acquisition and Processing of Clinical Digital Mammograms and DBT Images
Digital mammographic and DBT examinations were performed on the same day by using a commercial full-field digital mammography system (Senographe 2000D; GE Healthcare, Chalfont St Giles, England). For digital mammography, the breast was positioned for mediolateral oblique and craniocaudal views and was compressed by using the standard mammographic compression force (mean, 11 daN; range, 3–20 daN). Each mammographic projection was acquired with a spatial resolution of 100 μm/pixel by using a detector with a 23 × 19-cm2 field of view, corresponding to a 2304 × 1920-pixel image size. After acquisition, digital mammograms were available in an unprocessed, raw format, with pixel values linearly proportional to the x-ray exposure at the detector, as well as in a processed format obtained by using an embedded adaptive histogram equalization method (Premium View; GE Healthcare).
The DBT examination was performed immediately after the digital mammographic examination by the same technician and by using the same full-field digital mammography system, which had been modified (with institutional review board approval) to allow DBT. The breast was positioned for a mediolateral oblique view and was immobilized with light compression (mean, 6 daN; range, 3–11 daN). The breast support for DBT was used without a grid to avoid a grid cutoff when positioning the x-ray tube under an angle other than normal to the detector. Each DBT data set consisted of nine projection images, acquired in 6.25° increments over a 50° arc, with the same spatial resolution and image size as for digital mammographic acquisition. The mean glandular dose for a DBT image set was equal to the dose used for a standard two-view mammographic examination (30); thus, a central DBT projection was acquired by using approximately 22% (ie, two-ninths) of the dose used for a single digital mammographic projection. We calculated PD on central DBT projection images processed with Premium View.
Estimation of PD on Digital Mammograms and Central DBT Projection Images
PD was analyzed by using anonymized mediolateral oblique digital mammographic views and central DBT projections. The breasts contralateral to breasts with existing abnormalities were analyzed to avoid potential overestimation of PD because of increased pixel intensities within the lesion area. Contralateral breasts did not contain suspicious lesions, as we excluded all women with existing or suspected bilateral cancer. PD was estimated by using software (Cumulus, version 4.0; University of Toronto, Toronto, Ontario, Canada) (23) that identifies the dense tissue regions on the basis of interactive gray-level thresholding of image pixel values in the following steps: (a) The original image is windowed and leveled interactively, to provide optimal visualization of the dense tissue; (b) a piecewise linear border of the pectoral muscle region is segmented manually; (c) a threshold value corresponding to the breast outline is selected interactively; (d) if needed, the breast outline borders are edited manually; (e) a second threshold value corresponding to the dense tissue region border is selected interactively; and (f) PD is estimated by using Equation (1). Figure 1 shows an example of original digital mammograms and central DBT projection images, as well as the corresponding segmented pectoral muscle regions, breast outline, and dense tissue regions used for calculating PD. Use of the Cumulus software has been validated in a number of studies of breast density (7,31–33).
Figure 1a:
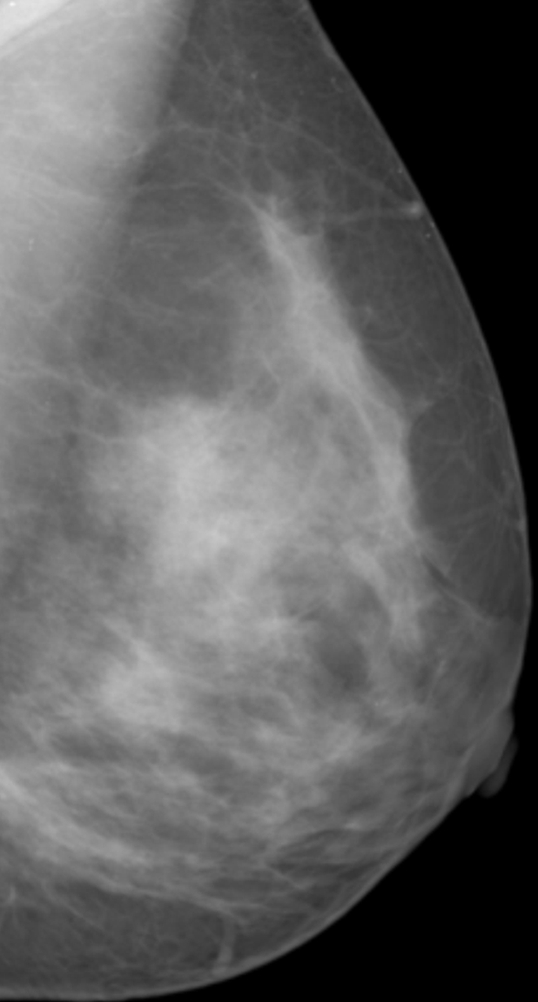
Estimation of PD on (a, b) digital mammograms and (c, d) central DBT projections in the same breast by using the Cumulus software. The original mediolateral oblique views (a, c) are windowed and leveled to enable optimal visualization of the dense tissue. The pectoral muscle is segmented manually, followed by interactive selection of the threshold values for segmentation of the background nonbreast area (dark gray) and the dense tissue (light gray). PD is computed as the ratio of the dense tissue area and the total breast area in b and d.
Figure 1b:
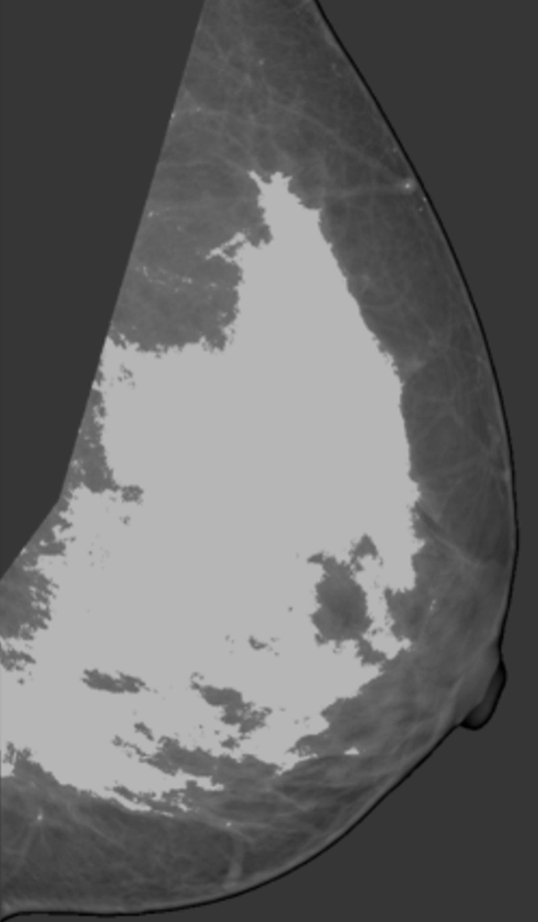
Estimation of PD on (a, b) digital mammograms and (c, d) central DBT projections in the same breast by using the Cumulus software. The original mediolateral oblique views (a, c) are windowed and leveled to enable optimal visualization of the dense tissue. The pectoral muscle is segmented manually, followed by interactive selection of the threshold values for segmentation of the background nonbreast area (dark gray) and the dense tissue (light gray). PD is computed as the ratio of the dense tissue area and the total breast area in b and d.
Figure 1c:
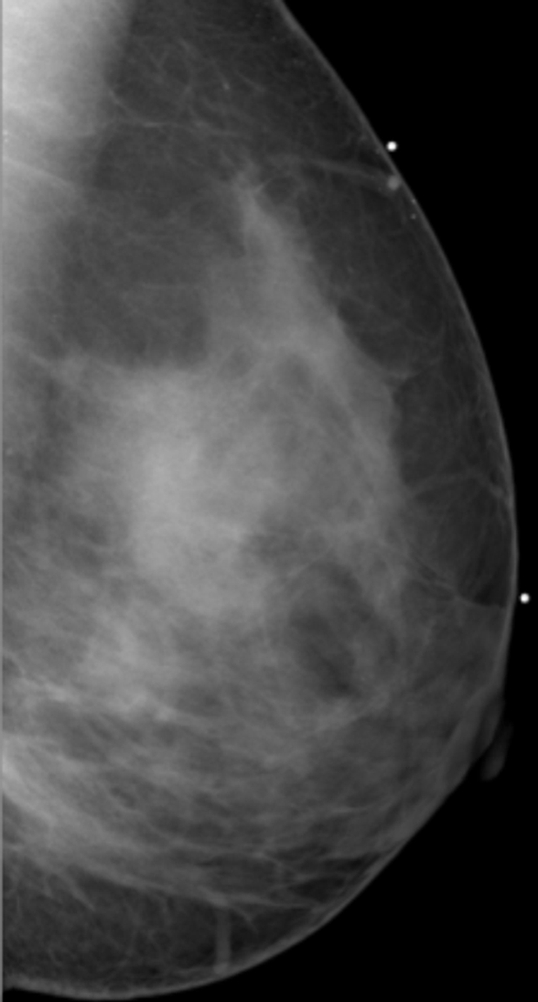
Estimation of PD on (a, b) digital mammograms and (c, d) central DBT projections in the same breast by using the Cumulus software. The original mediolateral oblique views (a, c) are windowed and leveled to enable optimal visualization of the dense tissue. The pectoral muscle is segmented manually, followed by interactive selection of the threshold values for segmentation of the background nonbreast area (dark gray) and the dense tissue (light gray). PD is computed as the ratio of the dense tissue area and the total breast area in b and d.
Figure 1d:
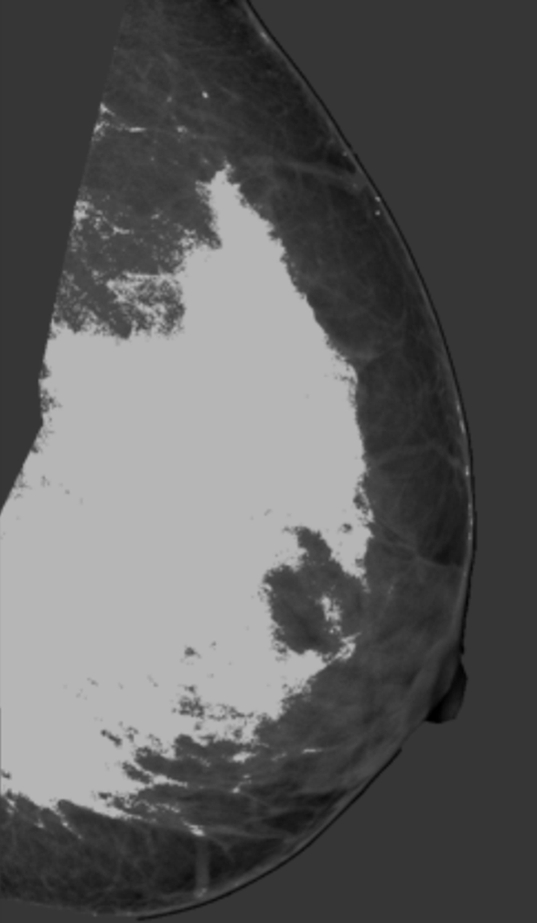
Estimation of PD on (a, b) digital mammograms and (c, d) central DBT projections in the same breast by using the Cumulus software. The original mediolateral oblique views (a, c) are windowed and leveled to enable optimal visualization of the dense tissue. The pectoral muscle is segmented manually, followed by interactive selection of the threshold values for segmentation of the background nonbreast area (dark gray) and the dense tissue (light gray). PD is computed as the ratio of the dense tissue area and the total breast area in b and d.
Images were displayed on liquid crystal display monitors (PL2011 M; Planar Systems, Beaverton, Ore). Three medical physicists from our laboratory (C.Z. [reader 1], P.R.B. [reader 2], and A.K.C. [reader 3], with 2–10 years of experience in breast image analysis) were the image readers. The readers attended a training session consisting of an initial estimation of PD on 10 clinical images and a consensus review. The training was performed 1 month before the beginning of the study. During the study, each reader estimated PD from a deidentified, randomly interleaved list of all digital mammograms and central DBT projections. So that we could assess intrareader agreement, each reader repeated PD estimation after 2 months. In addition to their PD estimates, for each reader, we also recorded their segmented tissue regions to be used in the analysis of spatial correlation; repeated segmentation results were recorded for one reader only (reader 2).
Statistical Analysis
Agreement in PD estimated by using a continuous scale was analyzed by computing the nonparametric Spearman correlation coefficient ρ, defined as
 |
(2) |
where di is the difference between the ranks from the ith pair of corresponding values PD1 and PD2 (and PD1 and PD2 are PDs estimated by two readers [interreader correlation], at repeated estimation by the same reader [intrareader correlation], or at evaluation of digital mammograms and central DBT projections [intermodality correlation]) and n is the number of pairs of PD1 and PD2 values.
We computed ρ values and their 95% confidence intervals by using software (GraphPad Prism 5 for Windows, version 5.01; GraphPad Software, La Jolla, Calif). To evaluate the effects of repeated PD estimation from the same sample, we computed the generalized estimating equation (GEE), an extension of a linear regression analysis that takes into account the correlation between repeated measurements (34). We computed the GEE by using software (GEEQBOX, version 1.0; University of Pennsylvania, Philadelphia, Pa) (35) and assuming an equicorrelated structure among repeated measurements.
Agreement in PD estimated on a categoric scale was analyzed by using inter- or intrareader κ statistics computed from the Boyd six-class categoric scores (23). κ Describes the agreement between categoric results of paired diagnostic ratings, taking into account only agreement beyond that expected by chance (36,37), as follows:
 |
(3) |
where P0 and PC represent the proportion of observed agreement and the proportion of agreement expected by chance, respectively. When rating results are presented by using a multicategory ordinal scale, the proportions of agreements used to compute κ are weighted to reflect the variation in the degree of disagreement between larger and smaller rating differences; in this study, we used quadratic weights (36). We used the standards for κ statistic strengths proposed by Landis and Koch (38) (κ ≤ 0 indicates poor agreement; 0.01 ≤ κ ≤ 0.20, slight agreement; 0.21 ≤ κ ≤ 0.40, fair agreement; 0.41 ≤ κ ≤ 0.60, moderate agreement; 0.61 ≤ κ ≤ 0.80, substantial agreement; and 0.81 ≤ κ ≤ 1.00, almost perfect agreement).
Spatial correlation between different segmentations of dense tissue regions was analyzed by computing the Jaccard similarity index J (39), defined as the ratio of the intersection to the union of two segmented dense tissue regions, D1 and D2, as follows:
 |
(4) |
When comparing the values of PD, ρ, κ, and J, we considered a P value of .01 to indicate statistical significance, as tested with the Wilcoxon rank test for zero median (40).
RESULTS
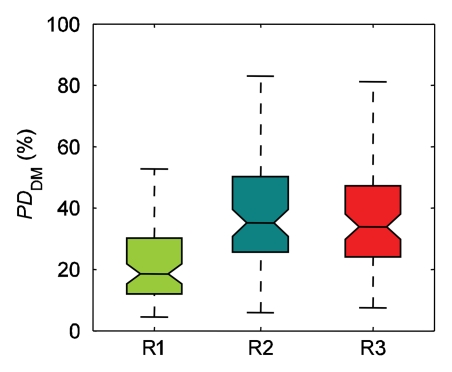
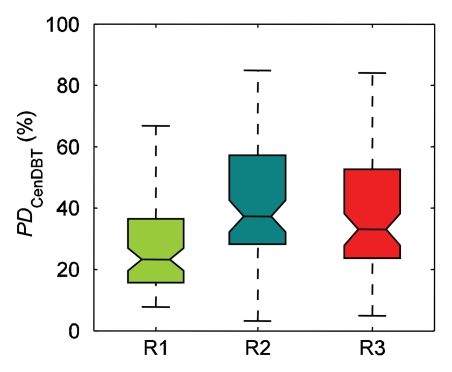
The ranges of PD estimated by individual readers varied (Fig 2). For reader 1, mean PD was 23% ± 13 (standard deviation) on digital mammograms and 27% ± 16 on central DBT projections; for reader 2, PD was 35% ± 19 on digital mammograms and 37% ± 21 on central DBT projections; and for reader 3, PD was 41% ± 20 on digital mammograms and 42% ± 20 on central DBT projections. The difference between mean values of all PD estimates by individual readers was significant (P < .01) for PD on digital mammograms (except between readers 2 and 3 [P > .8]) and for PD on central DBT projections (except between readers 1 and 3 [P > .04] and between readers 2 and 3 [P > .2]). When computed over all readers, PD on digital mammograms was 33% ± 19 and PD on central DBT projections was 36% ± 20; this difference was statistically significant (P < .01). Computed over individual readers, the difference between PD on central DBT projections and that on digital mammograms was significant for reader 1 (P < .01) but not for reader 2 or 3 (P > .04 for both).
Figure 2a:
Ranges of PD on (a) digital mammograms (PDDM) and (b) central DBT projections (PDCenDBT) as estimated by three readers (R1, R2, and R3) on clinical images in 39 breasts. Lower line = 25th percentile, central line = 50th percentile (median), upper line = 75th percentile, whiskers = full extent of analyzed data, notches = 95% confidence intervals around sample median.
Figure 2b:
Ranges of PD on (a) digital mammograms (PDDM) and (b) central DBT projections (PDCenDBT) as estimated by three readers (R1, R2, and R3) on clinical images in 39 breasts. Lower line = 25th percentile, central line = 50th percentile (median), upper line = 75th percentile, whiskers = full extent of analyzed data, notches = 95% confidence intervals around sample median.
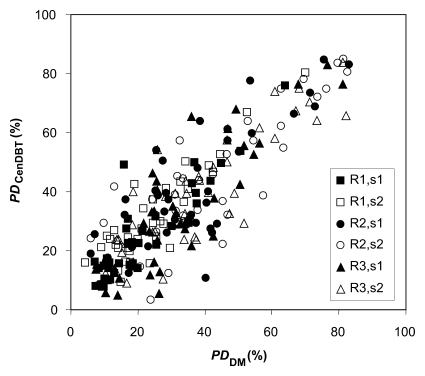
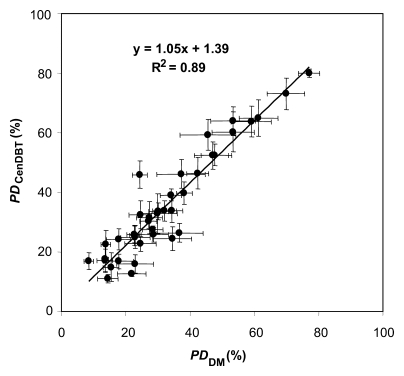
Figure 3a shows a scatterplot of PD on digital mammograms and PD on central DBT projections, as estimated separately by the three readers in two sessions (session 1 and session 2) repeated 2 months apart. Figure 3b shows the scatterplot and corresponding linear regression of the average values for PD on digital mammograms and PD on central DBT projections, computed over all the estimations for each analyzed breast. The Spearman correlation coefficient between these average PD values estimated with the two modalities was 0.91 (95% confidence interval: 0.83, 0.95).
Figure 3a:
(a) Scatterplot of PD on digital mammograms (PDDM) and central DBT projections (PDCenDBT), as estimated by three readers (R1, R2, and R3) in two sessions (session 1 [s1] and session 2 [s2]) repeated 2 months apart. (b) Scatterplot of average PD on digital mammograms (PDDM) and central DBT projections (PDCenDBT), computed over all estimations for each analyzed breast. Error bars = ±1 standard error of mean.
Figure 3b:
(a) Scatterplot of PD on digital mammograms (PDDM) and central DBT projections (PDCenDBT), as estimated by three readers (R1, R2, and R3) in two sessions (session 1 [s1] and session 2 [s2]) repeated 2 months apart. (b) Scatterplot of average PD on digital mammograms (PDDM) and central DBT projections (PDCenDBT), computed over all estimations for each analyzed breast. Error bars = ±1 standard error of mean.
The slope, intercept, and goodness-of-fit (R2) values of linear regressions computed separately for each reader and each session (as means and standard deviations) were 0.94 ± 0.10, 5.51% ± 3.74, and 0.74 ± 0.06, respectively (Table 1). The Spearman correlation coefficient between PD on digital mammograms and PD on central DBT projections, computed over all the readers, was 0.78 ± 0.05.
Table 1.
Parameters of Linear Regression for Estimation of PD on Central DBT Projections versus Estimation of PD on Digital Mammograms for Three Readers in Two Repeated Sessions
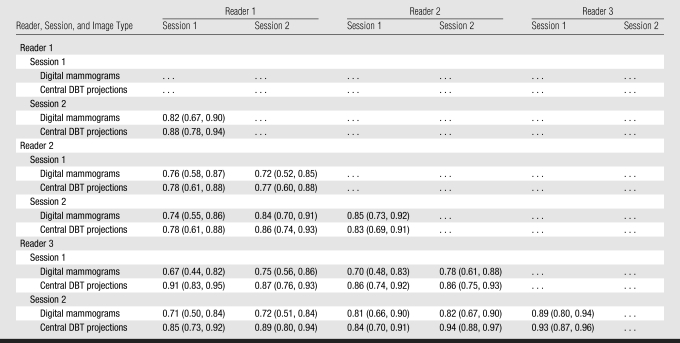
Although statistically different, the PD values of different readers were correlated (Table 2). Interreader correlation (ρ) was 0.75 ± 0.05 for PD on digital mammograms and 0.85 ± 0.05 for PD on central DBT projections (P < .01). Intrareader correlations were slightly higher—0.86 ± 0.04 for PD on digital mammograms and 0.88 ± 0.05 for PD on central DBT projections—but this difference was not significant (P = .5). The GEE analysis (Table 3) indicated that the repeated sessions and different readers yielded significantly different (P < .01) PD estimates; the difference between PD estimates on digital mammograms and those on central DBT projections, however, was not significant (P > .4).
Table 2.
Spearman Correlation Coefficients for Inter- and Intrareader Agreement between Continuous PD Estimates
Note.—Data in parentheses are 95% confidence intervals.
Table 3.
Results of GEE Analysis
Data in parentheses are 95% confidence intervals.
Session 1 was given a value of 0; session 2 was given a value of 1.
Here, readers 1 and 3 were given a value of 0; reader 2 was given a value of 1.
Here, readers 1 and 2 were given a value of 0; reader 3 was given a value of 1.
Digital mammograms were given a value of 0; central DBT projections were given a value of 1.
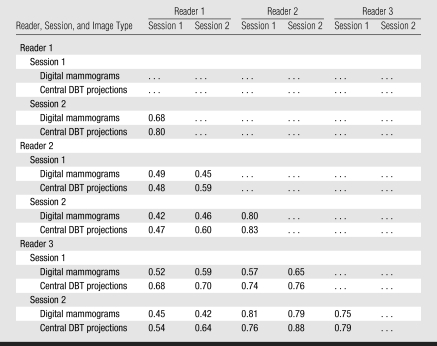
The interreader κ coefficients for PD on digital mammograms (0.55 ± 0.14) and central DBT projections (0.65 ± 0.12), indicated moderate and substantial agreement, respectively (Table 4). The difference between the interreader κ coefficients for PD on digital mammograms and PD on central DBT projections was statistically significant (P < .01). The intrareader κ coefficients for PD on digital mammograms (0.74 ± 0.06) and for PD on central DBT projections (0.81 ± 0.02) indicated substantial agreement; their difference was not statistically significant (P > .25).
Table 4.
Quadratic-weighted κ Coefficients for Inter- and Intrareader Agreement between Categoric PD Estimates
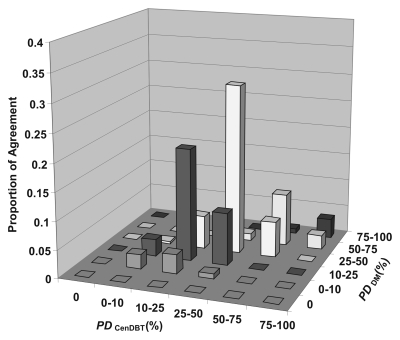
The quadratic-weighted κ coefficient between all categoric estimates of PD on digital mammograms and PD on central DBT projections for all readers was 0.79, indicating substantial agreement between the two modalities. Figure 4 shows proportions of agreement between categoric estimates of PD on digital mammograms and on central DBT projections averaged over the three readers.
Figure 4:
Graph shows observed agreement between categoric estimates of PD on digital mammograms (PDDM) and PD on central DBT projections (PDCenDBT) calculated by using the six Boyd classes of PD and averaged over the three readers. The observed high proportions of agreement near the diagonal correspond to a quadratic-weighted κ coefficient of 0.79, which indicates substantial agreement between PD on digital mammograms and PD on central DBT projections.
The Jaccard index (Fig 5) corresponding to the interreader spatial correlation of dense tissue regions segmented on digital mammograms was 0.65 ± 0.18, significantly different from that for the interreader spatial correlation of dense tissue regions segmented on central DBT projections, which was 0.70 ± 0.16 (P < .01). The Jaccard index corresponding to intrareader spatial correlation (computed for reader 2 only) was 0.78 ± 0.15 for digital mammograms and 0.75 ± 0.18 for central DBT projections; this difference was not statistically significant (P > .1).
Figure 5:
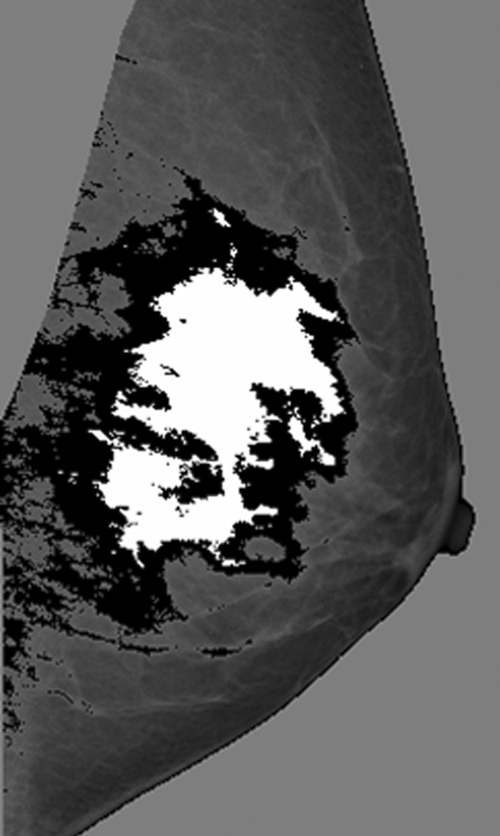
Example mediolateral oblique mammogram with dense tissue regions segmented by different readers (white area = reader 1 segmentation; black and white areas = reader 2 segmentation). The spatial correlation between these segmented regions corresponds to a Jaccard similarity index of 34%.
DISCUSSION
We observed a statistically significant difference between PDs estimated by different readers in our study. When averaged over the estimations performed by all the readers, PD on central DBT projections was significantly greater than PD on digital mammograms (36% vs 33%). These estimates were, however, highly correlated (ρ = 0.91). A larger clinical study is needed to fully evaluate the effect of image acquisition parameters on PD estimation and to compare the relationship between PD on central DBT projections and breast cancer risk. Our results suggest that the differences in acquisition do not considerably affect PD estimation. For only one reader (reader 1) was there a significant difference between PD on digital mammograms and PD on central DBT projections estimated in the same session.
The observed difference between PD on digital mammograms and PD on central DBT projections could be attributed to the different positioning, compression, and dose to the detector used in the analyzed images from the two modalities. The compression force used for a DBT projection was, on average, about half the force used for digital mammography; it corresponded to, on average, 16% larger breast thickness at DBT relative to that at digital mammography. The mean glandular dose for acquiring the central DBT projection was approximately 22% of the mean glandular dose for a mediolateral oblique digital mammogram. Assuming a Bucky factor of 2.5, the dose to the detector for a DBT projection was 56% of the dose to the detector at digital mammography, because in our clinical setup, DBT involves use of a breast support table without an antiscatter grid. In addition, we calculated PD in this study from central DBT projections processed by using the Premium View method. The efficiency of using Premium View processing with reduced radiation dose has not been validated previously, to our knowledge.
For both continuous and categoric PD estimation on central DBT projections, we observed high interreader (ρ = 0.85 ± 0.05, κ = 0.65 ± 0.12) and intrareader (ρ = 0.88 ± 0.05, κ = 0.81 ± 0.02) agreement. The observed high correlation between PD estimates by different readers can be attributed to the fact that the readers were assessing the same property of the breast. This assumption is supported by the results of a previous analysis of variations in PD estimates from different DBT source projections (30); in that study, standard deviations in PD over all projections were equal to 1%–7%. In our study, significantly higher interreader agreement was observed for PD estimation on the central DBT projections (ρ = 0.85 ± 0.05) than for PD estimation on the digital mammograms (ρ = 0.75 ± 0.05).
Our results are comparable to those of previously published studies. Gao et al (41) analyzed clinical mammograms in 101 women followed up for 7 years. Two readers estimated quantitative PD values, six-class Boyd categories, and Wolfe patterns; one reader repeated the study after a year. They observed inter- and intrareader κ coefficients of 0.84 and 0.86, respectively. The corresponding inter- and intrareader Pearson correlation coefficients were 0.94 and 0.96, respectively. The inter- and intrareader Pearson correlation coefficients observed in our study (corresponding to the Spearman correlation coefficients reported in the Results section) were 0.82 and 0.90, respectively, for PD on digital mammograms and 0.89 and 0.92, respectively, for PD on central DBT projections. Gram et al (32) reported results in 987 women, analyzed by two readers. They observed an interreader correlation coefficient of 0.86 and a κ value of 0.71. Those studies analyzed breast density at conventional mammographic examinations.
Our analysis showed that, although they were acquired with about a 78% lower mean glandular dose, the central DBT projections could be used for estimation of breast PD. This observation indicates that breast cancer risk may be evaluated by using x-ray imaging without substantial additional irradiation, which is of crucial importance for women in the sensitive high-cancer-risk population. Breast density estimation on images obtained with reduced radiation dose has been previously reported in the literature (42,43).
To our knowledge, our study represents the first comparison of PD estimates on mammograms and those on central DBT projection images and thus offered a unique opportunity to validate the effects of differences in acquisition on PD estimation. Currently, no standard method exists for PD estimation on three-dimensional reconstructed images; until the emergence of such a method, PD could be estimated on central DBT projections if DBT were to replace digital mammography in clinical practice. Preliminary results of PD estimation on reconstructed DBT images were similar to results of PD estimation on DBT projections (44). Assuming this observation is confirmed in larger clinical studies, PD estimation on DBT projections would be advantageous as it is not dependent on DBT reconstruction algorithms (45).
ADVANCES IN KNOWLEDGE
We observed high correlation (Spearman correlation coefficient, 0.91) between continuous breast percent density (PD) estimates on digital mammograms and those on central digital breast tomosynthesis (DBT) projections in the same breast for 39 women, averaged over the repeated estimations of three readers; the corresponding κ coefficient (0.79) indicated substantial agreement between categoric PD estimates computed by using the Boyd six-category classification.
The observed high correlation and substantial agreement between the continuous and categoric PD estimates on digital mammograms and central DBT projections suggest that the differences in acquisition parameters do not considerably affect PD estimation.
Significantly higher (P < .01) interreader agreement (ρ = 0.85 ± 0.05) was observed for continuous PD estimation on central DBT projections compared with estimation on digital mammograms (ρ = 0.75 ± 0.05); the corresponding interreader κ coefficients indicated substantial (0.65 ± 0.12) and moderate (0.55 ± 0.14) agreement for categoric PD estimates on central DBT projections and digital mammograms, respectively.
Our study indicates that PD and, consequently, breast cancer risk may be evaluated by using x-ray imaging with reduced radiation dose, as each DBT projection was acquired by using about 22% of the dose for a single mammographic projection.
IMPLICATION FOR PATIENT CARE
Currently, no standard method exists for PD estimation on three-dimensional reconstructed DBT images; until the emergence of such a method, PD can be estimated on central DBT projections.
Acknowledgments
The authors are grateful to Martin J. Yaffe, PhD, for providing them with the Cumulus software package and for providing training and assistance with the software and to Beverly Collins, PhD, for editorial review.
Abbreviations
DBT = digital breast tomosynthesis
GEE = generalized estimating equation
PD = percent density
Author contributions: Guarantors of integrity of entire study, P.R.B., A.K.C., A.D.A.M.; study concepts/study design or data acquisition or data analysis/interpretation, all authors; manuscript drafting or manuscript revision for important intellectual content, all authors; manuscript final version approval, all authors; literature research, P.R.B., D.K., C.Z., A.D.A.M.; clinical studies, A.K.C., A.D.A.M.; experimental studies, P.R.B., A.K.C., C.Z., A.D.A.M.; statistical analysis, P.R.B., D.K., A.B.T., A.D.A.M.; and manuscript editing, P.R.B., A.K.C., D.K., A.D.A.M.
Funding: This research was supported by a National Institutes of Health/National Cancer Institute Program Project grant (no. P01 CA85484).
References
- 1.Lehman CD, Blume JD, Weatherall P, et al. Screening women at high risk for breast cancer with mammography and magnetic resonance imaging. Cancer 2005;103:1898–1905. [DOI] [PubMed] [Google Scholar]
- 2.Gail MH, Brinton LA, Byar DP, et al. Projecting individualized probabilities of developing breast cancer for white females who are being examined annually. J Natl Cancer Inst 1989;81:1879–1886. [DOI] [PubMed] [Google Scholar]
- 3.Claus EB, Schildkraut JM, Thompson WD, Risch NJ. The genetic attributable risk of breast and ovarian cancer. Cancer 1996;77:2318–2324. [DOI] [PubMed] [Google Scholar]
- 4.Chen J, Pee D, Ayyagari R, et al. Projecting absolute invasive breast cancer risk in white women with a model that includes mammographic density. J Natl Cancer Inst 2006;98:1215–1226. [DOI] [PubMed] [Google Scholar]
- 5.Rockhill B, Spiegelman D, Byrne C, Hunter DJ, Colditz GA. Validation of the Gail et al model of breast cancer risk prediction and implications for chemoprevention. J Natl Cancer Inst 2001;93:358–366. [DOI] [PubMed] [Google Scholar]
- 6.Martin LJ, Boyd NF. Mammographic density: potential mechanisms of breast cancer risk associated with mammographic density—hypotheses based on epidemiological evidence. Breast Cancer Res 2008;10:201–214. [DOI] [PMC free article] [PubMed] [Google Scholar]
- 7.Vachon CM, Sellers TA, Vierkant RA, Wu FF, Brandt KR. Case-control study of increased mammographic breast density response to hormone replacement therapy. Cancer Epidemiol Biomarkers Prev 2002;11:1382–1388. [PubMed] [Google Scholar]
- 8.Boyd NF, Greenberg C, Lockwood G, et al. Effects of 2 years of a low-fat, high-carbohydrate diet on radiological features of the breast: results from a randomized trial. J Natl Cancer Inst 1997;89:488–496. [DOI] [PubMed] [Google Scholar]
- 9.Ursin G, Sun CL, Koh WP, et al. Association between soy, diet, reproductive factors, and mammographic density in Singapore Chinese women. Nutr Cancer 2006;56:128–135. [DOI] [PubMed] [Google Scholar]
- 10.Chow CK, Venzon D, Jones EC, Premkumar A, O'Shaughnessy J, Zujewski J. Effect of tamoxifen on mammographic density. Cancer Epidemiol Biomarkers Prev 2000;9:917–921. [PubMed] [Google Scholar]
- 11.Cuzick J, Warwick J, Pinney E, Warren RM, Duffy SW. Tamoxifen and breast density in women at increased risk of breast cancer. J Natl Cancer Inst 2004;96:621–628. [DOI] [PubMed] [Google Scholar]
- 12.Boyd NF, O'Sullivan B, Campbell JE, et al. Mammographic signs as risk factors for breast cancer. Br J Cancer 1982;45:185–193. [DOI] [PMC free article] [PubMed] [Google Scholar]
- 13.Boyd NF, Byng JW, Jong RA, et al. Quantitative classification of mammographic densities and breast cancer risk: results from the Canadian National Breast Screening Study. J Natl Cancer Inst 1995;87:670–675. [DOI] [PubMed] [Google Scholar]
- 14.Boyd NF, Rommens JM, Vogt K, et al. Mammographic breast density as an intermediate phenotype for breast cancer. Lancet Oncol 2005;6:798–808. [DOI] [PubMed] [Google Scholar]
- 15.Brisson J, Merletti F, Sadowsky NL. Mammographic features of the breast and breast cancer risk. Am J Epidemiol 1982;115:428–437. [DOI] [PubMed] [Google Scholar]
- 16.Brisson J, Morrison AS, Kopans DB. Height and weight, mammographic features of breast tissue, and breast cancer risk. Am J Epidemiol 1984;119:371–381. [DOI] [PubMed] [Google Scholar]
- 17.Brisson J, Verrault R, Morrison AS, Tennina S, Meyer F. Diet, mammographic features of breast tissue, and breast cancer risk. Am J Epidemiol 1989;130:14–24. [DOI] [PubMed] [Google Scholar]
- 18.Wolfe JN, Saftlas AF, Salane M. Mammographic parenchymal patterns and quantitative evaluation of mammographic densities: a case-control study. AJR Am J Roentgenol 1987;148:1087–1092. [DOI] [PubMed] [Google Scholar]
- 19.Saftlas AF, Hoover RN, Brinton LA, et al. Mammographic densities and risk of breast cancer. Cancer 1991;67:2833–2838. [DOI] [PubMed] [Google Scholar]
- 20.Byrne C, Schairer C, Wolfe J, et al. Mammographic features and breast cancer risk: effects with time, age, and menopause status. J Natl Cancer Inst 1995;87:1622–1629. [DOI] [PubMed] [Google Scholar]
- 21.Thomas DB, Carter RA, Bush WH, et al. Risk of subsequent breast cancer in relation to characteristics of screening mammograms from women less than 50 years of age. Cancer Epidemiol Biomarkers Prev 2002;11:565–571. [PubMed] [Google Scholar]
- 22.Ursin G, Ma H, Wu AH, et al. Mammographic density and breast cancer in three ethnic groups. Cancer Epidemiol Biomarkers Prev 2003;12:332–338. [PubMed] [Google Scholar]
- 23.Byng JW, Boyd NF, Fishell E, Jong RA, Yaffe MJ. The quantitative analysis of mammographic densities. Phys Med Biol 1994;39:1629–1638. [DOI] [PubMed] [Google Scholar]
- 24.Boyd NF, Lockwood GA, Martin LJ, Byng JW, Yaffe MJ, Tritchler DL. Mammographic density as a marker of susceptibility to breast cancer: a hypothesis. IARC Sci Publ 2001;154:163–169. [PubMed] [Google Scholar]
- 25.Pawluczyk O, Augustine BJ, Yaffe MJ, et al. A volumetric method for estimation of breast density on digitized screen-film mammograms. Med Phys 2003;30:352–364. [DOI] [PubMed] [Google Scholar]
- 26.Jeffreys M, Warren R, Highnam R, Davey Smith G. Initial experience of using an automated volumetric measure of breast density: the standard mammogram form. Br J Radiol 2006;79:378–382. [DOI] [PubMed] [Google Scholar]
- 27.Niklason LT, Christian BT, Niklason LE, et al. Digital tomosynthesis in breast imaging. Radiology 1997;205:399–406. [DOI] [PubMed] [Google Scholar]
- 28.Rafferty EA. Tomosynthesis: new weapon in breast cancer fight. Decis Imaging Econ 2004; 17.
- 29.Chen SC, Carton AK, Albert M, Conant EF, Schnall MD, Maidment AD. Initial clinical experience with contrast-enhanced digital breast tomosynthesis. Acad Radiol 2007;14:229–238. [DOI] [PMC free article] [PubMed] [Google Scholar]
- 30.Bakic PR, Kontos D, Maidment ADA. Analysis of percent density estimates from digital breast tomosynthesis projection images. In: Krupinski E, Sonka M, Amini A, eds. Proceedings of SPIE: medical imaging 2007—computer-aided diagnosis. Vol 6514. Bellingham, Wash: SPIE–The International Society for Optical Engineering, 2007; 651424-1–651424-10.
- 31.Khan Q, Kimler B, O'Dea A, Zalles C, Sharma P, Fabian C. Mammographic density does not correlate with Ki-67 expression or cytomorphology in benign breast cells obtained by random periareolar fine needle aspiration from women at high risk for breast cancer. Breast Cancer Res 2006;9:R35. [DOI] [PMC free article] [PubMed] [Google Scholar]
- 32.Gram IT, Bremnes Y, Lund E, Ursin G, Maskarinec G, Bjurstam N. Percentage density, Wolfe's and Tabár's mammographic patterns: agreement and association with risk factors for breast cancer. Breast Cancer Res 2005;7:R854–R861. [DOI] [PMC free article] [PubMed] [Google Scholar]
- 33.Cerhan JR, Sellers TA, Janney CA, Pankratz VS, Brandt KR, Vachon CM. Prenatal and perinatal correlates of adult mammographic breast density. Cancer Epidemiol Biomarkers Prev 2005;14:1502–1508. [DOI] [PubMed] [Google Scholar]
- 34.Liang KY, Zeger S. Longitudinal data analysis using generalized linear models. Biometrika 1986;73:13–22. [Google Scholar]
- 35.Ratcliffe SJ, Shults J. GEEQBOX: a MATLAB toolbox for generalized estimating equations and quasi-least squares. J Stat Software 2008; 25.
- 36.Sim J, Wright CC. The kappa statistic in reliability studies: use, interpretation, and sample size requirements. Phys Ther 2005;85:257–268. [PubMed] [Google Scholar]
- 37.Kundel HL, Polansky M. Measurement of observer agreement. Radiology 2003;228:303–308. [DOI] [PubMed] [Google Scholar]
- 38.Landis JR, Koch GG. The measurement of observer agreement for categorical data. Biometrics 1977;33:159–174. [PubMed] [Google Scholar]
- 39.Aiello EJ, Tworoger SS, Yasui Y, et al. Associations among circulating sex hormones, insulin-like growth factor, lipids, and mammographic density in postmenopausal women. Cancer Epidemiol Biomarkers Prev 2005;14:1411–1417. [DOI] [PubMed] [Google Scholar]
- 40.Rosner B. Fundamentals of biostatistics. Belmont, Calif: Duxbury, 1995.
- 41.Gao J, Warren R, Warren-Forward H, Forbes JF. Reproducibility of visual assessment on mammographic density. Breast Cancer Res Treat 2007;108:121–127. [DOI] [PubMed] [Google Scholar]
- 42.Shepherd JA, Kerlikowske KM, Smith-Bindman R, Genant HK, Cummings SR. Measurement of breast density with dual x-ray absorptiometry: feasibility. Radiology 2002;223:554–557. [DOI] [PubMed] [Google Scholar]
- 43.Shepherd JA, Herve L, Landau J, Fan B, Kerlikowske K, Cummings SR. Clinical comparison of a novel breast DXA technique to mammographic density. Med Phys 2006;33:1490–1498. [DOI] [PubMed] [Google Scholar]
- 44.Bakic PR, Kontos D, Carton A-K, Maidment ADA. Breast percent density estimation from 3D reconstructed digital breast tomosynthesis images. In: Sonka M, Manduca A, eds. Proceedings of SPIE: medical imaging 2008—physics of medical imaging. Vol 6913. Bellingham, Wash: SPIE–The International Society for Optical Engineering, 2008; 691318-1–691318-8.
- 45.Chan HP, Sahiner B, Lam KL, et al. Computerized analysis of mammographic microcalcifications in morphological and texture feature spaces. Med Phys 1998;25:2007–2019. [DOI] [PubMed] [Google Scholar]


