Summary
The Na+/Ca2+ exchanger (NCX) is the major exporter of Ca2+ across the cell membrane of cardiomyocytes. The activity of the exchanger is regulated by a large intracellular loop that contains two Ca2+-binding domains, CBD1 and CBD2. CBD1 binds Ca2+ with much higher affinity than CBD2 and is considered to be the primary Ca2+ sensor. The effect of Ca2+ on the structure and dynamics of CBD1 has been characterized by NMR spectroscopy using chemical shifts, residual dipolar couplings, and spin relaxation. Residual dipolar couplings are used in a new way for residue selection in the determination of the anisotropic rotational diffusion tensor from spin relaxation data. The results provide a highly consistent description across these complementary data sets and show that Ca2+ binding is accompanied by a selective conformational change among the binding site residues. Residues that exhibit a significant conformational change are also sites of altered dynamics. In particular, Ca2+ binding restricts the mobility of the major acidic segment as well as several nearby binding loops. These observations indicate that Ca2+ elicits a local transition to a well-ordered coordination geometry in the CBD1 binding site.
Keywords: Na+/Ca2+ exchanger, Ca2+-binding proteins, NMR relaxation, backbone dynamics, residual dipolar couplings
Introduction
Calcium ions (Ca2+) act as universal second messengers that regulate many different cellular functions.1; 2 In the heart, for example, an influx of Ca2+ into the cytosol leads to muscle contraction. In order for the heart to function optimally, the same amount of Ca2+ that enters the cytosol at the start of the cardiac cycle must be efficiently removed from the cytosol, allowing the heart to relax and refill with blood. Defects in Ca2+ cycling result in smaller and slower Ca2+ transients that are characteristic of heart failure.3 The major exporter of Ca2+ across the plasma membrane is the Na+/Ca2+ exchanger (NCX) whose dominant mode of transport is the export of one Ca2+ ion for the uptake of three Na+ ions.4; 5; 6
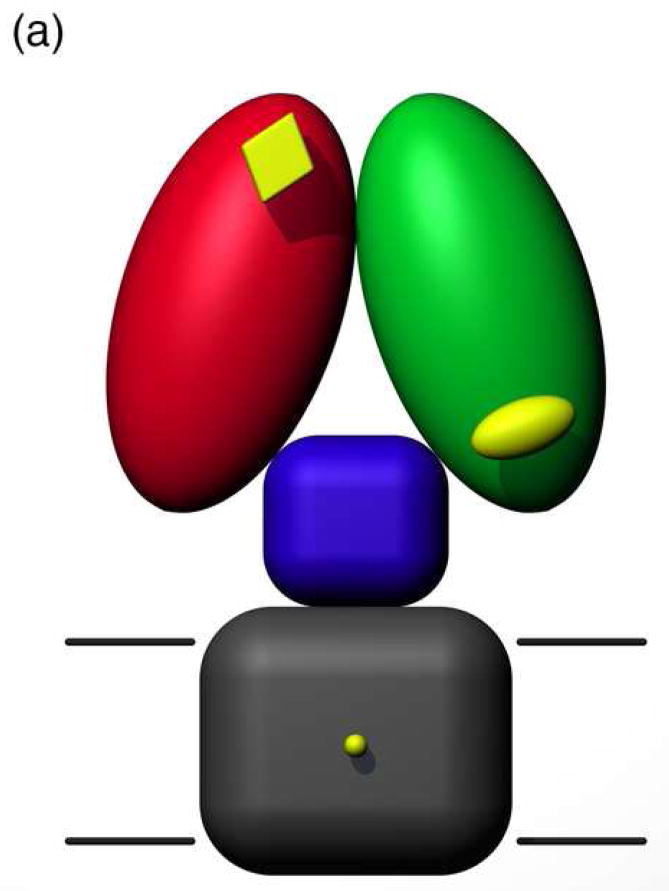
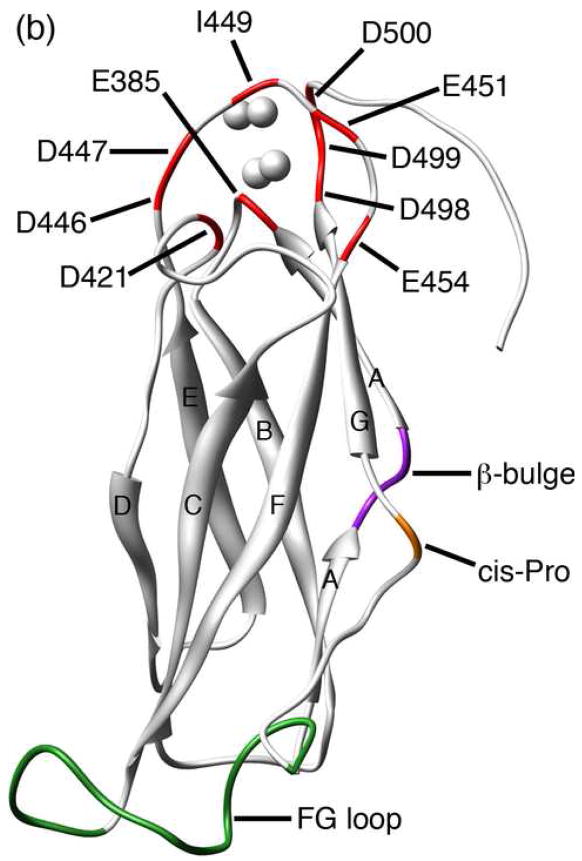
A simplified topology model for the NCX predicts nine transmembrane α-helices and a large intracellular loop of approximately 500 residues located between helices 5 and 6.7; 8 A more detailed description of the intracellular loop in solution was recently obtained by NMR structure determination of two Ca2+-binding domains, CBD1 and CBD2, present in the NCX.9 This study also provided evidence of a third intracellular domain that relays the Ca2+ signal from the regulatory domains CBD1 and CBD2 to the Ca2+ transport sites located within the transmembrane segments (Figure 1a). The structures of Ca2+-bound CBD1 and CBD2 both exhibit an immunoglobulin fold whose core consists of two antiparallel β-sheets that form a compact β-sandwich with a large unstructured loop, the FG loop, connecting strands F and G (Figure 1b). The structure of CBD1 has also been determined by X-ray crystallography, which revealed four bound Ca2+ ions coordinated primarily by side-chain carboxylate groups from two acidic segments located in the EF loop (D446-E454) and near the G-strand at the C-terminus (D498-D500).10 It was previously suggested that the upper half of CBD1 is unstructured in the absence of Ca2+, while CBD2 maintains its structural integrity in the Ca2+-free (apo) state.9 A fluorescent resonance energy transfer (FRET) study in which two fluorophores were linked to CBD1 indicates that Ca2+ binding elicits a conformational change in this domain.11 Based on these structural observations, together with the fact that CBD1 exhibits a higher affinity for Ca2+ than CBD2,9 it has been suggested that CBD1 is the primary Ca2+ sensor in the NCX.
Figure 1.
(a) Model of the intact exchanger composed of CBD1 (red), CBD2 (green), a third intracellular domain (blue), and the transmembrane segments (gray). Ca2+-binding sites are represented in yellow. (b) Representative member (lowest energy) of the NMR structural ensemble (2FWS). The positions of the four Ca2+ ions (represented as spheres) are derived from the corresponding crystal structure (2DPK). Selected structural elements are labeled and color-coded as follows: 1) residues that contribute Ca2+-binding ligands (red), 2) β-bulge (purple), 3) cis-Pro (orange), and 4) FG loop (green). β-strands are labeled A-G. Molecular graphics were produced using the UCSF Chimera package (supported by NIH P41 RR-01081).88
There is currently no structure available for the apo state of CBD1. X-ray crystallographic studies of Ca2+-binding proteins are often hindered by an inability to obtain suitable crystals in both the presence and absence of Ca2+. NMR spectroscopic studies are not limited in this regard as they are performed in solution where the Ca2+ concentration can be freely adjusted. This capability has enabled several comparison studies between structural data from Ca2+-bound and apo states.12; 13; 14; 15; 16; 17; 18; 19; 20; 21; 22; 23; 24; 25; 26; 27; 28; 29 In the case of CBD1, the quantitative comparison between the two states has been deemed challenging due to a significant amount of disorder attributed to the apo state.9 A detailed comparison of the two states, however, has been achieved in the current study through the use of multiple NMR observables. NMR chemical shifts and residual dipolar couplings identify sites where the apo structure differs significantly from that of the Ca2+-bound state. In addition, NMR relaxation methods provide a detailed characterization of the protein’s conformational dynamics in the two states.30; 31; 32 If Ca2+ binding does in fact elicit an order-disorder transition, then the dynamics amplitudes of the Ca2+-bound state should be significantly reduced compared to the apo state.
Backbone NMR relaxation methods have been successfully applied to several other Ca2+-binding proteins.33; 34; 35; 36; 37; 38; 39; 40; 41; 42; 43; 44; 45; 46; 47 Many of these protein systems belong to the EF-hand family. The EF-hand motif is represented in some of the most extensively studied proteins by NMR, including calbindin D9k, calmodulin, and the regulatory domain of troponin C.48; 49; 50; 51 These proteins exhibit a helix-loop-helix motif whose fold and binding geometry are significantly different from that of CBD1. The β-sandwich and binding loops of CBD1 are more closely associated with the C2-domain family, which represents another common Ca2+-binding motif.52; 53 C2-domains often play significant roles in signal transduction and membrane traffic.54 Although the C2-domain is present in several published structures,26; 55; 56; 57 little is known about the effects of Ca2+ on the fast time scale dynamics of this domain. The present study aims to provide a quantitative description of the structure and dynamics of this common Ca2+-binding motif with the goal to better understand its binding mechanism at atomic detail.
Results and Discussion
Analytical ultracentrifugation
Potential partial oligomerization of both the Ca2+-bound and the apo state of CBD1 was assessed by analytical ultracentrifugation at 400 μM, i.e. at NMR concentrations. The results show that both states exist as single species whose molecular weights are consistent with that of the monomer (see Supplementary Materials). These findings are also corroborated by 15N relaxation data (vide infra).
Chemical shift analysis
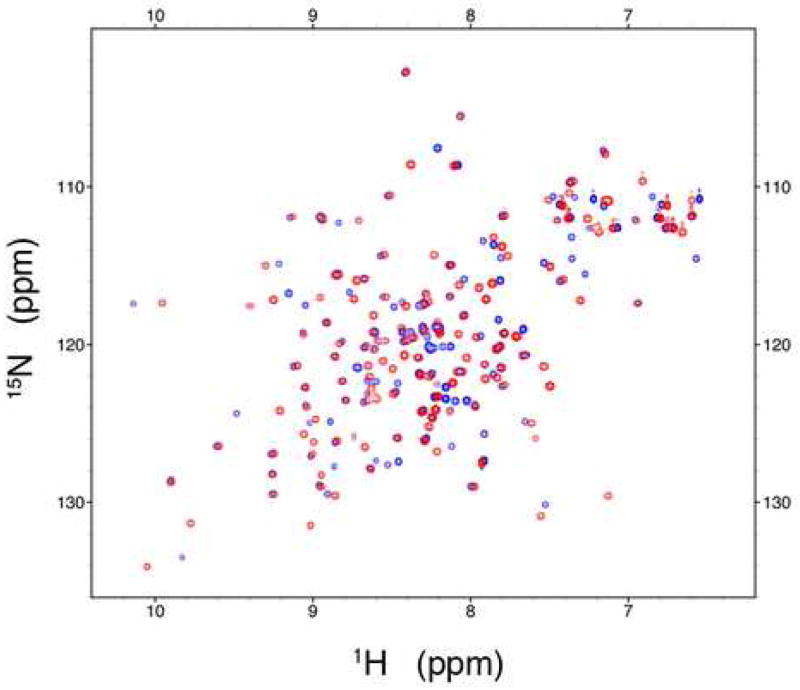
A superposition of the [1H,15N]-HSQC spectra at 800 MHz for CBD1 in the Ca2+-bound (red) and apo (blue) states is represented in Figure 2. Both states exhibit high quality spectra with good peak dispersion for a protein of this size (15.2 kDa). The [1H,15N]-HSQC spectra indicate that only 22 of the 139 total residues are missing or overlapping in both states. One of the overlapping residues (D499) directly participates in Ca2+ binding, i.e. it contributes a Ca2+-binding ligand. An additional five residues are overlapped in the Ca2+-bound state only, while an additional 12 residues, including residues E454, D498, and D500 of the acidic segments, are overlapped in the apo state only.
Figure 2.
Overlay of the [1H,15N]-HSQC spectra. The Ca2+-bound and apo states are represented in red and blue, respectively.
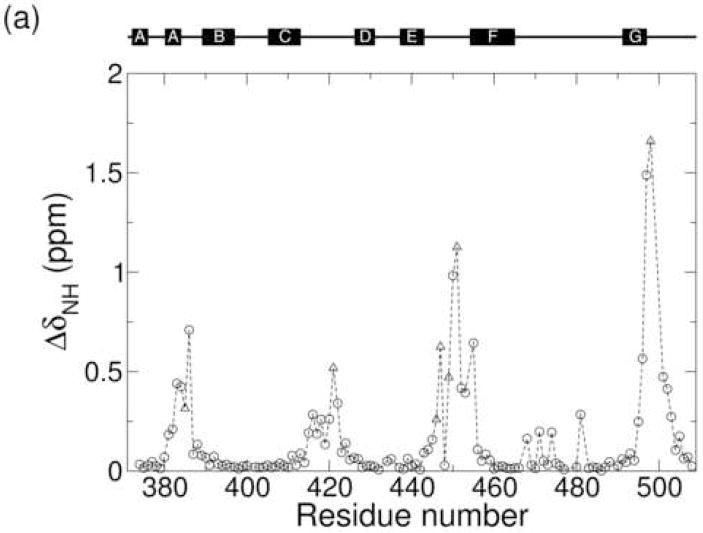
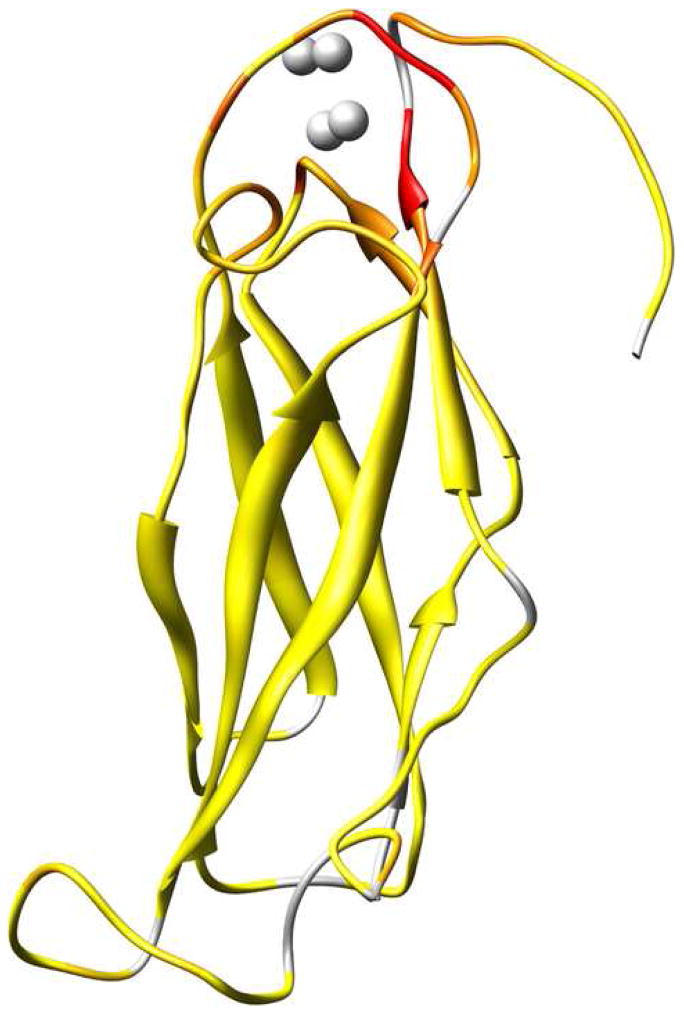
Resonance assignments for the Ca2+-bound state of CBD1 were previously reported by Hilge et al.9 Resonance assignments for the apo state were determined in the present study by working at a lower protein concentration and a higher salt concentration, which improves the sample stability. The results indicate that many nuclei experience similar structures and surroundings in the Ca2+-bound and apo states. Residues for which Ca2+ binding elicits a substantial change in chemical environment are indicated by large values of the amide chemical shift change where ΔδH,i and ΔδN,i are the amide 1H and 15N chemical shift differences between the two states for residue i.58 In Figure 3a the amide chemical shift change is plotted as a function of residue number. Figure 3b maps this same information onto the CBD1 structure using color-coding from yellow (for ΔδNH,i = 0 ppm) to red (for ΔδNH,i ≥ 1 ppm). Ca2+-binding residues are represented in Figure 3a by triangles. The largest amide chemical shift changes cluster in four regions of the protein sequence, each of which contributes one or more Ca2+-binding ligands. The acidic segments near residues 450 and 500 exhibit particularly large ΔδNH,i values across multiple consecutive residues.
Figure 3.
(a) Plot of the amide chemical shift change ΔδNH as a function of residue number. Residues that contribute a Ca2+-binding ligand are represented by triangles. (b) Structural context for the amide chemical shift change. The color gradient extends from yellow for ΔδNH,i = 0 to red for ΔδNH,i ≥ 1.
Residual dipolar coupling analysis
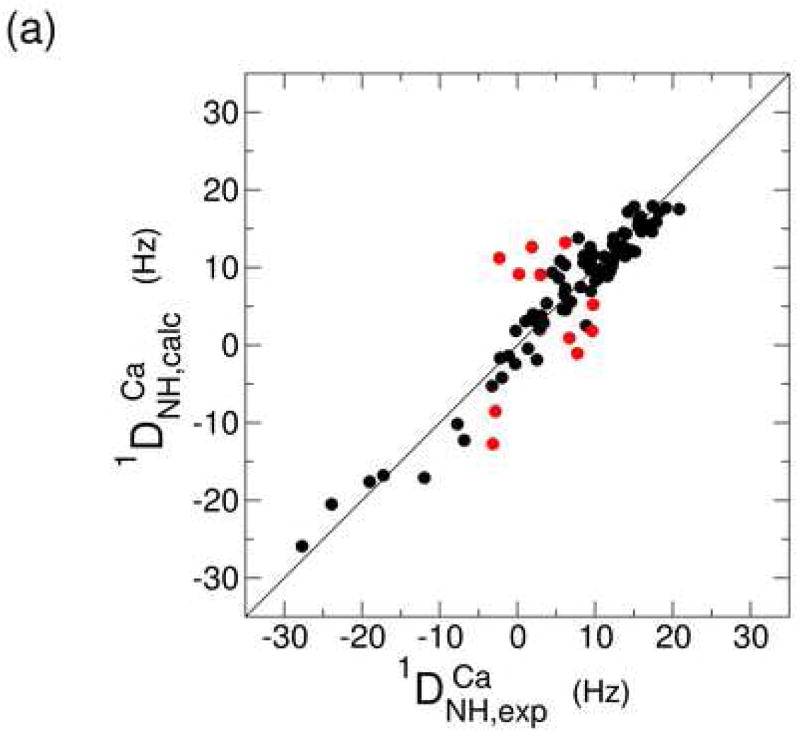
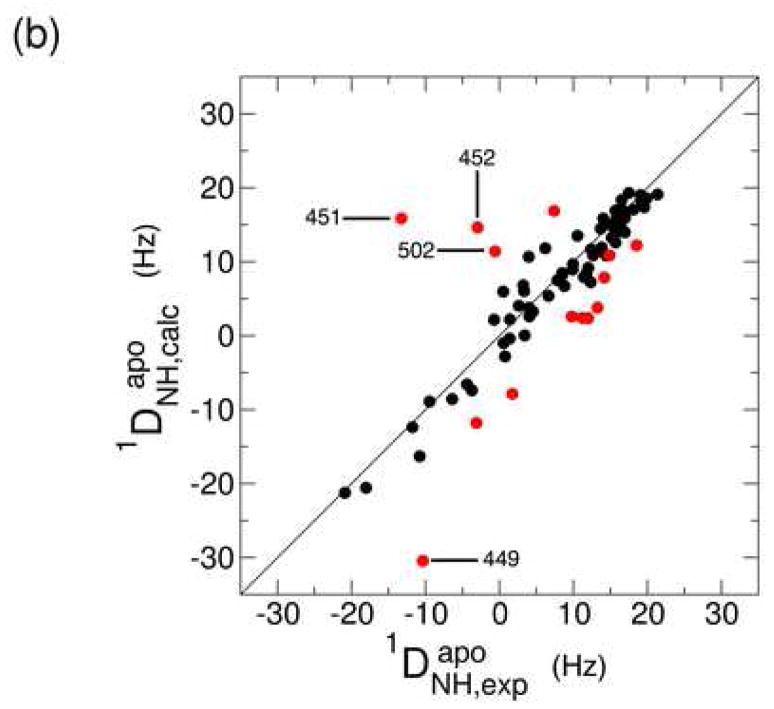
One-bond backbone 15N-1H residual dipolar couplings (RDCs) were measured for the Ca2+-bound and apo states in a liquid crystalline medium containing C12E5/hexanol.59; 60; 61; 62; 63; 64 The use of a liquid crystalline medium results in weak alignment of the protein molecules with respect to the external magnetic field leading to the observed RDCs. This information provides a set of restraints on bond vector orientations that is commonly used in structure validation studies. The RDCs for both states were fit to the Ca2+-bound crystal structure in order to probe for a Ca2+-dependent conformational change. Figures 4a and b show the correlation between the RDCs observed experimentally and the values that are calculated from the CBD1 crystal structure. The red points correspond to residues that were excluded from the calculation of the alignment tensor due to relatively poor agreement with the crystal structure (details provided in the Materials and Methods section).
Figure 4.
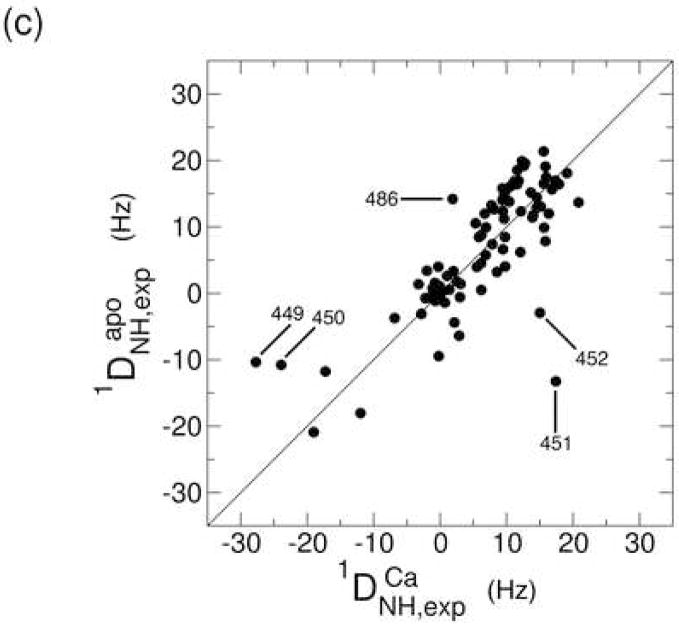
Correlation plot between the experimental and back-calculated one-bond 15N-1H residual dipolar couplings for the Ca2+-bound (a) and apo (b) states. In both cases, the experimental data were fit to the Ca2+-bound crystal structure (2DPK). Residues that were excluded from the alignment tensor calculation are represented in red. The correlation between the experimental RDCs for both states is represented in (c).
The level of agreement between the experimental and calculated RDCs is expressed in terms of a Q value, which depends on the resolution of the available structure. In the present case, the crystal structure was determined at 2.5 Å resolution, which is expected to yield a Q value of around 0.40.60 The Q values for the Ca2+-bound and apo states are 0.31 and 0.49, respectively, indicating that the RDCs for the core domain of both states are largely consistent with the crystal structure. The RDCs of the Ca2+-bound state are expected to provide a lower Q value (i.e. better agreement) due to the fact that the crystal structure corresponds to the Ca2+-loaded form. The agreement is still relatively good, however, for the apo state, suggesting only limited changes in the core β-sandwich structure. Consistent with this finding is the similarity of the alignment tensors for the two states. The axial components are 14.1 and 15.4 Hz, while the rhombicities amount to 0.18 and 0.17 for the Ca2+-bound and apo states, respectively (for definitions of these quantities see reference 65). There are clear site-specific differences between the two states that are apparent in a correlation plot of the experimental RDCs (Figure 4c). Residues 449, 450, 451, and 452 exhibit particularly large differences. These residues are located in the middle of the major acidic segment that includes five of the ten residues that contribute Ca2+-binding ligands. The absolute value of the N-H RDC for each residue in this segment is uniformly higher in the Ca2+-bound state than in the apo state (Figure 4c), which is consistent with the presence of significant motional averaging of these RDCs.65 Together with the large chemical shift differences observed in the region centered near residue 450, these observations indicate that Ca2+ binding requires a localized conformational and dynamic change involving several of the binding site residues.
15N relaxation analysis of overall tumbling motion
15N NMR relaxation data report on fast time scale (picosecond-nanosecond) reorientational motions.30; 31; 32 In order to characterize the effects of Ca2+ binding on the backbone dynamics of CBD1, longitudinal (T1) and transverse (T2) relaxation times, as well as {1H}-15N steady-state nuclear Overhauser effects (NOEs) were measured both in the presence and absence of Ca2+ (relaxation data provided in the Supplementary Materials). The relaxation data were then analyzed using the model-free method of Lipari and Szabo.66 The Lipari-Szabo method provides a generalized order parameter S2 and an internal correlation time τint which indicate the amplitude and time scale, respectively, of internal motion at a given site. Extraction of meaningful model-free parameters requires the accurate description of the overall rotational diffusion tensor with an average correlation time τc. This aspect of the analysis is particularly critical in the case of molecules whose tumbling is highly anisotropic, such as CBD1. In order to optimize the rotational diffusion tensor,67 a set of core residues was selected that satisfied the following criteria: 1) good RDC agreement with the crystal structure, 2) no signs of conformational exchange, and 3) small τint values (details provided in the Materials and Methods section). The cylindrical shape of the 3D structure of CBD1 suggests that a prolate, axially symmetric ellipsoid applies in good approximation for this molecule.
When using the crystal structure as a reference, the combination of the Lipari-Szabo approach with Woessner’s equations gives τc values of 12.30±0.01 and 11.03±0.02 ns and D||/D⊥ ratios of 2.10±0.02 and 1.84±0.03 for the Ca2+-bound and apo states, respectively. Similar values are obtained by the quadric method, which provides an alternative route to the global diffusion parameters.68 Although the quadric method is best-suited for diffusion tensors with relatively small anisotropies, it provides results for CBD1 that are remarkably consistent with those of the Woessner method.69 The quadric method gives τc values of 12.57±0.01 and 11.14±0.02 ns and D||/D⊥ ratios of 2.00±0.01 and 1.78±0.02 for the Ca2+-bound and apo states, respectively. The quality of the fits is high, providing additional evidence that the Ca2+-bound crystal structure is a reasonable model for the core of both the Ca2+-bound and apo states. The apo state, however, is slightly more sensitive to the criteria used to select residues for the diffusion tensor optimization, due to the fact that the number of available bond vectors is limited by the lack of a high-resolution apo structure. The present results demonstrate, however, that the rotational diffusion of CBD1 is slower and more anisotropic in the presence of Ca2+, which is likely caused by the structuring of the binding site loops upon Ca2+ binding. The higher mobility of the Ca2+-binding loop of the apo state, on the other hand, renders its effective hydrodynamic volume smaller and its shape more isotropic.
Flexible regions outside of the binding loops
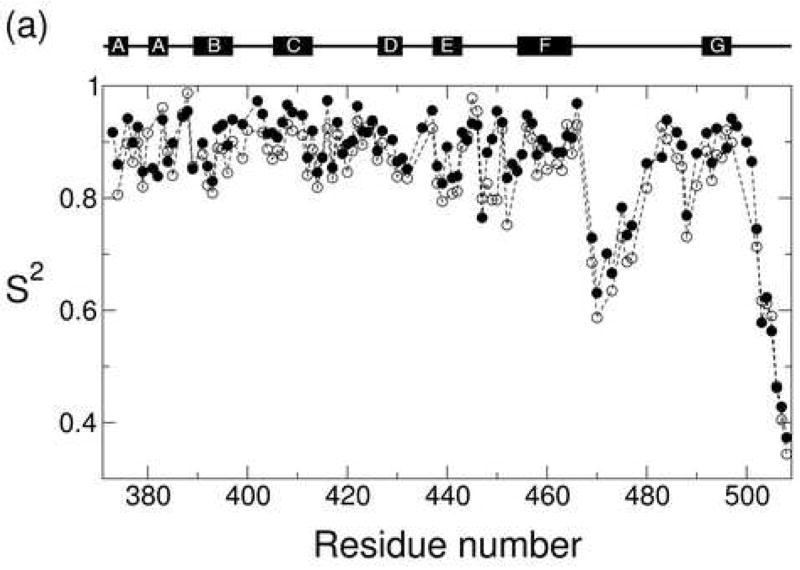
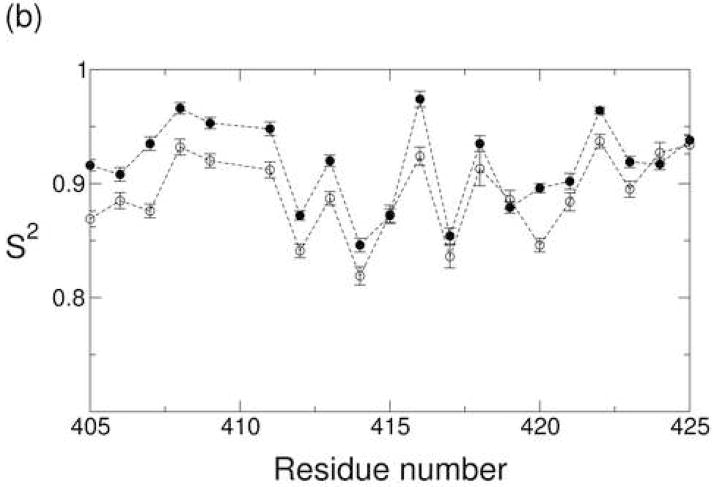
The generalized N-H order parameters S2 for both states were determined with Woessner’s model for anisotropic tumbling and are plotted as a function of residue number in Figure 5a. The two states exhibit very similar S2 profiles across large segments of the molecule. There is a consistent trend, however, in which the S2 values for residues in the core of the domain are slightly higher (around 0.025) in the Ca2+-bound state than in the apo state (Figure 5b). It is considered unlikely that a uniform offset reflects an actual difference in the internal dynamics of the two states. Rather the S2 difference is more likely attributed to the aforementioned uncertainty in the apo diffusion tensor. Model calculations confirm that for the majority of bond vector orientations a small increase in the apparent diffusion tensor anisotropy is reflected in a small systematic increase in the resulting order parameters. Several residues, however, exhibit changes in S2 that are much larger than this overall effect (vide infra).
Figure 5.
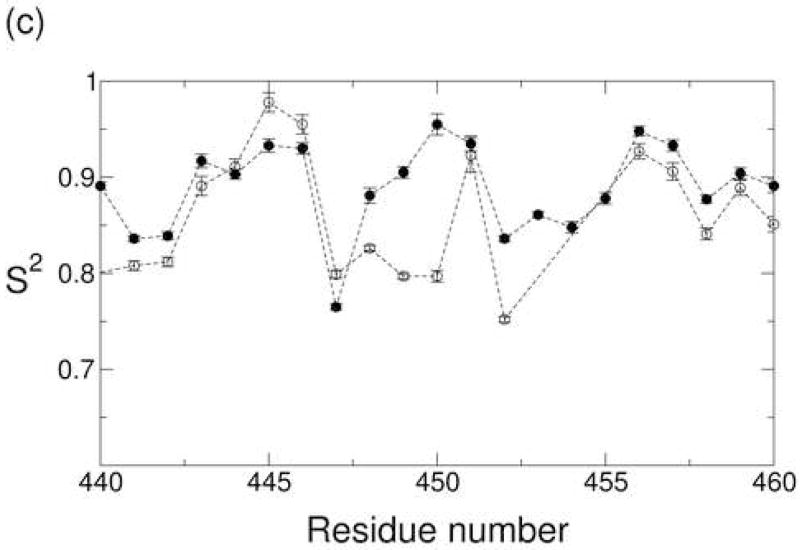
(a) The generalized order parameter S2 plotted as a function of residue number for the Ca2+-bound state (closed circle) and apo state (open circle). Order parameters for residues near strand C are highlighted in (b), while order parameters for the major acidic segment are highlighted in (c).
The low S2 values in the FG loop (residues 467-491) and C-terminus indicate that these regions are highly flexible, in agreement with their poor definitions in the NMR structural ensemble and the missing electron density in the crystal structure. It is not yet known if the high mobility at these sites is preserved in the intact exchanger. A model of the intact exchanger suggests that the FG loop and C-terminus may be subject to additional steric constraints in the NCX that are not present in the isolated domain,9 suggesting that the S2 values for these sites might actually be higher in the intact exchanger. Previous studies of other proteins with the immunoglobulin fold indicate that the mobility of the FG loop determines the specificity of binding for various receptors. High mobility is observed in cases where the FG loop binds to multiple receptors, while more restricted dynamics are observed in cases where the FG loop exhibits higher specificity.70; 71 It is presently unknown whether the mobility of the FG loop plays a similar role in CBD1. To address this point, dynamics studies need to be carried out using larger NCX constructs.
In addition to the local minimum in the order parameter profile of the FG loop at Ser 470, a second local minimum is found at Ser 488. Although this residue is well-defined in the crystal structure, the S2 values indicate that Ser 488 is highly flexible in both states. This observation is consistent with a high level of structural uncertainty in this region as reflected by the RDCs. Several nearby residues exhibit poor RDC agreement with the crystal structure (residues 483, 486, and 491 in the Ca2+-bound state and residue 486 in the apo state). In addition, superposition of the NMR and crystal structures reveals that the distance between the corresponding Cα atoms in the two structures is particularly high in the region (>4 Å for residues 481, 483, 484, 485). The relationship between average structure and dynamics is further elucidated by the local sequence context. Ser 488 is located near strand G between a glycine and a cis-proline. The cis-proline at residue 489 induces a protrusion that is commonly observed in immunoglobulin folds.72 It has been suggested that this structural distortion represents a natural element of negative design.10; 73 Disruption of the outer strand G disfavors the formation of intermolecular hydrogen bonds, which thereby inhibits aggregation of CBD1 with other β-sheet proteins. The fact that this structural distortion is accompanied by large amplitude dynamics suggests that both structure and dynamics may serve a protective role. From a thermodynamic perspective, the inability to form stable hydrogen bonds disfavors intermolecular association by increasing the enthalpy change of the process. In addition, edge-to-edge aggregation would restrict the large amplitude dynamics that are currently observed at Ser 488, which would disfavor intermolecular association by decreasing the corresponding entropy change. Such an entropic penalty represents a novel element of negative design, suggesting that evolution may actually employ a dual protective strategy that includes both structural (enthalpic) as well as dynamic (entropic) effects.
Dynamics changes in the binding loops
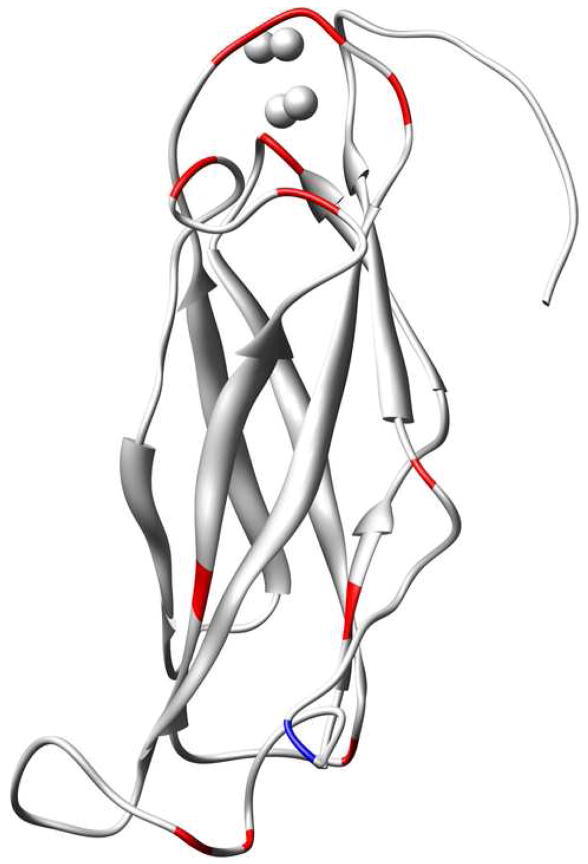
Although the Ca2+-bound and apo states exhibit similar backbone dynamics across large segments of the molecule, the two states exhibit substantial differences in the dynamics of the major acidic segment (Figure 5c). Five residues in this segment (D446, D447, I449, E451, and E454) contribute Ca2+-binding ligands. Of these five, D447 and I449 are particularly relevant to the current study due to the fact that they coordinate Ca2+ ions 4 and 3, respectively, via backbone carbonyl oxygens. These backbone-ion interactions are expected to restrict the mobility of the corresponding amide planes, which include the backbone N-H groups of D448 and F450. Immobilization of these residues is reflected by their S2 values, which are significantly higher in the Ca2+-bound state than in the apo state. Ca2+ binding also appears to restrict the mobility of residues I449 and E452 as is visualized in Figure 6 with residues colored red if the quantity is greater than 0.05.
Figure 6.
Structural context for the change in S2 that accompanies Ca2+ binding. Residues for which ΔS2 > 0.05 are colored red. The residue for which ΔS2 < -0.05 is colored blue.
Ca2+ binding also affects the time scale of motions in the major acidic segment. While the τint values are less than 20 picoseconds for most residues in both states, large τint values are found for residues F450 and E451 in the apo state of 1048 and 444 ps, respectively. Transverse 15N chemical shift anisotropy-dipolar cross-correlation rates ηxy indicate that neither of these residues exhibits conformational exchange on the microsecond-millisecond time scale. Note, however, that fits for both of these residues are susceptible to the effects of structural uncertainty in this region. E451, for example, is one of thirteen residues that were excluded from the characterization of the diffusion tensor due to poor RDC agreement with the crystal structure. These residues were fit using a site-specific τloc value (see equation 1 of the Materials and Methods section). F450 was not excluded from the diffusion tensor optimization, but the angle between the F450 N-H bond vector and the unique axis of the diffusion tensor is relatively small (θ = 29.5°). In this case, the fitting parameters are more susceptible to the effects of structural uncertainty, particularly in molecules such as CBD1 whose tumbling is highly anisotropic.
Three residues in the proximity of the major acidic segment also exhibit large ΔS2 values. They are E385, whose side-chain carboxylate group acts as a Ca2+ -binding ligand, as well as A416 and S420, which are near the Ca2+-binding residue D421. A small number of residues outside of the binding loops also exhibit ΔS2 values greater than 0.05. In most cases, these long-range effects map to isolated positions in the loops located at the opposite end of the domain. Only a few residues exhibit the opposite trend in ΔS2. Leu 483, which is colored blue in Figure 6, is the only case where ΔS2 is less than −0.05. Collectively, the order parameters demonstrate that Ca2+ binding rigidifies the binding site residues, which is accompanied by a few (isolated) changes at the opposite end of the molecule.
S2 comparison with other Ca2+-binding proteins
The mean order parameter change, , across the major acidic segment (residues 446-454) and other binding site residues (385 and 421) is 0.048. This value is comparable to the changes observed in the Ca2+-binding proteins calbindin D9k and the N-domain of cardiac troponin C (cNTnC), both of which have been extensively studied by 15N relaxation spectroscopy. The mean ΔS2 value of the binding site residues 14-27 and 54-65 of calbindin D9k is 0.047 according to Table S4 of Ref. 74 Similarly, Table 2 of Ref. 41 yields a mean ΔS2 value of 0.034 for binding sites residues 29-40 and 65-76 of cNTnC. In order to relate these dynamic changes to changes in actual thermodynamics, it is common to calculate the conformational entropy associated with a given order parameter. The two methods that are most commonly used for this purpose are those by Akke et al.75 and Yang and Kay.76 When applied to the order parameters of the binding site residues, the latter method, which was used in Refs. 41; 74, yields -TΔS values of 2.1, 3.4, and 2.7 kcal·mol−1 for CBD1, calbindin D9k, and cNTnC, respectively, which are very similar to the values obtained by the approach of Akke et al. On a per residue basis, the relevant values are 0.23, 0.13, and 0.12 kcal·mol−1·residue−1. These results indicate that Ca2+ binding is accompanied by a local decrease in backbone conformational entropy for all three systems. Interestingly, the entropy change per binding-site residue can very significantly between the different Ca2+-binding motifs. The larger entropy change per residue that is obtained for CBD1 originates in part from the fact that the average order parameters for CBD1 are slightly higher than for the other two systems. As a result, the entropy change falls into the steeper portion of the order parameter-entropy relationship.75; 76
While the comparison between CBD1 and the EF-hand proteins is useful, the difference between CBD1’s β-sandwich structure of the C2-domain family and the EF-hand structure must be taken into account. Two of the most extensively studied C2-domains are C2A and C2B, which are located in tandem as part of a large cytoplasmic segment of the integral membrane protein synaptotagmin I. This arrangement is analogous in many ways to the structural context of CBD1 and CBD2 in the cytoplasmic loop of the NCX. Both C2A and C2B exhibit local structural changes in the binding loops in response to Ca2+, but neither domain exhibits a large conformational change.26; 77 Future NMR relaxation studies of C2A and C2B would provide additional information about the role of dynamics in the binding mechanism of other C2-domains. Further studies are also needed in order to characterize the effects of Ca2+ on the intramolecular interactions between CBD1 and CBD2 in the NCX and between C2A and C2B in synaptotagmin I. Of note, a FRET study of synaptotagmin I indicates that the two C2 domains are in closer proximity when Ca2+ is bound.78 This finding is consistent with a previously developed model of the NCX that includes an extended interaction interface between CBD1 and CBD2 in the presence of Ca2+.9 Future NMR studies will test this model and determine how the changes identified here in the CBD1 binding site are transmitted to other parts of the molecule.
Conclusions
The effect of Ca2+ on the structure and dynamics of CBD1 has been studied by NMR chemical shifts, residual dipolar couplings, and generalized order parameters at 800 MHz field strength. These quantities provide a highly consistent, site-specific description of the changes that accompany Ca2+ binding. The data indicate that the two states share a common structure and dynamics within the core of the domain. Structural changes at the binding sites, however, are indicated by differences in chemical shifts and residual dipolar couplings between the two states. Spin relaxation measurements confirm that residues that exhibit a significant conformational change are in many cases sites of altered dynamics. Ca2+ binding restricts the mobility of the major acidic segment as well as the other nearby binding loops. Collectively, these findings indicate that the structural and dynamic changes that accompany Ca2+ binding map predominantly to the binding site residues and their vicinity. In the intact exchanger, the presence of the second Ca2+-binding domain CBD2 may induce additional structural and dynamic effects that contribute to the allosteric regulation of the NCX. Such effects will be investigated in future studies of constructs containing both CBD1 and CBD2 using approaches similar to the ones employed here.
Materials and Methods
Sample preparation
Canine NCX1 (residues 371-509) was expressed from a pET23b vector in Escherichia coli BL21(DE3) cells at 37°C for 5 hours using 0.5 mM IPTG for induction. In addition to the native sequence, the protein contained an eight-residue N-terminal His tag that facilitated purification with a Ni-NTA column (Qiagen). Samples were uniformly 15N/13C labeled for chemical shift assignments of the apo state and for RDC measurements of the Ca2+-bound state. All other measurements were performed on uniformly 15N labeled protein. NMR samples contained ~0.4 mM protein, 20 mM HEPES (pH 7.0), 20 mM β-mercaptoethanol, and 0.02% NaN3 in 90% H2O/10% D2O. The Ca2+-bound CBD1 samples also contained 20 mM CaCl2. Alternatively, the apo samples contained 15 mM EDTA and 100 mM NaCl. Compared to previous studies, it was found that the sample integrity of apo CBD1 was much prolonged under these conditions, in particular for protein concentrations around 0.4 mM. The liquid crystalline medium used for residual dipolar coupling (RDC) measurements contained 3% C12E5/hexanol at a molar ratio r = 0.96.59 Sedimentation velocity experiments were performed with a Beckman XL-I ProteomeLab analytical ultracentrifuge equipped with an absorbance optical system. Samples conditions for the sedimentation velocity experiments matched those of the NMR sample conditions, including both protein concentration and temperature. The program SEDFIT79 was used to determine the sedimentation coefficient distributions, which indicate the presence of a single monomeric species in both states (see Supplementary Materials).
NMR spectroscopy
Experiments were performed at 306 K on a Bruker 800 MHz spectrometer equipped with a TCI cryoprobe. Chemical shift assignments for the apo state were obtained from HNCO, HN(CA)CO, HNCA, HN(CO)CA, and CBCA(CO)NH spectra.80 RDCs were obtained from [15N,1H]-HSQC-IPAP spectra.81 Longitudinal (T1) and transverse (T2) relaxation times, as well as {1H}-15N steady-state nuclear Overhauser effects (NOEs) were measured using standard 15N relaxation methods.82; 83 Transverse 15N chemical shift anisotropy-dipolar cross-correlation rates (ηxy) were measured using an IPAP-type spectrum.84 Spectra were processed by NMRPipe85 and analyzed within Sparky (T. D. Goddard & D. G. Kneller, SPARKY 3, University of California, San Francisco).
Data Analysis
RDCs and diffusion tensors using the quadric approach were fit to the crystal structure (2DPK) via singular value decomposition using the MATLAB software.68; 86 The calculation of the alignment tensor was initially performed with all of the available residues. The procedure was then repeated with a subset of residues for which the quantity |RDCcalc − RDCexp|/rms(RDCexp)<0.5 where rms is the root mean square function. Relaxation rate constants were obtained by fitting the cross-peak intensities to a single exponential function using the program CurveFit. (A. G. Palmer, CurveFit, Columbia University.) Duplicate time points provided a measure of the random error in the peak intensities. Monte Carlo simulations were subsequently performed in order to estimate the uncertainty in the rate constants from the measured peak intensity errors. Model-free calculations were performed with the program ModelFree4. (A. G. Palmer, ModelFree, Columbia University.) An initial model-free analysis was performed using the following spectral density function:39; 66; 68
| (1) |
where S2 is the generalized order parameter, τint is the internal correlation time, and τloc is the overall correlation time sensed locally by an individual bond vector. Model-free calculations were performed with an N-H bond length of rNH = 1.02 Å and a chemical shift anisotropy of Δσ = −172 ppm. Following the initial model-free fit, a set of core residues was selected in order to characterize the rotational diffusion tensor. A residue was included in this set of core residues if all of the following criteria were met. 1) The bond vector orientation was consistent with the Ca2+-bound crystal structure. This criterion was met if the quantity |RDCcalc − RDCexp|/rms(RDCexp)< 0.5. 2) The residue showed no signs of conformational exchange. This criterion was met if the quantity ηxy/R2 > 0.65 where . 3) The residue showed no signs of long time scale internal dynamics in the initial model-free fit with equation (1), i.e. when τint < 100 ps. The model-free analysis was then repeated with this set of core residues using the spectral density function for an axially symmetric diffusion tensor:66; 67
| (2) |
where , D|| and D⊥ are the diffusion coefficients; A0 = (3cos2 θ −1)2/4, A1 = 3sin2θ cos2θ, A2 = (3/4)sin4θ, and θ is the angle between the bond vector and the unique axis of the diffusion tensor. The Ca2+-bound crystal structure was used as a reference structure, which was rotated into the principal axis frame of the diffusion tensor as part of this procedure. Errors in the model-free parameters were estimated by Monte Carlo analysis. The optimized diffusion tensor was verified for this set of core residues by the quadric method68; 87 using the program quadric_diffusion. (A. G. Palmer, quadric_diffusion, Columbia University.) Residues that met criterion 1, but not criterion 2 or 3 were included in a final round of model-free calculations using the spectral density function in equation 2, but with the previously optimized diffusion tensor fixed. In order to account for the effects of conformational exchange, Rex terms were included in the fitting procedure for residues that were excluded by criterion 2. Note, however, that residue G399 is the only residue for which a large Rex term is observed (10.55 and 10.19 s−1 in the Ca2+-bound and apo states, respectively). Residues that did not meet criterion 1 or that were absent in the crystal structure due to weak electron density were excluded from the final round of model-free calculations due to their large orientational uncertainty. For these residues, the S2 and τint values that are reported correspond to the results originally obtained using the spectral density function in equation 1.
Supplementary Material
Acknowledgments
We thank Prof. Stephan Grzesiek for providing NMR relaxation pulse programs and Prof. Andrew Herr for performing the analytical ultracentrifugation experiments. Stephan Hilge provided the artwork for Figure 1a. E.J. is the recipient of a postdoctoral fellowship from the American Heart Association, Greater Southeast Affiliate. S.A.S. is the recipient of an NIH postdoctoral fellowship. This work was supported by the Dutch Science Foundation NOW (grant 700.55.443 to G.W.V.) and the National Science Foundation (grant 0621482 to R.B.).
Abbreviations
- CBD1
calcium-binding domain 1
- NCX
Na+/Ca2+ exchanger
- RDC
residual dipolar coupling
Footnotes
Publisher's Disclaimer: This is a PDF file of an unedited manuscript that has been accepted for publication. As a service to our customers we are providing this early version of the manuscript. The manuscript will undergo copyediting, typesetting, and review of the resulting proof before it is published in its final citable form. Please note that during the production process errors may be discovered which could affect the content, and all legal disclaimers that apply to the journal pertain.
References
- 1.Berridge MJ, Bootman MD, Roderick HL. Calcium signalling: dynamics, homeostasis and remodelling. Nat Rev Mol Cell Biol. 2003;4:517–29. doi: 10.1038/nrm1155. [DOI] [PubMed] [Google Scholar]
- 2.Carafoli E. Calcium signaling: a tale for all seasons. Proc Natl Acad Sci U S A. 2002;99:1115–22. doi: 10.1073/pnas.032427999. [DOI] [PMC free article] [PubMed] [Google Scholar]
- 3.Sipido KR, Volders PG, Vos MA, Verdonck F. Altered Na+/Ca2+ exchange activity in cardiac hypertrophy and heart failure: a new target for therapy? Cardiovasc Res. 2002;53:782–805. doi: 10.1016/s0008-6363(01)00470-9. [DOI] [PubMed] [Google Scholar]
- 4.Philipson KD, Nicoll DA. Sodium-calcium exchange: a molecular perspective. Annu Rev Physiol. 2000;62:111–33. doi: 10.1146/annurev.physiol.62.1.111. [DOI] [PubMed] [Google Scholar]
- 5.Reuter H, Pott C, Goldhaber JI, Henderson SA, Philipson KD, Schwinger RH. Na+-Ca2+ exchange in the regulation of cardiac excitation-contraction coupling. Cardiovasc Res. 2005;67:198–207. doi: 10.1016/j.cardiores.2005.04.031. [DOI] [PubMed] [Google Scholar]
- 6.Kang TM, Hilgemann DW. Multiple transport modes of the cardiac Na+/Ca2+ exchanger. Nature. 2004;427:544–8. doi: 10.1038/nature02271. [DOI] [PubMed] [Google Scholar]
- 7.Iwamoto T, Nakamura TY, Pan Y, Uehara A, Imanaga I, Shigekawa M. Unique topology of the internal repeats in the cardiac Na+/Ca2+ exchanger. FEBS Lett. 1999;446:264–8. doi: 10.1016/s0014-5793(99)00218-5. [DOI] [PubMed] [Google Scholar]
- 8.Nicoll DA, Ottolia M, Lu L, Lu Y, Philipson KD. A new topological model of the cardiac sarcolemmal Na+-Ca2+ exchanger. J Biol Chem. 1999;274:910–7. doi: 10.1074/jbc.274.2.910. [DOI] [PubMed] [Google Scholar]
- 9.Hilge M, Aelen J, Vuister GW. Ca2+ regulation in the Na+/Ca2+ exchanger involves two markedly different Ca2+ sensors. Mol Cell. 2006;22:15–25. doi: 10.1016/j.molcel.2006.03.008. [DOI] [PubMed] [Google Scholar]
- 10.Nicoll DA, Sawaya MR, Kwon S, Cascio D, Philipson KD, Abramson J. The crystal structure of the primary Ca2+ sensor of the Na+/Ca2+ exchanger reveals a novel Ca2+ binding motif. J Biol Chem. 2006;281:21577–81. doi: 10.1074/jbc.C600117200. [DOI] [PubMed] [Google Scholar]
- 11.Ottolia M, Philipson KD, John S. Conformational changes of the Ca2+ regulatory site of the Na+-Ca2+ exchanger detected by FRET. Biophys J. 2004;87:899–906. doi: 10.1529/biophysj.104.043471. [DOI] [PMC free article] [PubMed] [Google Scholar]
- 12.Chazin WJ. Releasing the calcium trigger. Nat Struct Biol. 1995;2:707–10. doi: 10.1038/nsb0995-707. [DOI] [PubMed] [Google Scholar]
- 13.Kördel J, Skelton NJ, Akke M, Chazin WJ. High-resolution structure of calcium-loaded calbindin D9k. J Mol Biol. 1993;231:711–34. doi: 10.1006/jmbi.1993.1322. [DOI] [PubMed] [Google Scholar]
- 14.Skelton NJ, Kördel J, Chazin WJ. Determination of the solution structure of apo calbindin D9k by NMR spectroscopy. J Mol Biol. 1995;249:441–62. doi: 10.1006/jmbi.1995.0308. [DOI] [PubMed] [Google Scholar]
- 15.Chou JJ, Li S, Klee CB, Bax A. Solution structure of Ca2+-calmodulin reveals flexible hand-like properties of its domains. Nat Struct Biol. 2001;8:990–7. doi: 10.1038/nsb1101-990. [DOI] [PubMed] [Google Scholar]
- 16.Kuboniwa H, Tjandra N, Grzesiek S, Ren H, Klee CB, Bax A. Solution structure of calcium-free calmodulin. Nat Struct Biol. 1995;2:768–76. doi: 10.1038/nsb0995-768. [DOI] [PubMed] [Google Scholar]
- 17.Zhang M, Tanaka T, Ikura M. Calcium-induced conformational transition revealed by the solution structure of apo calmodulin. Nat Struct Biol. 1995;2:758–67. doi: 10.1038/nsb0995-758. [DOI] [PubMed] [Google Scholar]
- 18.Blanchard H, Grochulski P, Li Y, Arthur JS, Davies PL, Elce JS, Cygler M. Structure of a calpain Ca2+-binding domain reveals a novel EF-hand and Ca2+-induced conformational changes. Nat Struct Biol. 1997;4:532–8. doi: 10.1038/nsb0797-532. [DOI] [PubMed] [Google Scholar]
- 19.Ames JB, Ishima R, Tanaka T, Gordon JI, Stryer L, Ikura M. Molecular mechanics of calcium-myristoyl switches. Nature. 1997;389:198–202. doi: 10.1038/38310. [DOI] [PubMed] [Google Scholar]
- 20.Tanaka T, Ames JB, Harvey TS, Stryer L, Ikura M. Sequestration of the membrane-targeting myristoyl group of recoverin in the calcium-free state. Nature. 1995;376:444–7. doi: 10.1038/376444a0. [DOI] [PubMed] [Google Scholar]
- 21.Wingard JN, Chan J, Bosanac I, Haeseleer F, Palczewski K, Ikura M, Ames JB. Structural analysis of Mg2+ and Ca2+ binding to CaBP1, a neuron-specific regulator of calcium channels. J Biol Chem. 2005;280:37461–70. doi: 10.1074/jbc.M508541200. [DOI] [PMC free article] [PubMed] [Google Scholar]
- 22.Findlay WA, Sonnichsen FD, Sykes BD. Solution structure of the TR1C fragment of skeletal muscle troponin-C. J Biol Chem. 1994;269:6773–8. doi: 10.2210/pdb1trf/pdb. [DOI] [PubMed] [Google Scholar]
- 23.Gagné SM, Tsuda S, Li MX, Smillie LB, Sykes BD. Structures of the troponin C regulatory domains in the apo and calcium-saturated states. Nat Struct Biol. 1995;2:784–9. doi: 10.1038/nsb0995-784. [DOI] [PubMed] [Google Scholar]
- 24.Sia SK, Li MX, Spyracopoulos L, Gagné SM, Liu W, Putkey JA, Sykes BD. Structure of cardiac muscle troponin C unexpectedly reveals a closed regulatory domain. J Biol Chem. 1997;272:18216–21. doi: 10.1074/jbc.272.29.18216. [DOI] [PubMed] [Google Scholar]
- 25.Spyracopoulos L, Li MX, Sia SK, Gagné SM, Chandra M, Solaro RJ, Sykes BD. Calcium-induced structural transition in the regulatory domain of human cardiac troponin C. Biochemistry. 1997;36:12138–46. doi: 10.1021/bi971223d. [DOI] [PubMed] [Google Scholar]
- 26.Shao X, Fernandez I, Südhof TC, Rizo J. Solution structures of the Ca2+-free and Ca2+-bound C2A domain of synaptotagmin I: does Ca2+ induce a conformational change? Biochemistry. 1998;37:16106–15. doi: 10.1021/bi981789h. [DOI] [PubMed] [Google Scholar]
- 27.Cheng Y, Sequeira SM, Malinina L, Tereshko V, Sollner TH, Patel DJ. Crystallographic identification of Ca2+ and Sr2+ coordination sites in synaptotagmin I C2B domain. Protein Sci. 2004;13:2665–72. doi: 10.1110/ps.04832604. [DOI] [PMC free article] [PubMed] [Google Scholar]
- 28.Bertini I, Del Bianco C, Gelis I, Katsaros N, Luchinat C, Parigi G, Peana M, Provenzani A, Zoroddu MA. Experimentally exploring the conformational space sampled by domain reorientation in calmodulin. Proc Natl Acad Sci U S A. 2004;101:6841–6. doi: 10.1073/pnas.0308641101. [DOI] [PMC free article] [PubMed] [Google Scholar]
- 29.Bertini I, Gupta YK, Luchinat C, Parigi G, Peana M, Sgheri L, Yuan J. Paramagnetism-based NMR restraints provide maximum allowed probabilities for the different conformations of partially independent protein domains. J Am Chem Soc. 2007;129:12786–12794. doi: 10.1021/ja0726613. [DOI] [PubMed] [Google Scholar]
- 30.Brüschweiler R. New approaches to the dynamic interpretation and prediction of NMR relaxation data from proteins. Curr Opin Struct Biol. 2003;13:175–83. doi: 10.1016/s0959-440x(03)00036-8. [DOI] [PubMed] [Google Scholar]
- 31.Palmer AG., 3rd NMR characterization of the dynamics of biomacromolecules. Chem Rev. 2004;104:3623–40. doi: 10.1021/cr030413t. [DOI] [PubMed] [Google Scholar]
- 32.Jarymowycz VA, Stone MJ. Fast time scale dynamics of protein backbones: NMR relaxation methods, applications, and functional consequences. Chem Rev. 2006;106:1624–71. doi: 10.1021/cr040421p. [DOI] [PubMed] [Google Scholar]
- 33.Akke M, Skelton NJ, Kördel J, Palmer AG, 3rd, Chazin WJ. Effects of ion binding on the backbone dynamics of calbindin D9k determined by 15N NMR relaxation. Biochemistry. 1993;32:9832–44. doi: 10.1021/bi00088a039. [DOI] [PubMed] [Google Scholar]
- 34.Evenäs J, Forsén S, Malmendal A, Akke M. Backbone dynamics and energetics of a calmodulin domain mutant exchanging between closed and open conformations. J Mol Biol. 1999;289:603–17. doi: 10.1006/jmbi.1999.2770. [DOI] [PubMed] [Google Scholar]
- 35.Kördel J, Skelton NJ, Akke M, Palmer AG, 3rd, Chazin WJ. Backbone dynamics of calcium-loaded calbindin D9k studied by two-dimensional proton-detected 15N NMR spectroscopy. Biochemistry. 1992;31:4856–66. doi: 10.1021/bi00135a017. [DOI] [PubMed] [Google Scholar]
- 36.Malmendal A, Carlström G, Hambraeus C, Drakenberg T, Forsén S, Akke M. Sequence and context dependence of EF-hand loop dynamics. An 15N relaxation study of a calcium-binding site mutant of calbindin D9k. Biochemistry. 1998;37:2586–95. doi: 10.1021/bi971798a. [DOI] [PubMed] [Google Scholar]
- 37.Malmendal A, Evenäs J, Forsén S, Akke M. Structural dynamics in the C-terminal domain of calmodulin at low calcium levels. J Mol Biol. 1999;293:883–99. doi: 10.1006/jmbi.1999.3188. [DOI] [PubMed] [Google Scholar]
- 38.Malmendal A, Vander Kooi CW, Nielsen NC, Chazin WJ. Calcium-modulated S100 protein-phospholipid interactions. An NMR study of calbindin D9k and DPC. Biochemistry. 2005;44:6502–12. doi: 10.1021/bi050088z. [DOI] [PubMed] [Google Scholar]
- 39.Barbato G, Ikura M, Kay LE, Pastor RW, Bax A. Backbone dynamics of calmodulin studied by 15N relaxation using inverse detected two-dimensional NMR spectroscopy: the central helix is flexible. Biochemistry. 1992;31:5269–78. doi: 10.1021/bi00138a005. [DOI] [PubMed] [Google Scholar]
- 40.Gagné SM, Tsuda S, Spyracopoulos L, Kay LE, Sykes BD. Backbone and methyl dynamics of the regulatory domain of troponin C: anisotropic rotational diffusion and contribution of conformational entropy to calcium affinity. J Mol Biol. 1998;278:667–86. doi: 10.1006/jmbi.1998.1723. [DOI] [PubMed] [Google Scholar]
- 41.Spyracopoulos L, Gagné SM, Li MX, Sykes BD. Dynamics and thermodynamics of the regulatory domain of human cardiac troponin C in the apo- and calcium-saturated states. Biochemistry. 1998;37:18032–44. doi: 10.1021/bi9816960. [DOI] [PubMed] [Google Scholar]
- 42.Spyracopoulos L, Lavigne P, Crump MP, Gagné SM, Kay CM, Sykes BD. Temperature dependence of dynamics and thermodynamics of the regulatory domain of human cardiac troponin C. Biochemistry. 2001;40:12541–51. doi: 10.1021/bi010903k. [DOI] [PubMed] [Google Scholar]
- 43.Smallridge RS, Whiteman P, Werner JM, Campbell ID, Handford PA, Downing AK. Solution structure and dynamics of a calcium binding epidermal growth factor-like domain pair from the neonatal region of human fibrillin-1. J Biol Chem. 2003;278:12199–206. doi: 10.1074/jbc.M208266200. [DOI] [PubMed] [Google Scholar]
- 44.Werner JM, Knott V, Handford PA, Campbell ID, Downing AK. Backbone dynamics of a cbEGF domain pair in the presence of calcium. J Mol Biol. 2000;296:1065–78. doi: 10.1006/jmbi.1999.3513. [DOI] [PubMed] [Google Scholar]
- 45.Yuan X, Werner JM, Lack J, Knott V, Handford PA, Campbell ID, Downing AK. Effects of the N2144S mutation on backbone dynamics of a TB-cbEGF domain pair from human fibrillin-1. J Mol Biol. 2002;316:113–25. doi: 10.1006/jmbi.2001.5329. [DOI] [PubMed] [Google Scholar]
- 46.Häussinger D, Ahrens T, Sass HJ, Pertz O, Engel J, Grzesiek S. Calcium-dependent homoassociation of E-cadherin by NMR spectroscopy: changes in mobility, conformation and mapping of contact regions. J Mol Biol. 2002;324:823–39. doi: 10.1016/s0022-2836(02)01137-3. [DOI] [PubMed] [Google Scholar]
- 47.Babini E, Bertini I, Capozzi F, Chirivino E, Luchinat C. A structural and dynamic characterization of the EF-hand protein CLSP. Structure. 2006;14:1029–38. doi: 10.1016/j.str.2006.04.004. [DOI] [PubMed] [Google Scholar]
- 48.Capozzi F, Casadei F, Luchinat C. EF-hand protein dynamics and evolution of calcium signal transduction: an NMR view. J Biol Inorg Chem. 2006;11:949–62. doi: 10.1007/s00775-006-0163-0. [DOI] [PubMed] [Google Scholar]
- 49.Ikura M, Ames JB. Genetic polymorphism and protein conformational plasticity in the calmodulin superfamily: two ways to promote multifunctionality. Proc Natl Acad Sci U S A. 2006;103:1159–64. doi: 10.1073/pnas.0508640103. [DOI] [PMC free article] [PubMed] [Google Scholar]
- 50.Bhattacharya S, Bunick CG, Chazin WJ. Target selectivity in EF-hand calcium binding proteins. Biochim Biophys Acta. 2004;1742:69–79. doi: 10.1016/j.bbamcr.2004.09.002. [DOI] [PubMed] [Google Scholar]
- 51.Grabarek Z. Structural basis for diversity of the EF-hand calcium-binding proteins. J Mol Biol. 2006;359:509–25. doi: 10.1016/j.jmb.2006.03.066. [DOI] [PubMed] [Google Scholar]
- 52.Rizo J, Südhof TC. C2-domains, structure and function of a universal Ca2+-binding domain. J Biol Chem. 1998;273:15879–82. doi: 10.1074/jbc.273.26.15879. [DOI] [PubMed] [Google Scholar]
- 53.Nalefski EA, Falke JJ. The C2 domain calcium-binding motif: structural and functional diversity. Protein Sci. 1996;5:2375–90. doi: 10.1002/pro.5560051201. [DOI] [PMC free article] [PubMed] [Google Scholar]
- 54.Chapman ER. Synaptotagmin: a Ca2+ sensor that triggers exocytosis? Nat Rev Mol Cell Biol. 2002;3:498–508. doi: 10.1038/nrm855. [DOI] [PubMed] [Google Scholar]
- 55.Xu GY, McDonagh T, Yu HA, Nalefski EA, Clark JD, Cumming DA. Solution structure and membrane interactions of the C2 domain of cytosolic phospholipase A2. J Mol Biol. 1998;280:485–500. doi: 10.1006/jmbi.1998.1874. [DOI] [PubMed] [Google Scholar]
- 56.Shao X, Davletov BA, Sutton RB, Südhof TC, Rizo J. Bipartite Ca2+-binding motif in C2 domains of synaptotagmin and protein kinase C. Science. 1996;273:248–51. doi: 10.1126/science.273.5272.248. [DOI] [PubMed] [Google Scholar]
- 57.Essen LO, Perisic O, Cheung R, Katan M, Williams RL. Crystal structure of a mammalian phosphoinositide-specific phospholipase C delta. Nature. 1996;380:595–602. doi: 10.1038/380595a0. [DOI] [PubMed] [Google Scholar]
- 58.Biekofsky RR, Martin SR, Browne JP, Bayley PM, Feeney J. Ca2+ coordination to backbone carbonyl oxygen atoms in calmodulin and other EF-hand proteins: 15N chemical shifts as probes for monitoring individual-site Ca2+ coordination. Biochemistry. 1998;37:7617–29. doi: 10.1021/bi9800449. [DOI] [PubMed] [Google Scholar]
- 59.Rückert M, Otting G. Alignment of biological macromolecules in novel nonionic liquid crystalline media for NMR experiments. Journal of the American Chemical Society. 2000;122:7793–7797. [Google Scholar]
- 60.Bax A. Weak alignment offers new NMR opportunities to study protein structure and dynamics. Protein Sci. 2003;12:1–16. doi: 10.1110/ps.0233303. [DOI] [PMC free article] [PubMed] [Google Scholar]
- 61.Tolman JR, Ruan K. NMR residual dipolar couplings as probes of biomolecular dynamics. Chemical Reviews. 2006;106:1720–1736. doi: 10.1021/cr040429z. [DOI] [PubMed] [Google Scholar]
- 62.Blackledge M. Recent progress in the study of biomolecular structure and dynamics in solution from residual dipolar couplings. Progress in Nuclear Magnetic Resonance Spectroscopy. 2005;46:23–61. [Google Scholar]
- 63.Prestegard JH, Bougault CM, Kishore AI. Residual dipolar couplings in structure determination of biomolecules. Chemical Reviews. 2004;104:3519–3540. doi: 10.1021/cr030419i. [DOI] [PubMed] [Google Scholar]
- 64.Clore GM, Schwieters CD. Theoretical and computational advances in biomolecular NMR spectroscopy. Current Opinion in Structural Biology. 2002;12:146–153. doi: 10.1016/s0959-440x(02)00302-0. [DOI] [PubMed] [Google Scholar]
- 65.Meiler J, Prompers JJ, Peti W, Griesinger C, Brüschweiler R. Model-free approach to the dynamic interpretation of residual dipolar couplings in globular proteins. J Am Chem Soc. 2001;123:6098–107. doi: 10.1021/ja010002z. [DOI] [PubMed] [Google Scholar]
- 66.Lipari G, Szabo A. Model-free approach to the interpretation of nuclear magnetic resonance relaxation in macromolecules. 1. Theory and range of validity. Journal of the American Chemical Society. 1982;104:4546–4559. [Google Scholar]
- 67.Woessner DE. Nuclear spin relaxation in ellipsoids undergoing rotational Brownian motion. Journal of Chemical Physics. 1962;37:647. [Google Scholar]
- 68.Brüschweiler R, Liao X, Wright PE. Long-range motional restrictions in a multidomain zinc-finger protein from anisotropic tumbling. Science. 1995;268:886–9. doi: 10.1126/science.7754375. [DOI] [PubMed] [Google Scholar]
- 69.Andrec M, Inman KG, Weber DJ, Levy RM, Montelione GT. A Bayesian statistical method for the detection and quantification of rotational diffusion anisotropy from NMR relaxation data. J Magn Reson. 2000;146:66–80. doi: 10.1006/jmre.2000.2113. [DOI] [PubMed] [Google Scholar]
- 70.Carr PA, Erickson HP, Palmer AG., 3rd Backbone dynamics of homologous fibronectin type III cell adhesion domains from fibronectin and tenascin. Structure. 1997;5:949–59. doi: 10.1016/S0969-2126(97)00248-7. [DOI] [PubMed] [Google Scholar]
- 71.Siggers K, Soto C, Palmer AG., 3rd Conformational Dynamics in Loop Swap Mutants of Homologous Fibronectin Type III Domains. Biophys J. 2007;93:2447–56. doi: 10.1529/biophysj.106.100578. [DOI] [PMC free article] [PubMed] [Google Scholar]
- 72.Halaby DM, Poupon A, Mornon J. The immunoglobulin fold family: sequence analysis and 3D structure comparisons. Protein Eng. 1999;12:563–71. doi: 10.1093/protein/12.7.563. [DOI] [PubMed] [Google Scholar]
- 73.Richardson JS, Richardson DC. Natural beta-sheet proteins use negative design to avoid edge-to-edge aggregation. Proc Natl Acad Sci U S A. 2002;99:2754–9. doi: 10.1073/pnas.052706099. [DOI] [PMC free article] [PubMed] [Google Scholar]
- 74.Mäler L, Blankenship J, Rance M, Chazin WJ. Site-site communication in the EF-hand Ca2+-binding protein calbindin D9k. Nat Struct Biol. 2000;7:245–50. doi: 10.1038/73369. [DOI] [PubMed] [Google Scholar]
- 75.Akke M, Brüschweiler R, Palmer AG. NMR order parameters and free energy: an analytical approach and its application to cooperative Ca2+ binding by calbindin D9k. Journal of the American Chemical Society. 1993;115:9832–9833. [Google Scholar]
- 76.Yang D, Kay LE. Contributions to conformational entropy arising from bond vector fluctuations measured from NMR-derived order parameters: application to protein folding. J Mol Biol. 1996;263:369–82. doi: 10.1006/jmbi.1996.0581. [DOI] [PubMed] [Google Scholar]
- 77.Fernandez I, Araç D, Ubach J, Gerber SH, Shin O, Gao Y, Anderson RG, Südhof TC, Rizo J. Three-dimensional structure of the synaptotagmin 1 C2B-domain: synaptotagmin 1 as a phospholipid binding machine. Neuron. 2001;32:1057–69. doi: 10.1016/s0896-6273(01)00548-7. [DOI] [PubMed] [Google Scholar]
- 78.García RA, Forde CE, Godwin HA. Calcium triggers an intramolecular association of the C2 domains in synaptotagmin. Proc Natl Acad Sci U S A. 2000;97:5883–8. doi: 10.1073/pnas.100127197. [DOI] [PMC free article] [PubMed] [Google Scholar]
- 79.Schuck P. Size-distribution analysis of macromolecules by sedimentation velocity ultracentrifugation and Lamm equation modeling. Biophys J. 2000;78:1606–19. doi: 10.1016/S0006-3495(00)76713-0. [DOI] [PMC free article] [PubMed] [Google Scholar]
- 80.Kanelis V, Forman-Kay JD, Kay LE. Multidimensional NMR methods for protein structure determination. IUBMB Life. 2001;52:291–302. doi: 10.1080/152165401317291147. [DOI] [PubMed] [Google Scholar]
- 81.Ottiger M, Delaglio F, Bax A. Measurement of J and dipolar couplings from simplified two-dimensional NMR spectra. Journal of Magnetic Resonance. 1998;131:373–378. doi: 10.1006/jmre.1998.1361. [DOI] [PubMed] [Google Scholar]
- 82.Brutscher B, Brüschweiler R, Ernst RR. Backbone dynamics and structural characterization of the partially folded A state of ubiquitin by 1H, 13C, and 15N nuclear magnetic resonance spectroscopy. Biochemistry. 1997;36:13043–53. doi: 10.1021/bi971538t. [DOI] [PubMed] [Google Scholar]
- 83.Massi F, Johnson E, Wang C, Rance M, Palmer AG., 3rd NMR R1ρ rotating-frame relaxation with weak radio frequency fields. J Am Chem Soc. 2004;126:2247–56. doi: 10.1021/ja038721w. [DOI] [PubMed] [Google Scholar]
- 84.Hall JB, Fushman D. Direct measurement of the transverse and longitudinal 15N chemical shift anisotropy-dipolar cross-correlation rate constants using 1H-coupled HSQC spectra. Magnetic Resonance in Chemistry. 2003;41:837–842. [Google Scholar]
- 85.Delaglio F, Grzesiek S, Vuister GW, Zhu G, Pfeifer J, Bax A. NMRPipe: a multidimensional spectral processing system based on UNIX pipes. J Biomol NMR. 1995;6:277–93. doi: 10.1007/BF00197809. [DOI] [PubMed] [Google Scholar]
- 86.Losonczi JA, Andrec M, Fischer MW, Prestegard JH. Order matrix analysis of residual dipolar couplings using singular value decomposition. J Magn Reson. 1999;138:334–42. doi: 10.1006/jmre.1999.1754. [DOI] [PubMed] [Google Scholar]
- 87.Lee LK, Rance M, Chazin WJ, Palmer AG., 3rd Rotational diffusion anisotropy of proteins from simultaneous analysis of 15N and 13C alpha nuclear spin relaxation. J Biomol NMR. 1997;9:287–98. doi: 10.1023/a:1018631009583. [DOI] [PubMed] [Google Scholar]
- 88.Pettersen EF, Goddard TD, Huang CC, Couch GS, Greenblatt DM, Meng EC, Ferrin TE. UCSF Chimera: a visualization system for exploratory research and analysis. J Comput Chem. 2004;25:1605–12. doi: 10.1002/jcc.20084. [DOI] [PubMed] [Google Scholar]
Associated Data
This section collects any data citations, data availability statements, or supplementary materials included in this article.


