

Abstract
Purpose
Tumor hypoxia is a well-known therapeutic problem; however, a lack of methods for repeated measurements of glioma partial pressure of oxygen (pO2) limits the ability to optimize the therapeutic approaches. We report the effects of 9.3 Gy of radiation and carbogen inhalation on orthotopic 9L and C6 gliomas and on the contralateral brain pO2 in rats using a new and potentially widely useful method, multisite in vivo electron paramagnetic resonance oximetry.
Methods and Materials
Intracerebral 9L and C6 tumors were established in the left hemisphere of syngeneic rats, and electron paramagnetic resonance oximetry was successfully used for repeated tissue pO2 measurements after 9.3 Gy of radiation and during carbogen breathing for 5 consecutive days.
Results
Intracerebral 9L gliomas had a pO2 of 30–32 mm Hg and C6 gliomas were relatively hypoxic, with a pO2 of 12–14 mm Hg (p < 0.05). The tissue pO2 of the contralateral brain was 40–45 mm Hg in rats with either 9L or C6 gliomas. Irradiation resulted in a significant increase in pO2 of the 9L gliomas only. A significant increase in the pO2 of the 9L and C6 gliomas was observed in rats breathing carbogen, but this effect decreased during 5 days of repeated experiments in the 9L gliomas.
Conclusion
These results highlight the tumor-specific effect of radiation (9.3.Gy) on tissue pO2 and the different responses to carbogen inhalation. The ability of electron paramagnetic resonance oximetry to provide direct repeated measurements of tissue pO2 could have a vital role in understanding the dynamics of hypoxia during therapy that could then be optimized by scheduling doses at times of improved tumor oxygenation.
Keywords: Glioma, Electron paramagnetic resonance oximetry, EPR oximetry, partial pressure of oxygen, pO2, Radiotherapy, Carbogen
INTRODUCTION
Despite several technological advancements in dose delivery, such as stereotactic and intensity-modulated radiotherapy (1), the outcome of patients with gliomas remains poor. The radioresistance of gliomas has been attributed to several factors, including low intrinsic radiosensitivity, high fractions of hypoxic tumor cells, and large populations of clonogenic cells with rapid turnover rates. Tumor hypoxia appears to be the most important factor resulting in radioresistance, invasiveness, and more aggressive tumor phenotypes (2, 3). Several studies have shown that tumors vary in the partial pressure of oxygen (pO2) and that this cannot be predicted from the tumor type, stage, or size but must be measured (2, 3). Therefore, techniques that can provide direct repeated measurement of tumor pO2 are likely to play an important role in the optimization of radiotherapy and chemotherapy.
During fractionated radiotherapy, the hypoxic cells that survive the initial radiation can become oxygenated (i.e., oxygenation allows surviving hypoxic cells to move into a more radiosensitive state before a subsequent irradiation) (3, 4). The time course of oxygenation and the regrowth of oxygenated cells are fundamental to the therapeutic outcome in hypofractionated therapies, which are now increasingly used for malignant gliomas. However, the optimal dose/fraction and the interval between fractions are not known owing to the lack of a technique that can allow repeated measurements of the tumor pO2. Several approaches have been tested to counteract tumor hypoxia to improve the efficacy of radiotherapy (5). One such approach is carbogen (5% carbon dioxide balanced with oxygen) breathing, which has been used either alone or in combination with nicotinamide in the treatment of malignant gliomas, especially in the Accelerated Radiation, Carbogen, Nicotinamide studies (6–8). However, some have reported acute toxicity, especially with the use of nicotinamide. It might be possible to achieve better radiotherapeutic outcomes, even without nicotinamide, if the tumor oxygen could be measured during such treatments and the radiation delivered at times of favorable tumor oxygen levels.
With the development of in vivo paramagnetic resonance oximetry (EPR) oximetry in the past few years, we now have the opportunity to measure the changes in tumor pO2 during therapy and to make advances in developing optimized schedules for enhanced efficacy. In vivo EPR oximetry is a minimally invasive technique with the potential to provide repeated measurements of pO2 from the same tissue for up to several years (9). It is currently being tested to measure tissue pO2 in the foot of healthy volunteers with the aim of diagnosing and optimizing the treatment of diabetic patients (9). In vivo EPR oximetry is also being tested in patients with superficial tumors undergoing radiotherapy and/or chemotherapy with the goal of optimizing these therapies by scheduling the doses at times of optimal tumor oxygenation (9).
The development of multisite measurements for in vivo EPR oximetry has further expanded its utility by allowing simultaneous tissue pO2 measurements at multiple sites with a minimal separation of ≤1 mm (10). This approach can be used to measure the pO2 simultaneously at two sites in the orthotopic tumors and one site in the contralateral brain of syngeneic rats bearing intracerebral 9L and C6 gliomas. The changes in tissue pO2 during the 5 days after a singledose of 9.3 Gy are reported. We also investigated the consequence of carbogen breathing on the tissue pO2 of these intracerebral tumors and contralateral brain for 5 consecutive days of repeated experiments. This is the first report on the changes in tissue pO2 of orthotopic 9L and C6 tumors after 9.3 Gy of radiation and during a carbogen challenge.
METHODS AND MATERIALS
Animals and tumor models
All animal procedures were conducted in strict accordance with the National Institutes of Health Guide for the Care and Use of Laboratory Animals and were approved by the Institutional Animal Care and Use Committee of Dartmouth Medical School. The 9L glioma has a sarcomatous appearance histologically and has been extensively used as subcutaneous tumor model (11, 12). The C6 gliomas are classified as an astrocytoma with the greatest number of genes with expression similar to that of human brain tumors (11, 12). Fischer and Wistar rats (200–250 g), syngeneic hosts for 9L and C6 gliomas, respectively, were purchased from Charles River Laboratory (Wilmington, MA) and housed in the animal resource facility at Dartmouth Medical School.
9L and C6 cells culture and intracerebral inoculation
The 9L and C6 cells were cultured in medium as recommended by the American Type Culture Collection (Manassas, VA). When confluent, the cells were trypsinized and suspended in medium with no serum or additives. For cell injection, the rats were anesthetized (2.5% isoflurane with 30% oxygen through a nose cone), and the head was immobilized on a stereotaxic apparatus. The head skin was shaved and aseptically prepared with Betadine and 70% ethanol. Intracerebral tumors were established by slow injection of cells (50,000 cells in 10 μL within 2 min) with a 25-gauge needle through burr holes at the following co-ordinates: anteroposterior, −3.0 mm; mediolateral, 1.5 mm and 3.5 mm; and dorsoventral, 3.5 mm in the left hemisphere. The burr holes were cleaned and sealed with bone wax, and the skin was sutured.
Implantation of oximetry probe
Oxygen-sensitive lithium phthalocyanine (LiPc) crystals were synthesized in our laboratory and used to measure the tissue pO2 using in vivo EPR oximetry (13). Seven days after cell injection, the rats were prepared as described in the previous section, and two aggregates of LiPc crystals (40 μg/each) were loaded in 25-gauge needle/plungers and injected through the same burr holes in the left hemisphere at a depth of 2 mm from the skull surface. One aggregate of LiPc crystals (40 μg) was injected at the same depth in the right hemisphere at mediolateral, 1.5 mm and anteroposterior, 3.0 mm. These injections created LiPc deposits with a surface area of approximately 0.5–1.5 mm2 and reported the tissue pO2 of the intracerebral tumors and contralateral brain.
The process of injecting the cells or LiPc crystals could have caused some acute physical trauma; therefore, the experiments were initiated 7 days after implantation, which we had shown previously to be sufficient time for any significant damage to have resolved. Liu et al. (14) measured the tissue pO2 1, 3, and 7 days after LiPc implantation in the brain cortex to determine the feasibility of cerebral pO2 assessment within a few days of implantation. The results showed that the pO2 remained constant during this period (14). Furthermore, histologic examination indicated no evidence of edema, red blood cell accumulation (vascular damage), or lymphocyte infiltration in the cortical tissue surrounding the LiPc deposits (13, 15). We performed magnetic resonance imaging (MRI) on Day 14 after cell inoculation to confirm the intracerebral tumor growth and the position of the LiPc deposits in the tumor and contralateral brain. The experiments were started on Day 15 (designated as Day 0).
High-spatial resolution multisite EPR oximetry
The details of the in vivo EPR oximetry procedure have been previously described (9, 13, 16). A recent advancement has been the high-spatial resolution multisite oximetry method with overmodulation (10), which is used to measure the tissue pO2 from two LiPc deposits in the tumor and one in the normal contralateral brain. This technique uses two spectra that have been acquired with magnetic field gradients, and an analytic relationship between the spectra is used to estimate the line width for each implants.
For pO2 measurements, the rats were anesthetized using 1.5% isoflurane with 30% fraction of inspired oxygen and positioned in the magnet of the 1.2-GHz (L-band) EPR spectrometer. The rectal temperature was monitored and maintained at 37° ± 1°C using a warm air blower and warm water pad. The EPR spectra were recorded at 8 mW to avoid power saturation, with scan times varying from 30 to 60 s. The spectra were averaged for 5 min each to enhance the signal/noise ratio for precise pO2 measurements. The tissue pO2 measurements from the two LiPc deposits of each intracerebral tumor were pooled to obtain an average tumor pO2.
Magnetic resonance imaging
The rat brains underwent MRI 1 day before the experiments to confirm the tumor growth, determine the tumor volume, and confirm the location of the LiPc deposits in the brain. The images were acquired on a 7T Varian console interfaced to a Magnex horizontal bore magnet using a birdcage coil (38 mm in diameter) in transmit/receive mode (16). T1-weighted images were acquired after gadodiamide (Omniscan, 0.1 mmol/kg, intraperitoneally) injection in rats. Contrast-enhanced MRI was performed 10–20 min later using a spin-echo T1-weighted imaging sequence (repetition time, 0.7 s; excitation time, 9 ms; slice thickness, 1 mm; field of view, 4 × 4 cm; number of signal averages, 2; and matrix size, 128 × 128). The total data acquisition time was 3 min, 12 s for each image set. The tumor volume was calculated by drawing the region of interest on the contrast-enhanced tumor regions using Varian built-in browser software.
Irradiation and carbogen protocols
The choice of a 9.3-Gy dose was determined by a calculation using the linear quadratic formula for cell survival that calculates the standard equivalent dose for planning hypofractionated stereotactic radiotherapy (17, 18). The dose of 9.3 Gy × four fractions approximates the biologic effect of a standard dose fractionation plan for 9L and C6 gliomas. The tumors (left hemisphere) were irradiated using a Varian Linear Accelerator (Clinac 2100C) with a dose rate of 400 monitor units/min (6 MeV electron beam, 6 cm × 6 cm applicator).
First, the preirradiation tissue pO2 (baseline) was measured for 25 min, and the rats were then transferred to the radiation facility on a mobile cart equipped with an anesthesia unit and 30% oxygen cylinders. The rats were placed on the accelerator couch, with the head positioned at a 100-cm source-to-surface distance according to the guidelines. The beam was focused with a lead shield to irradiate (9.3 Gy) a semicircle 19 mm in diameter on the left hemisphere with tumor while sparing the normal contralateral brain (irradiated group). The rats of the control group were treated similarly but did not receive any radiation. The tissue pO2 was monitored for 5 consecutive days after irradiation using high-spatial resolution multisite EPR oximetry.
To determine the dynamics of the intracerebral tumor and contralateral brain pO2 during carbogen breathing, the rats were prepared as described and the tissue pO2 was measured in the rats breathing 30% oxygen for 25 min (baseline pO2). The inhaled oxygen was then replaced with carbogen (5% carbon dioxide and 95% oxygen), and the pO2 measurements were continued for 60 min. A 2-min time gap was present between switching from 30% oxygen to carbogen, and the experiments were repeated for 5 consecutive days.
Statistical analysis
The paired t test was used to avoid animal heterogeneity in comparing the tissue pO2 between the groups. The chi-square test was applied for the multiple point comparisons, and linear regression was used to estimate the slope of the pO2 changes over time. The quadratic exponential function, in conjunction with the mixed effect approach, was used to model the changes in individual tissue pO2 measurements after radiation. Exponential quadratic functions are useful for modeling nonmonotonic dynamics with positive values. We have successfully used this mathematical model previously (16, 19, 20). Furthermore, the quadratic exponential function has enabled us to compute the maximal pO2 and the point at which it reaches the maximum, very useful parameters of oxygenation in response to treatment. Combined with the random effect model, this statistical technique allowed us to assess the individual response to the treatment (21, 22). This technique also eliminated the effects of intra-animal heterogeneity of the baseline pO2 values. All statistical calculations were performed using the statistical package S-Plus (Insightful, Seattle, WA). All data are expressed as the mean ± standard error, with n the number of rats in each group.
RESULTS
Effect of 9.3 Gy on intracerebral tumor pO2
The baseline tissue pO2 of the intracerebral 9L tumors and contralateral brain of the control group was 30.7 ± 4 and 40.2 ± 3 mm Hg, respectively (Fig. 1). No significant change in the tissue pO2 of the 9L tumor or contralateral brain was observed in the control group during repeated measurements up to Day 4. However, a significant decrease in the tissue pO2 was observed on Day 5 (Fig. 1).
Fig. 1.

Changes in tissue partial pressure of oxygen (pO2) of intracerebral 9L tumor (white triangles) and contralateral brain (white circles) of control and 9.3 Gy irradiated groups (black triangles, intracerebral 9L; black circles, contralateral brain). Tissue pO2 measured repeatedly for 6 consecutive days. Controls, n = 8; irradiated group, n = 16. *p <.05, baseline pO2.
The baseline (Day 0) tissue pO2 of the 9L tumor and contralateral brain was 32.4 ± 1.9 and 43.8 ± 3.4 mm Hg, respectively, in the irradiated group. The tissue pO2 of the 9L tumors was significantly less than the contralateral brain pO2 in both the control and the irradiated groups. No significant difference in the baseline tissue pO2 of the 9L tumors and contralateral brain was observed between the controls and irradiated groups. However, in the irradiated group, a single dose of 9.3 Gy resulted in a significant increase in the 9L tumor pO2 on Days 1 and 2 (Fig. 1).
The tissue pO2 of the 9L tumors had decreased significantly on day 5 compared with the baseline pO2. A quadratic exponential model was used to investigate the dynamics of the tissue pO2 changes in the individual tumors of the irradiated group (Fig. 2). The results indicated a modest variation in the baseline tissue pO2 between the individual tumors. Also, the magnitude of the tissue pO2 changes after 9.3 Gy radiation was different in each tumor. Furthermore, the reoxygenation occurred at different points for each tumor. The mean intracerebral 9L tumor volume of the control and irradiated groups as assessed by MRI on Day 1 was 65 ± 19 and 61 ± 8 mm3, respectively. No significant difference in tumor volume was observed between the groups.
Fig. 2.

Individual dynamics of intracerebral 9L tumor partial pressure of oxygen (pO2) after 9.3 Gy radiation. Data modeled using quadratic exponential function (22). Black circles, time at which maximal increase in tumor pO2 observed after irradiation (n = 16).
The results obtained with the intracerebral C6 gliomas were quite different from those obtained with the intracerebral 9L gliomas (Fig. 3). The baseline contralateral brain pO2 was 43.4 ± 3 and 45.6 ± 4 mm Hg in the control and irradiated groups, respectively. The tissue pO2 of the C6 gliomas was significantly less than that of the 9L tumors, with a baseline tumor pO2 of 13.6 ± 2 and 12.4 ± 1 mm Hg in the control and irradiated groups, respectively (p <.05). Also, the tissue pO2 of the C6 tumors was significantly lower than the corresponding contralateral brain pO2. No significant difference in the baseline C6 tumor or contralateral brain pO2 was observed between the controls and irradiated groups. The C6 tumor pO2 of the control group decreased significantly during the 5 days of oximetry measurements. However, 9.3 Gy irradiation of the C6 tumor did not result in any significant change in the tissue pO2 (Fig. 3). In addition, thetissue pO2 of the contralateral brain in both the control and the irradiated groups did not vary significantly during the 5 days of repeated measurements. The tumor volume of the C6 gliomas in the control and irradiated groups as assessed by MRI on Day 1 was 82 ± 9 and 71 ± 15 mm3, respectively, and were not significantly different.
Fig. 3.
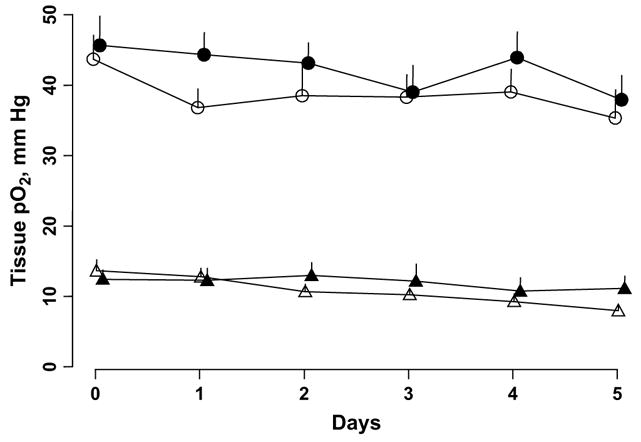
Changes in tissue partial pressure of oxygen (pO2) of intracerebral C6 tumor (white triangles) and contralateral brain (white circles) of control (nonirradiated) and 9.3-Gy irradiated groups (black triangles, intracerebral C6; black circles, contralateral brain). Tissue pO2 measured repeatedly for 6 consecutive days. Control group, n = 17; irradiated group, n = 11.
Tissue pO2 response to carbogen breathing
The changes in tissue pO2 of 9L gliomas and contralateral brain before and during carbogen inhalation are summarized in Fig. 4. The mean 9L tumor volume on Day 0 was 96 ± 16 mm3. No significant difference in the average 9L and contralateral brain pO2 during 30% oxygen breathing was observed on Day 1 and Days 3–5. The tissue pO2 of the 9L tumors and contralateral brain increased significantly during carbogen breathing; however, the extent of oxygenation varied during the 5 days of repeated experiments. A similar increase in the average tissue pO2 of the 9L tumors and contralateral brain during carbogen breathing was observed on Days 1–4; however, this was significantly different on Day 5. The average increase in tissue pO2 during 30% oxygen and carbogen breathing is shown in Fig. 5. The response of 9L tumors and contralateral brain to carbogen declined gradually during the 5 days of experiments, with a minimal increase on Day 5. The slope represents the overall rate of decrease of tissue pO2 over time. The slope indicates that the tissue pO2 declined by 6.9 mm Hg during 60 min of carbogen inhalation in the 9L tumors and by 4.9 mm Hg in the contralateral brain over time. The tissue pO2 of the 9L tumors in rats breathing 30% oxygen decreased by 1.6 mm Hg, and it decreased by 1.8 mm Hg in the contralateral brain. These decreases in tissue pO2 were statistically significant. This was likely due to compromised tumor vasculature and intracranial pressure with an increase in tumor size.
Fig. 4.

Dynamics of tissue partial pressure of oxygen (pO2) of intracerebral 9L glioma (black circles) and contralateral brain (CLB, white circles) during 30% oxygen (baseline) and carbogen breathing (n = 10). p Values at top indicate statistical significance between average intracerebral tumor and contralateral brain tissue pO2 during 30% oxygen and carbogen breathing. p Values at bottom indicate statistical significance between averaged tissue pO2 observed during 30% oxygen and pO2 observed during carbogen breathing for contralateral brain and intracerebral tumors.
Fig. 5.

(A) Change in average intracerebral 9L tumor and (B) contralateral brain pO2 during 30% oxygen (black circles) and carbogen (black triangles) breathing for 5 consecutive days. Average tissue pO2 observed during 25 min of 30% oxygen and 60 min of carbogen breathing shown (n = 10). Dashed line indicates slope of changes in tissue pO2 over time.
Similar experiments were done to determine the effect of carbogen breathing in rats with C6 tumors (114 ± 10 mm3; Fig. 6). The average tissue pO2 of the C6 tumors and contralateral brain during baseline (30%) were significantly different on all 5 days of the experiments. Similar results were obtained when the average C6 and contralateral brain pO2 measurements were compared during carbogen breathing at different points. Furthermore, the average increases in tissue pO2 of both C6 tumors and contralateral brain during carbogen breathing were also significantly greater than the baseline pO2 on all 5 days of the experiments (Fig. 7). No significant decrease in baseline pO2 of both C6 gliomas and contralateral brain was observed during 5 days of experiments. In addition, the magnitude of increase in tissue pO2 of C6 gliomas and contralateral brain during carbogen breathing were similar on all 5 days of measurements.
Fig. 6.

Dynamics of tissue partial pressure of oxygen (pO2) of intracerebral C6 tumor (black circles) and contralateral brain (white circles) during 30% oxygen and carbogen breathing (n = 8). All p values obtained from comparison between averaged intracerebral tumor and contralateral brain pO2 during baseline (30% oxygen) and carbogen breathing and when baseline pO2 of each, compared with average increase in pO2 during carbogen breathing, was <.05.
Fig. 7.

Average tissue partial pressure of oxygen (pO2) of (A) intracerebral C6 tumor and (B) contralateral brain during 30% oxygen (black circles) and carbogen breathing (black triangles; n = 8). No statistically significant slope (dashed lines) was detected, indicating no significant decrease in baseline pO2 of C6 tumor and contralateral brain or in response to carbogen breathing over time.
DISCUSSION
This is the first report of repeated tissue pO2 measurements of orthotopic 9L and C6 gliomas after a single radiation dose of 9.3 Gy and during carbogen breathing. The results have shown that the orthotopic 9L gliomas are well oxygenated, with a tissue pO2 of approximately 30–32 mm Hg. The tissue pO2 of subcutaneously grown 9L tumors has been reported to be <10 mm Hg. Cerniglia et al. (23) reported a pO2 of <8 mm Hg in subcutaneously grown 9L tumors in rats using a phosphorescence quenching method. A median pO2 of 2 mm Hg was reported by Teicher et al. (24, 25) using Eppendorf in subcutaneously grown 100-mm3 9L tumors in rats. The tumor volumes of these experiments were similar to those of the orthotopic tumors in the present study. Experiments performed in our laboratory also indicated fairly hypoxic subcutaneous 9L tumors, with a pO2 of 4 ± 1 mm Hg (n = 6). Wallen et al. (26) suggested a difference in vasculature between intracerebral and subcutaneous 9L tumors as a likely reason for the absence of hypoxia in intracerebral 9L tumors. Our results provide evidence of the possible influence of such vascular differences on the tumor pO2. The tissue pO2 of intracerebral 9L gliomas reported in the present study agrees with reports of a small radiobiologic hypoxic fraction (0–3%) in 9L gliomas (24). These results indicate that the pO2 of the 9L tumors is site specific, and, therefore, care must be exercised in evaluating strategies whose outcome is dependent on the oxygen levels in tumors such as that of radiotherapy.
A single dose of 9.3 Gy resulted in significant oxygenation of intracerebral 9L tumors on Days 1 and 2 after irradiation. The magnitude and time of the oxygenation of individual 9L gliomas varied, highlighting the importance of pO2 measurement in individual tumors for the purpose of therapeutic optimization. No such increase in tissue pO2 of 9L tumors in the control group was observed. In contrast, the intracerebral C6 gliomas were relatively hypoxic, with a tissue pO2 of approximately 12–14 mm Hg. Guerin et al. (27) have reported a significantly lower vascular density of C6 gliomas compared with 9L tumors. The vascular density of these tumors was also significantly lower than that of the normal brain. On the basis of that report, we speculate that the differences in the tumor pO2 of 9L and C6 gliomas are likely due to differences in their vasculature. In addition to the tumor vasculature, the tumor growth characteristics and oxygen metabolism of these tumors might play an important role.
Furthermore, C6 tumors irradiated with 9.3 Gy did not show any significant changes in tumor pO2 after irradiation. A similar tissue pO2 in the contralateral brain in the control and irradiated groups with either 9L or C6 gliomas confirmed that our procedure for hemisphere irradiation did not influence the contralateral brain of the rats. A significant decrease in the tissue pO2 of the tumors over time was likely a result of the compromised tumor vasculature with an increase in tumor volume. In addition, an increase in intracranial pressure has been reported with increases in the tumor volume of intracerebral tumors (28). We anticipate that this might have resulted in a significant decrease in the contralateral brain pO2 on Day 5 in our experiments. The doubling time of intracerebral 9L and C6 tumors is reported to be 67 and 23 h, respectively (29, 30). In view of these findings, we suggest that perhaps the hypoxic and rapidly proliferating orthotopic gliomas might not show increased oxygenation after irradiation.
Our results indicated a significant increase in intracerebral tumor and contralateral brain pO2 during 60 min of carbogen breathing in both the 9L and the C6 groups. The baseline tissue pO2 of the contralateral brain of the 9L and C6 groups and their response to carbogen breathing was similar on the 5 days of experiments. However, a decrease in the baseline 9L tumor pO2 and its response to carbogen breathing was observed, with an increase in tumor size during the 5 days of measurements. In contrast, the baseline tissue pO2 of the C6 gliomas and the response to carbogen breathing was similar on all 5 days of the experiments. The use of carbogen as a potential radiosensitizer has been investigated in animal and human tumors with mixed results. In some studies, carbogen resulted in an increase in tumor blood flow and oxygenation, but in other experiments, it did not. It has been suggested that the effect of carbogen to increase tumor oxygenation depends on several factors such as tissue type and breathing time (8). Our results agree with these observations and indicate that the tumor response to carbogen breathing is likely to vary among different tumor types. These results further highlight the need to monitor the tumor pO2 during such strategies to determine its effect in individual tumors and tumor types. This information could then be potentially used to individualize radiotherapy for enhanced efficacy.
The clinical implications of these results are several, although their value needs to be tested under clinically pertinent conditions. The overall message is that the effects of treatments on tumor pO2 can be profound but cannot be readily predicted. Therefore, although it seems logical to use approaches to enhance tumor pO2 to enhance therapy, this should be done on the basis of explicit knowledge of the effects of the treatment on the pO2 of that particular tumor type. Even better, it would be desirable to make the measurements in the particular patient under the conditions being used, rather than to rely on the expected results. Inasmuch as methods such as in vivo EPR oximetry are being developed that can monitor the tumor pO2 directly in patients, these should be used. This should be especially useful in clinical trials of new methods, so that the evaluation of the effectiveness of the new approach can be done with knowledge of the effectiveness of the approach in modifying the tumor pO2 in preclinical studies.
CONCLUSION
In the present study, we have provided repeated measurements of tissue pO2 of orthotopic 9L and C6 gliomas and the contralateral brain using high-spatial resolution multisite EPR oximetry. The 9L and C6 gliomas have significantly different tumor pO2 and a different response to a single dose of 9.3 Gy. Both tumor models showed significant increases in oxygenation during carbogen breathing; however, the magnitude of oxygenation varied over time. Animal models are powerful tools to investigate various aspects of tumor biology; however, these models should be carefully chosen to test the various therapeutic strategies. Different tumor types are likely to have different tissue pO2, levels, and the oxygen level in tumors during treatment will largely affect the therapeutic outcome. Therefore, noninvasive methods such as in vivo EPR oximetry are likely to play a crucial role in the optimization of radiotherapy and/or chemotherapy.
Acknowledgments
Supported by the National Cancer Institute (Grant CA120919) and National Institutes of Health (Grant PO1EB2180).
The authors thank Harriet St. Laurent and Kerry A. Tillson, Radiation Oncology Department, Dartmouth-Hitchcock Medical Center for assistance in the use of the radiation facility; we also thank Risto A. Kauppinen, Director of the Biomedical NMR Research Center, Dartmouth Medical School for MRI.
Footnotes
Conflict of interest: none.
References
- 1.Stieber VW, Mehta MP. Advances in radiation therapy for brain tumors. Neurol Clin. 2007;25:1005–1033. doi: 10.1016/j.ncl.2007.07.005. [DOI] [PubMed] [Google Scholar]
- 2.Tatum JL, Kelloff GJ, Gillies RJ, et al. Hypoxia: Importance in tumor biology, noninvasive measurement by imaging, and value of its measurement in the management of cancer therapy. Int J Radiat Biol. 2006;82:699–757. doi: 10.1080/09553000601002324. [DOI] [PubMed] [Google Scholar]
- 3.Vaupel P. Hypoxia and aggressive tumor phenotype: Implications for therapy and prognosis. Oncologist. 2008;13(Suppl 3):21–26. doi: 10.1634/theoncologist.13-S3-21. [DOI] [PubMed] [Google Scholar]
- 4.Hall EJ. Radiobiology for the radiologist. 5. Philadelphia: Lippincott Williams & Wilkins; 2000. p. 588. [Google Scholar]
- 5.Jensen RL. Hypoxia in the tumorigenesis of gliomas and as a potential target for therapeutic measures. Neurosurg Focus. 2006;20:E24. doi: 10.3171/foc.2006.20.4.16. [DOI] [PubMed] [Google Scholar]
- 6.Kaanders JH, Bussink J, van der Kogel AJ. ARCON: A novel biology-based approach in radiotherapy. Lancet Oncol. 2002;3:728–737. doi: 10.1016/s1470-2045(02)00929-4. [DOI] [PubMed] [Google Scholar]
- 7.Lanzen JL, Braun RD, Ong AL, et al. Variability in blood flow and pO2 in tumors in response to carbogen breathing. Int J Radiat Oncol Biol Phys. 1998;42:855–859. doi: 10.1016/s0360-3016(98)00312-5. [DOI] [PubMed] [Google Scholar]
- 8.Dunn TJ, Braun RD, Rhemus WE, et al. The effects of hyperoxic and hypercarbic gases on tumor blood flow. Br J Cancer. 1999;80:117–126. doi: 10.1038/sj.bjc.6690330. [DOI] [PMC free article] [PubMed] [Google Scholar]
- 9.Khan N, Williams BB, Hou H, et al. Repetitive tissue pO2 measurements by electron paramagnetic resonance oximetry: Current status and future potential for experimental and clinical studies. Antioxid Redox Signal. 2007;9:1169–1182. doi: 10.1089/ars.2007.1635. [DOI] [PMC free article] [PubMed] [Google Scholar]
- 10.Williams BB, Hou H, Grinberg OY, et al. High spatial resolution multisite EPR oximetry of transient focal cerebral ischemia in the rat. Antioxid Redox Signal. 2007;9:1691–1698. doi: 10.1089/ars.2007.1723. [DOI] [PubMed] [Google Scholar]
- 11.Barth RF. Rat brain tumor models in experimental neuro-oncology: The 9L, C6, T9, F98, RG2 (D74), RT-2 and CNS-1 gliomas. J Neurooncol. 1998;36:91–102. doi: 10.1023/a:1005805203044. [DOI] [PubMed] [Google Scholar]
- 12.Dai C, Holland EC. Glioma models. Biochim Biophys Acta. 2001;1551:M19–M27. doi: 10.1016/s0304-419x(01)00027-0. [DOI] [PubMed] [Google Scholar]
- 13.Swartz HM, Clarkson RB. The measurement of oxygen in vivo using EPR techniques. Phys Med Biol. 1998;43:1957–1975. doi: 10.1088/0031-9155/43/7/017. [DOI] [PubMed] [Google Scholar]
- 14.Liu KJ, Bacic G, Hoopes PJ, et al. Assessment of cerebral pO2 by EPR oximetry in rodents: Effects of anesthesia, ischemia, and breathing gas. Brain Res. 1995;685:91–98. doi: 10.1016/0006-8993(95)00413-k. [DOI] [PubMed] [Google Scholar]
- 15.Rolett EL, Azzawi A, Liu KJ, et al. Critical oxygen tension in rat brain: A combined (31)P-NMR and EPR oximetry study. Am J Physiol Regul Integr Comp Physiol. 2000;279:R9–R16. doi: 10.1152/ajpregu.2000.279.1.R9. [DOI] [PubMed] [Google Scholar]
- 16.Hou H, Khan N, O’Hara JA, et al. Increased oxygenation of intracranial tumors by efaproxyn (efaproxiral), an allosteric hemoglobin modifier: In vivo EPR oximetry study. Int J Radiat Oncol Biol Phys. 2005;61:1503–1509. doi: 10.1016/j.ijrobp.2004.12.077. [DOI] [PubMed] [Google Scholar]
- 17.Denekamp J, Waites T, Fowler JF. Predicting realistic RBE values for clinically relevant radiotherapy schedules. Int J Radiat Biol. 1997;71:681–694. doi: 10.1080/095530097143699. [DOI] [PubMed] [Google Scholar]
- 18.Fowler JF. Modelling altered fractionation schedules. BJR Suppl. 1992;24:187–192. [PubMed] [Google Scholar]
- 19.Hou H, Grinberg OY, Grinberg SA, et al. Cerebral tissue oxygenation in reversible focal ischemia in rats: Multi-site EPR oximetry measurements. Physiol Meas. 2005;26:131–141. doi: 10.1088/0967-3334/26/1/012. [DOI] [PubMed] [Google Scholar]
- 20.O’Hara JA, Hou H, Demidenko E, et al. Simultaneous measurement of rat brain cortex PtO2 using EPR oximetry and a fluorescence fiber-optic sensor during normoxia and hyperoxia. Physiol Meas. 2005;26:203–213. doi: 10.1088/0967-3334/26/3/006. [DOI] [PubMed] [Google Scholar]
- 21.Demidenko E. Mixed models: Theory and applications. Vol. 734. New York: John Wiley & Sons; 2004. [Google Scholar]
- 22.Demidenko E. The assessment of tumor response to treatment. Appl Stat. 2006;A55:365–377. [Google Scholar]
- 23.Cerniglia GJ, Wilson DF, Pawlowski M, et al. Intravascular oxygen distribution in subcutaneous 9L tumors and radiation sensitivity. J Appl Physiol. 1997;82:1939–1945. doi: 10.1152/jappl.1997.82.6.1939. [DOI] [PubMed] [Google Scholar]
- 24.Teicher BA, Herman TS, Rose CM. Effect of Fluosol-DA on the response of intracranial 9L tumors to X rays and BCNU. Int J Radiat Oncol Biol Phys. 1988;15:1187–1192. doi: 10.1016/0360-3016(88)90202-7. [DOI] [PubMed] [Google Scholar]
- 25.Teicher BA, Holden SA, Ara G, et al. Influence of an anti-angiogenic treatment on 9L gliosarcoma: Oxygenation and response to cytotoxic therapy. Int J Cancer. 1995;61:732–737. doi: 10.1002/ijc.2910610523. [DOI] [PubMed] [Google Scholar]
- 26.Wallen CA, Michaelson SM, Wheeler KT. Evidence for an unconventional radiosensitivity of rat 9L subcutaneous tumors. Radiat Res. 1980;84:529–541. [PubMed] [Google Scholar]
- 27.Guerin C, Laterra J, Drewes LR, et al. Vascular expression of glucose transporter in experimental brain neoplasms. Am J Pathol. 1992;140:417–425. [PMC free article] [PubMed] [Google Scholar]
- 28.Beppu T, Kamada K, Yoshida Y, et al. Change of oxygen pressure in glioblastoma tissue under various conditions. J Neurooncol. 2002;58:47–52. doi: 10.1023/a:1015832726054. [DOI] [PubMed] [Google Scholar]
- 29.Ross BD, Zhao YJ, Neal ER, et al. Contributions of cell kill and posttreatment tumor growth rates to the repopulation of intracerebral 9L tumors after chemotherapy: An MRI study. Proc Natl Acad Sci USA. 1998;95:7012–7017. doi: 10.1073/pnas.95.12.7012. [DOI] [PMC free article] [PubMed] [Google Scholar]
- 30.Vogelbaum MA, Tong JX, Higashikubo R, et al. Transfection of C6 glioma cells with the bax gene and increased sensitivity to treatment with cytosine arabinoside. Neurosurg Focus. 1997;3 doi: 10.3171/foc.1997.3.5.6. Article 3. [DOI] [PubMed] [Google Scholar]