Abstract
To understand the extent of immune dysregulation in primary HIV infection (PHI) and the impact of antiretroviral therapy (ART) on restoring these abnormalities, we longitudinally evaluated 52 subjects {Acute Treated (AT); Early Treated (ET); Early Untreated (EU)) for markers of activation, proliferation, and function on T cells. ET and AT patients differed by 0.54 log viral load (VL) at baseline but did not differ thereafter by more than 0.34 log10 VL. AT subjects had higher CD8+ T cell counts and expression of markers indicative of CD8+ T cell activation (CD38), and proliferation (Ki67), at baseline, than ET subjects but were not different post-48 weeks of ART. Although acute PHI is marked by higher level of immune activation than early PHI, virologic and immunologic responses were similar post-ART, suggesting that the extent of immunologic recovery is not negatively impacted by a delay of treatment beyond the acute stage of disease.
Keywords: Primary HIV infection, Early HIV, Acute HIV, Immune reconstitution, Immunophenotyping
Background
Primary HIV infection (PHI) refers to a series of events occurring within the first three months of an individual's initial exposure to HIV. These events are marked by rapid virologic and immunologic alterations. Specifically, within days to up to three weeks of initial exposure, there is a burst in viremia that can reach levels exceeding one million copies/ml [1]. This high magnitude of viral titer accelerates the dissemination and seeding of HIV to various tissue compartment, most significantly in gut-associated mucosal tissue [2-4]. Tissue dissemination of HIV is accompanied by direct HIV-mediated cytopathic effects on CD4+ memory T cells, leading to their loss, as was evident in acute Simian Immunodeficiency Virus (SIV) infection [5]. Coinciding with this viral burst are also HIV-specific immunologic responses, such as HIV-specific CD4+ and CD8+ T cell responses that are associated with viral control and may dictate the viral set point [1, 6, 7]. This viral set point is correlated with the rate of disease progression [8] but host factors that contribute to controlling the viral set point are still not clear but most probably involve components of both the innate and adaptive immune system [7, 9-12].
Significant immunologic dysregulation is documented in primary HIV infection that persists and/or worsens in chronic HIV infection. Most notably, acute decreases in CD4+ T lymphocyte number, diminished or absent T-helper cell and CTL responses to HIV and other antigens, and immune activation as measured by increased expression of HLA-DR+CD38+ T cells [6, 13-20]. It is unclear if antiretroviral therapy (ART) intervention during primary HIV infection may reverse some of these abnormalities [18].
To understand the extent of immune dysregulation and to evaluate the impact of ART on immune reconstitution in primary HIV infection, we evaluated a large breath of immunophenotypic markers indicative of cellular activation, proliferation, and function within CD4+ and CD8+ T cell subsets over time in subjects who initiated ART vs no treatment in acute or early primary HIV infection.
Materials and Methods
Study design and definitions
Patients were enrolled into a phase II open-label, pilot study of the safety and efficacy of ART vs. no treatment in patients with primary HIV infection. The patients elected to start or not start ART. Patients received the following oral treatment regimen: ddI-EC* 400 mg QD + d4T 40 mg BID + BMS-232632 600 mg QD. For subjects weighing < 60 kg, the dose of ddI-EC was 250 mg QD and the dose of d4T was 30 mg BID. Patients in acute primary HIV disease were those having detectable plasma HIV-1 RNA ≥ 2000 copies/ml by reverse transcriptase polymerase chain reaction (RT-PCR) within 14 days before study entry and one of the following inclusion criteria: 1) A negative ELISA within 14 days of study entry; 2) Positive ELISA but negative or indeterminate Western blot (≤ 2 bands) within 14 days of study entry; or 3) Positive ELISA and Western blot within 14 days of study entry but with documented negative ELISA or plasma HIV-1 RT-PCR (< 2000 copies/mL) within 30 days prior to study entry. Patients in early primary HIV infection were those having a positive ELISA and Western blot (> 2 bands) within 14 days of study entry but with documented negative ELISA or plasma HIV-1 RT-PCR (< 2000 copies/mL) within days 31 to 90 prior to study entry or positive ELISA and Western Blot within 14 days of study entry but with a non-reactive 3A11-LS ELISA documented within 14 days of study entry (as performed either at the center for disease control (CDC, Atlanta, GA) or by a CDC-certified laboratory. The study was approved by the respective institutional review boards.
Viral load and T cell measurements
Plasma HIV RNA was measured using the Amplicor HIV-1 Monitor test or the Roche Ultrasensitive assay (Roche Diagnostics Corporation, Indianapolis, IN). Absolute CD4 and CD8 T cell counts were determined by standard flow-cytometric techniques.
Immunofluorescence staining and flow cytometric analysis
Whole blood was immunostained with antibodies conjugated to flourochromes, including an isotype control. Activated cells were defined as HLA-DR+CD38+, naive T cells were defined as CD45RA+CD62L+ and memory T cells defined as CD45RA-CD62L- or CD45RA-CD45RO+. Ki67 expression was measured by intracellular immunostaining, as described by the manufacturer (Caltag Laboratories). QuantiBRITE Beads (BD) were used to measure the number of CD38, CXCR4, and CCR5 molecules on T cells using fresh blood.
Statistical analysis
All analyses assumed a two-sided test of hypothesis with an overall significance level of 0.05. Analyses are considered hypothesis generating and no corrections were made for multiple comparisons. Longitudinal outcomes were modeled using the mixed procedure in SAS (SAS Institute, Inc., Cary NC). A random intercept was included in all models and a random slope was considered based on a likelihood ratio test. Under the full model, a likelihood ratio test was used to determine the covariance structure (unstructured or variance components). Plasma HIV-1 RNA concentrations were modeled as smooth functions of time using natural cubic b-splines [21] and Akaike's Information Criterion (AIC) to determine the final model [22]. Absolute CD8+ T cell count was analyzed using a log10 transform and then back-transformed for interpretability.
Results
Baseline and demographic characteristics of the participants
Fifty-five patients were enrolled in this study. Twelve were in acute primary HIV infection who went on to be on ART, these patients are denoted as acute-treated (AT), 25 were in early primary HIV disease and went on ART, these patients are denoted as Early Treated (ET), three were in acute primary HIV disease and not on ART, denoted as acute untreated (AU), and fifteen were in early primary HIV disease and not on ART, denoted as Early Untreated (EU). Because of the low number of AU (n=3) patients, they were excluded from the analysis. Baseline and demographic characteristics of the cohort is summarized in table 1. The median age of AT, ET, and EU patients was in the mid-thirties, with the age ranging from 20-59 years. The majority of AT, ET, and EU patients were white (>70%), not reporting ever using injection drug use (>85%), and acquiring HIV through sex with men (>90%). In order to control for differences across groups (ET, AT and EU), all outcomes were adjusted for baseline Log10 HIV RNA, CD4+ T cell count, and age. For all groups, results from these adjusted models are plotted assuming the average baseline values for Log10 HIV RNA at 4.51 (HIV RNA ≈ 32,000), baseline CD4+ T cell count at 629 cells/mm3, and baseline age at 32.6 years.
Table 1.
Baseline and Demographic Characteristics of Cohort
| Characteristic | Acute On Study Drug AT |
Early On Study Drug ET |
Early Not On Study Drug EU |
|---|---|---|---|
| Patients Registered | 12 | 25 | 15 |
| Absolute CD4+ T Cells* | 478 (283, 834) |
605 (174, 1111) |
826 (479, 1194) |
| Absolute CD8+ T Cells* | 1220 (634, 5377) |
833 (294, 1868) |
875 (417, 1955) |
| Viral Load * copies/mL |
= 146500 (= 15866, = 2230000) |
= 59756 (= 744, =1080000) |
= 4280 (= 226, = 133000) |
| Reported Mode of Transmission as MSM** | 92% | 92% | 93% |
| Reported IV Drug Use History as Never ** | 100% | 100% | 87% |
| Male** | 100% | 100% | 93% |
| Age* | 34.5 (21, 47) |
31 (20, 59) |
32 (19, 38) |
| White** | 92% | 76% | 73% |
Median (range)
Percent based on patients registered
AT= Acute Treated; ET= Early Treated; EU= Early Untreated
Comparison of viral load and absolute CD4+ and CD8+ T cell counts between acute- and early- treated patients
To evaluate potential benefits to ART in acute rather than early primary HIV disease, we examined longitudinal alterations in viral load, CD4+, and CD8+ T cell counts at baseline and in response to 48 weeks of ART in patients that were in acute vs. early primary HIV disease. The CD4+ and CD8+ models were adjusted for baseline viral load and age. CD8+ T cell count was also adjusted for baseline CD4+ T cell count. As seen in Fig. 1, although estimated viral load at baseline was higher in AT patients by 0.54 logs in comparison to ET patients (p=0.04), the difference through 48 weeks of ART between the two groups did not exceed 0.34 logs. Viral dynamics through week 48 were different between AT and ET subjects (p=0.02) (Fig. 1). The estimated log 10 viral load at baseline was lower for EU than any ET or AT (3.58 vs. 4.69 and 5.23, respectively; p<0.001). EU subjects demonstrated a gradual increase in log10 viral load of 0.13 (p=0.05) for every 100 days on study.
Figure 1.
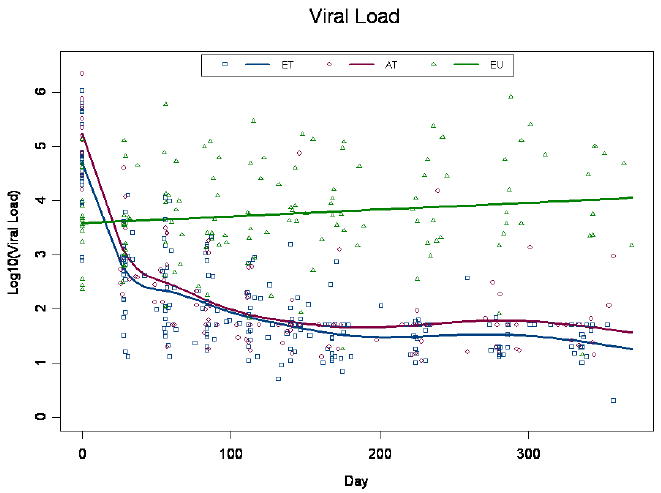
Plasma viral load measurements. Plasma viral load was measured at baseline and through week 48 post-ART. Patients were self-selected into Early Treated (ET), Acute Treated (AT), or Early untreated (EU) groups.
Baseline CD4+ T cell counts were not statistically different between the 3 groups (p=0.24) (Fig.2a). At baseline the adjusted ET and AT CD4+ T cell count was 606 cells/mm3 and 569 cells/mm3, respectively. By week 4, we estimate an initial rise of 105 cells/mm3 (p<0.001) above baseline in the treated groups. Subsequently, CD4+ T cell count increased through week 48 to 801 cells/mm3 (p=0.04) and 826 cells/mm3 (p=0.007) for the ET and AT subjects, respectively. The ET and AT population curves intersect around day 200, although the rate of change was not significantly different, nor were the week 48 estimates (p≥0.07) (Fig 2a). The estimated CD4+ T cell count at baseline, for the EU group was 739 cells/mm3 after which they demonstrated a decline of 46.5 cells/mm3 per 100 days (p=0.003) resulting in a week 48 estimate of 583 cells/mm3. The adjusted baseline absolute CD8+ T cell count was significantly higher among the AT, 1349 cells/mm3 than ET 871 cells/mm3 group (p=0.003; Fig.2b). By week 4, there was an initial decrease of 501 and 2031 cells/mm3 in the ET and AT groups, respectively (p<0.001). After week 4, there was no change in absolute CD8+ cells over time (p=0.74) and the response to ART was similar with estimates of 655 and 667 for the ET and AT groups, respectively. Absolute CD8+ T cells were constant over time in the EU group with an estimate of 912 (Fig.2b). These data indicate the absolute CD4+ and CD8+ T cell counts are not clinically different between the AT and ET subjects at week 48.
Figure 2.
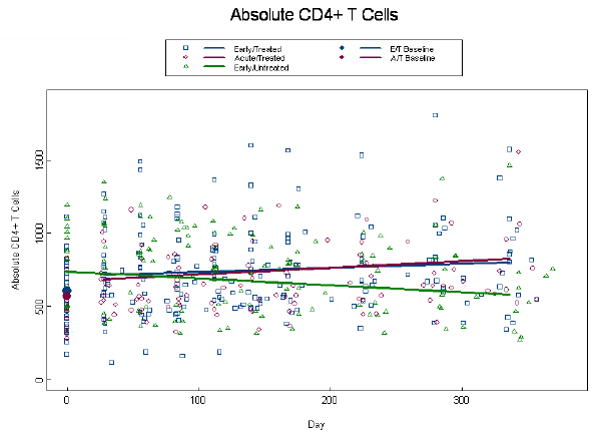
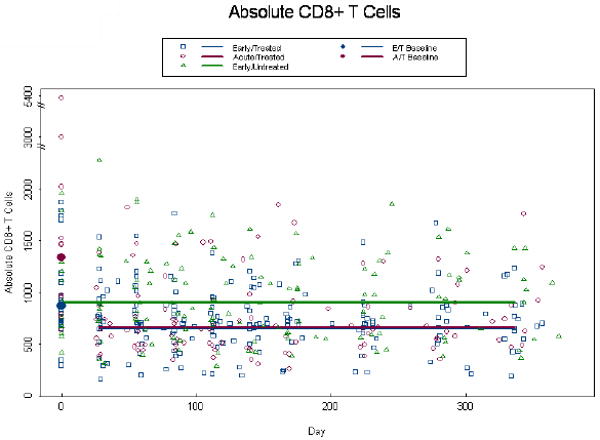
Alterations in absolute CD4+ and CD8+ T cell counts. Absolute CD4+ T cell counts (a), and absolute CD8+ T cell counts (b) were measured at baseline and through week 48 post-ART. Patients were self-selected into Early Treated (ET), Acute Treated (AT), or Early Untreated (EU) groups. Dots at baseline denote changes in expression occurring within the first 4 weeks post-ART. ET and AT CD8+ T cell counts were significantly different at baseline (p=0.003). The analyses were adjusted for baseline viral load, CD4+ T cell count (CD8+ only), and age, with similar findings to the unadjusted model.
Evaluating the extent of Ki67 expression in the CD4+ and CD8+ T cell compartments between acute- and early-treated patients
Given that Ki67 is an indicator of cell cycle entry and that it was recently linked to HIV gag -specificity [23], we evaluated its expression in CD8+ and CD4+ memory and naïve T cells. A log10 transformation was required to normalize Ki67+ expression data and, due to the presence of zeros, 0.5 was added to all values. Percent expression of CD8+Ki67+ memory T cells at baseline was higher among AT than ET patients (p=0.001) (Fig. 3a). By week 4, among treated subjects we estimate an initial drop of 0.56 (p<0.001) logs below baseline. At week 48 percent CD8+Ki67+memory T cells had declined to 0.38 and 0.55 for the AT and ET groups (p=0.16), respectively, and consequently we observe a more rapid decline in CD8+Ki67+ memory T cells among the AT than ET group per 100 days (0.20 vs. 0.07, p=0.003) (Fig. 3a). This same trend was observed in the percent expression of CD8+Ki67+ naïve T cells. Percent expression of CD8+Ki67+ naive T cells at baseline was higher among AT than ET patients (1.03 vs. 0.72, p<0.001) (Fig.3b) and by week 4, among treated subjects we estimate an initial drop of 0.34 logs below baseline (p<0.001). At week 48 percent CD8+Ki67+naive T cells had declined to 0.11 and 0.26 for the AT and ET groups (p=0.24), and consequently we observe a more rapid decline in the AT than ET group per 100 days (0.17 vs. 0.04, p=0.006) (Fig. 3b). Percent expression of CD4+Ki67+ memory cells tended to be higher in the AT than ET group at baseline with estimates of 1.09 and 0.88, respectively (p=0.06); although this difference was highly significant in the unadjusted model (p=0.006). By week 4, among treated subjects in the adjusted model we estimate an initial drop of 0.16 logs below baseline (p<0.001) l and at week 48 log10 percent expression of CD4+Ki67+memory T cells was significantly lower in the AT than the ET group (0.33, vs. 0.54; p=0.04) (Fig. 3c). There were no statistically significant differences between ET and AT groups in the percent expression of CD4+Ki67+naïve T cells in both the unadjusted and adjusted model (p≥0.21; data not shown). Expression of the co-stimulatory molecule, CD28 on CD4+ T cells remained stable over time on study for all groups (p=0.96) with estimates of 90%, 96%, and 86% for the ET, AT and EU groups, respectively with the EU and AT groups being significantly different (p=0.01; data not shown). There were also no statistically significant differences in absolute naïve and memory CD4 or CD8+ T cells, percent CD4+ or CD8+ HLA-DR+CD38+ T cells, or percent expression of CD4+ or CD8+ CD28+ T cells, nor in serum IL-7 levels among the AT and ET groups (data not shown).
Figure 3.
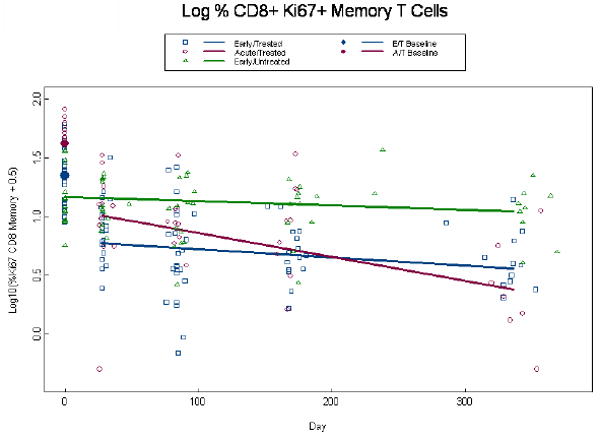
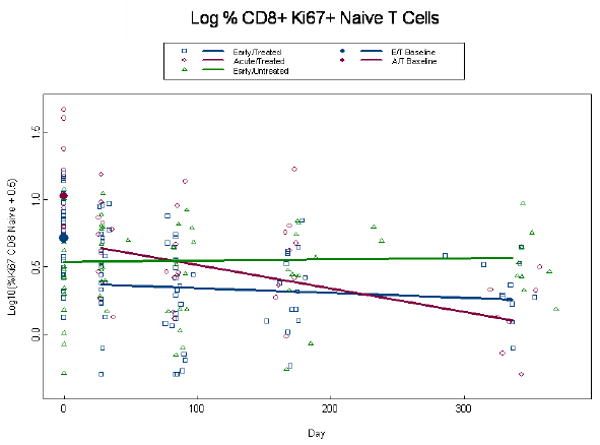
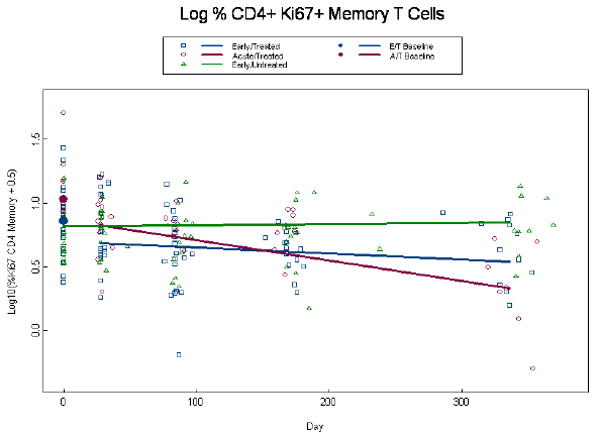
Alterations in expression of Ki67 in CD4+ memory and CD8+ memory and naïve T cells. Log percent expression of CD8+Ki67+ memory T cells (a), log percent CD8+ Ki67+ naïve T cells (b), and log percent CD4+ Ki67+ memory T cells (c) were measured by immunostaining and flow cytometry at baseline and through week 48 post-ART. Dots at baseline denote changes in expression occurring within the first 4 weeks post-ART. ET and AT subjects are significantly different at baseline for both the CD8+Ki67+ memory and naïve T cells (p≤0.001). The analyses are adjusted for baseline viral load, CD4+ T cell count, and age, with similar findings in a and b. In (c) Log percent CD4+Ki67+ memory T cells the ET (0.88 percent log) and AT (1.09 percent log) were significantly different in the unadjusted analysis (p=0.008), but failed to achieve significance in the adjusted analysis (p=0.06). The AT was significantly different from ET at week 49 (p=0.04).
Density of CD38 expression on CD8+ T cells and CCR5 and CXCR4 on CD4+ T cells
Because CD38 expression is correlated with disease progression [24-29], we evaluated the density of its expression on CD8+ T cells from acute and early primary HIV infected patients, using QuantiBRITE bead analysis. At baseline, the density of percent CD38 expression on CD8+ T cells was higher among AT than ET patients (p<0.001) and both AT and ET were higher than EU patients (p<0.05; Fig.4). By week 4, there was an initial decrease of 0.30 and 0.63 log10 CD38 molecules on CD8+ T cells in the ET and AT groups, respectively (p<0.001; Fig.4). The response to ART in CD38 molecules on CD8+ T cells was similar at week 48 between the AT and ET (p=0.77), but remained elevated among EU above both treated groups (p<0.001; Fig.4).
Figure 4.

Density of CD38 expression on CD8+ T cells. Number of CD38 molecules on CD8+ T cells was measured by QuantiBRITE beads analysis at baseline and through week 48 in the three patient groups. Dots at baseline denote changes in expression occurring within the first 4 weeks post-ART. The AT and ET groups were significantly different at baseline (p=0.001). The analysis is adjusted for baseline viral load, CD4+ T cell count, and age, with similar findings to the unadjusted model.
Given that chemokine co-receptor expression is critical for HIV infection, we also evaluated the density of CCR5 and CXCR4 expression on CD4+ T cells in acute and early primary HIV disease. At baseline the density of CCR5 was not different for the ET and AT groups (p=0.81) and the EU group demonstrated an elevated density above both the ET (p=0.004) and AT (p=0.02) groups (Fig. 5a). CCR5 densities remained relatively constant through week 48 in the AT and ET groups and increased in the EU group , such that differences with the treated groups became more significant (p<0.001). Interestingly, the unadjusted model demonstrated no difference between the 3 groups at baseline (p=0.49) of CCR5 molecules on CD4+ T cells for the ET, AT and EU groups, respectively; although differences between EU, ET, and AT groups were significant at week 48 (p<0.003; Fig. 5b). The baseline densities of percent CXCR4 expression on CD4+ T cells are not different at baseline with ET, AT and EU (p=0.49; data not shown). By week 4, among treated subjects we estimate an initial drop of 0.07 logs (p=0.04) of CXCR4 molecules on CD4+ T cells below baseline bringing them closer to the EU group values. As there were no additional changes over time (p=0.31), ET, AT and EU estimates remained non-significant (p=0.94; data not shown).
Figure 5.
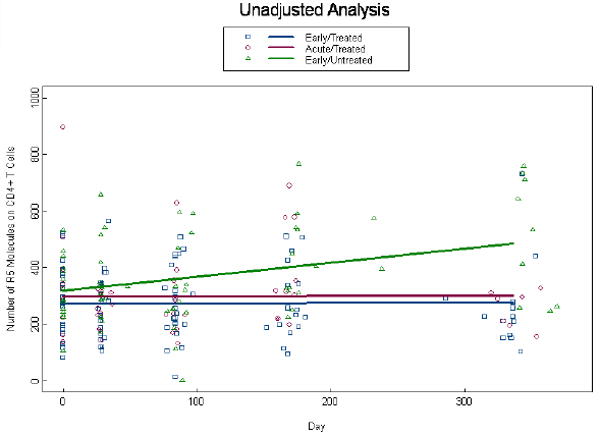
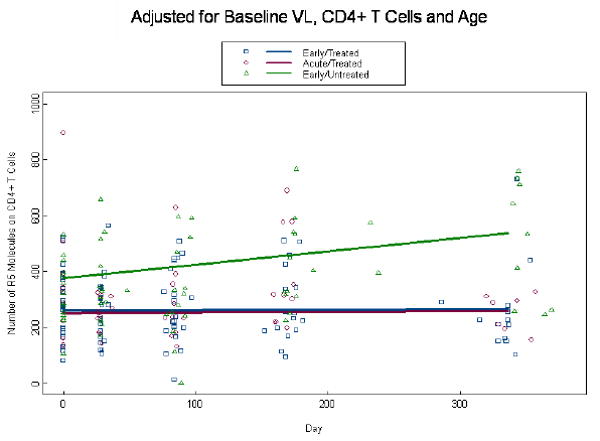
Expression of CCR5 on CD4+ T cells: Number of CCR5 molecules on CD4+ T cells were measured by QuantiBRITE beads analysis at baseline and through week 48 in the three patient groups. Unadjusted analysis for CCR5 density on CD4+ T cells is shown in (a) and adjusted analysis for viral load, CD4+ T cell count, and age is shown in (b). Dots at baseline denote changes in expression occurring within the first 4 weeks post-ART.
Discussion
ART Intervention in primary HIV disease may protect HIV-specific T helper responses [30-32] but likewise treating patients in chronic HIV disease with CD4+ T cell count > 500 cells/mm3, also preserved CD4+ HIV-specific T-helper immune responses [33]. Hence, it is still not clear if there is an added benefit for treating acutely infected HIV+ patients[18]. We evaluated the dynamics of T cell immunophenotypic alterations in ART-treated and untreated patients with acute and early HIV Infection. We observed an elevation in viral load among acute treated patients in comparison to early treated patients, which did not exceed 0.3 logs post-ART. A few patients with viral load slightly higher than 100 copies/ml at week 48 may drive this small difference. It remains to be established if this small difference in viral load will have a biologically relevant impact over disease progression between the two groups. CD4+ T cell counts were neither different at baseline nor post- week 48 of ART between the two groups. Absolute CD8+ T cell counts, while higher in acutely infected patients, responded similarly to treatment. Based on these clinical outcomes, these data suggest that efforts to capture and treated patients pre-HIV sero-conversion may not add any substantial clinical benefits once they initiate ART. However, larger cohorts of blinded/randomized trials are warranted to carefully assess this question
Ki67 is widely used as a marker for cell turnover. In the context of HIV, this may not be the case. We previously shown that Ki67 immunostaining and tracking of actual cell division through Carboxyfluoresccin Diacctate Succinimidyl Ester (CSFE) dye do not correlate in HIV+ cells [34]. HIV infected CD4+ T cells stained strongly for Ki67 but there was no detectable cell division among cells productively infected by HIV [34]. This observation is consistent with a paucity of data implicating HIV Vpr in causing cell cycle arrest [35]. Therefore, Ki67 expression in the context of HIV may best represent activation/entry into the cell cycle rather than turnover. We demonstrate here that at baseline in acutely infected patients there is an increase in the percent of CD8+ Ki67+ memory or naïve T cells in comparison to patients in early HIV disease. But again the response to ART at week 48 was not statistically different between patients treated in acute or early primary HIV disease. The reported rapid decline in percent expression of CD4+Ki67+ memory or naïve T cells among the acute-treated patients may be an indication of their higher expression of this marker at baseline and therefore a faster drop post-ART intervention. Given that percent expression of CD4+Ki67+ memory T cells was higher at baseline in acute than early treated patients in the unadjusted model, which was lost after adjusting for age, viral load, and CD4+ T cell count, suggest that it is most probably the viral load that is driving the increase in the expression of Ki67 in CD4+ memory T cells, especially since the viral load was slightly higher (no more than 0.5 log at baseline) in acute than early treated patients. Ki67 up-regulation is observed in acute SIV infection, where within approximately 10 days of SIV inoculation, CD4+Ki67+ T cells are up-regulated and home to lymphoid tissues [36]. Ki67 up-regulation is also observed during acute cytomegalovirus and Epstein Barr virus infections and these Ki67+ T cell subsets are antigen-specific [37, 38].
CCR5 expression is critical for M-tropic HIV entry into susceptible cells, it is up-regulated in response to T cell activation [39], and is up-regulated on CD4+ antigen-specific T cells [40, 41]. Given that we observed elevated expression of CCR5 on CD4+ T cells of early untreated patients, who had a lower viral load that allowed them to opt out of ART intervention, suggest that this CD4+ T cell population with elevated CCR5 expression may be antigen-specific and driving the lower/ contained viral load of these patients. Understanding the factors that lead to a lower viral set point among the acute untreated and acute or early treated patients will be critical in devising therapeutic and/or vaccine strategies for HIV.
CD8+ T cell responses are well correlated with containment of wide spread HIV replication in primary HIV infection and with establishing the viral set point, which determines the rate of disease progression [42] [43] [11]. Most of the immunophenotyping changes that were higher in acute than early treated HIV+ patients were within the CD8+ T cell compartment, suggesting that alterations in acute primary HIV infection may be more prevalent within the CD8+ than CD4+ T cell compartment. As no difference was observed in the two treated groups, immune damage may have occurred before therapy, as early as two weeks post- infection. This may be inferred from SIV infection, where CD4 CCR5 memory cells in gastrointestinal tract are destroyed within the first week of infection Based on CD4+ T cell count and viral load changes post-ART between acute- and early-treated HIV+ patients suggest that delaying treatment beyond the acute stage of HIV disease to early sero-conversion may not negatively impact these two clinical outcomes. However, benefits in intricate immunologic changes can be observed with initiating treatment in acute primary HIV disease, the significance of these alterations to long-term clinical outcome still needs to be investigated. Finally, given the issue of self-selection, evaluation of these immunophenotypic changes which may reflect differences in immune responses pre-and post-HIV sero-conversion needs to be assessed in a randomized trial.
Acknowledgments
We thank the participants of this study for their cooperation. We thank Candice Mulder, Betty Donoval, and Carolyn Gichinga for technical assistance. These studies were funded by the NIH and the Acute Infection and Early Disease Research Program (AIEDRP) (U01 AI41536 and P01 AI55356), with additional support from the University of Colorado Center for AIDS Research (AI 51550) and the University of Colorado General Clinical Research Center (CA 46934).
Footnotes
Publisher's Disclaimer: This is a PDF file of an unedited manuscript that has been accepted for publication. As a service to our customers we are providing this early version of the manuscript. The manuscript will undergo copyediting, typesetting, and review of the resulting proof before it is published in its final citable form. Please note that during the production process errors may be discovered which could affect the content, and all legal disclaimers that apply to the journal pertain.
Trial URL: http://www.clinicaltrials.gov/ct/show/NCT00007202?order=1'
Trial registration number: AIEDRP AI-03-005
ClinicalTrials.gov Identifier: NCT00007202
Literature Cited
- 1.Rosenberg ES, Billingsley JM, Caliendo AM, et al. Vigorous HIV-1-specific CD4+ T cell responses associated with control of viremia. Science. 1997;278:1447–50. doi: 10.1126/science.278.5342.1447. [DOI] [PubMed] [Google Scholar]
- 2.Veazey RS, DeMaria M, Chalifoux LV, et al. Gastrointestinal tract as a major site of CD4+ T cell depletion and viral replication in SIV infection. Science. 1998;280:427–31. doi: 10.1126/science.280.5362.427. [DOI] [PubMed] [Google Scholar]
- 3.Smit-McBride Z, Mattapallil JJ, McChesney M, Ferrick D, Dandekar S. Gastrointestinal T lymphocytes retain high potential for cytokine responses but have severe CD4(+) T-cell depletion at all stages of simian immunodeficiency virus infection compared to peripheral lymphocytes. J Virol. 1998;72:6646–56. doi: 10.1128/jvi.72.8.6646-6656.1998. [DOI] [PMC free article] [PubMed] [Google Scholar]
- 4.Mattapallil JJ, Smit-McBride Z, McChesney M, Dandekar S. Intestinal intraepithelial lymphocytes are primed for gamma interferon and MIP-1beta expression and display antiviral cytotoxic activity despite severe CD4(+) T-cell depletion in primary simian immunodeficiency virus infection. J Virol. 1998;72:6421–9. doi: 10.1128/jvi.72.8.6421-6429.1998. [DOI] [PMC free article] [PubMed] [Google Scholar]
- 5.Mattapallil JJ, Douek DC, Hill B, Nishimura Y, Martin M, Roederer M. Massive infection and loss of memory CD4+ T cells in multiple tissues during acute SIV infection. Nature. 2005;434:1093–7. doi: 10.1038/nature03501. [DOI] [PubMed] [Google Scholar]
- 6.Kahn JO, Walker BD. Acute human immunodeficiency virus type 1 infection. N Engl J Med. 1998;339:33–9. doi: 10.1056/NEJM199807023390107. [DOI] [PubMed] [Google Scholar]
- 7.Koup RA, Safrit JT, Cao Y, et al. Temporal association of cellular immune responses with the initial control of viremia in primary human immunodeficiency virus type 1 syndrome. J Virol. 1994;68:4650–5. doi: 10.1128/jvi.68.7.4650-4655.1994. [DOI] [PMC free article] [PubMed] [Google Scholar]
- 8.Mellors JW, Rinaldo CR, Jr, Gupta P, White RM, Todd JA, Kingsley LA. Prognosis in HIV-1 infection predicted by the quantity of virus in plasma. Science. 1996;272:1167–70. doi: 10.1126/science.272.5265.1167. [DOI] [PubMed] [Google Scholar]
- 9.Castelli J, Thomas EK, Gilliet M, Liu YJ, Levy JA. Mature dendritic cells can enhance CD8+ cell noncytotoxic anti-HIV responses: the role of IL-15. Blood. 2004;103:2699–704. doi: 10.1182/blood-2003-06-1913. [DOI] [PubMed] [Google Scholar]
- 10.Walker CM, Moody DJ, Stites DP, Levy JA. CD8+ lymphocytes can control HIV infection in vitro by suppressing virus replication. Science. 1986;234:1563–6. doi: 10.1126/science.2431484. [DOI] [PubMed] [Google Scholar]
- 11.Jin X, Bauer DE, Tuttleton SE, et al. Dramatic rise in plasma viremia after CD8(+) T cell depletion in simian immunodeficiency virus-infected macaques. J Exp Med. 1999;189:991–8. doi: 10.1084/jem.189.6.991. [DOI] [PMC free article] [PubMed] [Google Scholar]
- 12.Connick E, Marr DG, Zhang XQ, et al. HIV-specific cellular and humoral immune responses in primary HIV infection. AIDS Res Hum Retroviruses. 1996;12:1129–40. doi: 10.1089/aid.1996.12.1129. [DOI] [PubMed] [Google Scholar]
- 13.Klein MR, van Baalen CA, Holwerda AM, et al. Kinetics of Gag-specific cytotoxic T lymphocyte responses during the clinical course of HIV-1 infection: a longitudinal analysis of rapid progressors and long-term asymptomatics. J Exp Med. 1995;181:1365–72. doi: 10.1084/jem.181.4.1365. [DOI] [PMC free article] [PubMed] [Google Scholar]
- 14.Pantaleo G, Demarest JF, Schacker T, et al. The qualitative nature of the primary immune response to HIV infection is a prognosticator of disease progression independent of the initial level of plasma viremia. Proc Natl Acad Sci U S A. 1997;94:254–8. doi: 10.1073/pnas.94.1.254. [DOI] [PMC free article] [PubMed] [Google Scholar]
- 15.Schacker TW, Hughes JP, Shea T, Coombs RW, Corey L. Biological and virologic characteristics of primary HIV infection. Ann Intern Med. 1998;128:613–20. doi: 10.7326/0003-4819-128-8-199804150-00001. [DOI] [PubMed] [Google Scholar]
- 16.Streeck H, Jessen H, Alter G, et al. Immunological and virological impact of highly active antiretroviral therapy initiated during acute HIV-1 infection. J Infect Dis. 2006;194:734–9. doi: 10.1086/503811. [DOI] [PubMed] [Google Scholar]
- 17.Kassutto S, Maghsoudi K, Johnston MN, et al. Longitudinal analysis of clinical markers following antiretroviral therapy initiated during acute or early HIV type 1 infection. Clin Infect Dis. 2006;42:1024–31. doi: 10.1086/500410. [DOI] [PubMed] [Google Scholar]
- 18.Smith DE, Walker BD, Cooper DA, Rosenberg ES, Kaldor JM. Is antiretroviral treatment of primary HIV infection clinically justified on the basis of current evidence? Aids. 2004;18:709–18. doi: 10.1097/00002030-200403260-00001. [DOI] [PubMed] [Google Scholar]
- 19.Yu XG, Addo MM, Rosenberg ES, et al. Consistent patterns in the development and immunodominance of human immunodeficiency virus type 1 (HIV-1)-specific CD8+ T-cell responses following acute HIV-1 infection. J Virol. 2002;76:8690–701. doi: 10.1128/JVI.76.17.8690-8701.2002. [DOI] [PMC free article] [PubMed] [Google Scholar]
- 20.Altfeld M, Rosenberg ES, Shankarappa R, et al. Cellular immune responses and viral diversity in individuals treated during acute and early HIV-1 infection. J Exp Med. 2001;193:169–80. doi: 10.1084/jem.193.2.169. [DOI] [PMC free article] [PubMed] [Google Scholar]
- 21.Liang H, Wu H, Carroll RJ. The relationship between virologic and immunologic responses in {AIDS} clinical research using mixed-effects varying-coefficient models with measurement error. 2003;4:297–312. doi: 10.1093/biostatistics/4.2.297. [DOI] [PubMed] [Google Scholar]
- 22.Littell RC, Milliken GA, Stroup WW, Wolfinger RD. SAS System for Mixed Models. SAS Institute Inc; 1996. pp. 101–102. [Google Scholar]
- 23.Zaunders JJ, Munier ML, Kaufmann DE, et al. Early proliferation of CCR5(+) CD38(+++) antigen-specific CD4(+) Th1 effector cells during primary HIV-1 infection. Blood. 2005;106:1660–7. doi: 10.1182/blood-2005-01-0206. [DOI] [PubMed] [Google Scholar]
- 24.Liu Z, Cumberland WG, Hultin LE, Prince HE, Detels R, Giorgi JV. Elevated CD38 antigen expression on CD8+ T cells is a stronger marker for the risk of chronic HIV disease progression to AIDS and death in the Multicenter AIDS Cohort Study than CD4+ cell count, soluble immune activation markers, or combinations of HLA-DR and CD38 expression. J Acquir Immune Defic Syndr Hum Retrovirol. 1997;16:83–92. doi: 10.1097/00042560-199710010-00003. [DOI] [PubMed] [Google Scholar]
- 25.Liu Z, Hultin LE, Cumberland WG, et al. Elevated relative fluorescence intensity of CD38 antigen expression on CD8+ T cells is a marker of poor prognosis in HIV infection: results of 6 years of follow-up. Cytometry. 1996;26:1–7. doi: 10.1002/(SICI)1097-0320(19960315)26:1<1::AID-CYTO1>3.0.CO;2-L. [DOI] [PubMed] [Google Scholar]
- 26.CD38 assay may be better predictor of progression. Marker shows how well immune system works. AIDS Alert. 1999;14:101–2. [PubMed] [Google Scholar]
- 27.Wilson CM, Ellenberg JH, Douglas SD, Moscicki AB, Holland CA. CD8+CD38+ T cells but not HIV type 1 RNA viral load predict CD4+ T cell loss in a predominantly minority female HIV+ adolescent population. AIDS Res Hum Retroviruses. 2004;20:263–9. doi: 10.1089/088922204322996482. [DOI] [PubMed] [Google Scholar]
- 28.Benito JM, Lopez M, Lozano S, Martinez P, Gonzalez-Lahoz J, Soriano V. CD38 expression on CD8 T lymphocytes as a marker of residual virus replication in chronically HIV-infected patients receiving antiretroviral therapy. AIDS Res Hum Retroviruses. 2004;20:227–33. doi: 10.1089/088922204773004950. [DOI] [PubMed] [Google Scholar]
- 29.Onlamoon N, Tabprasit S, Suwanagool S, Louisirirotchanakul S, Ansari AA, Pattanapanyasat K. Studies on the potential use of CD38 expression as a marker for the efficacy of anti-retroviral therapy in HIV-1-infected patients in Thailand. Virology. 2005;341:238–47. doi: 10.1016/j.virol.2005.07.018. [DOI] [PubMed] [Google Scholar]
- 30.Oxenius A, Price DA, Easterbrook PJ, et al. Early highly active antiretroviral therapy for acute HIV-1 infection preserves immune function of CD8+ and CD4+ T lymphocytes. Proc Natl Acad Sci U S A. 2000;97:3382–7. doi: 10.1073/pnas.97.7.3382. [DOI] [PMC free article] [PubMed] [Google Scholar]
- 31.Rosenberg ES, Altfeld M, Poon SH, et al. Immune control of HIV-1 after early treatment of acute infection. Nature. 2000;407:523–6. doi: 10.1038/35035103. [DOI] [PubMed] [Google Scholar]
- 32.Malhotra U, Berrey MM, Huang Y, et al. Effect of combination antiretroviral therapy on T-cell immunity in acute human immunodeficiency virus type 1 infection. J Infect Dis. 2000;181:121–31. doi: 10.1086/315202. [DOI] [PubMed] [Google Scholar]
- 33.Al-Harthi L, Siegel J, Spritzler J, Pottage J, Agnoli M, Landay A. Maximum suppression of HIV replication leads to the restoration of HIV-specific responses in early HIV disease. AIDS. 2000;14:761–70. doi: 10.1097/00002030-200005050-00001. [DOI] [PubMed] [Google Scholar]
- 34.Bahbouhi B, Landay A, Al-Harthi L. Dynamics of cytokine expression in HIV productively infected primary CD4+ T cells. Blood. 2004;103:4581–7. doi: 10.1182/blood-2003-12-4172. [DOI] [PubMed] [Google Scholar]
- 35.Ayyavoo V, Mahalingam S, Rafaeli Y, et al. HIV-1 viral protein R (Vpr) regulates viral replication and cellular proliferation in T cells and monocytoid cells in vitro. J Leukoc Biol. 1997;62:93–9. doi: 10.1002/jlb.62.1.93. [DOI] [PubMed] [Google Scholar]
- 36.Zhang ZQ, Wietgrefe SW, Li Q, et al. Roles of substrate availability and infection of resting and activated CD4+ T cells in transmission and acute simian immunodeficiency virus infection. Proc Natl Acad Sci U S A. 2004;101:5640–5. doi: 10.1073/pnas.0308425101. [DOI] [PMC free article] [PubMed] [Google Scholar]
- 37.Rentenaar RJ, Gamadia LE, van DerHoek N, et al. Development of virus-specific CD4(+) T cells during primary cytomegalovirus infection. J Clin Invest. 2000;105:541–8. doi: 10.1172/JCI8229. [DOI] [PMC free article] [PubMed] [Google Scholar]
- 38.Amyes E, Hatton C, Montamat-Sicotte D, et al. Characterization of the CD4+ T cell response to Epstein-Barr virus during primary and persistent infection. J Exp Med. 2003;198:903–11. doi: 10.1084/jem.20022058. [DOI] [PMC free article] [PubMed] [Google Scholar]
- 39.Bleul CC, Wu L, Hoxie JA, Springer TA, Mackay CR. The HIV coreceptors CXCR4 and CCR5 are differentially expressed and regulated on human T lymphocytes. Proc Natl Acad Sci U S A. 1997;94:1925–30. doi: 10.1073/pnas.94.5.1925. [DOI] [PMC free article] [PubMed] [Google Scholar]
- 40.Ebert LM, McColl SR. Up-regulation of CCR5 and CCR6 on distinct subpopulations of antigen-activated CD4+ T lymphocytes. J Immunol. 2002;168:65–72. doi: 10.4049/jimmunol.168.1.65. [DOI] [PubMed] [Google Scholar]
- 41.Maier R, Bartolome-Rodriguez MM, Moulon C, Weltzien HU, Meyerhans A. Kinetics of CXCR4 and CCR5 up-regulation and human immunodeficiency virus expansion after antigenic stimulation of primary CD4(+) T lymphocytes. Blood. 2000;96:1853–6. [PubMed] [Google Scholar]
- 42.Lichterfeld M, Kaufmann DE, Yu XG, et al. Loss of HIV-1-specific CD8+ T cell proliferation after acute HIV-1 infection and restoration by vaccine-induced HIV-1-specific CD4+ T cells. J Exp Med. 2004;200:701–12. doi: 10.1084/jem.20041270. [DOI] [PMC free article] [PubMed] [Google Scholar]
- 43.Schmitz JE, Kuroda MJ, Santra S, et al. Control of viremia in simian immunodeficiency virus infection by CD8+ lymphocytes. Science. 1999;283:857–60. doi: 10.1126/science.283.5403.857. [DOI] [PubMed] [Google Scholar]


