Abstract
The Notch ankyrin domain is a repeat protein whose folding has been characterized through equilibrium and kinetic measurements. In previous work, equilibrium folding free energies of truncated constructs were used to generate an experimentally determined folding energy landscape (Mello and Barrick, Proc Natl Acad Sci USA 2004;101:14102–14107). Here, this folding energy landscape is used to parameterize a kinetic model in which local transition probabilities between partly folded states are based on energy values from the landscape. The landscape-based model correctly predicts highly diverse experimentally determined folding kinetics of the Notch ankyrin domain and sequence variants. These predictions include monophasic folding and biphasic unfolding, curvature in the unfolding limb of the chevron plot, population of a transient unfolding intermediate, relative folding rates of 19 variants spanning three orders of magnitude, and a change in the folding pathway that results from C-terminal stabilization. These findings indicate that the folding pathway(s) of the Notch ankyrin domain are thermodynamically selected: the primary determinants of kinetic behavior can be simply deduced from the local stability of individual repeats.
Keywords: repeat protein, protein folding, energy landscape, folding kinetics
Introduction
In the last few decades, protein folding reactions have been treated with a range of models that differ greatly in complexity. In the simplest of models, the kinetic two-state approximation of the protein folding reaction, the protein folds from a denatured ensemble (D) to a native ensemble (N) in a single rate-limiting step. The two-state model is an invaluable tool in protein folding studies, and has provided significant insight into how both local and global properties of proteins influence their folding rates.1–3 However, as a result of its simplicity, the two-state model provides only a snapshot (often through inferences made by perturbing the transition state ensemble4; of the folding pathways that connect D to N,5,6 and does not address kinetic features such as transient intermediates and kinetic traps.7 Moreover, description of heterogeneity among partly folded states and folding via parallel pathways are both outside the confines of the two-state approximation.
At the other end of the complexity spectrum, energy landscapes8–10 represent folding using a detailed multidimensional reaction coordinate system in which multiple partly folded states are related by their respective energies (either as free or internal energies). By definition, such a coordinate system has the capacity to depict the details of folding pathways, competition among parallel routes and heterogeneity among ensembles of partly folded conformations.
Unfortunately, investigations of folding energy landscapes have been largely restricted to computational studies, because it is difficult to experimentally determine folding energy landscapes for globular proteins. This difficulty arises because partly folded structures of globular proteins are unstable; thus, these conformations are not significantly populated at equilibrium, and cannot be experimentally characterized. The instability of partly folded globular structures is likely to result, in part, from the abundance of stabilizing native-state contacts that are distant in primary sequence. The influence of distant contacts on folding free energy is demonstrated by truncation studies in which globular proteins of reduced length are highly destabilized.11,12
In contrast to globular proteins, repeat proteins have simple topologies in which contacts are local in primary sequence (contacts do not extend beyond adjacent repeats). Thus, partly folded states of repeat proteins are more likely to be stable and amenable to experimental characterization.13 Consistent with this prediction, repeat protein truncation results in only a modest decrease in folding free energy, rather than complete unfolding,14,15 an observation that may relate to potential functional roles of partly folded states of repeat proteins in the cell.16–18
The modest decrease in free energy associated with repeat protein truncation allows for the construction of stable variants in which single or multiple repeats are removed. Comparing folding free energies of repeat protein constructs with variable numbers of repeats can provide estimates for the intrinsic free energy of individual repeats and the interfacial free energy shared between neighboring repeats.14,15,19 These intrinsic and interfacial free energies can be used to determine the free energies of partly folded states, including those too high in energy to be observed directly. Previous studies of the Notch ankyrin domain (see Fig. 1) used this approach to generate a detailed experimentally determined folding free energy landscape14 [Fig. 2(A)]
Figure 1.
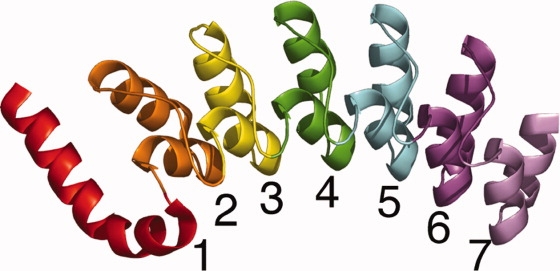
The Notch ankyrin domain. The Notch ankyrin domain is composed of seven ankyrin sequence repeats, six of which adopt the canonical ankyrin fold (repeats 2–7, as indicated; 1ot8.pdb).20 Repeats are colored from red to violet in the N- to C-terminal direction. This figure was made with PyMOL (www.pymol.org).
Figure 2.
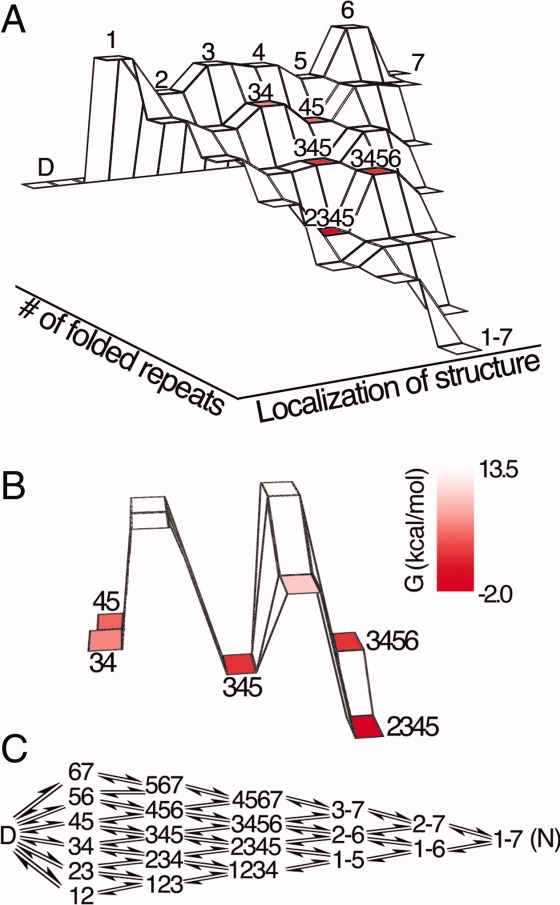
A landscape-based kinetic folding model for the Notch ankyrin domain. (A) Folding energy landscape of the Notch ankyrin domain,14 where the free energy of each state is represented by its height on the landscape. Each horizontal tier (extending from left to right) contains partly folded states with the same number of structured repeats. (B) The energy barriers accessible to the state with repeats 3, 4, and 5 folded (345), which include two potential folding transitions (to 2345 and 3456) and two unfolding transitions (to 34 and 45). Free energies in A and B are indicated by color saturation. (C) A mechanistic representation of the landscape-based kinetic model. Progress between the denatured state, D, and the native state (1–7) involves the sequential folding (and unfolding) of repeats. Arrows connect allowed kinetic steps. [Color figure can be viewed in the online issue, which is available at www.interscience.wiley.com.]
The most discriminating test for a folding energy landscape is whether it can predict diverse aspects of folding and unfolding kinetics. Here we use the intrinsic and interfacial energies from the free energy landscape of the Notch ankyrin domain to parameterize a kinetic model, and evaluate the degree to which the model can predict diverse folding and unfolding data. We find that the landscape-based kinetic model accurately predicts several experimental observations including (1) monophasic folding and biphasic unfolding, (2) curvature in the unfolding limb of the chevron plot, (3) the existence and population of a transient unfolding intermediate, (4) the relative folding rates of 19 variants spanning a range of three orders of magnitude, and (5) a change in the folding pathway that results from C-terminal stabilization. Since the landscape-based kinetic model is determined from the local distribution of equilibrium stability among individual repeats, this agreement suggests that the kinetic pathways for Notch ankyrin domain folding are determined by local thermodynamics, rather than native-state topology (which is invariant across the Notch ankyrin domain), non-native interactions, or on-pathway kinetic traps. Moreover, the landscape-based kinetic model predicts relative folding rates of variants better than predictions from overall folding free energies. This demonstrates that the pathway information inherent in the landscape, but absent from a single reaction coordinate, is necessary for accurate prediction of folding rates and mechanism.
Results
The experimentally determined folding energy landscape of the Notch ankyrin domain [Fig. 2(A)] depicts the free energies of partly folded states with varying numbers of paired (with the exception of the first row), folded repeats. The free energy of each state on the landscape was determined by combining the intrinsic free energies of folded repeats (these unfavorable values range from 5–8 kcal/mol) with the interfacial free energies that couple neighboring repeats (this favorable value, 9.1 kcal/mol, is shared for all repeat interfaces). This combination of unstable repeats interacting through stabilizing interfaces is consistent with a recent Ising analysis of consensus ankyrin repeats.19,21 Although the free energy landscape of the Notch ankyrin domain was determined from equilibrium unfolding measurements, several features of its shape may be relevant to the kinetics of folding. First, the landscape indicates high free energies for conformations that have only a few repeats folded, decreasing monotonically toward the native state, suggesting an early barrier in folding that makes a dominant contribution to folding kinetics. Second, the central repeats (2 through 5) have lower intrinsic free energies than the terminal repeats (1 and 6 in particular), suggesting a central folding pathway.22
A kinetic folding model based on the equilibrium free energy landscape
To test the ability of the equilibrium landscape to make predictions relating to folding kinetics, we construct a kinetic model on the same coordinate system, in which the two types of structuring steps involve the folding and interfacial pairing of whole repeats. Of the two types of steps, we view the folding of a single repeat as the simplest (smallest) step, since we expect that interface formation requires two adjacent repeats to be folded. In this view, the large and unfavorable intrinsic free energies associated with folding should contribute substantially to early kinetic folding barriers in which isolated repeats are folded. In contrast, interfacial stabilization should occur after this intrinsic folding barrier, once pairs of adjacent repeats are folded.
As a result of this kinetic partitioning of intrinsic folding from interfacial pairing, the barriers for initiation of folding from the denatured state and propagation from a partly folded state differ. In propagation reactions, a single (adjacent) repeat must be folded to add to a pre-existing stack of folded repeats. An example of the folding and unfolding energy barriers for propagation is shown in Figure 2(B) for the partly folded state with repeats 3, 4, and 5 folded (the 345 state), which can make transitions to the 34, 45, 2345, and 3456 states.* It is evident that a transition to the 2345 state is most probable, due to the relatively small cost of folding the 2nd repeat (intrinsic free energy of 5.5 kcal/mol) versus folding the 6th repeat (8.8 kcal/mol) or disrupting either the 3/4 or 4/5 interface (9.1 kcal/mol).
In contrast to the propagation reactions shown in Figure 2(B), initiation of folding (i.e., starting from the denatured state) is expected to require folding of two adjacent repeats prior to formation of the interface stabilizing them. As mentioned earlier, this treatment implies that the favorable interfacial free energy requires two neighboring repeats to be largely structured in order to achieve detailed interfacial packing. Accordingly, we represent the energy barriers corresponding to the initial step of folding as the folding (but not pairing) energies of two adjacent repeats. Thus, the energy barriers associated with the first step in folding are approximately twice as large as the energy barriers of the subsequent folding steps. This model for the kinetic barrier to folding of ankyrin repeat proteins differs from a recent kinetic model that approximated the transition state using a single undocked repeat.19 The extent to which a second repeat is structured in the transition state for folding depends on the extent to which interfacial stabilization can be realized between partly structured repeats.
Simulations of folding kinetics from the energy landscape
A schematic representation of the landscape-based kinetic model is shown in Figure 2(C). Simulations start in the denatured state, and progress via folding (or unfolding) steps involving all-or-none folding of whole repeats. Folding steps either require the mutual folding of two adjacent repeats (first step) or a single repeat adjacent to an already folded block of repeats (subsequent steps). As stated earlier, stabilizing interfacial energies are modeled as forming subsequent to crossing of folding barriers, and conversely as disrupting prior to crossing unfolding barriers. The energy barriers between partly folded states can be used to calculate transition probabilities associated with the sequential folding or unfolding of end repeats. Transition probabilities are determined by Boltzmann weighting the free energy barriers connecting accessible neighboring conformations. Progress through this kinetic scheme can be related to experimentally observed folding signals by tabulating the time dependence of either the number of folded repeats (a close approximation to the secondary structure monitored by circular dichroism spectroscopy) or the location of the folded repeats (which can be related to an estimated fluorescence signal, see Methods).
Simulated folding trajectories for individual molecules indicate the molecular events underlying unfolding, as well as their timing. For the wild-type Notch ankyrin domain (Nank1-7Δ23), these trajectories show a variable lag resulting from the initial two-repeat folding barrier, terminated by an abrupt folding transition from the denatured state (no repeats folded) to a rapidly equilibrating ensemble of largely folded states. In the resulting native ensemble, the fully folded state is dominant, but excursions to partly folded states are not infrequent [Fig. 3(A)]. Although the transition of individual molecules from the denatured to native ensembles appears abrupt, a narrower time band shows that partly folded states are transiently populated as a stepwise acquisition of repeats [and thus CD signal, Fig. 3(B), solid line]. In contrast, the fluorescence signal undergoes an abrupt jump even within a narrow time band [Fig. 3(B), red dashed line], because it monitors a more local acquisition of structure (see Methods).
Figure 3.
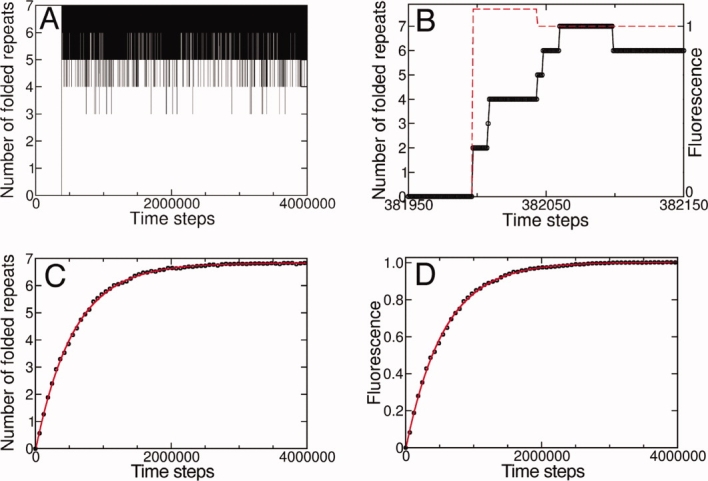
Landscape-based folding simulations of the Notch ankyrin domain. (A) A simulated folding trajectory of an individual molecule indicates an abrupt folding transition at time step ∼400,000. (B) A magnified view of the transition region indicates transiently populated states. The simulated fluorescence signal (red dashed line) undergoes an abrupt jump that is coincident with the first folding event (to the two repeat level). The average number of folded repeats (C) and simulated fluorescence (D) averaged from 1000 folding trajectories are well-fitted by a single exponential (solid red line). The time steps are scaled (1:105) for clarity. [Color figure can be viewed in the online issue, which is available at www.interscience.wiley.com.]
Ensemble-averaged progress through the landscape-based kinetic scheme is characterized by plotting the average number of folded repeats and the estimated fluorescence signal [Fig. 3(C,D)] as a function of time. Both time dependencies are well-fitted by a single exponential process (solid red line). The rate constants associated with these folding curves are similar (kCD/kFL ≈ 0.998). These results are in agreement with stopped-flow circular dichroism and fluorescence studies of folding of the Notch ankyrin domain, which are both monophasic when corrected for proline isomerization (not modeled here), and yield the same rate constant.24,25
Simulations of unfolding kinetics from the free energy landscape
To investigate landscape-based unfolding kinetics, we applied a linear urea dependence26–28 to the free energies of partly folded states and to the free energies of folding barriers (see Methods). The linear urea dependence tilts the energy landscape toward the denatured state, as demonstrated in a cross section of the landscape (see Fig. 4). In the absence of urea [Fig. 4(A)], the landscape has a global free energy minimum at the native state (1–7), and the largest barrier corresponds to the initial folding of two adjacent repeats (as discussed above). At high urea concentration [Fig. 4(B)], the free energy minimum is the denatured state, and the energies of unfolding barriers are similar. In addition, the unfolding landscape has a shallow local free energy minimum at the 2345 state.
Figure 4.
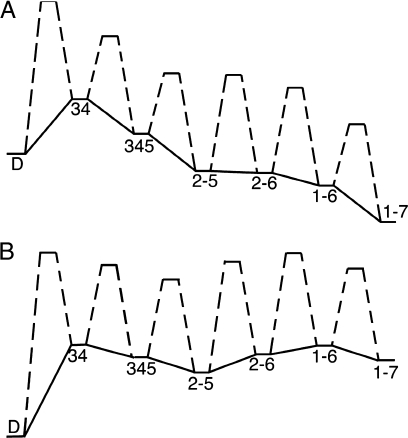
The folding energy landscape under native and denaturing conditions. (A) Cross-section of the folding energy landscape under native conditions, including barriers. Solid lines connect partly folded states, resembling a slice through Figure 2(A). Dashed lines connect these states with transition states. The energy landscape under native conditions has a global minimum at the fully folded state (1–7). The highest energy barrier in this cross-section for folding corresponds to the D→34 transition, which is followed by five significantly smaller energy barriers. In contrast, the energy landscape under denaturing conditions (5M urea, B) has the six unfolding barriers of comparable energy. Although the global energy minimum is the denatured state, D, the unfolding landscape also has a local energy minimum at the 2345 state.
Unfolding trajectories of individual molecules generated by the landscape-based model are more complex than folding trajectories. In contrast to the lag phase and abrupt jump to the native ensemble observed in folding trajectories [Fig. 3(A)], unfolding trajectories [Fig. 5(A)] exhibit an immediate jump to a partly folded level where numerous folding and unfolding events occur before reaching the denatured state. This partly folded state has four repeats folded, and is populated for a relatively long time (with occasional excursions to states with three- or five-folded repeats). This persistent intermediate level of structure is dominated by the 2345 state [the local energy minimum in Fig. 4(B)]. Because the fluorescence of the 2345 state remains native-like, this partly folded state is not detected by fluorescence trajectories [Fig. 5(B)], although local unfolding excursions produce a flickering of the fluorescence signal (averaged out in bulk) prior to the completion of unfolding.
Figure 5.
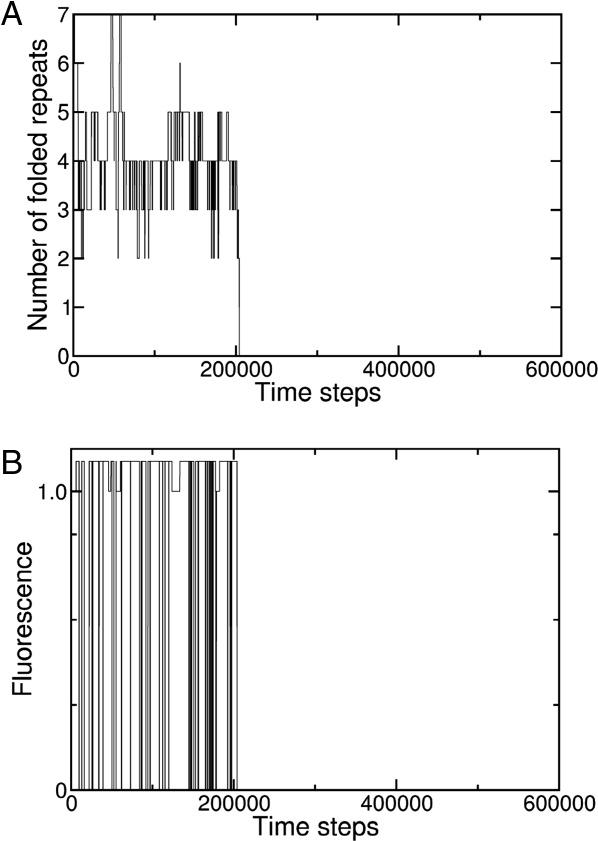
Simulated trajectories of unfolding of individual Notch ankyrin domain molecules. An unfolding trajectory generated from the landscape-based model at 5M urea; progress is represented by the number of folded repeats (A) and by fluorescence (B). Although the time variation in the number of folded repeats is complex, a state with four folded repeats is preferentially populated, consistent with the relatively low free energy of the 2345 state. The time steps are scaled as in Figure 3.
The high population of the on-pathway 2345 state should give rise to biphasic unfolding kinetics, which when monitored by fluorescence will appear as an initial lag before a major loss of signal. Indeed, ensemble-averaged simulations of fluorescence-monitored unfolding show biphasic behavior [Fig. 6(A)] that agrees with experimental unfolding of the Notch ankyrin domain measured by stopped-flow fluorescence22,25 [Fig. 6(B)]. Further, Φ-value studies have demonstrated that biphasic unfolding results from the buildup of an intermediate with structure in the central repeats22 in agreement with the preferential population of the 2345 state from the landscape-based simulations.
Figure 6.
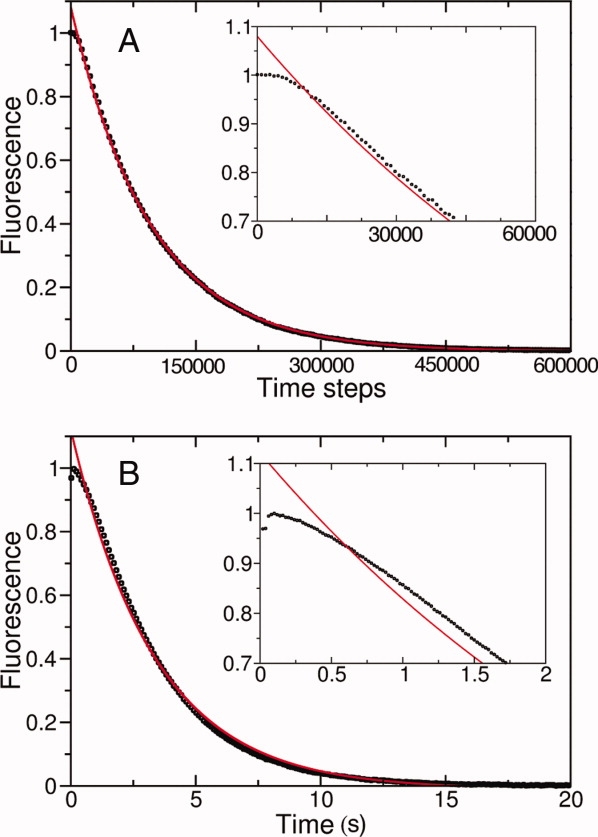
Landscape-based unfolding of the Notch ankyrin domain reproduces an experimentally observed minor unfolding phase. (A) The landscape-based unfolding curve generated at 5M urea exhibits a biphasic fluorescence decay. (B) Stopped-flow fluorescence measurements also indicate biphasic unfolding of the Notch ankyrin domain in 5M urea.22 Both curves have a fluorescence signal plateau at early folding times (insets) that are poorly fitted by a single exponential (red line), but are well-fitted by a double exponential (not shown). The time steps are scaled as in Figure 3.
Chevron plots
As a result of the transient population of the on-pathway unfolding intermediate, the major unfolding phase of the Notch ankyrin domain has a nonlinear logarithmic dependence on urea concentration25 [see chevron plot, Fig. 7(A)]. The landscape-derived chevron plot also exhibits curvature in the unfolding limb [Fig. 7(B)], consistent with the preferential population of the 2345 state. However, chevron plot curvature can also be caused by movement of the transition state to a less compact structure with increasing denaturant concentration.29–32 The relative free energies of unfolding barriers clearly change with increasing urea concentration (see Fig. 4), suggesting that the unfolding limb curvature may also result from movement of the transition state.
Figure 7.
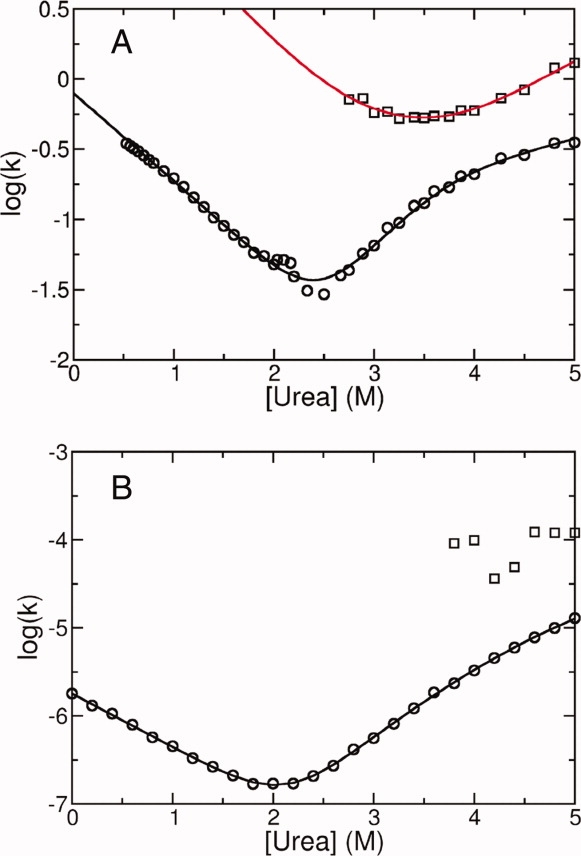
Landscape-based and experimentally determined chevron plots. (A) The experimentally determined chevron plot for the Notch ankyrin domain, with rate constants for two unfolding phases (major and minor phases as circles and squares, respectively). The unfolding limb defined by the major phase shows downward curvature. Solid lines represent the best fit of a three state model to the data.22 (B) The chevron plot simulated from the landscape also shows downward curvature in the unfolding limb. The solid line results from a fit with a log-linear folding rate constant and a log-quadratic unfolding rate constant, and is included as a visual guide.
To investigate this proposition, we generated an energy landscape with an even horizontal energy distribution (all repeats have an intrinsic free energy of 7.0 kcal/mol). In this control, we expect monophasic unfolding, as the 2345 state will no longer be at a local energy minimum. Indeed, simulated unfolding trajectories of individual molecules generated from this even energy landscape do not exhibit preferential population of a given state [Supporting Fig. 1(A)], and result in monophasic bulk unfolding transitions [Supporting Fig. 1(B)]. Despite the lack of an unfolding intermediate, the resulting chevron plot has unfolding limb curvature [Supporting Fig. 1(C)], albeit less than is observed from the wild-type energy landscape. These results suggest that the curvature in the unfolding limb of the chevron for the Notch ankyrin domain results both from the kinetic intermediate and from transition state movement.
Predicting relative folding rates of variants
One very informative method for identifying folding pathways is to examine the effects of single amino-acid substitutions on folding rates.4,33 To investigate the ability of the landscape-based kinetic model to reproduce changes in folding rates resulting from single- and multiresidue substitutions, we compared simulated and measured folding rates for 19 Notch ankyrin domain variants. Variant folding rates were simulated by perturbing intrinsic repeat free energies by experimentally determined ΔΔGH2Oo values associated with the substitutions (Table I). There is strong agreement between experimental and simulated folding rates [Fig. 8(A)]. The linear regression coefficient is 0.96, indicating that the landscape-based kinetic model has strong predictive power as to which substitutions will affect the folding rate and by how much.
Table I.
Thermodynamic and Kinetic Parameters for Notch Ankyrin Domain Variants
| Construct | kexp (s−1) | ksim (105) | ΔGH2Oo (kcal/mol) | ΔΔGH2Oo (kcal/mol) | Φexp | Φsim |
|---|---|---|---|---|---|---|
| Nank1-7*a | 0.67 | 0.19 | 7.5 | Ø | Ø | Ø |
| DG3* | 1.62 | 0.65 | 8.6 | 1.1 | 0.47 | 0.66 |
| LG7* | 0.77 | 0.21 | 8.9 | 1.4 | 0.06 | 0.05 |
| Nank1-7Δb | 0.79 | 0.17 | 6.9 | Ø | Ø | Ø |
| AG1Δb | 1.06 | 0.17 | 6.7 | −0.2 | 0 | 0 |
| AG2Δb | 0.54 | 0.098 | 3.2 | −3.7 | 0.06 | 0.09 |
| AG3Δb | 0.059 | 0.065 | 3.1 | −3.6 | 0.42 | 0.16 |
| AG4Δb | 0.113 | 0.070 | 4.6 | −2.3 | 0.49 | 0.23 |
| AG5Δb | 0.089 | 0.093 | 4.8 | −2.1 | 0.60 | 0.17 |
| AG6Δb | 0.72 | 0.17 | 4.5 | −2.4 | 0.02 | 0.00 |
| AG7Δb | 0.95 | 0.18 | 2.9 | −4.0 | −0.03 | 0.00 |
| 1-5C2c | 34.7 | 26.8 | 13.7 | Ø | Ø | Ø |
| 1-5C2 (AG1)c | 37.2 | 26.2 | 13.5 | −0.2 | 0 | 0 |
| 1-5C2 (AG2)c | 18.4 | 26.9 | 10.0 | −3.7 | 0.11 | 0.00 |
| 1-5C2 (AG3)c | 35.3 | 26.1 | 10.1 | −3.6 | 0.00 | 0.00 |
| 1-5C2 (AG4)c | 51.5 | 22.2 | 11.4 | −2.3 | −0.10 | 0.05 |
| 1-5C2 (AG5)c | 32.3 | 22.2 | 11.6 | −2.1 | 0.02 | 0.05 |
| 1-5C2 (AGC1)c | 1.9 | 2.1 | 12.1 | −1.6 | 1.05 | 0.92 |
| 1-5C2 (AGC2)c | 11.1 | 3.6 | 12.1 | −1.6 | 0.41 | 0.73 |
Data used to determine the free energies and folding rates associated with the stabilizing substitutions in repeats 3 and 7 (DG3* and LG7*) are in Supporting Figure 2. Values of ΔΔGH2Oo associated with variants of the *, Δ, and consensus-stabilized (C2) constructs are determined relative to their parent constructs: Nank1-7*, Nank1-7Δ, and 1-5C2, respectively. Φ values associated with AG1 substitutions cannot be determined accurately (due to the small ΔΔGH2Oo), and are taken to be zero, based on very similar refolding kinetics. See methods.
Figure 8.
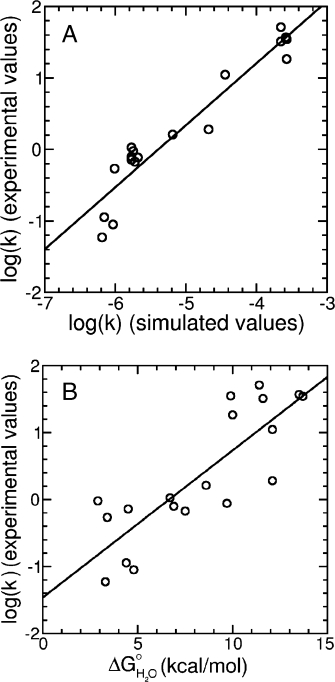
The landscape-based kinetic model accurately predicts relative folding rates of destabilized and stabilized variants. (A) Landscape-based folding rates of 19 variants show strong correlation with experimentally determined folding rates. The linear regression line has a correlation coefficient of 0.96 and a slope of 0.86. (B) In contrast, folding free energy (ΔGH2Oo) is not as well correlated with experimentally determined folding rates. The linear regression line has a correlation coefficient of 0.83.
For simple two-state folding reactions, free energies and rate constants are related to each other through the equation ΔGH2Oo = −RT ln(kf/ku), where kf and ku represent folding and unfolding rate constants. Thus, over the large range of ΔGH2Oo values in Figure 8, some correlation with ln(kf) and ΔGH2Oo is expected. To investigate whether the complexity provided by the energy landscape has improved predictive value over this simple two-state treatment, we compared the folding rate constants for the 19 variants to respective folding free energies [Fig. 8(B)]. Although there is a correlation, the correlation coefficient is 0.83, a substantial decrease from the correlation associated with landscape-based rate constants (0.96). This indicates that the complexity of the landscape-based model provides increased predictive power for folding rates.
Predicting folding pathways
The shape of the energy landscape [Fig. 2(A)] suggests folding pathway initiation through the central repeats (2 through 5). In agreement with this prediction, experimentally determined Φ values associated with the wild-type construct [Fig. 9(A), black histogram bars) are negligible in the terminal repeats (1, 6, and 7) and adopt intermediate values in repeats 2–5.22 In contrast, a stabilized construct (with the 6th and 7th repeats replaced by consensus-stabilized repeats35) has high Φ values at the C-terminal repeats (6 and 7) and negligible values elsewhere [Fig. 9(B), black histogram bars], indicating that folding has been rerouted through repeats 6 and 7.36 Landscape-based Φ values (Fig. 9, red histogram bars) have the same profile across the seven repeats as the experimentally determined Φ values, in both the wild-type and consensus-stabilized construct. Thus, the landscape-based kinetic model accurately predicts both the overall folding pathway and the experimentally observed change associated with C-terminal stabilization.
Figure 9.
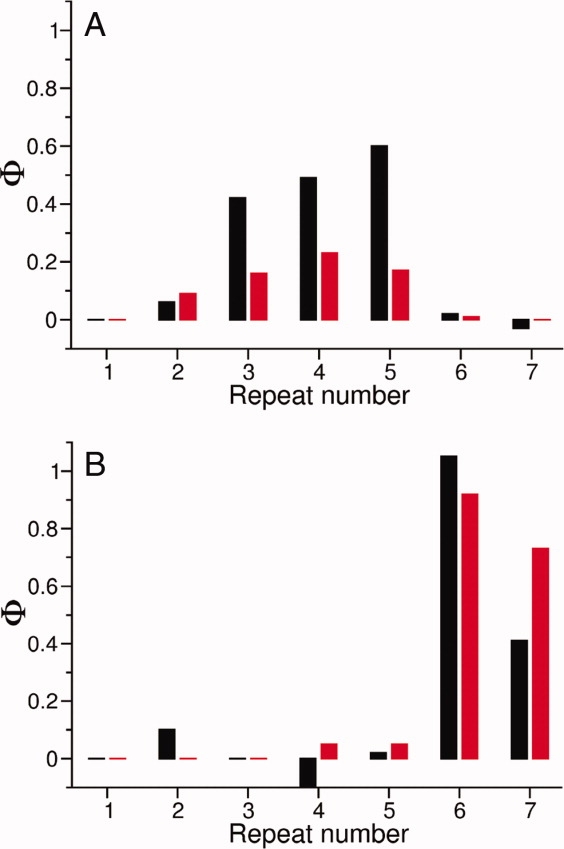
The landscape-based kinetic model predicts an experimentally observed change in folding pathway that results from C-terminal stabilization. (A) Experimentally determined Φ values (black histogram bars) associated with each repeat in Nank1-7Δ 22 and (B) the consensus-stabilized construct reflect the extent to which repeats become structured in the rate-limiting steps in folding. The C-terminal shift of high Φ values in the consensus-stabilized construct indicates a change in folding pathway. Landscape-based Φ values (red histogram bars) match the distribution and relative magnitude of the experimentally determined Φ values, indicating that the different folding pathways are reproduced in the simulations. [Color figure can be viewed in the online issue, which is available at www.interscience.wiley.com.]
Discussion
In this study, we have used an experimentally determined folding free energy landscape to generate a kinetic model for folding of the Notch ankyrin domain. This model accurately predicts monophasic folding and biphasic unfolding (Figs. 3 and 6), curvature in the unfolding limb of the chevron plot (see Fig. 7), population of an on-pathway unfolding intermediate in which the central repeats remain structured, the relative folding rates of 19 variants (see Fig. 8), and a change in the folding pathway that results from C-terminal stabilization (see Fig. 9). Since the landscape-based predictions are determined from the distribution of equilibrium energies of folded repeats, this agreement suggests that the mechanism, pathway, and rate of folding of the Notch ankyrin domain are determined by the local stability of individual repeats. Thus, knowledge of the local stability distributions in proteins should be essential (and in some cases sufficient) for predicting such kinetic features.
Despite the overall agreement between experimental and landscape-predicted kinetics, there is one feature of the unfolding data that is not reproduced by the model. Specifically, ala→gly substitution in repeats 2, 5, and 7 eliminates the minor unfolding phase,22 an observation that is captured by the landscape model for substitution in repeat 7 but not in repeats 2 or 5 (Supporting Fig. 3). In addition, the magnitude of the model-based Φ values deviate from the experimentally determined values (see Fig. 9). Thus, improvements can be made to model, possibly by an experimental determination of the variation in interfacial free energy between each repeat in the Notch ankyrin domain.
The landscape-based kinetic model is similar to the diffusion collision model (DCM) of protein folding,37 which has been used with some success to predict the folding rates of small globular proteins.38–41 In the DCM, both the stability of individual structural regions (microdomains) and the sequence distance between microdomains contribute to folding rate. Repeat proteins provide a simplification to the DCM because the interacting microdomains (treated here as individual repeats) are all separated by the same sequence distance along the polypeptide chain. Thus, the DCM for repeat proteins simplifies to a model in which the major determinant of folding rate is the local stability of individual repeats. Our results suggest that knowledge of the experimentally determined distribution of local stability in a globular protein, coupled with a DCM-like treatment of interacting segments, could be used to predict the detailed folding kinetics for nonrepeat proteins.
Similar to the DCM, in our landscape-based kinetic model, the major kinetic barrier for folding in our model comes from folding of adjacent unstable repeats, prior to realizing the mutually stabilizing interfacial energy. The high instability of the individual ankyrin repeats14,19 may result in the large discrepancy between the measured folding rate of the Notch ankyrin domain (∼0.3 s−1)25 and the fast predicted folding rate based on contact order (∼106 s−1).42
Predictions from the landscape-based model used here are sensitive to the relative free energies of individual repeats. This sensitivity suggests that simulations aiming to characterize folding rates and pathways would be greatly enhanced by accurate predictions of local stability.22,43 Thus, a challenge for future simulations, both for repeat proteins and globular proteins, will be to implement an energy potential that can recapitulate the experimentally observed distribution of folding free energy across different regions of proteins.
Methods
Protein expression and thermodynamic analysis
Variants of the Notch ankyrin domain are named by their type of substitution (AG indicates ala → gly substitution) and the repeat number of the substitution. Variants were constructed in the full length construct (designated by a *), in a construct that lacks the nine C-terminal residues (designated by a Δ23), and in a consensus-stabilized construct (designated by 1-5C235).
For the present studies, two novel stabilizing substitutions were introduced into the Notch ankyrin domain. Both substitutions are located at the 13/33 consensus sequence position,44 in repeats 3 (asp → gly, DG3*) and 7 (leu → gly, LG7*). Site-directed mutagenesis was performed using the Stratagene QuikChange Mutagenesis Kit (La Jolla, CA). Variants of the Notch ankyrin domain were expressed in the E. coli BL21(DE3) cell line and purified as described elsewhere.45 Urea-induced equilibrium unfolding transitions were determined by CD spectroscopy as described in Ref. 46, and are shown for the DG3* and DG3*/LG7* in Supporting Figure 2(A). Unfolding free energies were determined by fitting a linear energy model to the equilibrium transitions using a two-state model. Refolding and unfolding rate constants and urea dependencies for these new variants were determined as described in Ref. 22; chevron plots are shown in Supporting Figure 2(B,C). Free energies of unfolding and rate constants for these variants are reported in Table I, along with values for other variants taken from the literature.
The landscape-based model
The Notch ankyrin domain free energy landscape was determined from folding free energies of partially overlapping deletion constructs.14 These free energies were measured in the absence of NaCl, whereas experimentally determined folding kinetics were measured in 150 mM NaCl.14,25,22 The stabilizing effect of NaCl on the energy landscape was distributed evenly to the intrinsic free energy of each repeat.
In the landscape-based kinetic model, barriers for repeat folding are the experimentally determined intrinsic free energies (repeats 1 through 7 have unfavorable values of 7.8, 5.5, 7.1, 6.7, 5.8, 8.8, and 5.6 kcal/mol, respectively), whereas the energy barrier for repeat unfolding is the experimentally determined cost of disrupting an interface (9.1 kcal/mol). The consensus repeats C1 and C2 (corresponding to the 6th and 7th repeats) have intrinsic free energies of 5.1 and 4.3 kcal/mol, respectively35 and are assumed to have the same interfacial energy (9.1 kcal/mol) as the native repeats. This division of free energies within the 1-5C2 construct reasonably approximates the experimentally determined ΔGH2O○ value.35 To model the effect of residue substitution, intrinsic free energies of repeats bearing substitutions are increased (or for stabilizing substitutions, decreased) by the value of the folding free energy change (ΔΔGH2O○) associated with the substitution. For substitutions in repeats, 1–7 we use ΔΔGH2O○ values measured in the Nank1-7Δ construct.23 For substitutions in repeats C1 and C2, we use values measured in the Nank1-5C2 construct.36 To model the effect of urea, we treated each repeat as contributing equally to the m value (0.4 kcal/mol/M for each repeat). This urea dependence was chosen to match the urea dependence for equilibrium unfolding of the Notch ankyrin domain (2.8 kcal/mol/M). We assigned the urea dependence entirely to the intrinsic, rather than interfacial, folding energies. This partitioning is consistent with a recent study indicating that the magnitude of m-value changes are dominated by peptide backbone exposure,47 since the majority of the Notch ankyrin domain backbone units are involved in hydrogen bonds within (not between) repeats.
Calculating landscape-based kinetic trajectories
Structurally allowed transition probabilities were treated as exponentially proportional to their associated energy barriers. For any state, i, with k possible transitions, the probability of making a transition to state j is taken as
 |
1 |
where El is one of the k energy barriers, R is the gas constant, and T is the temperature.
Single molecule folding and unfolding trajectories were generated by a simple algorithm based on the first reaction method in stochastic sampling analysis.48,49 Starting at a given conformation, transition probabilities associated with each possible conformational change are calculated [Eq. (1)]. For a given transition probability, pj, a single folding event would be expected to occur with a time dependence given by a geometric distribution
| 2 |
where t is the number of elapsed time steps. For each of the potential transitions, the corresponding geometric distribution, Pj(t), was randomly sampled to obtain a potential transition time for state j, tj. Geometrically distributed random numbers were generated with the crng-1.2 program (www.sbc.su.se/∼pjk/crng). These random tj values represent stochastic folding times associated with each of the k possible transitions. The shortest of the k tj values (tmin) is adopted, leading to a new conformation. The simulation time is then incremented by tmin. The simulation is continued by randomly sampling from the set of geometrically distributed times relevant to the new conformation, to find tmin for the next step. The simulation is terminated when the time-averaged conformational distribution approximates the Boltzmann distribution [e.g. Fig. 3(A)]. At this point, population-averaged kinetic traces have reached their equilibrium values [e.g. Fig. 3(C)]. At least 1000 independent trajectories were averaged to generate ensemble folding and unfolding curves.
The Notch ankyrin domain contains one tryptophan residue buried between repeats 4 and 5 with minor contacts to repeat 6. In the kinetic model, states with repeats 4, 5, and 6 folded are defined to have a full fluorescence signal, if repeats 4 and 5 are folded and repeat 6 is unfolded there is a slightly hyperfluorescent signal (10% above the full fluorescent signal), and if either repeats 4 or 5 are unfolded there is no fluorescence signal.
Evaluating folding and unfolding curves
Stopped-flow fluorescence methods for measuring folding and unfolding kinetics have been described previously.21,24 Folding and unfolding curves were fitted using the nonlinear least squares algorithm of xmgrace (http://plasma-gate.weizmann.ac.il/Grace/) with the following equation for double exponential decays
| 3 |
where Yobs is the ensemble-based signal, k1 and k2 are the major and minor phase rate constants. Single exponential fits include only the first two terms in Eq. (3). Folding rates were used to calculate Φ values associated with substitution
 |
4 |
where kwt and kvar are the wild-type and variant folding rate constants.4
Acknowledgments
The authors thank Katherine Tripp for use of unpublished data and Nathan Baker for directing us to the work of Daniel Gillespie.
Footnotes
Because of the large energy differences between intrinsic repeat folding and interfacial pairing, transitions involving the folding of non-neighboring repeats and the unfolding of central repeats flanked by folded repeats are not considered, since they lead to very high energy interface-deficient conformations.
References
- 1.Jackson SE. How do small single-domain proteins fold? Fold Des. 1998;3:R81–R91. doi: 10.1016/S1359-0278(98)00033-9. [DOI] [PubMed] [Google Scholar]
- 2.Plaxco KW, Simons KT, Ruczinski I, Baker D. Topology, stability, sequence, and length: defining the determinants of two-state protein folding kinetics. Biochemistry. 2000;39:11177–11183. doi: 10.1021/bi000200n. [DOI] [PubMed] [Google Scholar]
- 3.Bai Y, Zhou H, Zhou Y. Critical nucleation size in the folding of small apparently two-state proteins. Prot Sci. 2004;13:1173–1181. doi: 10.1110/ps.03587604. [DOI] [PMC free article] [PubMed] [Google Scholar]
- 4.Matouschek A, Kellis JT, Jr, Serrano L, Fersht AR. Mapping the transition state and pathway of protein folding by protein engineering. Nature. 1989;340:122–126. doi: 10.1038/340122a0. [DOI] [PubMed] [Google Scholar]
- 5.Brockwell DJ, Radford SE. Intermediates: ubiquitous species on folding energy landscapes? Curr Opin Struct Biol. 2007;17:30–37. doi: 10.1016/j.sbi.2007.01.003. [DOI] [PMC free article] [PubMed] [Google Scholar]
- 6.Englander SW, Mayne L, Krishna MM. Protein folding and misfolding: mechanism and principles. Q Rev Biophys. 2007;40:287–326. doi: 10.1017/S0033583508004654. [DOI] [PMC free article] [PubMed] [Google Scholar]
- 7.Guo Z, Thirumalai D. Kinetics of protein folding: nucleation mechanism, time scales, and pathways. Biopolymers. 1995;36:83–102. [Google Scholar]
- 8.Bryngelson JD, Onuchic JN, Socci ND, Wolynes PG. Funnels, pathways, and the energy landscape of protein folding: a synthesis. Proteins. 1995;21:167–195. doi: 10.1002/prot.340210302. [DOI] [PubMed] [Google Scholar]
- 9.Dill KA, Chan HS. From Levinthal to pathways to funnels. Nat Struct Biol. 1997;4:10–19. doi: 10.1038/nsb0197-10. [DOI] [PubMed] [Google Scholar]
- 10.Oliveberg M, Wolynes PG. The experimental survey of protein-folding energy landscapes. Q Rev Biophys. 2005;38:245–288. doi: 10.1017/S0033583506004185. [DOI] [PubMed] [Google Scholar]
- 11.Shortle D, Meeker AK. Residual structure in large fragments of staphylococcal nuclease: effects of amino acid substitutions. Biochemistry. 1989;28:936–944. doi: 10.1021/bi00429a003. [DOI] [PubMed] [Google Scholar]
- 12.Chow CC, Chow C, Raghunathan V, Huppert TJ, Kimball EB, Cavagnero S. Chain length dependence of apomyoglobin folding: structural evolution from misfolded sheets to native helices. Biochemistry. 2003;42:7090–7099. doi: 10.1021/bi0273056. [DOI] [PubMed] [Google Scholar]
- 13.Kloss E, Courtemanche N, Barrick D. Repeat-protein folding: new insights into origins of cooperativity, stability, and topology. Arch Biochem Biophys. 2008;469:83–99. doi: 10.1016/j.abb.2007.08.034. [DOI] [PMC free article] [PubMed] [Google Scholar]
- 14.Mello CC, Barrick D. An experimentally determined protein folding energy landscape. Proc Natl Acad Sci USA. 2004;101:14102–14107. doi: 10.1073/pnas.0403386101. [DOI] [PMC free article] [PubMed] [Google Scholar]
- 15.Main ER, Stott K, Jackson SE, Regan L. Local and long-range stability in tandemly arrayed tetratricopeptide repeats. Proc Natl Acad Sci USA. 2005;102:5721–5726. doi: 10.1073/pnas.0404530102. [DOI] [PMC free article] [PubMed] [Google Scholar]
- 16.Coleman ML, McDonough MA, Hewitson KS, Coles C, Mecinovic J, Edelmann M, Cook KM, Cockman ME, Lancaster DE, Kessler BM, Oldham NJ, Ratcliffe PJ, Schofield CJ. Asparaginyl hydroxylation of the notch ankyrin repeat domain by factor inhibiting hypoxia-inducible factor. J Biol Chem. 2007;282:24027–24038. doi: 10.1074/jbc.M704102200. [DOI] [PubMed] [Google Scholar]
- 17.Mahajan A, Guo Y, Yuan C, Weghorst CM, Tsai MD, Li J. Dissection of protein–protein interaction and CDK4 inhibition in the oncogenic versus tumor suppressing functions of gankyrin and P16. J Mol Biol. 2007;373:990–1005. doi: 10.1016/j.jmb.2007.08.038. [DOI] [PMC free article] [PubMed] [Google Scholar]
- 18.Sue SC, Cervantes C, Komives EA, Dyson HJ. Transfer of flexibility between ankyrin repeats in IkappaB* upon formation of the NF-kappaB complex. J Mol Biol. 2008;380:917–931. doi: 10.1016/j.jmb.2008.05.048. [DOI] [PMC free article] [PubMed] [Google Scholar]
- 19.Wetzel SK, Settanni G, Kenig M, Binz HK, Pluckthun A. Folding and unfolding mechanism of highly stable full-consensus ankyrin repeat proteins. J Mol Biol. 2008;376:241–257. doi: 10.1016/j.jmb.2007.11.046. [DOI] [PubMed] [Google Scholar]
- 20.Zweifel ME, Leahy DJ, Hughson FM, Barrick D. Structure and stability of the ankyrin domain of the Drosophila notch receptor. Protein Sci. 2003;12:2622–2632. doi: 10.1110/ps.03279003. [DOI] [PMC free article] [PubMed] [Google Scholar]
- 21.Kajander T, Cortajarena AL, Main ER, Mochrie SG, Regan L. A new folding paradigm for repeat proteins. J Am Chem Soc. 2005;127:10188–10190. doi: 10.1021/ja0524494. [DOI] [PubMed] [Google Scholar]
- 22.Bradley CM, Barrick D. The notch ankyrin domain folds via a discrete, centralized pathway. Structure. 2006;14:1303–1312. doi: 10.1016/j.str.2006.06.013. [DOI] [PubMed] [Google Scholar]
- 23.Bradley CM, Barrick D. Limits of cooperativity in a structurally modular proteresponse of the notch ankyrin domain to analogous alanine substitutions in each repeat. J Mol Biol. 2002;324:373–386. doi: 10.1016/s0022-2836(02)00945-2. [DOI] [PubMed] [Google Scholar]
- 24.Bradley CM, Barrick D. Effect of multiple prolyl isomerization reactions on the stability and folding kinetics of the notch ankyrin domaexperiment and theory. J Mol Biol. 2005;352:253–265. doi: 10.1016/j.jmb.2005.06.041. [DOI] [PubMed] [Google Scholar]
- 25.Mello CC, Bradley CM, Tripp KW, Barrick D. Experimental characterization of the folding kinetics of the notch ankyrin domain. J Mol Biol. 2005;352:266–281. doi: 10.1016/j.jmb.2005.07.026. [DOI] [PubMed] [Google Scholar]
- 26.Greene RF, Jr, Pace CN. Urea and guanidine hydrochloride denaturation of ribonuclease, lysozyme, alpha-chymotrypsin, and beta-lactoglobulin. J Biol Chem. 1974;249:5388–5393. [PubMed] [Google Scholar]
- 27.Pace CN. Determination and analysis of urea and guanidine hydrochloride denaturation curves. Methods Enzymol. 1986;131:266–280. doi: 10.1016/0076-6879(86)31045-0. [DOI] [PubMed] [Google Scholar]
- 28.Santoro MM, Bolen DW. Unfolding free energy changes determined by the linear extrapolation method, Part 1: Unfolding of phenylmethanesulfonyl alpha-chymotrypsin using different denaturants. Biochemistry. 1988;27:8063–8068. doi: 10.1021/bi00421a014. [DOI] [PubMed] [Google Scholar]
- 29.Otzen DE, Kristensen O, Proctor M, Oliveberg M. Structural changes in the transition state of protein folding: alternative interpretations of curved chevron plots. Biochemistry. 1999;38:6499–6511. doi: 10.1021/bi982819j. [DOI] [PubMed] [Google Scholar]
- 30.Takei J, Chu RA, Bai Y. Absence of stable intermediates on the folding pathway of barnase. Proc Natl Acad Sci USA. 2000;97:10796–10801. doi: 10.1073/pnas.190265797. [DOI] [PMC free article] [PubMed] [Google Scholar]
- 31.Sanchez IE, Kiefhaber T. Non-linear rate-equilibrium free energy relationships and Hammond behavior in protein folding. Biophys Chem. 2003;100:397–407. doi: 10.1016/s0301-4622(02)00294-6. [DOI] [PubMed] [Google Scholar]
- 32.Kato H, Vu ND, Feng H, Zhou Z, Bai Y. The folding pathway of T4 lysozyme: an on-pathway hidden folding intermediate. J Mol Biol. 2007;365:881–891. doi: 10.1016/j.jmb.2006.10.048. [DOI] [PMC free article] [PubMed] [Google Scholar]
- 33.Alber T, Matthews BW. Structure and thermal stability of phage T4 lysozyme. Methods Enzymol. 1987;154:511–533. doi: 10.1016/0076-6879(87)54093-9. [DOI] [PubMed] [Google Scholar]
- 34.Street TO, Bradley CM, Barrick D. An improved experimental system for determining small folding entropy changes resulting from proline to alanine substitutions. Protein Sci. 2005;14:2429–2435. doi: 10.1110/ps.051505705. [DOI] [PMC free article] [PubMed] [Google Scholar]
- 35.Tripp KW, Barrick D. Enhancing the stability and folding rate of a repeat protein through the addition of consensus repeats. J Mol Biol. 2007;365:1187–1200. doi: 10.1016/j.jmb.2006.09.092. [DOI] [PMC free article] [PubMed] [Google Scholar]
- 36.Tripp KW, Barrick D. Rerouting the folding pathway of the notch ankyrin domain by reshaping the energy landscape. J Am Chem Soc. 2008;130:5681–5688. doi: 10.1021/ja0763201. [DOI] [PMC free article] [PubMed] [Google Scholar]
- 37.Karplus M, Weaver DL. Protein folding dynamics: the diffusion-collision model and experimental data. Prot Sci. 1994;3:650–668. doi: 10.1002/pro.5560030413. [DOI] [PMC free article] [PubMed] [Google Scholar]
- 38.Burton RE, Myers JK, Oas TG. Protein folding dynamics: quantitative comparison between theory and experiment. Biochemistry. 1998;37:5337–5343. doi: 10.1021/bi980245c. [DOI] [PubMed] [Google Scholar]
- 39.Myers JK, Oas TG. Reinterpretation of GCN4-p1 folding kinetics: partial helix formation precedes dimerization in coiled coil folding. J Mol Biol. 1999;289:205–209. doi: 10.1006/jmbi.1999.2747. [DOI] [PubMed] [Google Scholar]
- 40.Myers JK, Oas TG. Preorganized secondary structure as an important determinant of fast protein folding. Nat Struct Biol. 2001;8:552–558. doi: 10.1038/88626. [DOI] [PubMed] [Google Scholar]
- 41.Islam SA, Karplus M, Weaver DL. Application of the diffusion-collision model to the folding of three-helix bundle proteins. J Mol Biol. 2002;318:199–215. doi: 10.1016/S0022-2836(02)00029-3. [DOI] [PubMed] [Google Scholar]
- 42.Plaxco KW, Simons KT, Baker D. Contact order, transition state placement and the refolding rates of single domain proteins. J Mol Biol. 1998;277:985–994. doi: 10.1006/jmbi.1998.1645. [DOI] [PubMed] [Google Scholar]
- 43.Ferreiro DU, Cho SS, Komives EA, Wolynes PG. The energy landscape of modular repeat proteins: topology determines folding mechanism in the ankyrin family. J Mol Biol. 2005;354:679–692. doi: 10.1016/j.jmb.2005.09.078. [DOI] [PubMed] [Google Scholar]
- 44.Mosavi LK, Minor DL, Jr, Peng ZY. Consensus-derived structural determinants of the ankyrin repeat motif. Proc Natl Acad Sci USA. 2002;99:16029–16034. doi: 10.1073/pnas.252537899. [DOI] [PMC free article] [PubMed] [Google Scholar]
- 45.Zweifel ME, Barrick D. Studies of the ankyrin repeats of the Drosophila melanogaster notch receptor, Part 1: Solution conformational and hydrodynamic properties. Biochemistry. 2001;40:14344–14356. doi: 10.1021/bi011435h. [DOI] [PubMed] [Google Scholar]
- 46.Street TO, Bradley CM, Barrick D. Predicting coupling limits from an experimentally determined energy landscape. Proc Natl Acad Sci USA. 2007;104:4907–4912. doi: 10.1073/pnas.0608756104. [DOI] [PMC free article] [PubMed] [Google Scholar]
- 47.Auton M, Holthauzen LM, Bolen DW. Anatomy of energetic changes accompanying urea-induced protein denaturation. Proc Natl Acad Sci USA. 2007;104:15317–15322. doi: 10.1073/pnas.0706251104. [DOI] [PMC free article] [PubMed] [Google Scholar]
- 48.Gillespie DT. A general method for numerically simulating the stochastic time evolution of coupled chemical reactions. J Comput Phys. 1976;22:403–434. [Google Scholar]
- 49.Gillespie DT. Exact stochastic simulation of coupled chemical reactions. J Phys Chem. 1977;81:2340–2361. [Google Scholar]


