

Abstract
Prion diseases are associated with the misfolding of the prion protein (PrPC) from a largely α-helical isoform to a β-sheet rich oligomer (PrPSc). Flexibility of the polypeptide could contribute to the ability of PrPC to undergo the conformational rearrangement during PrPC–PrPSc interactions, which then leads to the misfolded isoform. We have therefore examined the molecular motions of mouse PrPC, residues 113–231, in solution, using 15N NMR relaxation measurements. A truncated fragment has been used to eliminate the effect of the 90-residue unstructured tail of PrPC so the dynamics of the structured domain can be studied in isolation. 15N longitudinal (T1) and transverse relaxation (T2) times as well as the proton-nitrogen nuclear Overhauser effects have been used to calculate the spectral density at three frequencies, 0, ωN, and 0.87ωH. Spectral densities at each residue indicate various time-scale motions of the main-chain. Even within the structured domain of PrPC, a diverse range of motions are observed. We find that removal of the tail increases T2 relaxation times significantly indicating that the tail is responsible for shortening of T2 times in full-length PrPC. The truncated fragment of PrP has facilitated the determination of meaningful order parameters (S2) from the relaxation data and shows for the first time that all three helices in PrPC have similar rigidity. Slow conformational fluctuations of mouse PrPC are localized to a distinct region that involves residues 171 and 172. Interestingly, residues 170–175 have been identified as a segment within PrP that will form a steric zipper, believed to be the fundamental amyloid unit. The flexibility within these residues could facilitate the PrPC–PrPSc recognition process during fibril elongation.
Keywords: PrP, structure, misfolding, backbone, intermediate, TSE, BSE, CJD
Introduction
Transmissible spongiform encephalopathies or prion diseases are a group of fatal neurodegenerative disease that can be sporadic, inherited, or acquired. The infectious agent of these diseases is devoid of nucleic acid and is almost entirely composed of the prion protein, PrPSc, which is a misfolded form of a cellular prion protein PrPC.1 Recombinant prion protein has now been shown to be capable of propagating prion disease.2 It is yet to be established what structural relationship small toxic replicating oligomeric species have with the more mature amyloid fibers.3 It is clear the structure, flexibility, and stability of native PrPC as well as folding intermediates of PrP are of significant interest to those studying the mechanism of prion misfolding and replication.
Post-translational processing of mammalian prion protein typically results in a ∼208 residue glycoprotein that possesses two N-glycosylation sites and one disulfide bridge. Mature PrPC is then tethered to the cell surface via a glycosyl-phosphatidylinositol anchor at the C-terminus.1 Three dimensional NMR solution structures of non-glycosolated PrPC from a number of mammalian species have been determined, including mouse,4 Syrian hamster,5–7 human,8 bovine,9 cats, dogs, pigs, sheep, chicken, turtles, frogs, and elk.10–12 There has been some recent progress in defining the molecular architecture of prion amyloid fibers.13,14
The mammalian prion proteins have a high homology at the sequence and structural level. All mammalian PrPC studied consist of two structurally distinct domains. The N-terminal domain (residues 23–120) is highly disordered15 and is notable for its ability to bind Cu2+ ions.16–21 The N-terminus contains a highly conserved octa-repeating sequence, PHGGGWGQ between residues 57 and 90. The flexible N-terminal tail of PrPC has shown some ordering at a lower pH of 4.22 The C-terminal domain (residues 126–231) is predominantly helical, containing 3 α-helices as well as two short anti-parallel β-strands. For mouse, PrPC helix A, B, and C include residues 144–154, 175–193, and 200–219, respectively,4,7 and for the β-sheet residues 128–131 and 161–164.4,7
The process of prion propagation to form amyloids has been described as a nucleation or template-assisted process, via an intermediate, PrP*. The native form of PrP is readily formed between pH 5 and 7, whereas amyloid fibers are favored under neutral pH, moderately denaturing conditions and agitation.23 The third well characterized form of PrP is a soluble oligomeric species favored at low pH (∼4) under mild denaturing conditions with a high salt content.24–28 CD indicates this low pH oligomer has a high β-sheet content, and solution NMR studies have shown that the N-terminal tail retains its mobility in this oligomeric form.28
15N NMR relaxation measurements are an unique method for probing the main-chain motions of proteins on a per-residue basis.29,30 Slow conformational fluctuations on a milli-to-microsecond time-scale can highlight regions of PrPC that sample alternative main-chain conformations. These flexible regions could facilitate protein–protein docking. 15N relaxation measurements have previously been reported for full-length PrP(29–231)15 and the 90–231 fragment.15,31,32 However, attempts to obtain order parameters (S2) for each NH-bond vector have been unsuccessful for the majority of residues in helix B and C for these PrPC constructs.15 These fragments contain a significant amount of the unstructured tail. This long tail, residues 23–120, may have a profound influence of the relaxation behavior of the structured C-terminal domain of PrPC. Thus, the aim of this study was to use a truncated version of PrPC, residues 113–231, that contains almost exclusively the structured domain of PrPC. The PrP(113–231) construct was chosen because this fragment is found to occur in vivo.33 This shorter fragment will not have its dynamics dictated by the unstructured tail and will facilitate a more detailed analysis of per-residue motions of the structured core of PrPC.
Results
Assignments of mouse PrP(112–231)
The protein fragment of mouse PrP(113–231) gives well resolved 15N-HSQC spectra. Assignment of the amide resonances was completed using 3D 15N HSQC-NOESY and TOCSY data. A strip-plot of the 15N HSQC-NOESY spectrum is shown in Figure 1 for the region of PrPC containing the short stretch of anti-parallel β-sheet. Sequential and cross-strand NOEs are indicated. Although there is strong cross-strand HN-HN and Hα-HN NOEs observed between M128 and Y162 and L129 and Y162, respectively, other cross-strand diagnostic NOEs are very weak. Similarly, sequential NH-NH and αH-NH are shown (Supp. Fig. S1) for a representative stretch of α-helix, between residues 171 and 182. Consistent with other PrPC structures our construct contains three α-helices and a short, two-stranded β-sheet. Helical boundaries are as follows: helix A, D143 – N152; helix B, N171 – K193; helix C, E199 – Y225, based on the observation of characteristic NOEs. Helical boundaries defined by the published mouse PrP structure are more conservatively reported as follows; 144–154, 175–193, and 200–219.7 Although it is unnecessary in our case to solve a complete 3D structure, NOEs between secondary structure elements ensures their correct orientation in space. For instance, NOEs observed in R163 may originate from I181 and place the β-sheet adjacent to helix B. The majority of non-sequential NOEs were not assigned.
Figure 1.
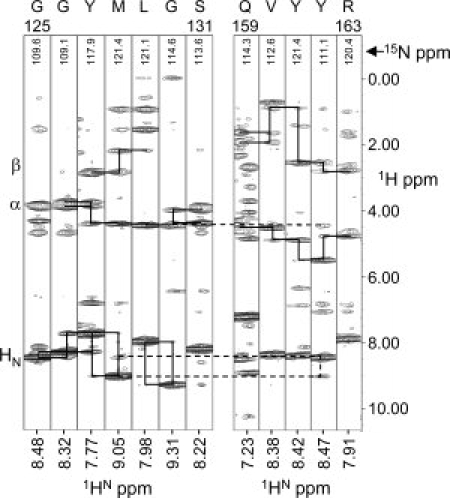
Series of strips from 1H-1HN slices of the 3D 15N NOESY-HSQC collected at 600 MHz (1H) and 30°C. Each strip corresponds to a single residue in the two-stranded β-sheet, β1 (G125–S131), and β2 (Q159–R163). Solid lines connect sequential residues, dashed lines highlight connections occurring between the strands. The assignments are shown at the top of each strip.
Amide main-chain assignments are indicated for the 15N-HSQC shown in Figure 2, together with the mouse PrP primary sequence. All but eight main-chain amides have been assigned. Unassigned residues include: A115; A116; A119; and V120 from the N-terminus, as well as S169, F174, S230, and S231. The assignment process has been aided by backbone assignment reported for a number of other mammalian PrP's including, hamster, human, and bovine which have high sequence homology with mouse PrP.12 TOCSY cross-peaks and NOEs allowing sequential assignment of residues forming a loop (residues 166–170) between β–sheet S2 and α–helix B are very weak (D166, Q167, Y168, N170) or missing (S169) and assignments for these residues are only tentative. Residues 166–170 were not used in detailed relaxation analysis because of spectral overlap for these residues in the 15N-HSQC.
Figure 2.
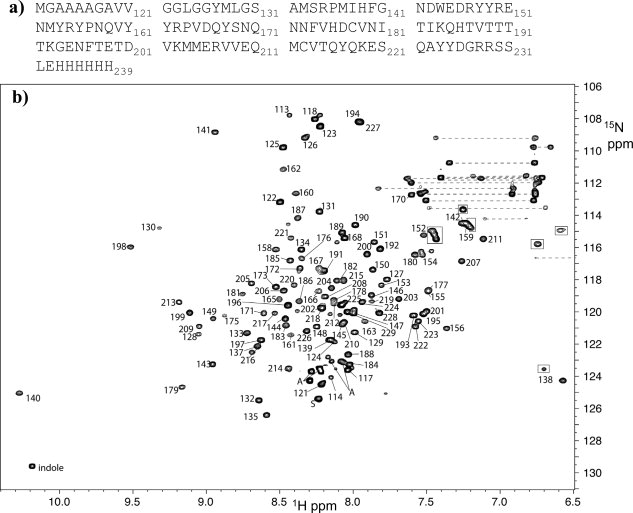
15N HSQC assignments for mPrP(113–231). (a). Mouse PrP sequence of the C-terminal domain used in this study. (b) Annotated 15N HSQC spectrum. Numbering relates to the sequence in (a). The C-terminal His-tag (232–239) is unassigned. Dashed lines connect side chains of unassigned Q and N sidechains. Boxes highlight folded arginine side-chain amine groups (w1 = w1,app – 30 ppm). The “indole” peak is from Trp 144. The A and S are Ser and Ala residues at the N-and C-terminus.
15N relaxation measurements
To gain insight into the motion of the backbone of PrP in solution 15N longitudinal (T1) and transverse (T2) relaxation times as well as 15N heteronuclear NOEs were measured at 600 MHz proton frequency for the truncated structured domain of mouse PrP residues (113–231). From a possible total of 115 main-chain amides (118 minus three prolines), we found 83 residues sufficiently dispersed to warrant relaxation analysis on a per-residue basis. In addition to eight unassigned amides, 24 more residues were not adequately resolved to permit full relaxation analysis. The residues not included in the analysis were: 115, 116, 119, 120, 122, 124, 139, 142, 145, 147, 155, 159, 166–170, 174, 177, 179, 184, 194, 195, 201, 202, 210, 212, 218, 225, 227, 230, and 231.
The R1 (1/T1) and R2 (1/T2) relaxation rates and heteronuclear NOEs for mPrP(113–231) are shown in Figure 3. The 15N heteronuclear NOE values for helix A, B, and C are very similar, with values between 0.75 and 0.85. There is a dip in 15N heteronuclear NOEs for the N-and C-terminus and residues between 190 and 197. Residues before 123 give negative heteronuclear NOEs indicating high mobility of the main-chain. The R1 values are largely invariant for the bulk of the residues with typical relaxation rates between 1.3 and 1.6 s−1 apart from six residues at the N-terminus, which exhibit reduced R1 rates. The R1 values for residues in Helix C are generally lower than in the other two helices. R2 values show the largest range of variation with mean R2 values for helix A at 11.2 s−1, which are consistently less than residues in helix B and C with mean R2 rates of 12.1 s−1 and 13.5 s−1, respectively. Following the trends in heteronuclear NOE values, R2 rates are reduced for the N-and C-terminus and residues between 188 and 198. In addition, eight residues produce distinctly large R2 rates when compared with the rest of the protein: G130, 16.3 s−1; V165, 20.3 s−1; Q171, 16.5 s−1; N172, 16.5 s−1; Q216, 15.2 s−1; Y217, 15.1 s−1; E220, 15.3 s−1; and S221, 15.9 s−1. The latter four residues are within helix C and are appreciably larger than the mean R2 rate for helix C of 13.5 s−1.
Figure 3.

Relaxation data for mPrP(113–231). (a) Heteronuclear NOE and the relaxation rates, (b)R1 (=1/T1), and (c)R2 (=1/T2) determined at 600 MHz. Sample conditions: 30°C; pH 5.3; 20 mM acetate buffer.
Reduced spectral densities
J(0.87ωH)
The reduced spectral density function, J(ω), provides insights into the motion of the NH bond vector at three frequencies, zero, ωN, and 0.87ωH.34,35 Spectra densities at these three frequencies are shown in Figure 4 on a per-residue-basis. The high frequency spectral densities J(0.87ωH) are particularly useful in indicating fast pico-second motions typically observed in flexible regions of proteins. These are often associated with rapid hydrogen-bond rearrangements. J(0.87ωH) spectra densities have been mapped on to the structure of PrPC (see Supp. Fig. S2). It is clear that large J(0.87ωH) are localized to the N-and C-termini of PrP(113–231), residues 113–127, and 222–231 and a loop region between helix B and C, residues 190–197. Much of the rest of the structured domain shows little fast pico-second time-scale motions. The extended polypeptide between helix A and β-strand two lacks the fast motions and has comparable J(0.87ωH) to all three helixes. In addition, residues within and close to the short anti-parallel β strand-1 (residues 128–131) and strand-2 (residues 161–164) do not exhibit fast pico-second time-scale motions. It should be noted that J(0.87ωH) and J(ωN) are calculated independently of R2 values and are therefore not influenced by slow Rex milli-second to micro-second motions.
Figure 4.
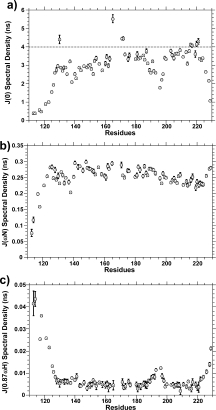
Reduced spectral density functions: (a) J(0), (b) J(ωN), and (c) J(0.87ωH) for mPrP(113–231) at 600 MHz. The high frequency spectral densities, J(0.87ωH), indicate fast pico-second motions typically observed in flexible regions of proteins. J(0) indicates sub-nanosecond flexibility of the NH bond vector, the smaller the value of J(0) the greater the flexibility. Uncharacteristically large J(0) indicate residues with slow conformational fluctuations. Sample conditions: 30°C; pH 5.3; 20 mM acetate buffer.
J(ωN)
For small proteins, J(ωN) will decrease with increased internal flexibility. As the protein size increases this effect becomes less apparent, and for very large proteins the effect is reversed and J(ωN) will increase with increased flexibility.29 For PrP(113–231), a relatively small protein fragment, the flexible N-terminal residues, between 113 and 125, exhibit a reduction in J(ωN). A reduction in J(ωN) spectral densities relative to the bulk of the protein is not apparent for the C-terminal residues. Residues in helix C (residues 200–219 with helical character up to residue 225) show a very slight reduction in J(ωN) spectral densities. However, helix C does not exhibit increased flexibility according to both J(0.87ωH) and J(0) spectral densities. This reduction in J(ωN) reflects anisotropic tumbling of PrPC. As discussed later, N—H bond vectors in helix C are aligned with the long axis of the protein and therefore have a longer rotational diffusion time relative to helix A and B.
J(0)
Assuming there are no internal motions, the spectral density function J(0) is equal to 2/5 τm, where τm is the rotational correlation time. A value for J(0) less than 2/5τm indicates internal flexibility of the NH bond; the smaller the value of J(0) the greater the sub-nanosecond flexibility of the NH bond vector.29 There is a good deal of variation of the J(0) spectral densities. Residues in the three helices show some of the largest J(0) spectral density although there is some variation in the values, with helix A giving mean values of 3.0 ns, whereas helix B and C produce larger values for J(0) of 3.2 ns and 3.6 ns, respectively. Mirroring the J(0.87ωH) spectral densities residues from the N-and C-termini and a loop region between helix B and C show a marked reduction in J(0) spectral densities also suggesting increased flexibility of the NH bond vector.
Rex motions
In addition to sub-nanosecond flexibility of the NH bond vector, slow micro-to millisecond motions can also be reflected in J(0) spectral densities, as an increase in J(0) values. The slow ms-μs (Rex) motions have no effect on J(ωN) or J(ωH) spectral densities and so may be used to isolate these motions observed in the J(0) spectral densities. Eight residues can be identified as having J(0) spectral densities significantly greater than the bulk of the protein with J(0) greater than 4 ns, shown in Figure 4. The cutoff of 4.0 ns was set as two standard deviations greater then the mean J(0) value for helix C. The mean J(0) for helix C (residues 200–215) is 3.56 ns with a standard deviation of 0.22 ns. These eight residues do not exhibit distinct J(ωN) or J(ωH) spectral densities suggesting that the large J(0) values are because of exchange (Rex) motions on a milli-microsecond time scale. Typically, the slow motions that cause exchange broadening are due to large segmental rearrangements rather than single H-bond rearrangements. Interestingly, four of these residues are within or close to the anti-parallel β-sheet. The J(0) spectral densities for these four residues are as follows: G130, 4.4 ± 0.2 ns; V165, 5.5 ± 0.2 ns; Q171, 4.5 ± 0.1 ns; and N172, 4.5 ± 0.1 ns. Neighboring residues 129 and 131 are resolved (in the 15N HSQC spectra, Fig. 2) as are residues from the other side of the anti-parallel β-sheet, in particular, residues 160–163, whereas residue 164 is a proline. These residues do not show significantly distinct J(0) from the bulk of the protein. In addition, four other amides exhibit J(0) spectral densities greater than 4.0 ns and are located at the end of helix C. These residues have larger J(0) spectral densities (two standard deviations from the mean) than the other residues within helix-C. These four residues Q216, Y217, E220, and S221 represent a continuous face on the C-terminal end of helix-C. Residues in the loop between β-strand 2 and helix B (166–170) may also exhibit Rex motions similar to that observed for V165, Q171, and N172. It has not been possible to assign this loop (166–170) because of a lack of adequate TOCSY and NOESY data combined with spectral overlap, consequently a detailed relaxation analysis of these residues has not been possible. However, weak or missing TOCSY and NOE peaks for these residues hint at exchange broadening as observed for the adjacent residues 165, 171, and 172.
Order parameters (S2) and rotational correlation time (τc)
τc
An effective rotational correlation time (τc,i) at each residue has been calculated from J(0) and J(ωN) spectral densities using Eq. (1).36,37 PrP(113–231) exhibits a good deal of variation in the rotational correlation time τc,i per residue, shown as Supporting Figure S3. This reflects both fast internal motions and slow segmental rearrangements in addition to the over-all rotational diffusion time. A trimmed mean rotational correlation time has been determined in order that only rigid amide nitrogens are used in the calculation of τc.38 This has been achieved by using only residues that have heteronuclear NOEs greater than 0.72, so as to eliminate fast pico-second motions. Furthermore, the residues with unusually high R2 rates, reflecting slow Rex motions, have also been eliminated from the calculation of rotational correlation time. This trimmed rotational correlation time produces a mean value of 9.0 ns for residues within the three helices. There is still some variation in the rotational correlation time, residues in helix A give consistently lower τc values with a mean of 8.1 ± 0.2 ns, residues in helix B have a mean τc value of 8.4 ± 0.6 ns, whereas helix C gives consistently higher values with a mean of 9.9 ± 0.4 ns as is apparent from the Supporting Figure S3. If the protein does not approximate to a sphere, then individual τc values will vary according to the angle between the NH bond vector and the long axis of the protein.39 The differences in τc from the three helices reflect anisotropic tumbling within the molecule. The variation in τc between helices have been shown to correlate well with asymmetric hydrodynamic radius calculated for PrPC with the long axis, Rz of 24 Å and 16 and 12 Å for the shorter axis, Rx and Ry.15 It has previously been shown from calculations using the PrPC solution structures show that the N—H bond vectors of helix C are parallel to the long axis, whereas helix A is perpendicular to it.15
S2
The model-free formalism40,41 is often used to describe the motions of a protein. In particular, the order parameter (S2) describes the amplitude of the nanosecond time-scale motions and can range between 0 and 1.0, representing complete disorder and complete order, respectively. Approximate order parameters have been directly calculated from J(0) and J(ωN) spectral densities using Eq. (2),36,37 rather than a statistical selection of various models of motion.42 The correlation time τc for the protein has been allowed to vary on a per-residue-basis. The order parameters for mPrP(112–231) are shown in Figure 5(a), and the S2 values have been mapped on to the structure of mPrPC, Figure 5(b). Apart from the four residues identified as containing Rex motions, all residues produce order parameters less than 1.0. The three helical regions give very similar order parameters, typical for a well ordered protein, with very similar mean S2 values of 0.91, 0.92, and 0.92 for helices A, B, and C, respectively. Residues between the first β-strand and helix A exhibit very slightly increased flexibility (in particular I138) with S2 values of ∼0.8. Considerable flexibility, with S2 < 0.75, are observed for residues between 113 and 125 at the N-terminus, the loop region between helix B and C (residues N196 and F197) and residue R229 at the C-terminus of PrPC.
Figure 5.
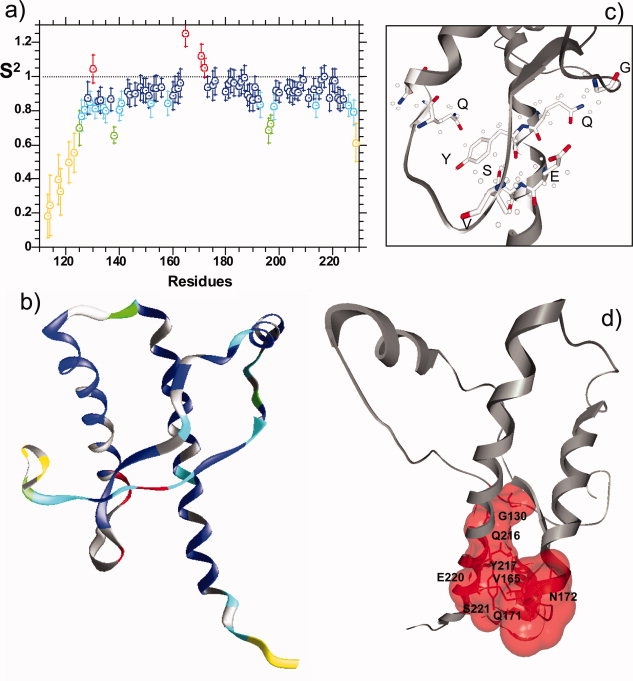
(a) Order parameters (S2) for mPrP(113–231). Order parameters describe the amplitude range of the nanosecond time-scale motions between 0 (flexible) and 1.0 (rigid). Residues that exhibit additional Rex exchange motions are highlighted in red. (b) Order parameter mapped onto the structure (1 xyx) of mPrPC: red S2 > 1.0 (Rex motions); blue 0.85 < S2 < 1.0; cyan 0.75 < S2 < 0.85; green 0.65 < S2 < 0.75; and yellow S2 < 0.65, residues in gray have no value calculated. (c) Slow conformational fluctuations are localized to a distinct region within PrPC, the position of side-chains that exhibit Rex motions are highlighted, dots are proton positions. (d) The molecular surface, in red, generated by the residues that exhibit Rex motions, within the context of the whole structured domain. This figure was generated using GRASP2.
Discussion
Order parameters calculated for truncated PrPc
15N relaxation measurements have previously been reported for full-length PrP(29–231)15 and the 90–231 fragment.15,31 The full-length protein and truncated fragments contain a significant amount of the unstructured tail, residues 23–125. This long-tail attached to the C-terminal globular domain of PrPC appears to have a profound influence of the relaxation behavior of the structured C-terminus. In particular, attempts to obtain an order parameter (S2) for each NH bond vector have been unsuccessful for the majority of residues in helix B and C, for both PrP(29–231) and the shorter fragment PrP(90–231),15 with S2 driven to values considerably higher than the physical limit of 1.0. One explanation is that the long unstructured tail causes disproportionately short T2 values relative to T1 and heteronuclear NOEs making the determination of an order parameter intractable. This was somewhat of a surprise as other unstructured proteins have been readily fitted to model free formalism by using a variable rotational correlation time calculated per-residue.43 Furthermore, the removal of a significant proportion of the unstructured tail of PrPC residues 29–90, had no effect on the dynamics of the protein as 15N relaxation parameters for SHaPrP(90–231) and SHaPrP(29–231) are strikingly similar.15 Alternatively, we postulated that much of the structured domain might exhibit pronounced additional slow segmental exchange motions, and these would cause disproportionately short T2 times. A large number of residues exhibiting significant exchange motions on a milli-second to micro-second time scale was a particularly appealing hypotheses to explain the unusually long transverse relaxation rates, bearing in mind the ability of PrPC to misfold into a pathogenic isoform. With this in mind, we set about determining the 15N relaxation behavior of the truncated fragment of PrPC containing only the structured domain residues 113–231, so eliminating the effect of the unstructured tail. Comparison of mPrP(113–231) with relaxation data for the longer fragment and full-length PrP highlights the influence of the long unstructured tail on the hydrodynamics of the whole protein. Relaxation data published for full-length Syrian-hamster PrP, and the 90–231 fragments were recorded at the same temperature and pH as this study15 and therefore permits direct comparison.
The magnitude and trend of R1 rates and heteronuclear NOEs are strikingly similar for all three fragments; SHaPrP(29–231), SHaPrP(90–231),15 and mPrP(113–231). In particular, R1 values for the bulk of residues are largely invariant and produce R1 rates of ∼1.5 s−1 for all three constructs. Similarly, heteronuclear-NOE values for residues within the helices of PrPC exhibit very similar values for all three constructs – typically 0.80. In contrast, R2 values for the short fragment that lacks the unstructured N-terminal tail exhibits strikingly different R2 rates. The structured domain, particularly the three helices, give R2 values between 16 and 20 s−1 for both SHaPrP(90–231) and SHaPrP(29–231), whilst for PrP(113–231), R2 rates are significantly reduced with average values between 11.2 s−1 (helix A) and 13.5 s−1 (helix C). The reduction in the R2 rates between PrP(90–231) and PrP(113–231) can not simply be accounted for by the very small reduction in molecular weight that is the loss of 14 amino acids (from 141 amino acids to 118 + 9, for the His-tag). It is clear that the presence of a flexible tail causes the disproportionably large R2 rates relative to R1 and heteronuclear NOEs making the determination of an order parameter intractable. Removal of the flexible tail significantly reduces R2 rates while leaving R1 and heteronuclear NOEs largely unaffected. This means the R2 values reflect the hydrodynamics of a globular protein and order parameters can readily be calculated.
It is clear from this study that even when the rotation correlation time is permitted to vary, per-residue, the calculation of an order parameter may not be appropriate for proteins with appreciable portions of unfolded polypeptide chain. Thus each N—H vector is better described by a distribution of rotational correlation times.44 Our study suggests that large portions of PrPC do not exhibit slow Rex motions, as simply removing the flexible tail causes a dramatic reduction in R2 values. The effect on the R2 rates is sufficiently significant to facilitate, for the first time, the determination of order parameter (S2), for the PrP(113–231) fragment. It is notable that order parameters (S2) calculated do not require a term for Rex motions and yet the S2 values are typical for a globular protein for the overwhelming majority of residues. In contrast, the majority of residues for full-length PrP have S2 values in excess of 1.0.
J(0) and S2 can reflect internal flexibility of the NH bond vector, in particular, a value for J(0) less than 2/5τm indicates internal flexibility of the NH bond.29 However, J(0) is strongly influenced by the rotational correlation time of the protein, and for this reason anisotropic tumbling can influence J(0) spectral densities. This is the case for PrPC, where it has been shown that the structured domain is not isotropic with a the long axis, Rz of 24 Å and two shorter axis, Rx; 16 and Ry; 12 Å.15 It has been shown that helix C, the longer of the three helices, is aligned with long axis while helix A is perpendicular to it. This anisotropic tumbling results in mean J(0) values for helix C larger than helix A; 3.6 ns relative to 3.0 ns for mPrP(113–231). Calculations using the PrPC solution structures show that the N—H bond vectors of helix C are parallel to the long axis while helix A is perpendicular to it. In contrast, S2 order parameters indicate H—N bond motional amplitude distinct from a rotational correlation time. The value set for the rotational correlation time will clearly influence the order parameter.45 However, here we allow τc to vary per residue, which therefore compensates for the effect of an anisotropic rotational diffusion within PrPC, as shown in Supporting Figure S3. Inspection of the S2 data [Fig. 5(b)] shows that all three helices have very similar mean S2 values 0.91, 0.92, and 0.92 for helices A, B, and C, respectively. It is clear that an asymmetric rotational diffusion is reflected in J(0) values, but the values of the order parameters, calculated with a variable τci are not influenced by asymmetric rotational diffusion.
The similarities between structures of mammalian PrP species are well documented.8 Sequence comparison of mouse and Syrian hamster shows a 94.2% homology in this fragment, there are six largely conservative substitutions. It is clear from this study that mouse and hamster PrP have very similar dynamical properties. Comparison of J(0.87ωH) spectral densities between mouse and hamster show very similar trends. In particular, the flexible N-terminal tail stretches between residues 23 and 125, whereas the flexibility at the C-termini is limited to the last few residues. In addition, both proteins have a flexible loop between helix B and C, residues 190–197, which possesses fast pico-second time-scale motions.
PrPC folding intermediates and stability
PrP*, the precursor for amyloid formation, could require the complete unfolding of PrPC. Alternatively, PrPC could be a kinetically trapped intermediate to the formation of PrP* and PrPSc. Finally, PrP* might represent a sampled conformation formed on the way to a more stable native PrPC, as described in Supporting Figure S4. It is yet to be established whether PrPSc retains any of the structural elements found in PrPC, although recent data suggests that residues 160–220 undergo significant conformation change to form amyloid fibers.13,24 In contrast, modeling based on 2D crystals,46 and epitope mapping studies47 of PrPC and PrPSc, as well as the presence of the intra-molecular disulphide in PrPSc,48 suggests that much of helix B and C may be retained in the scrapie form. At face value, the J(0) values hint at the possibility that helix A of PrPC has relatively more flexibility than helix B and C. However, the effect of anisotropic tumbling needs to be taken into account. This has been achieved by determining the order parameters, which give very similar S2 values for all three helices. Hence, helix A does not have any more internal flexibility than the other helices. This observation agrees with measurements of PrPC amide protection factors.49 This study indicated that all three helices have similar hydrogen-bond protection factors, apart from a few amides adjacent to the single disulphide bond within PrP, Cys190–Cys214, which exhibit additional amide protection.50 These observation support reports that, at neutral pH, PrPC undergoes essentially a simple two state unfolding, from native to fully unfolded.51,52 An intermediate in which, for example, helix A is unfolded and helix B and C remain intact is not suggested.
Studies using hydrostatic pressure53 have been used to study the unfolding of PrPC in an attempt to identify folding intermediates. These folding intermediates may represent conformations of the prion protein (PrP*) on a pathway to PrPSc and amyloid formation. Perhaps contradictory to the modeling based on 2D crystals,46 these studies suggest that a largely intact helix B and C is unlikely. Indeed, the NMR studies suggest that helix A actually has slightly more stability than helix B or C.32,53 Recent amide protection studies of prion fibrils (PrPSc rather than PrPC) have indicated that a relatively short stretch of the sequence constitutes the β-sheet rich core of PrPSc between residues 169 and 214,24 again supporting the assertion that helix B and C are not retained as helices in the PrP* precursor to the scrapie isoform.
Mutations in the prion protein linked with familial prion disease are found throughout the PrP sequence, some of these residues, in particular D178N, T183A, and Q217R involve disruption of salt-bridges or hydrogen-bond net works and seem to destabilize the native structure.7 Other mutations are found in the unstructured region of PrPC, residues; 102, 105, 117 for example. These mutations may stabilize the formation of PrP* and PrPSc rather than destabilize PrPC. Furthermore, it has been shown that residues 90–126, although unstructured in PrPC, are essential for prion propagation. Removal of these residues (as with the construct studied here) does not destabilize PrPC supporting the hypotheses that these residues stabilize the formation of PrP*. It is interesting to note that a genetic mutation, which has a stop codon at residue 145, generates a truncated PrP fragment residues 23–145. This fragment lacks residues from helix B and C, but still causes a familial prion disease.54
Slow conformational fluctuations are localized to a distinct region within PrPC
Slow motions that cause exchange broadening of NMR signals are typically because of large segmental motions rather than single hydrogen-bond rearrangements. Residues exhibiting exchange broadening sample alternative conformations in exchange with the native conformation on a milli-micro second time-scale. Exchange motions in the short anti-parallel β-sheet, in particular at reside G130, are interesting as polymorphism in human PrP is found at the adjacent residue 129M/L. This polymorphism dictates strain-type in familial prion disease and is a key determinant of susceptibility to sporadic and acquired CJD. In particular, only individuals homozygous for methionine at 129 (Met/Met) (with one exception) have contracted variant CJD.55 Slow exchange motions observed for mPrP at G130 are also observed for Syrian hamster PrP at the same position and at the adjacent β-sheet V161.
Residues 165, 171, and 172 also show large Rex motions while residues in the loop between them (166–170, between the β-strand S2 and the start of helix B) give weak NMR signals, which may be a result of broadening because of Rex motions. NMR studies on a number of different mammalian prion proteins have exhibited similar weak signals in this loop.11 Although for hamster PrP residues between 165 and 172 do not seem to show marked exchange broadening.15 The N170S mutation, hamster to mouse, seems to explain the differences in flexibility for residues 165, 171, and 172.
Residues Q216, Y217, E220, and S221 in mouse PrP show large J(0) spectral densities (greater than 4 ns, >2 standard deviations from the mean J(0) for helix C) indicating that these residues may also exhibit some Rex motions. The analogous residues for hamster PrP are not identified as having pronounced J(0) values although the noise in these larger fragments is considerably increased and could well account for them going undetected.
Inspection of the mPrPC solution structure (1 xyx)4,7 indicates that the residues exhibiting some slow exchange line broadening, 216, 217, 220, and 221, lie along the same face of helix C and interact with residues exhibiting significant Rex motion in the loop between V165 and N172. Figure 5(c) shows that G130 is close to Q216, whilst tyrosine Y217 sits in behind the 165–172 loop and forms hydrophobic packing interactions with V165 and Q171, S221 is also spatially close to V165. Thus, rather than simply the β-sheet exhibiting slow conformational fluctuations in PrPC, the residues exhibiting Rex motions can all be mapped to a localized patch or inter-linked region, as indicated in Figure 5(d). As we have been unable to define the Rex motion of residues 166–170, they don't appear in Figure 5(d), but would extend the localized patch of residues involved in slow conformational fluctuations. Intriguingly, residues Q167, Q171, V214, and Q218 have been identified as the binding site for the so-called “protein X”.56 These residues exhibit, or are sequentially adjacent to residues that exhibit, Rex motions. The binding of an as yet, unidentified molecule might destabilize PrPC or stabilize a PrP* intermediate. Furthermore, a mutation in humans that causes familial prion disease, Q217R (Q216 in mouse), has been identified and is likely to destabilize this region.7
Interestingly, Doppel protein which has both sequence and structural homology with PrP57 is less stable than PrPC50 but will not propagate prions. One key difference with Doppel is the presence of a second disulphide. This disulphide is found between the loop region and helix C (equivalent residues in the mouse sequence are residues 166 and 221).58 This is the same region that exhibits slow conformational fluctuations in PrPC. Perhaps, a key difference with Doppel is the stabilization of this region of the protein via an additional disulphide bond.
Profiling methods for determining fibril-forming segments of proteins have identified residues 170–175 (SNQNNF) within mouse and human PrP.59 This hexapeptide will form fibrils and the closely related microcrystals. It is suggested that the fundamental unit of amyloids is the tightly interdigitated β-sheets, termed steric zippers, formed by the cross-β stacking of these residues.59 This sequence with its high complimentary interface might nucleate fibrilization. It is notable that residues N171 and Q172 on the surface of mPrPC exhibit slow motion conformational fluctuations. It is a possibility that the flexibility within these residues could facilitate the recognition process as PrPC docks on to the exposed ends of amyloid fibers during fiber elongation. The region identified here as possessing conformational fluctuations might represent a possible therapeutic target, inhibiting the PrPC–PrPSc recognition process or stabilizing PrPC.
Materials and Methods
Expression and purification of recombinant mPrP(113–231)
C-terminally His-tagged full-length mouse PrP(23–231) was cloned into a pET-23 vector as previously described.60 Codons for amino acid residues 23–112 were deleted by mutation of the sequence to include and NdeI site prior to the codon for residue 113. After restriction digestion with NdeI (Promega), the plasmid was religated and expressed a truncated PrP fragment, PrP(113–231) which lacks the natively unstructured N-terminal domain. This fragment retains a methionine residue prior to residue 113. The protein was expressed in 2-L flasks of Escherichia coli BL21(DE3) cells in 15N labeled minimal medium containing (1 g/L) 15NH4Cl (Cambridge isotope laboratories) as the sole nitrogen source. Cultures were grown at 37°C to an A600 of 0.9 and the protein expression was induced by the addition of isopropyl-β-d-thiogalactopyranoside to a final concentration of 1 mM. Bacterial pellets were harvested after 4 h and sonicated in a resuspension buffer containing 8M urea, 200 mM NaCl, and 50 mM Tris, pH 7.6. The resulting solution was cleared of bacterial debris by centrifugation at 6000g for 15 min. The protein was absorbed to a nickel-charged metal affinity column made from chelating Sepharose (Amersham Biosciences). The proteins were washed with at least 20 column volumes of resuspension buffer and eluted from the column using the same buffer supplemented with 300 mM imidazole. The protein was found to be greater than 95% pure by polyacrylamide electrophoresis and Coomassie staining. The protein was refolded by successive rounds of dilution in deionized water and concentrated in a Vivaspin centrifugal concentrator (Vivascience) with a 10,000 molecular weight cut off. The refolded protein was dialyzed twice at 4°C against deionized water to remove residual urea. The concentration of mPrP(113–231) was measured by its absorbance at 280 nm and confirmed by Bicinchoninic Acid (BCA) assay (Sigma).
Preparation of NMR sample
NMR samples contained; 0.6 mL of 3.15 mg/mL His tagged 15N mouse PrP(113–231) in 20 mM sodium acetate and 10% D2O at pH 5.32.
NMR resonance assignments
All NMR spectra were acquired at 30°C on a 600 MHz Bruker Avance spectrometer equipped with a 5 mm inverse detection triple-resonance z-gradient probe. Phase-sensitive 2D 15N-HSQC spectra were acquired using Echo-antiecho gradient selection. 1H acquisition parameters were 0.122 sec acquisition time, 1 sec fixed delay and 2048 complex (t2) points, whereas 256 complex points were collected for the 15N dimension. Thirty-two transients were recorded for each t1 interval. The 1H and 15N dimensions possessed spectral widths of 14 ppm and 32 ppm, respectively. The 15N dimension was zero filled to 256 data points before squared-cosine apodization and Fourier transformation. Three-dimensional phase sensitive 15N-HSQC-NOESY61 and 15N-HSQC-TOCSY spectra62 were acquired using Echo-antiecho gradient selection. The 3D 15N-HSQC-TOCSY and 3D 15N-HSQC-NOESY spectra were obtained using a mixing time of 60 ms and 150 ms, respectively. For both experiments, 2048 complex points were collected in the direct 1H dimension over a spectral width of 12 ppm, whereas 64 complex points and 160 complex points were collected for the indirect 15N and 1H dimensions respectively over a 15N spectral width of 32.2 ppm and a 1H spectral width of 12 ppm. Both spectra were zero filled to 2048 data points in the direct 1H dimension, 128 data points in the indirect 15N dimension and 512 data points in the indirect 1H dimension. All NMR data was processed in XWINNMR (Bruker) and analyzed in XEASY.63 Resonance assignments were made manually using sequential 1H NOE connectivities with comparison to assignments deposited in the Biological Magnetic Resonance Databank (www.bmrb.wisc.edu) for related mammalian prion proteins, in particular human and Syrian hamster PrP.
15N NMR relaxation measurements
All relaxation measurements were performed at a temperature of 30°C. The pulse sequences used to obtain T1, T2, and heteronuclear NOE spectra are those described by Farrow et al.,64 which employ gradient selection and sensitivity enhancement, as well as minimal water suppression.
Three pairs of saturated and non-saturated20-15N heteronuclear NOE experiments were recorded at 600 MHz (60.8 MHz 15N frequency). In the direct (1H) dimension, the carrier frequency was set on the water resonance with a spectral width of 14 ppm; the indirect (15N) dimension was centered at 118 ppm with a 30 ppm spectral width. 2K complex data points with 128 complex increments were collected. Each of the-15N NOE experiments was acquired with 80 scans.20 The 1H saturation was achieved by the application of 120° 1H pulses separated by 18 ms, for a 3 s period. In addition, a 4 sec recycle delay was used.
Twelve time points were collected for both T1 and T2 experiments, and each set included duplicate measurements to allow estimation of the uncertainty. The delays used were as follows:
T1 Delays = 2, 2, 64, 128, 256, 384, 512, 768, 768, 1024, 1024, 1536 ms
T2 Delays = 16, 16, 32, 48, 64, 96, 96, 128, 128, 192, 192, 256 ms
Repeated numbers indicate duplicate measurements. 15N T1 and T2 relaxation times were obtained from running phase-sensitive 2D 15N-HSQC spectra acquired with Echo/antiecho gradient selection as described above. Typical T1 experiments were acquired with 16 scans and a repetition delay of 3 sec, whereas T2 experiments were acquired with 16 scans and a 500 μs delay between 180 pulses in the Carr–Purcell–Meiboom–Gill (CPMG) pulse train and a 3 sec repetition delay.
NMR relaxation data processing
All spectra were processed using the Bruker NMR software. Spectra were zero filled to 4 K by 1 K points in the t2 and t1 dimensions respectively and were apodized using a phase-shifted sinebell squared function. Residual water signal was removed using a low frequency filter. Cross-peak intensity was measured as peak height rather than volume, to reduce errors associated with peak over-lap. Fourier transformed data was exported into the Tripos Sybyl 7.0 NMR TRIAD programmed. The peak height intensity was obtained by curve fitting to polynomial function for each peak. This is a preferred method rather than a searching for peak maximal which can introduce a systematic bias.65 Weak intensity peaks, at the longer relaxation delay times are particularly prone to systematic bias when a search routine to pick peak maxima is used.65
The heteronuclear NOE values were obtained from the ratio of peak intensity for 1H-saturated and unsaturated spectra. The mean and standard deviation for the heteronuclear-NOE data was calculated from three pairs of experiments. To obtain mono-exponential decay curves for T1 and T2 relaxation data peak intensities (by height) were fitted to a two-parameter equation: I(t) = I0e−t/Tn, where I = intensity, t = delay in CPMG or longitudinal delay, Tn = T1 or T2 value.66 This data was compared to relaxation values using a three parameter equation; I(t) = I∞ + I0e−t/Tn, where I∞ is the offset intensity from zero at infinite time. Comparison of relaxation values obtained using a two or three parameter fits confirmed that possible systematic errors and bias in the data had not been introduced by using a two-parameter fit.65 The standard error for the R1 and R2 values was determined directly from the curve fit routine.
Spectral density functions and order parameters
Reduced spectral densities map the motion of each NH bond at frequencies ω = 0, ωN, and 0.87ωH.34,35 Reduced spectral density assumes a single spectral density for J(ωH + ωN), J(ωH), and J(ωH−ωN) of J(0.87ωH). The spectral densities at these three frequencies were obtained using an in-house script; DUGGAN, from the relaxation rates R1 (1/T1), R2 (1/T2) and the hetero-nuclear NOE using four equations described by Farrow et al.34,67 and shown as Supporting Information. The constant for chemical shift anisotropy was set at −170 ppm and the NH bond length was set to 1.02 Å.39
The model-free formalism40,41 can be used to describe the motions of a protein in terms of a rotational correlation time (τc) and an order parameter (S2). The most widely used model-free formalism assumes isotropic tumbling.40,41 In this case, τc is identical for each amide. The approach selects various descriptors of the motion using statistical criteria as described by Mandel et al.42 We have chosen not to use this approach, instead here we have calculated an effective rotational correlation time (τc,i) at each residue directly from J(0) and J(ωN) spectral densities according to Eq. (1).36,37
| 1 |
Furthermore, an approximate order parameter (S2) has been obtained directly from J(0) and J(ωN) using Eq. (2).36,37
| 2 |
This approximation of S2 does not require the statistical selection of various descriptions of the motion42,68 as the calculation of the order parameter does not incorporate additional fast internal motions on the pico-second time scale (τe) or slower segmental motions on the milli- to micro-second time-scale (Rex). Furthermore, the rotation correlation time is permitted to vary, per-residue, removing the possible effects of an anisotropic rotational diffusion tensor. Although an approximation of the order parameter, the values represent a reasonable description of the amplitude of the nanosecond time scale motions, as the order parameter values (S2) are largely insensitive to the presence or absence of a descriptor for fast pico-second time scale (τe) motions. In addition, any residues that contains significant milli-to micro-second time-scale (Rex) motions can be identified from J(0) spectral densities.
Acknowledgments
C.E.J. acknowledges the support of the University of Queensland Postdoctoral Fellowship. The authors are grateful to Brendan Duggan for providing his script to calculate spectral densities. Also thanks to Grainne for the birth of Abbie Caoirmhe Viles, on March 27, 2008.
Glossary
Abbreviations
- BSE
bovine spongiform encephalopathy
- CJD
Creutzfeldt-Jacob disease
- GPI
glycosyl-phosphatidylinositol
- huPrP
human PrP
- mPrP
mouse PrP
- PrP
prion protein
- PrPC
cellular isoform of PrP
- PrPSc
scrapie isoform of PrP
- SHaPrP
Syrian hamster PrP
Supplemental material
References
- 1.Prusiner SB. Prions. Proc Natl Acad Sci USA. 1998;95:13363–13383. doi: 10.1073/pnas.95.23.13363. [DOI] [PMC free article] [PubMed] [Google Scholar]
- 2.Legname G, Baskakov IV, Nguyen HO, Riesner D, Cohen FE, DeArmond SJ, Prusiner SB. Synthetic mammalian prions. Science. 2004;305:673–676. doi: 10.1126/science.1100195. [DOI] [PubMed] [Google Scholar]
- 3.Silveira JR, Raymond GJ, Hughson AG, Race RE, Sim VL, Hayes SF, Caughey B. The most infectious prion protein particles. Nature. 2005;437:257–261. doi: 10.1038/nature03989. [DOI] [PMC free article] [PubMed] [Google Scholar]
- 4.Riek R, Hornemann S, Wider G, Billeter M, Glockshuber R, Wuthrich K. NMR structure of the mouse prion protein domain PrP(121–321) Nature. 1996;382:180–182. doi: 10.1038/382180a0. [DOI] [PubMed] [Google Scholar]
- 5.Donne DG, Viles JH, Groth D, Mehlhorn I, James TL, Cohen FE, Prusiner SB, Wright PE, Dyson HJ. Structure of the recombinant full-length hamster prion protein PrP(29–231): the N terminus is highly flexible. Proc Natl Acad Sci USA. 1997;94:13452–13457. doi: 10.1073/pnas.94.25.13452. [DOI] [PMC free article] [PubMed] [Google Scholar]
- 6.James TL, Liu H, Ulyanov NB, Farr-Jones S, Zhang H, Donne DO, Kaneko K, Groth D, Mehlhorn I, Prusiner SB, Cohen FE. Solution structure of a 142-residue recombinant prion protein corresponding to the infectious fragment of the scrapie isoform. Proc. Natl. Acad. Sci. USA. 1997;94:10086–10091. doi: 10.1073/pnas.94.19.10086. [DOI] [PMC free article] [PubMed] [Google Scholar]
- 7.Riek R, Wider G, Billeter M, Hornemann S, Glockshuber R, Wuthrich K. Prion protein NMR structure and familial human spongiform encephalopathies. Proc Natl Acad Sci USA. 1998;95:11667–11672. doi: 10.1073/pnas.95.20.11667. [DOI] [PMC free article] [PubMed] [Google Scholar]
- 8.Zahn R, Liu A, Luhrs T, Riek R, von Schroetter C, Lopez Garcia F, Billeter M, Calzolai L, Wider G, Wuthrich K. NMR solution structure of the human prion protein. Proc Natl Acad Sci USA. 2000;97:145–150. doi: 10.1073/pnas.97.1.145. [DOI] [PMC free article] [PubMed] [Google Scholar]
- 9.Lopez Garcia F, Zahn R, Riek R, Wuthrich K. NMR structure of the bovine prion protein. Proc Natl Acad Sci USA. 2000;97:8334–8339. doi: 10.1073/pnas.97.15.8334. [DOI] [PMC free article] [PubMed] [Google Scholar]
- 10.Calzolai L, Lysek DA, Perez DR, Guntert P, Wuthrich K. Prion protein NMR structures of chickens, turtles, and frogs. Proc Natl Acad Sci USA. 2005;102:651–655. doi: 10.1073/pnas.0408939102. [DOI] [PMC free article] [PubMed] [Google Scholar]
- 11.Gossert AD, Bonjour S, Lysek DA, Fiorito F, Wuthrich K. Prion protein NMR structures of elk and of mouse/elk hybrids. Proc Natl Acad Sci USA. 2005;102:646–650. doi: 10.1073/pnas.0409008102. [DOI] [PMC free article] [PubMed] [Google Scholar]
- 12.Lysek DA, Schorn C, Nivon LG, Esteve-Moya V, Christen B, Calzolai L, von Schroetter C, Fiorito F, Herrmann T, Guntert P, Wuthrich K. Prion protein NMR structures of cats, dogs, pigs, and sheep. Proc Natl Acad Sci USA. 2005;102:640–645. doi: 10.1073/pnas.0408937102. [DOI] [PMC free article] [PubMed] [Google Scholar]
- 13.Cobb NJ, Sonnichsen FD, McHaourab H, Surewicz WK. Molecular architecture of human prion protein amyloid: a parallel, in-register β-structure. Proc Natl Acad Sci USA. 2007;104:18946–18951. doi: 10.1073/pnas.0706522104. [DOI] [PMC free article] [PubMed] [Google Scholar]
- 14.Lu X, Wintrode PL, Surewicz WK. β-sheet core of human prion protein amyloid fibrils as determined by hydrogen/deuterium exchange. Proc Natl Acad Sci USA. 2007;104:1510–1515. doi: 10.1073/pnas.0608447104. [DOI] [PMC free article] [PubMed] [Google Scholar]
- 15.Viles JH, Donne D, Kroon G, Prusiner SB, Cohen FE, Dyson HJ, Wright PE. Local structural plasticity of the prion protein. Analysis of NMR relaxation dynamics. Biochemistry. 2001a;40:2743–2753. doi: 10.1021/bi002898a. [DOI] [PubMed] [Google Scholar]
- 16.Brown DR, Qin K, Herms JW, Madlung A, Manson J, Strome R, Fraser PE, Kruck T, von Bohlen A, Schulz-Schaeffer W, Giese A, Westaway D, Kretzschmar H. The cellular prion protein binds copper in vivo. Nature. 1997;390:684–687. doi: 10.1038/37783. [DOI] [PubMed] [Google Scholar]
- 17.Viles JH, Cohen FE, Prusiner SB, Goodin DB, Wright PE, Dyson HJ. Copper binding to the prion protestructural implications of four identical cooperative binding sites. Proc Natl Acad Sci USA. 1999;96:2042–2047. doi: 10.1073/pnas.96.5.2042. [DOI] [PMC free article] [PubMed] [Google Scholar]
- 18.Garnett AP, Viles JH. Copper binding to the octarepeats of the prion protein. Affinity, specificity, folding, and cooperativity: insights from circular dichroism. J Biol Chem. 2003;278:6795–6802. doi: 10.1074/jbc.M209280200. [DOI] [PubMed] [Google Scholar]
- 19.Jones CE, Abdelraheim SR, Brown DR, Viles JH. Preferential Cu2+ coordination by His96 and His111 Induces {β}-sheet formation in the unstructured amyloidogenic region of the prion protein. J Biol Chem. 2004;279:32018–32027. doi: 10.1074/jbc.M403467200. [DOI] [PubMed] [Google Scholar]
- 20.Jones CE, Klewpatinond M, Abdelraheim SR, Brown DR, Viles JH. Probing copper2+ binding to the prion protein using diamagnetic nickel2+ and 1H NMR: the unstructured N terminus facilitates the coordination of six copper2+ ions at physiological concentrations. J Mol Biol. 2005;346:1393–1407. doi: 10.1016/j.jmb.2004.12.043. [DOI] [PubMed] [Google Scholar]
- 21.Klewpatinond M, Davies P, Bowen S, Brown DR, Viles JH. Deconvoluting the Cu2+ binding modes of full-length prion protein. J Biol Chem. 2008;283:1870–1881. doi: 10.1074/jbc.M708472200. [DOI] [PubMed] [Google Scholar]
- 22.Zahn R. The octapeptide repeats in mammalian prion protein constitute a pH-dependent folding and aggregation site. J Mol Biol. 2003;334:477–488. doi: 10.1016/j.jmb.2003.09.048. [DOI] [PubMed] [Google Scholar]
- 23.Baskakov IV, Legname G, Baldwin MA, Prusiner SB, Cohen FE. Pathway complexity of prion protein assembly into amyloid. J Biol Chem. 2002;277:21140–21148. doi: 10.1074/jbc.M111402200. [DOI] [PubMed] [Google Scholar]
- 24.Swietnicki W, Morillas M, Chen SG, Gambetti P, Surewicz WK. Aggregation and fibrillization of the recombinant human prion protein huPrP90-231. Biochemistry. 2000;39:424–431. doi: 10.1021/bi991967m. [DOI] [PubMed] [Google Scholar]
- 25.Baskakov IV, Legname G, Prusiner SB, Cohen FE. Folding of prion protein to its native α-helical conformation is under kinetic control. J Biol Chem. 2001;276:19687–19690. doi: 10.1074/jbc.C100180200. [DOI] [PubMed] [Google Scholar]
- 26.Morillas M, Vanik DL, Surewicz WK. On the mechanism of α-helix to β-sheet transition in the recombinant prion protein. Biochemistry. 2001;40:6982–6987. doi: 10.1021/bi010232q. [DOI] [PubMed] [Google Scholar]
- 27.Gerber R, Tahiri-Alaoui A, Hore PJ, James W. Oligomerization of the human prion protein proceeds via a molten globule intermediate. J Biol Chem. 2007;282:6300–6307. doi: 10.1074/jbc.M608926200. [DOI] [PubMed] [Google Scholar]
- 28.O'Sullivan DB, Jones CE, Abdelraheim SR, Thompsett AR, Brazier MW, Toms H, Brown DR, Viles JH. NMR characterization of the pH 4 β-intermediate of the prion protethe N-terminal half of the protein remains unstructured and retains a high degree of flexibility. Biochem J. 2007;401:533–540. doi: 10.1042/BJ20060668. [DOI] [PMC free article] [PubMed] [Google Scholar]
- 29.Dayie KT, Wagner G, Lefevre JF. Theory and practice of nuclear spin relaxation in proteins. Annu Rev Phys Chem. 1996;47:243–282. doi: 10.1146/annurev.physchem.47.1.243. [DOI] [PubMed] [Google Scholar]
- 30.Palmer AG., III Probing molecular motion by NMR. Curr Opin Struct Biol. 1997;7:732–737. doi: 10.1016/s0959-440x(97)80085-1. [DOI] [PubMed] [Google Scholar]
- 31.Liu H, Farr-Jones S, Ulyanov NB, Llinas M, Marqusee S, Groth D, Cohen FE, Prusiner SB, James TL. Solution structure of Syrian hamster prion protein rPrP(90–231) Biochemistry. 1999;38:5362–5377. doi: 10.1021/bi982878x. [DOI] [PubMed] [Google Scholar]
- 32.Kuwata K, Kamatari YO, Akasaka K, James TL. Slow conformational dynamics in the hamster prion protein. Biochemistry. 2004;43:4439–4446. doi: 10.1021/bi036123o. [DOI] [PubMed] [Google Scholar]
- 33.Daniels M, Cereghetti GM, Brown DR. Toxicity of novel C-terminal prion protein fragments and peptides harbouring disease-related C-terminal mutations. Eur J Biochem. 2001;268:6155–6164. doi: 10.1046/j.0014-2956.2001.02567.x. [DOI] [PubMed] [Google Scholar]
- 34.Farrow NA, Zhang O, Forman-Kay JD, Kay LE. Comparison of the backbone dynamics of a folded and an unfolded SH3 domain existing in equilibrium in aqueous buffer. Biochemistry. 1995a;34:868–878. doi: 10.1021/bi00003a021. [DOI] [PubMed] [Google Scholar]
- 35.Peng JW, Wagner G. Frequency spectrum of NH bonds in eglin c from spectral density mapping at multiple fields. Biochemistry. 1995;34:16733–16752. doi: 10.1021/bi00051a023. [DOI] [PubMed] [Google Scholar]
- 36.Lefevre JF, Dayie KT, Peng JW, Wagner G. Internal mobility in the partially folded DNA binding and dimerization domains of GAL4: NMR analysis of the N-H spectral density functions. Biochemistry. 1996;35:2674–2686. doi: 10.1021/bi9526802. [DOI] [PubMed] [Google Scholar]
- 37.Bracken C, Carr PA, Cavanagh J, Palmer AG., IIIrd Temperature dependence of intramolecular dynamics of the basic leucine zipper of GCN4: implications for the entropy of association with DNA. J Mol Biol. 1999;285:2133–2146. doi: 10.1006/jmbi.1998.2429. [DOI] [PubMed] [Google Scholar]
- 38.Barbato G, Ikura M, Kay LE, Pastor RW, Bax A. Backbone dynamics of calmodulin studied by 15N relaxation using inverse detected two-dimensional NMR spectroscopy: the central helix is flexible. Biochemistry. 1992;31:5269–5278. doi: 10.1021/bi00138a005. [DOI] [PubMed] [Google Scholar]
- 39.Tjandra N, Wingfield P, Stahl S, Bax A. Anisotropic rotational diffusion of perdeuterated HIV protease from 15N NMR relaxation measurements at two magnetic fields. J Biomol NMR. 1996;8:273–284. doi: 10.1007/BF00410326. [DOI] [PubMed] [Google Scholar]
- 40.Lipari G, Szabo A. Model-free approach to the interpretation of nuclear magnetic resonance relaxation in macromolecules. 2. Analysis of experimental results. J Am Chem Soc. 1982;104:4559–4570. [Google Scholar]
- 41.Lipari G, Szabo A. Model-free approach to the interpretation of nuclear magnetic resonance relaxation in macromolecules. 1. Theory and range of validity. J Am Chem Soc. 1982;104:4546–4559. [Google Scholar]
- 42.Mandel AM, Akke M, Palmer AG., IIIrd Backbone dynamics of Escherichia coli ribonuclease HI: correlations with structure and function in an active enzyme. J Mol Biol. 1995;246:144–163. doi: 10.1006/jmbi.1994.0073. [DOI] [PubMed] [Google Scholar]
- 43.Farrow NA, Zhang O, Forman-Kay JD, Kay LE. Characterization of the backbone dynamics of folded and denatured states of an SH3 domain. Biochemistry. 1997;36:2390–2402. doi: 10.1021/bi962548h. [DOI] [PubMed] [Google Scholar]
- 44.Buevich AV, Baum J. Dynamics of unfolded proteins: Incorporation of distributions of correlation times in the model free analysis of NMR relaxation data. J Am Chem Soc. 1999;121:8671–8672. [Google Scholar]
- 45.Osborne MJ, Wright PE. Anisotropic rotational diffusion in model-free analysis for a ternary DHFR complex. J Biomol NMR. 2001;19:209–230. doi: 10.1023/a:1011283809984. [DOI] [PubMed] [Google Scholar]
- 46.Govaerts C, Wille H, Prusiner SB, Cohen FE. Evidence for assembly of prions with left-handed β-helices into trimers. Proc Natl Acad Sci USA. 2004;101:8342–8347. doi: 10.1073/pnas.0402254101. [DOI] [PMC free article] [PubMed] [Google Scholar]
- 47.Peretz D, Williamson RA, Matsunaga Y, Serban H, Pinilla C, Bastidas RB, Rozenshteyn R, James TL, Houghten RA, Cohen FE, Prusiner SB, Burton DR. A conformational transition at the N terminus of the prion protein features in formation of the scrapie isoform. J Mol Biol. 1997;273:614–622. doi: 10.1006/jmbi.1997.1328. [DOI] [PubMed] [Google Scholar]
- 48.Turk E, Teplow DB, Hood LE, Prusiner SB. Purification and properties of the cellular and scrapie hamster prion proteins. Eur J Biochem. 1988;176:21–30. doi: 10.1111/j.1432-1033.1988.tb14246.x. [DOI] [PubMed] [Google Scholar]
- 49.Hosszu LL, Baxter NJ, Jackson GS, Power A, Clarke AR, Waltho JP, Craven CJ, Collinge J. Structural mobility of the human prion protein probed by backbone hydrogen exchange. Nat Struct Biol. 1999;6:740–743. doi: 10.1038/11507. [DOI] [PubMed] [Google Scholar]
- 50.Nicholson EM, Mo H, Prusiner SB, Cohen FE, Marqusee S. Differences between the prion protein and its homolog Doppel: a partially structured state with implications for scrapie formation. J Mol Biol. 2002;316:807–815. doi: 10.1006/jmbi.2001.5347. [DOI] [PubMed] [Google Scholar]
- 51.Wildegger G, Liemann S, Glockshuber R. Extremely rapid folding of the C-terminal domain of the prion protein without kinetic intermediates. Nat Struct Biol. 1999;6:550–553. doi: 10.1038/9323. [DOI] [PubMed] [Google Scholar]
- 52.Hosszu LL, Wells MA, Jackson GS, Jones S, Batchelor M, Clarke AR, Craven CJ, Waltho JP, Collinge J. Definable equilibrium states in the folding of human prion protein. Biochemistry. 2005;44:16649–16657. doi: 10.1021/bi051277k. [DOI] [PubMed] [Google Scholar]
- 53.Kuwata K, Li H, Yamada H, Legname G, Prusiner SB, Akasaka K, James TL. Locally disordered conformer of the hamster prion protea crucial intermediate to PrPSc? Biochemistry. 2002;41:12277–12283. doi: 10.1021/bi026129y. [DOI] [PubMed] [Google Scholar]
- 54.Kundu B, Maiti NR, Jones EM, Surewicz KA, Vanik DL, Surewicz WK. Nucleation-dependent conformational conversion of the y145stop variant of human prion protestructural clues for prion propagation. Proc Natl Acad Sci USA. 2003;100:12069–12074. doi: 10.1073/pnas.2033281100. [DOI] [PMC free article] [PubMed] [Google Scholar]
- 55.Collinge J, Sidle KC, Meads J, Ironside J, Hill AF. Molecular analysis of prion strain variation and the aetiology of ‘new variant’ CJD. Nature. 1996;383:685–690. doi: 10.1038/383685a0. [DOI] [PubMed] [Google Scholar]
- 56.Kaneko K, Zulianello L, Scott M, Cooper CM, Wallace AC, James TL, Cohen FE, Prusiner SB. Evidence for protein X binding to a discontinuous epitope on the cellular prion protein during scrapie prion propagation. Proc Natl Acad Sci USA. 1997;94:10069–10074. doi: 10.1073/pnas.94.19.10069. [DOI] [PMC free article] [PubMed] [Google Scholar]
- 57.Mo H, Moore RC, Cohen FE, Westaway D, Prusiner SB, Wright PE, Dyson HJ. Two different neurodegenerative diseases caused by proteins with similar structures. Proc Natl Acad Sci USA. 2001;98:2352–2357. doi: 10.1073/pnas.051627998. [DOI] [PMC free article] [PubMed] [Google Scholar]
- 58.Zahn R, Guntert P, von Schroetter C, Wuthrich K. NMR structure of a variant human prion protein with two disulfide bridges. J Mol Biol. 2003;326:225–234. doi: 10.1016/s0022-2836(02)01332-3. [DOI] [PubMed] [Google Scholar]
- 59.Sawaya MR, Sambashivan S, Nelson R, Ivanova MI, Sievers SA, Apostol MI, Thompson MJ, Balbirnie M, Wiltzius JJ, McFarlane HT, Madsen AO, Riekel C, Eisenberg D. Atomic structures of amyloid cross-beta spines reveal varied steric zippers. Nature. 2007;447:453–457. doi: 10.1038/nature05695. [DOI] [PubMed] [Google Scholar]
- 60.Wong BS, Wang H, Brown DR, Jones IM. Selective oxidation of methionine residues in prion proteins. Biochem Biophys Res Commun. 1999;259:352–355. doi: 10.1006/bbrc.1999.0802. [DOI] [PubMed] [Google Scholar]
- 61.Kay L, Keifer P, Saarinen T. Pure absorption gradient enhanced heteronuclear single quantum correlation spectroscopy with improved sensitivity. J Am Chem Soc. 1992;114:10663–10665. [Google Scholar]
- 62.Zhang O, Kay LE, Olivier JP, Forman-Kay JD. Backbone 1H and 15N resonance assignments of the N-terminal SH3 domain of drk in folded and unfolded states using enhanced-sensitivity pulsed field gradient NMR techniques. J Biomol NMR. 1994;4:845–858. doi: 10.1007/BF00398413. [DOI] [PubMed] [Google Scholar]
- 63.Bartels C, Xia T-H, Billeter M, Guntert M, Wuthrichk K. The program XEASY for computer-supported NMR spectral analysis of biological macromolecules. J Biomol NMR. 1995;5:1–10. doi: 10.1007/BF00417486. [DOI] [PubMed] [Google Scholar]
- 64.Farrow NA, Muhandiram R, Singer AU, Pascal SM, Kay CM, Gish G, Shoelson SE, Pawson T, Forman-Kay JD, Kay LE. Backbone dynamics of a free and phosphopeptide-complexed Src homology 2 domain studied by 15N NMR relaxation. Biochemistry. 1994;33:5984–6003. doi: 10.1021/bi00185a040. [DOI] [PubMed] [Google Scholar]
- 65.Viles JH, Duggan BM, Zaborowski E, Schwarzinger S, Huntley JJ, Kroon GJ, Dyson HJ, Wright PE. Potential bias in NMR relaxation data introduced by peak intensity analysis and curve fitting methods. J Biomol NMR. 2001b;21:1–9. doi: 10.1023/a:1011966718826. [DOI] [PubMed] [Google Scholar]
- 66.Stone MJ, Fairbrother WJ, Palmer AG, IIIrd, Reizer J, Saier MH, Jr, Wright PE. Backbone dynamics of the Bacillus subtilis glucose permease IIA domain determined from 15N NMR relaxation measurements. Biochemistry. 1992;31:4394–4406. doi: 10.1021/bi00133a003. [DOI] [PubMed] [Google Scholar]
- 67.Farrow NA, Zhang O, Szabo A, Torchia DA, Kay LE. Spectral density function mapping using 15N relaxation data exclusively. J Biomol NMR. 1995b;6:153–162. doi: 10.1007/BF00211779. [DOI] [PubMed] [Google Scholar]
- 68.d'Auvergne EJ, Gooley PR. The use of model selection in the model-free analysis of protein dynamics. J Biomol NMR. 2003;25:25–39. doi: 10.1023/a:1021902006114. [DOI] [PubMed] [Google Scholar]
Associated Data
This section collects any data citations, data availability statements, or supplementary materials included in this article.