

Abstract
Proline dehydrogenase (PRODH) and Δ1-pyrroline-5-carboxylate dehydrogenase (P5CDH) catalyze the two-step oxidation of proline to glutamate. They are distinct monofunctional enzymes in all eukaryotes and some bacteria, but are fused into bifunctional enzymes known as Proline utilization A (PutA) in other bacteria. Here we report the first structure and biochemical data for a monofunctional PRODH. The 2.0 Å resolution structure of Thermus thermophilus PRODH reveals a distorted (βα)8 barrel catalytic core domain and a hydrophobic α-helical domain located above the carboxyl terminal ends of the strands of the barrel. Although the catalytic core is similar to that of the PutA PRODH domain, the FAD conformation of T. thermophilus PRODH is remarkably different and likely reflects unique requirements for membrane association and communication with P5CDH. Also, the FAD of T. thermophilus PRODH is highly solvent exposed compared to PutA due to a 4-Å shift of helix 8. Structure-based sequence analysis of the PutA/PRODH family led us to identify 9 conserved motifs involved in cofactor and substrate recognition. Biochemical studies show that the midpoint potential of the FAD is −75 mV and the kinetic parameters for proline are Km=27 mM and kcat=13 s−1. 3,4-dehydro-L-proline was found to be an efficient substrate and L-tetrahydro-2-furoic acid is a competitive inhibitor (KI=1.0 mM). Finally, we demonstrate that T. thermophilus PRODH reacts with O2 producing superoxide. This is significant because superoxide production underlies the role of human PRODH in p53-mediated apoptosis, implying commonalities between eukaryotic and bacterial monofunctional PRODHs.
Oxidation of amino acids is a central part of energy metabolism. The oxidative pathway for proline consists of two enzymatic steps and an intervening nonenzymatic equilibrium (Scheme 1 (1,2)). The first enzymatic step transforms proline to Δ1-pyrroline-5-carboxylate (P5C), which is nonenzymatically hydrolyzed to glutamic semialdehyde. The semialdehyde is oxidized in the second enzymatic step to glutamate.
Scheme 1.

This 4-electron transformation of proline is common to all organisms, but the enzymes of proline catabolism differ widely among the three kingdoms of life. Amino acid sequence analysis shows that bacteria and eukaryotes share a common set of proline catabolic enzymes called proline dehydrogenase (PRODH) and P5C dehydrogenase (P5CDH). Studies of the bacterial enzymes have shown that PRODH is an FAD-dependent enzyme with a (βα)8 barrel catalytic core (3,4), and P5CDH is an NAD+-dependent Rossmann fold enzyme featuring a nucleophilic Cys (5). These enzymes are unrelated in sequence and structure to hyperthermophilic archaeal proline catabolic enzymes, which appear in unique hetero-tetrameric and hetero-octameric complexes (6).
An intriguing aspect of proline catabolism in eukaryotes and bacteria is that PRODH and P5CDH are separate enzymes in some organisms, whereas the two enzymes are fused in other organisms. The traditional view has been that PRODH and P5CDH appear as separate enzymes in eukaryotes and fused bifunctional enzymes known as Proline utilization A (PutA, (7–15)) in bacteria. Fusion of enzymes catalyzing sequential steps of a metabolic pathway provides a kinetic advantage because the intermediate can be channeled between active sites (16,17). Indeed, Maloy’s group reported kinetic data supporting substrate channeling for Salmonella typhimurium PutA (18). Eisenberg and co-workers refer to fused proteins, such as PutA, as Rosetta Stone proteins because they decipher interactions between protein pairs (19). Thus, the Rosetta Stone hypothesis of protein evolution predicts that eukaryotic PRODH and P5CDH form physical and functional interactions.
As we elaborate in this paper, separate PRODH and P5CDH enzymes are not restricted to eukaryotes, but also appear in some bacteria. These bacterial monofunctional enzymes thus represent a new and unexplored group of enzymes. In addition, bacterial monofunctional PRODHs may serve as good models for understanding human PRODH. Moreover, the bacterial enzymes are convenient systems for studying protein-protein interactions and intermolecular channeling. To begin exploring these questions, we previously reported the cloning, isolation and crystallization of the monofunctional PRODH from Thermus thermophilus (TtPRODH) (20). Here we report the crystal structure and kinetic characterization of this enzyme.
EXPERIMENTAL PROCEDURES
Expression, Purification and Crystallization of Se-Met TtPRODH
A 10 mL overnight culture grown in LB media was pelleted and the LB medium was removed. The cells were resuspended in 3 mL M9 media and diluted into 1.5 L of M9 media. The culture was then grown to an optical density of 0.5 (λ = 600 nm). Methionine production was inhibited for 30 minutes as described previously (21) followed by induction of protein expression by the addition of 0.5 mM IPTG. After 12 hours of induction at 22 °C with a shaking rate of 200 rpm, cells were harvested, resuspended in 50 mM NaH2PO4 at pH 8.0, 300 mM NaCl, 10 mM imidazole, 1 mM DTT and 5% glycerol, and frozen.
Se-Met TtPRODH was purified using procedures described for purification of TtPRODH (20), except for the following modifications. As observed for native TtPRODH, the pellet obtained after centrifugation of lysed cells was bright yellow, indicating that a significant amount of Se-Met TtPRODH was bound to the cell debris in addition to Se-Met TtPRODH in the supernatant. Therefore, the enzyme was extracted from the pellet by resuspending the pellet in 20 mL of 20 mM n-octyl β-D-glucopyranoside, 50 mM NaH2PO4, 300 mM NaCl, 10 mM imidazole, 1 mM DTT, 5% glycerol, pH 8.0, followed by centrifugation. The detergent extraction step was repeated 1–2 times until no additional TtPRODH was liberated. The extracted protein was then purified using Ni-NTA chromatography as described previously (20).
Purified Se-Met TtPRODH was dialyzed overnight in the dark into 4 L of 50 mM Tris-HCl pH 8.0, 50 mM NaCl, 0.5 mM EDTA, 5 mM DTT, 0.1 mM FAD and 5 % glycerol using 10000 MWCO dialysis tubing (Spectrum Spectra/Por). After dialysis, the enzyme was passed through a 12 mL Sephadex G-25 desalting column (GE Healthcare) to remove excess FAD and then concentrated to 13 mg/mL using centrifugal concentrating devices (Amicon, Millipore). Protein concentration was estimated using the Bradford method (Pierce Coomassie Plus). Molecular masses of Se-Met and native TtPRODH obtained from MALDI-TOF mass spectrometry were 38208 ± 6 Da and 37968 ± 3Da, respectively, which indicated 100 % incorporation of Se-Met into all 5 Met positions of the TtPRODH polypeptide chain.
Se-Met TtPRODH was crystallized using procedures described previously for native TtPRODH (20). Briefly, crystals were grown at room temperature in sitting drops by mixing equal volumes of the enzyme (2 μL) and reservoir (2 μL) solutions. The enzyme solution contained 2 –3 mg/mL Se-Met TtPRODH and 20 mM of fresh n-octyl β-D thioglucopyranoside. The reservoir solution consisted of 100 mM imidazole pH = 7, 100 mM MgCl2, 17% MPD and 5 mM DTT. The crystals typically appeared within one day after setup and grew to a maximum dimension of 0.2 mm. Crystals were prepared for cryogenic data collection by soaking in 100 mM imidazole pH = 7, 200 mM MgCl2 and 25 % MPD, picked up with Hampton mounting loops and plunged into liquid nitrogen.
The space group is P212121 with unit cell dimensions of a = 82.1 Å, b = 89.6 Å, and c = 94.3 Å. There are two protein molecules per asymmetric unit, with 46 % solvent content and Matthews coefficient of 2.3 Å3 Da−1 (22).
X-ray Diffraction Data Collection, Phasing and Refinement
Data were collected at Advanced Light Source beamline 4.2.2 using a NOIR-1 CCD detector. The structure was solved using single-wavelength anomalous diffraction (SAD) phasing using data collected at the energy corresponding to the experimentally determined maximum of f″. The data set used for structure determination and refinement consisted of 180 frames with crystal-to-detector distance of 170 mm, oscillation range of 1°/frame and exposure time of 30 s/frame. Integration and scaling were performed with d*TREK (23). Data collection and processing statistics are listed in Table 1.
Table 1.
Data Collection and Refinement Statisticsa
| Wavelength (Å) | 0.97932 |
| Diffraction resolution (Å) | 47.16–2.00 |
| No. of observations | 292071 |
| No. of unique reflections | 46775 |
| Redundancy | 6.24 (3.12) |
| Completeness (%) | 98.0 (86.3) |
| Rmerge | 0.079 (0.399) |
| Average I/σ | 13.6 (3.0) |
| Wilson B-factor (Å2) | 16 |
| PDB accession code | 2G37 |
| No. of protein chains | 2 |
| No. of protein residues | 592 |
| No. of protein atoms | 5184 |
| No. of water molecules | 272 |
| Rcryst | 0.190 (0.242) |
| Rfreeb | 0.231 (0.362) |
| RMSDc | |
| Bond lengths (Å) | 0.014 |
| Bond angles (deg.) | 1.5 |
| Ramachandran plotd | |
| Favored (%) | 94.4 |
| Allowed (%) | 5.4 |
| Generously allowed (%) | 0.2 |
| Average B-factors (Å2) | |
| Protein | 16 |
| Water | 16 |
| FAD | 17 |
SOLVE (24) was used to identify a constellation of anomalous scattering centers and the resulting SAD phases were improved with solvent flattening in RESOLVE (24). The partial chain trace from RESOLVE was used to determine the non-crystallographic symmetry transformation relating the two molecules in the asymmetric unit. The RESOLVE phases were then improved with non-crystallographic symmetry averaging and solvent flattening in DM (25). The DM phases were input to ARP/wARP for automated model building (26). The model from ARP/wARP was improved with several rounds of model building in COOT followed by refinement against the Se-Met peak data set with REFMAC5 (27). Topology and parameter files for FAD were created using PRODRG (28) and the Libcheck module of CCP4i (29,30).
The final model includes residues 5-296 of TtPRODH chain A and residues 1-294 of TtPRODH chain B. In addition, 6 residues of the N-terminal affinity tag were built for chain B (residues −5 to 0). The C-terminal ends of the protein are disordered with residues 297-307 and 295-307 omitted in chains A and B, respectively. The model also includes 1 FAD cofactor per TtPRODH chain, 272 water molecules and 4 MPD molecules. See Table 1 for refinement statistics. Coordinates and structure factor amplitudes have been deposited in the Protein Data Bank (PDB, (31)) under accession number 2G37.
PRODH Kinetic Characterization
TtPRODH was expressed in E. coli and purified as described previously (20). The purified enzyme was dialyzed into buffer containing 50 mM Tris-HCl, 50 mM NaCl, 0.5 mM EDTA, 0.5 mM DTT and 5% glycerol at pH 8.0 and stored at 4° C. PRODH activity was measured using the proline -dichlorophenolindophenol (DCPIP) oxidoreductase assay as described previously for PutAs (11). One unit of PRODH activity is the quantity of enzyme that transfers electrons from 1 μmol of proline to DCPIP per minute at 25°C. Steady-state kinetic parameters for L-proline were obtained using the DCPIP assay with proline as the variable substrate in the range of 0.1–100 mM. Three trials were performed for each proline concentration. The parameters Km and Vmax were obtained by fitting the data to the Michaelis-Menten equation using Origin software. Kinetic constants for an alternative substrate, 3,4-dehydro-L-proline, were determined similarly, with the substrate concentration varied in the range 3–500 μM. Inhibition by L-tetrahydro-2-furoic acid (THFA), L-lactate and L-mandelate were examined by steady-state inhibition kinetic measurements using proline as the variable substrate. Inhibition data were analyzed using the method of Dixon (32).
Thermostability was assessed by measuring PRODH activity as a function of incubation time at 90 °C. For this study, the enzyme was incubated in a water bath at 90 °C and aliquots were removed at various time points and stored at 4 °C. After all of the aliquots were taken and cooled to 4 °C, activity assays were conducted at 25 °C in the presence of 25 mM proline.
UV-visible Spectroscopy
Potentiometric titrations of TtPRODH were recorded at 20 °C in 50 mM potassium phosphate buffer (pH 7.5) containing 50 mM NaCl and 5 % glycerol using a three - electrode single compartment spectroelectrochemical cell as previously described (14,33). Measurements were made under a nitrogen atmosphere in a Belle Technology glove box. All potential values are reported versus the normal hydrogen electrode. Methyl viologen (20 μM) was used as a mediator dye and pyocyanine (5 μM) and indigo disulfonate (3 μM) were used as indicator dyes. The UV-visible spectra in each experiment were recorded for λ = 300–700 nm on a Cary 100 spectrophotometer. Clean spectra of TtPRODH were obtained by subtracting the spectra of the dyes in the absence of protein measured under identical conditions. The reduction potential (Em) and n values were calculated by linear regression of a Nernst plot of the data.
TtPRODH was also titrated with proline under aerobic conditions in the proline concentration range 0 – 160 mM. At each proline concentration, the absorbance spectrum was acquired after incubating the enzyme (56 μM) for 5 minutes with proline. The absorbance values at λ = 450 nm were analyzed as previously described (11,34) to obtain an apparent equilibrium constant for the formation of a reduced enzyme-P5C complex (eq. 1).
| (1) |
Proline:O2 Reactivity and Generation of Reactive Oxygen Species
The rate of proline:O2 activity was determined by monitoring the appearance of P5C as a function of proline concentration in the absence of an artificial electron acceptor. P5C was detected as the yellow dihydroquinazolinium complex with o-aminobenzaldehyde (o-AB) by monitoring absorbance at λ = 443 nm (ε = 2900 M−1cm−1 (35)). The assay mixture included 50 mM potassium phosphate buffer pH=7.5, 20 μg of TtPRODH, 4 mM o-AB and 0.5 – 25 mM proline. The reaction was monitored for 15 minutes and data from the 5–10 minute time period were used for rate calculations. One unit of proline:O2 activity is defined as the amount of TtPRODH that generates 1 μmol of P5C per minute at 25 °C.
Production of superoxide by TtPRODH was studied by measuring reduction of cytochrome c as described previously (36). Reduction of cytochrome c was indicated by an increase in absorbance at λ = 550 nm. For these assays, the L-proline concentration was 50 mM and the concentrations of cytochrome c and TtPRODH were 0.02 mg/mL each. Production of H2O2 by TtPRODH (0.02 mg/mL) was measured using the Amplex Red H2O2/peroxidase assay kit (Molecular Probes – Invitrogen) and a standard curve obtained from solutions of known H2O2 concentration.
Bioinformatics Analysis of the Bacterial PutA/PRODH Family
Multiple sequence alignment calculations of PutA PRODH domains and bacterial monofunctional PRODHs were performed with ClustalW (37). The data set of sequences used for these calculations was obtained from the Protein Information Resource (PIR) using the Related Sequences tool with TtPRODH as the query sequence. A total of 287 homologs of TtPRODH were identified.
RESULTS
Overall Fold
The TtPRODH structure was determined at 2.0 Å resolution using Se-Met SAD phasing (Table 1). There are two protein chains in the asymmetric unit, labeled A and B, and 1 FAD cofactor bound to each protein (Fig. 1A). The structure reveals a distorted (βα)8 barrel fold. The first strand of the barrel (β1) is preceded by 4 α-helices denoted αA, αB, αC and α0 (Fig. 1A, right side provides best view). The major distortion of the TtPRODH barrel from the classic triosephosphate isomerase (TIM) barrel concerns the placement of α8. Helix α0 packs against β1 thus occupying the location reserved for α8 in the classic TIM barrel. Consequently, α8 of TtPRODH is located above the carboxyl terminal face of the β-barrel rather than alongside the β-barrel as in the classic TIM structure.
Figure 1. Overall structure of TtPRODH.

A, ribbon drawing of the two TtPRODH molecules in the asymmetric unit. The protein chains are colored in the rainbow scheme, with dark blue at the N-terminus and red at the C-terminus. Selected α-helices and β-strands are labeled. The FADs are drawn as stick models in yellow. The glycine hinge between β8 and α8 is noted (Gly279).
B, the solvent exposed hydrophobic patch formed by α-helices A, B, C and 8. The orientation is similar to that of the right hand protein in panel A. Side chains of the patch are colored green.
C, surface representation of the hydrophobic patch. The orientation is identical to that of panel B. This figure and others were created with PyMOL (59).
The FAD cofactor of TtPRODH is bound at the carboxyl ends of the strands of the barrel (Fig. 1A). The re face of the isoalloxazine packs tightly against strands 4–6, while the si face opens to the substrate binding pocket and is available for hydride transfer from the substrate proline.
Helices A–C and 8 form a small domain above the carboxyl terminal face of the β-barrel (Fig. 1A, right side provides best view). Helices A and B form a right angle, as do helices B and C. Helix 8 fits into the cleft formed by helices A–C. These four helices pack together to form a solvent exposed hydrophobic patch (Figs. 1B, 1C). The patch has a pronounced hole in the middle (Fig. 1C). Several hydrophobic side chains form the rim of the hole and line its sides, while the hydroxyl groups of Thr287 and Tyr283 form the bottom of the hole (Figs. 1B, 1C). If TtPRODH interacts with T. thermophilus P5CDH (TtP5CDH), then the function of the hydrophobic patch may be to serve as a docking interface for TtP5CDH. The patch presents a concave hydrophobic surface to solvent (Fig. 1C) and thus it is tempting to speculate that this patch mates with a complementary convex surface of TtP5CDH. Involvement of this patch in interaction with TtP5CDH also makes sense for substrate channeling because the patch is close to the TtPRODH active site.
The pair of molecules chosen for the asymmetric unit corresponds to the largest interface in the crystal lattice, which buries 992 Å2 of surface area. The two molecules interact primarily through the packing of α5 (residues 200-218) of one chain against α5 and α6 (residues 228-242) of the other chain (Fig. 1A). The orientation of the two molecules is such that the α5 helices form an angle of 50°. The interface has 4 intermolecular ion pairs (Lys213-Glu207, Arg230-Asp200) and 4 intermolecular hydrogen bonds (His210-His210, Tyr238-Glu170). Several hydrophobic side chains are also buried in the interface: Phe198, Leu203, Leu209, Leu214.
The significance of this interface is unclear at this time. It is not the one typically found in dimeric TIM, nor is it similar to the tetramer interface of archaeal TIMs (38). The classic TIM dimer interface involves loops 1–4 (38) and buries about 1500 Å2 of surface area, which is 50 % larger than the TtPRODH interface. Analysis of detergent solublized TtPRODH with dynamic light scattering and gel filtration suggests the presence of apparent monomeric and dimeric species. It is possible that the pair of proteins in the asymmetric unit represents the dimeric species observed in solution, however, it is also possible that this interface is an artifact of crystallization. An additional complicating factor in assessing the biological relevance of this interface is the possibility that TtPRODH interacts with TtP5CDH.
The TtPRODH structure is only the second PRODH structure solved to date, with the first being the PRODH domain of E. coli PutA (PutA86-669, PDB code 1TIW (3,4)). Residues 263 - 561 of PutA form a distorted TIM barrel that is similar to that of TtPRODH (Fig. 2A). Within this catalytic core, the sequence identity between the two enzymes is 29 % and the root mean square deviation for Cα atoms is 1.7 Å for 243 aligned residues. Also, the general location of the FAD at the carboxyl-terminal tips of the strands is similar in the two structures.
Figure 2. Comparison of TtPRODH and PutA86-669 complexed with THFA.

A, superposition of TtPRODH (blue) and PutA86-669/THFA (white, PDB code 1TIW). The FAD cofactors of TtPRODH and PutA86-669 are colored yellow and green, respectively. Glu65 of TtPRODH is drawn in stick mode. Trp438 of PutA86-669, which stacks against the FAD adenine, is also drawn. The dashed lines indicate the Glu289-Arg555 ion pair in PutA86-669.
B, space-filling representation of TtPRODH emphasizing solvent exposure of the FAD (yellow). Helix α8 is colored magenta. Tyr190 is shown in green. The orientation is similar to that of panel A.
The major topological difference between the TtPRODH and the PutA86-669 barrels is an extra α-helix that appears in PutA86-669 but is absent in TtPRODH. Residues 437-449 of PutA form an α-helix (α5a in Fig. 2A) that is replaced by a 5-residue loop in TtPRODH (residues 190-195). As discussed in the next section, this topological difference has a dramatic effect on FAD conformation.
FAD Conformation
Over a dozen residues interact with the FAD either through electrostatic or nonpolar interactions. Electrostatic interactions with the FAD are shown in Fig. 3. The five hydrogen bonds to the isoalloxazine in TtPRODH are also present in PutA86-669 structures. Accordingly, the positioning of the isoalloxazine within the barrel is similar in TtPRODH and PutA86-669.
Figure 3. Stereographic drawing of protein-FAD interactions in TtPRODH.

The dotted lines indicate hydrogen bonds and ion pairs. The FAD is colored yellow. Residues interacting with FAD are colored green. Strands β4 and β6 are indicated.
Surprisingly, the FAD conformations of the two enzymes are dramatically different (Fig. 4). In TtPRODH the adenosine is under the dimethyl benzene ring of the isoalloxazine (Fig. 4A), whereas in PutA86-669 the adenosine is below the pyrimidine ring of the isoalloxazine (Fig. 4B). The difference is dramatic. When superimposed, the adenine groups of the two cofactors are separated by 13 Å (Fig. 4B).
Figure 4. Comparison of the FAD conformations of TtPRODH and PutA86-669.

A, two views of the FAD from TtPRODH covered by an experimental electron density map (1σ). The map was calculated using |Fobs| and experimental phases after density modification.
B, stereographic view of the FAD cofactors from TtPRODH (yellow C atoms, orange P atoms), PutA86-669/THFA (green C atoms, cyan P atoms) and dithionite-reduced PutA86-669 (white C atoms, cyan P atoms). The 2′-OH and 4′-OH groups of TtPRODH are indicated. Note that the 2′-OH groups of TtPRODH and dithionite-reduced PutA86-669 superimpose nearly perfectly, whereas the 2′-OH group of PutA86-669/THFA points toward the viewer. The orange dotted lines denote hydrogen bonds in the TtPRODH cofactor. The black dotted lines denote hydrogen bonds in the PutA86-669 cofactors. The 3′–OH hydrogen bond to the ribose is present in both PutA86-669 structures but only one dotted line is drawn for clarity.
Accordingly, the interactions involving the ribityl, pyrophosphate and adenosine groups are different in the two enzymes. For example, in TtPRODH the ribityl 2′-OH is tucked under the pyrimidine ring of the isoalloxazine so that it forms hydrogen bonds with N1 of FAD (2.7 Å, Fig. 4B) and the amine of Gly188 (Fig. 3). Gly188 is located on the loop between β5 and α5, which passes below the pyrimidine ring (Fig. 3). The 3′-OH of TtPRODH is also directed toward this loop, but does not form hydrogen bonds with the loop. The 4′-OH is approximately trans to 3′-OH and it forms a hydrogen bond to the pyrophosphate (3.0 Å, Fig. 4B). In contrast, in PutA86-669 the 2′-OH and 3′-OH groups are rotated approximately 90° from the corresponding groups of TtPRODH (Fig. 4B). Moreover, the 4′-OH of PutA86-669 is rotated 180° from that of TtPRODH and forms an intramolecular hydrogen bond with a ribose hydroxyl (Fig. 4B).
As noted above, the adenine bases of TtPRODH and PutA86-669 are separated by 13 Å. This is due to different dihedral angle rotations of the pyrophosphate (Fig. 4B). In TtPRODH, the adenine sits atop the N-terminal ends of α6 and α7 (Fig. 1A, right side provides best view). In contrast, the adenine of PutA86-669 packs against α5a and forms an intimate stacking interaction with Trp438 (Fig. 2A).
Three factors contribute to the strikingly different FAD conformations in TtPRODH and PutA. First, Asp228 of TtPRODH replaces Asn488 of PutA. Although this seems like a conservative change, the structural ramifications are significant. Asn488 forms a hydrogen bond to the FAD pyrophosphate in PutA (Fig. 5A). Changing this residue to Asp not only eliminates the hydrogen bond but also creates electrostatic repulsion between the Asp228 carboxylate and the pyrophosphate. Apparently, this electrostatic clash is avoided in TtPRODH by rotation of the pyrophosphate dihedral angle so that the adenosine half of the pyrophosphate faces away from Asp288 (Fig. 5A). Note that Asp288 forms an ion pair with Lys187, which in turn, forms an ion pair with the pyrophosphate (Fig. 5A). It is concluded that Asp288 helps set up the FAD conformation in TtPRODH by electrostatic repulsion with the pyrophosphate and electrostatic attraction to Lys187.
Figure 5. Comparison of the active sites of TtPRODH (yellow) and PutA86-669/THFA (white).

A, stereographic drawing emphasizing differences between the two enzymes in interactions with the pyrophosphate and adenosine moieties. Residues are labelled as TtPRODH/PutA86-669. The orange and black dotted lines denote hydrogen bonds in TtPRODH and PutA86-669, respectively.
B, stereographic drawing showing differences between the two enzymes in the proline-binding pocket. The inhibitor THFA is shown in green. Residues are labelled as TtPRODH/PutA86-669. The orange and black dotted lines denote hydrogen bonds in TtPRODH and PutA86-669, respectively. For clarity, Y275/Y540, which form hydrogen bonds with D133/D370, are not labeled.
The other two factors contributing to the different FAD conformations are two helices that are present in PutA but absent in TtPRODH. As noted in the previous section, PutA α5a is replaced by a short loop in TtPRODH (Fig. 5A). Thus, TtPRODH does not have a residue equivalent to PutA Trp438 for stacking against the adenine (Fig. 5A). In addition, PutA86-669 has extra secondary structural elements following α8, owing to its longer polypeptide length. These extra elements are presumably important for linking the PRODH and P5CDH domains of PutA. One of these elements, a helix formed by PutA residues 565-570, is found to clash with the adenosine of TtPRODH when the two structures are superimposed (clash distances < 1 Å, Fig. 2A). Thus, steric considerations prevent PutA86-669 from accommodating the FAD in the conformation observed in TtPRODH.
The aforementioned analysis compared conformations of oxidized cofactors from TtPRODH and PutA86-669. We recently reported the structure of dithionite-reduced PutA86-669 and showed that reduction of the FAD induces a 22° bend of the isoalloxazine and rotation of the 2′-OH by 90° so that it is tucked under the pyrimidine ring and forms a hydrogen bond to the FAD N1 (39). Thus, the conformations of the 2′-OH groups of oxidized TtPRODH and reduced PutA86-669 are identical (Fig. 4B, compare yellow and white FADs). Electron density maps show that the isoalloxazine ring in TtPRODH is planar (Fig. 4A, right), as is the case for oxidized PutA86-669 (3,4), so it is unlikely that TtPRODH was reduced by exposure to X-rays during data collection. We conclude that the TtPRODH structure presented here represents the conformation of the oxidized enzyme. Thus, in terms of the 2′-OH conformation, the oxidized cofactor of TtPRODH resembles the reduced cofactor of PutA86-669 (Fig. 4B). This result has implications for understanding the differences in membrane association of E. coli PutA and TtPRODH (see Discussion).
Ligand-Free, Solvent-Exposed Active Site
It is significant that the TtPRODH active site does not contain a bound proline analog because all PutA86-669 crystal structures solved to date have active site ligands bound, including acetate (PDB code 1TJ2), L-lactate (PDB code 1TJ0), THFA (PDB code 1TIW) and hyposulfite (PDB code 2FZM). Thus, the TtPRODH structure provides the first view of a ligand-free PRODH active site. Since the amino acid sequences of the proline binding pockets are identical in TtPRODH and E. coli PutA, comparison of ligand-free TtPRODH and inhibitor-bound PutA86-669 possibly provides insights into conformational changes induced by the binding of proline. The following analysis refers to molecule A of the asymmetric unit but it also holds true for molecule B.
There are two major differences between TtPRODH and PutA86-669 in the region of the proline-binding pocket. First, α8 is shifted 3–4 Å away from the proline-binding pocket in TtPRODH (Figs. 2A, 5B). The consequences of this conformational difference are significant because α8 contributes two absolutely conserved Arg residues that bind the substrate. As shown in Fig. 5B, the two conserved Arg side chains of PutA86-669 (Arg555, Arg556) form ion pairs with the carboxyl group of THFA. Movement of α8 in TtPRODH pulls the analogous residues (Arg288, Arg289) out of the proline-binding pocket (Fig. 5B). Interestingly, there is a conserved glycine residue in the loop connecting β8 and α8 (Fig. 1A, Gly279). It is possible that that Gly279 facilitates movement of α8 by serving as a flexible hinge.
The second major difference between the proline binding pockets of TtPRODH and PutA86-669 involves a conserved ion pair that is present in PutA86-669 but absent in TtPRODH. As shown in Fig. 5B, Arg555 of PutA86-669 forms an ion pair with conserved Glu289. The analogous ion pair of TtPRODH (Arg288-Glu65) is not observed because Glu65 is flipped out of the active site and points into the solvent (Fig. 5B). This difference is quite large, with the carboxyl groups of TtPRODH Glu65 and PutA Glu289 separated by 10 Å. We note that Glu65 is free of crystal contacts in both molecules and so the observed conformation of this residue is not likely an artifact of crystal packing.
Because of the conformational differences involving α8 and Glu65 (Glu289) the active site of TtPRODH is open and the FAD is solvent exposed, which sharply contrasts the closed active site of PutA86-669/THFA in which the FAD is buried. The solvent accessible surface area (SASA) of the FAD in TtPRODH is 220 Å2 for the A chain and 275 Å2 for the B chain, based on analysis with the Ligand Protein Contacts server (40). For reference, the SASA of the isolated FAD is 963 Å2. By contrast, the FAD in PutA86-669/THFA is buried, with SASA of only 25 Å2. The THFA is also buried (0.0 Å2 SASA). Exposure of the FAD in TtPRODH can be appreciated by viewing a space-filling model of the enzyme (Fig. 2B). It is evident from this view that almost the entire surface of the isoalloxazine si face is solvent exposed in TtPRODH. In particular, note that the hydride transfer acceptor atom of the flavin, N5, is open to solvent in TtPRODH. This atom is completely buried in PutA86-669/inhibitor complexes.
Absorbance Spectroscopy and Steady-State Kinetics
We performed biochemical analyses of TtPRODH to understand how monofunctional PRODHs differ from PutA PRODH domains in terms of spectroscopic and steady-state kinetic properties. TtPRODH displayed a flavin absorption spectrum similar to that of previously characterized PutAs (41) with maxima at 381 nm and 452 nm (Fig. 6A). Potentiometric titration of TtPRODH yielded an Em value of −75 mV for the bound FAD cofactor (Fig. 6A), which is similar to that previously reported for E. coli PutA (Em = −77 mV, pH 7.5, (42)). No significant stabilization of semiquinone species was observed during the titration (Fig. 6A). Titration of TtPRODH with proline under aerobic conditions yielded an apparent equilibrium constant for the formation of TtPRODHred-P5C (eq. 1) of 4.5 mM−1 proline, which is about two-fold lower than the value of 9.5 mM−1 for E. coli PutA (34).
Figure 6. Biochemical studies of TtPRODH.
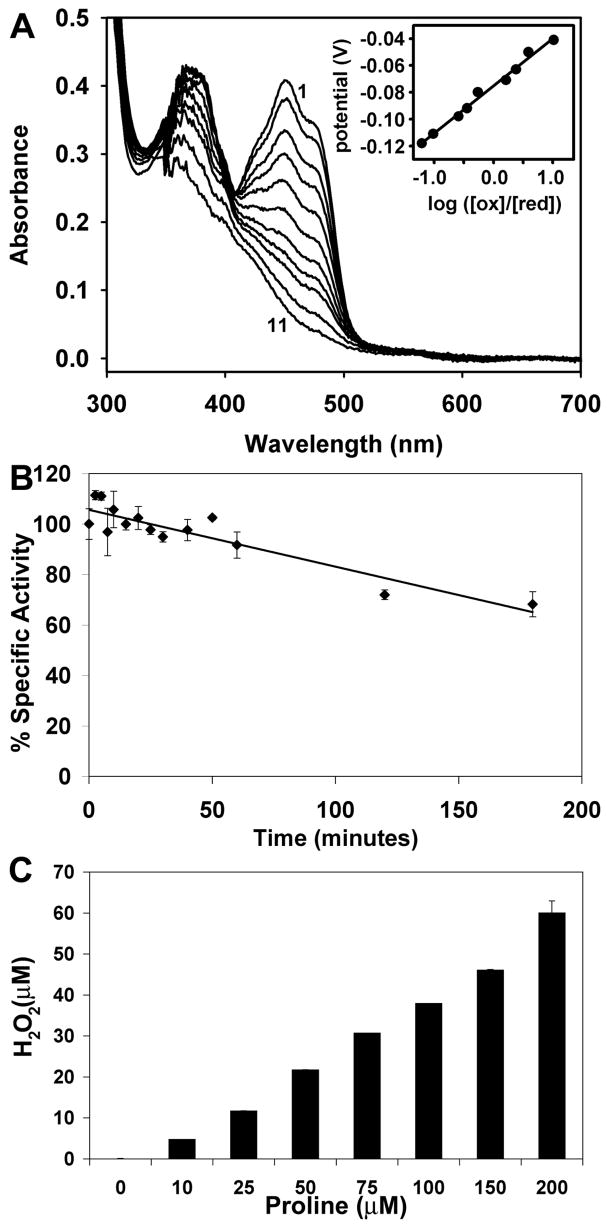
A, potentiometric titration of TtPRODH (25 μM) at 20 °C (pH 7.5). Curves 1–11 correspond to fully oxidized, −0.041 V, −0.050 V, −0.063 V, −0.071 V, −0.08 V, −0.092 V, −0.098 V, −0.111 V, −0.118 V, and fully reduced, respectively. The inset is a Nernst plot of the potentiometric data, which yielded a midpoint potential of Em = −0.075 V with slope of 35 mV.
B, thermostability analysis of TtPRODH. The percent activity remaining after incubation of the enzyme at 90 °C is plotted as a function of incubation time.
C, generation of hydrogen peroxide by TtPRODH. Production of H2O2 was measured using the Amplex Red H2O2/peroxidase assay kit as described in the text.
The kinetic parameters of TtPRODH using proline as the substrate were estimated to be Km = 27 mM, Vmax = 20.5 U/mg and kcat =13 s−1 (Table 2). For reference, the corresponding values for PutAs from E. coli and Helicobacter pylori are listed in Table 2. The Km parameter of TtPRODH is 3 – 5 times lower than those of the PutAs, while the kcat value is comparable to the PutA values (Table 2). The kinetic parameters for TtPRODH are closer to those of PutA86-669 (Km = 60 mM, kcat=17 s−1) than those of the PutAs.
Table 2.
Kinetic parameters using L-proline as the substrate
| TtPRODH | E. coli PutAa | H. pylori PutAb | |
|---|---|---|---|
| proline:DCPIP assay | |||
| Km (mM) | 27 | 100 | 146 |
| Vmax (U/mg of protein) | 20.5 | 5 | 3.6 |
| kcat (s−1) | 13 | 12 | 8 |
| kcat/Km (s−1 M−1) | 481 | 122 | 56 |
| KI for THFA (mM) | 1.0 | 0.2 | 0.35 |
|
| |||
| proline:O2 assay | |||
| Km (mM) | 1.3 | ND | 150 |
| Vmax (mU/mg of protein) | 335 | < 2 | 230 |
| kcat (min−1) | 12.7 | <0.3 | 31 |
| DCPIP/O2 activity ratio | 61 | > 2500 | 16 |
Interestingly, 3,4-dehydro-L-proline was more efficiently oxidized than proline, with Km = 4 mM, Vmax = 119 U/mg and kcat = 75 s−1. Analogous data for PutA are not available, although Wood reported that in E. coli K12 PutA detoxifies 3,4-dehydro-L-proline by oxidation (43).
THFA, L-mandelate and L-lactate were identified as competitive inhibitors of TtPRODH with KI values of 1.0 mM, 2.4 mM and 2.5 mM, respectively. THFA is also a competitive inhibitor of PutA86-669, E. coli PutA and H. pylori PutA (KI = 0.2 – 0.3 mM). Other proline analogs such as trans-4-hydroxy-L-proline, cis-4-hydroxy-L-proline, L-azetidine-2-carboxylic acid and L-pipecolinic acid were neither inhibitors nor substrates of TtPRODH.
TtPRODH is highly thermostable, based on residual activity measurements, as expected for an enzyme from an extreme thermophile. TtPRODH exhibited over 85 % residual activity after a 1-hour incubation at 90 °C, and over 60 % residual activity after 3 hours (Fig. 6B). The half-life estimated from these data was 257 min. For comparison, PutA86-669 exhibits a 50 % drop in activity after 2 hours at 45°C (3).
Proline:O2 Reactivity and Generation of Reactive Oxygen Species
The solvent exposed active site of TtPRODH suggested the possibility that the reduced enzyme could react with molecular oxygen. A chromogenic assay based on o-AB was used to measure the rate of oxygen reactivity. In this assay, P5C produced by oxidation of proline forms a complex with o-AB, which is monitored by absorbance at 443 nm. Detection of the o-AB:P5C complex over time indicates reactivity of the reduced FAD with O2 during catalytic turnover with proline.
TtPRODH exhibited significant proline:O2 reactivity with kinetic parameters of Km = 1.3 mM, Vmax = 335 mU/mg, and kcat = 12.7 min−1 (Table 2). Data from the o-AB assay are typically expressed as the ratio of the specific activity from the DCPIP assay to the specific activity from the o-AB assay, which indicates the preference of utilizing DCPIP over O2 as the electron acceptor. For TtPRODH, this ratio is 61. For comparison, the corresponding ratios for PutAs from H. pylori and E. coli are 16 and > 2500, respectively (Table 2).
Generation of reactive oxygen species (ROS) by TtPRODH was also studied. The production of superoxide was examined by monitoring reduction of cytochrome c during the proline oxidation catalytic cycle. Reduction of cytochrome c was observed, which is consistent with generation of superoxide. Addition of superoxide dismutase to the assay (30 μg) eliminated the observed effect, which further implicates superoxide as the product of the proline:O2 reaction. Since superoxide decomposes in water to H2O2, the generation of H2O2 was also examined. H2O2 was produced in a proline dependent manner (Fig. 6C).
Conserved Sequence-Structure Motifs of the PRODH Family
PRODH and P5CDH are separate enzymes in some organisms, whereas the two are fused in other organisms. The traditional view, which was developed prior to the whole genome sequence era, has been that PRODH and P5CDH appear as separate enzymes in eukaryotes and as fused bifunctional enzymes (PutA) in bacteria. Our analysis of genome sequence data, however, reveals a more complex situation for bacteria. The updated view is that PutAs are indeed restricted to bacteria, but monofunctional PRODHs and P5CDHs appear in both eukaryotes and bacteria.
The distribution of PutAs and monofunctional PRODHs in bacteria is depicted in the phylogenetic tree in supplemental Fig. 1. Three main branches are evident. Branch 1 contains the best-characterized PutAs, including PutAs from E. coli, Bradyrhizobium japonicum and S. typhimurium. The organisms represented in branch 1 are primarily α-, β-, and γ-proteobacteria. The PutAs in branch 1 of our data set have 999 – 1361 residues and the pairwise sequence identities are 38 – 99% with an average of 49 %.
Branch 2 contains PutAs from Gram-negative cyanobacteria, δ- and ε- proteobacteria, and corynebacterium. The polypeptide length for branch 2 PutAs is 982-1294 and the pairwise sequence identity range is 23 – 73 % with an average identity of 38 %. Note that branch 2 is divided into two distinct groups, denoted 2A and 2B in supplemental Fig. 1. PutAs from branch 2 have only recently been explored. For example, Krishnan and Becker showed that branch 2A PutAs from H. pylori and Helicobacter hepaticus are unique among PutAs in that they exhibit oxygen reactivity and generate proline-dependent ROS (44).
Branch 3 consists entirely of monofunctional PRODHs. TtPRODH is the only enzyme of this branch to be purified and characterized. PRODHs of branch 3 have 279-333 amino acid residues and the pairwise sequence identities for this group are 23 – 79 % with an average of 38 %. In some branch 3 organisms, the PRODH and P5CDH genes are very close together. For example, in T. thermophilus, only 15 bases separate the stop codon of the PRODH gene from the Met start codon of the P5CDH gene. In other organisms the two genes are quite far apart. For example, in Staphylococcus aureus subsp. aureus Mu50, the PRODH and P5CDH genes are separated by 800 kb. Interestingly, most of the organisms represented in branch 3 are Gram-positive bacteria. Counterexamples include Thermus, Solibacter, Salinibacter, and Chlorobium.
The availability of two PRODH structures (TtPRODH and PutA86-669) and many sequenced bacterial genomes allowed analysis of conserved sequence-structure motifs of the bacterial PutA/PRODH family. Nine conserved motifs were identified by mapping multiple sequence alignments onto the TtPRODH and PutA86-669 structures (Table 3). Each motif contains at least one residue that is identically conserved throughout then entire bacterial PutA/PRODH family (Table 3, bold letters).
Table 3.
Conserved Sequence Motifs of PutAs and Bacterial Monofunctional PRODHsa
| Motif | Branch 1b | Branch 2c | Branch 3d |
|---|---|---|---|
| 1 | s-y-D-m-L-G-E (288, 289) | v-d-l-l-G-E (146, 147) | l-d-X-l-G-E (64, 65) |
| 2 | i-S-i/v-K-l-S (329) | s-i/v-K-X-t/s (177) | S-i/v/l-K-X-s/t (99) |
| 3 | i-D-A-E-E (370, 372) | D-M-E (224, 226) | D-m-E (133, 135) |
| 4 | G-X-v-v-Q-a-y-q-k-R (404) | g-i-v-Q-A-Y-l-X-d (254) | G-X-v-l-Q-a-y-L (163) |
| 5 | R-L-v-K-G-A-Y-W-D-X-E-i-k (431, 434, 435) | R-l-V-K-G-a-y-w-d (285, 288, 289) | R-l-v-K-G-a-Y-X-E-p (184, 187, 188) |
| 6 | F-a-t-H-N (487) | i-a-s-H-N (342) | i-a-t-H-D (227) |
| 7 | E-f-Q-r-L-h-G-M-g-e (513, 515) | e-f-q-v-L-y-G-M-a (371, 373) | E-f-Q-m-L-y-G-i-r (254, 256) |
| 8 | i-Y-a-P-v-G (540) | l-Y-x-y-P-g (391) | v-Y-v-p-y-G (275) |
| 9 | L-L-a-Y-L-v-R-R-l-l-E-N-G (552, 555, 556, 559) | Y-L-v-R-R-l-l-E-N (406, 409, 410, 413) | Y-f-m-R-R-l-a-E (285, 288, 289, 292) |
Letters in bold indicate amino acid residues that are identically conserved throughout the entire family of bacterial PutAs and PRODHs. Upper case letters denote residues that are identically conserved within a branch of the family. Lower case letters indicate amino acid residues that are highly, but not identically, conserved within a branch.
Numbers in parenthesis refer to E. coli PutA residue numbers.
Numbers in parenthesis refer to H. pylori PutA residue numbers.
Numbers in parenthesis refer to TtPRODH residue numbers.
The nine motifs cluster near the active site and the identically conserved residues of the motifs have important roles in FAD binding and substrate recognition. Motifs 4–6 are primarily involved in FAD binding. For example, the conserved Gln of motif 4 forms a hydrogen bond to the FAD O2 (Fig. 3, Gln163) while the Arg of motif 5 forms a hydrogen bond to the FAD N5 (Fig. 3, Arg184). Also, the Lys and His of motifs 5 and 6 interact with the pyrophosphate (Fig. 3, Lys187 and His227).
Motifs 1–3 and 7–9 are responsible for substrate recognition. For example, the Lys and Arg side chains of motifs 2 and 9 form ion pairs to the substrate carboxyl, as shown for the PutA86-669/THFA structure (Fig. 5B, PutA residues Lys329, Arg555, Arg556). The conserved Glu residues of motifs 1 and 9 play indirect roles in substrate recognition by providing stabilizing ion pairs to the two Arg residues of motif 9 when the substrate/product is bound (Arg555-Glu289 and Arg556-Glu559 in PutA, Fig. 5B). Size and shape complementarity are enforced by nonpolar contacts between the substrate and the Leu and Tyr side chains of motifs 7 – 9 (3). Finally, the conserved Asp of motif 3 (Asp133 of TtPRODH) plays a dual role in substrate recognition and FAD binding by forming stabilizing interactions with the Lys of motif 2 (substrate recognition, Fig. 5B), Tyr of motif 8 (substrate recognition, Fig. 5B) and the conserved Arg of motif 5 (FAD binding, Fig. 5B).
DISCUSSION
New Subfamily of PRODH
The genesis of this work was the realization, based on analysis of genome sequence data, that some bacteria lack putA genes and instead encode PRODH and P5CDH as separate monofunctional enzymes. This observation is significant because the traditional view of proline catabolism was that monofunctional enzymes are restricted to eukaryotes. Thus, bacterial monofunctional PRODHs represent a new subfamily of proline catabolic enzyme. Moreover, isolation of recombinant eukaryotic PRODHs in sufficient quantity and purity for biophysical study has been problematic (our unpublished results) and therefore the bacterial homologs are potentially attractive model systems for understanding human PRODH. We thus set out to characterize a bacterial monofunctional PRODH in order to establish paradigms for this new subfamily, compare its structure and biochemical properties to those of PutAs, and set the stage for probing interactions between PRODH and P5CDH.
One major result of this work is that monofunctional PRODHs and PutAs share a common catalytic core consisting of a unique TIM barrel (Fig. 2A). The PutA/PRODH barrel is distinguished from other TIM barrels by placement of α8 above the barrel. This distortion is functionally significant because α8 contributes conserved motif 9 to the active site (Table 3). Observation of this structural distortion in enzymes from two branches of the bacterial PutA/PRODH family suggests that it is a defining structural signature of this family.
Interestingly, the TIM barrel catalytic core, FAD conformations and proline binding pocket described here for the PutA/PRODH family bear no resemblance to those of PRODHs from the hyperthermophilic archaeon Pyrococcus horikoshii (PDH1 and PDH2). For example, PDH1 is an (αβ)4 hetero-octameric complex with the β subunit binding an FAD cofactor and exhibiting PRODH activity (6). The crystal structure of PDH1 shows that the FAD-binding domain has a Rossmann dinucleotide-binding fold similar to that of monomeric sarcosine oxidase, which is a member of the glutathione reductase family (6). As expected for a Rossmann fold protein, the FAD of PDH1 is highly extended and the pyrophosphate interacts with a glycine-rich loop and associated conserved water molecule (45). Thus, the protein-FAD interactions in PDH1 are quite different from those described here. Furthermore, proline binds on the re face of the FAD in PDH1, in contrast to PutA and TtPRODH which bind proline on the si face. Thus, the PutA/PRODH and PDH1 families represent two distinctly different solutions to the problem of catalyzing the oxidation of proline by a flavoenzyme.
FAD Conformation
Although the catalytic cores of TtPRODH and PutA86-669 are similar in overall fold, the FAD conformations are surprisingly different. This difference is attributed to an Asp/Asn sequence difference (Fig. 5A) and two helices present in PutA86-669 but absent in TtPRODH (Figs. 2A, 5A). Based on amino acid sequence alignments, the Asn-pyrophosphate hydrogen bond, α5a, and the 560s helix are present in all PutAs and missing in all bacterial monofunctional PRODHs. Interestingly, the stacking Trp of α5a is present in most, but not all, PutAs. For example, branch 2A enzymes have Met or Leu in place of the stacking Trp, but these residues could also provide a nonpolar interaction with the FAD adenine. We therefore predict that all PutAs have the FAD conformation observed in PutA86-669 and all bacterial monofunctional PRODHs have the FAD conformation observed in TtPRODH. It is concluded that the FAD conformation is the major structural difference between PutAs and bacterial monofunctional PRODHs.
The different FAD conformations in PutA and monofunctional PRODHs presumably reflect different structural and functional requirements. For example, we suggest that the difference in position of the ribityl 2′-OH reflects the different membrane association requirements of E. coli PutA and TtPRODH. E. coli PutA is membrane-associated only when the FAD is in the reduced state. In the oxidized state, it remains in the cytoplasm and represses transcription of the putA and putP (encodes a proline transporter) genes (15,46,47). We recently showed that reduction of FAD in PutA86-669 triggers rupture of the hydrogen bond between the ribityl 2′-OH and Arg556, causing rotation of the 2′-OH so that it is tucked below, and hydrogen bonded to, the FAD N1 (39). We further showed that the 2′-OH-Arg556 hydrogen bond is a structural constraint that prevents oxidized PutA from binding the membrane (39). Interestingly, we find here that the 2′-OH of oxidized TtPRODH is tucked below the FAD N1, that is, cocked in the membrane-binding position (Fig. 4). This makes sense because TtPRODH does not have a repressor function and is presumably membrane-associated in both the oxidized and reduced states.
A larger question is why the global FAD conformations of PutAs and monofunctional PRODHs differ so much, with the adenosine moieties of the two cofactors separated by 13 Å. It is possible that the particular FAD conformation found in PutA is necessary for coordinating the two catalytic functions of PutA, i.e., substrate channeling. Monofunctional PRODH and P5CDH may interact and exhibit intermolecular substrate channeling according to the Rosetta Stone hypothesis. We note that this occurs for tryptophan synthase in which indole is channeled between separate α and β subunits (16,17). Presumably the FAD conformation in TtPRODH is the one required for docking of TtPRODH with TtP5CDH. Observation of different FAD conformations in TtPRODH and PutA86-669 may indicate that the protein-protein interface between TtPRODH and TtP5CDH differs substantially from the PRODH:P5CDH domain interface in PutA. Clearly, structures of full-length PutAs, other monofunctional PRODHs, and a monofunctional PRODH:P5CDH complex would address the issue of why PutAs and monofunctional PRODHs require such different FAD conformations.
Relationships Between Bacterial and Human PRODH
Humans have two isozymes of PRODH, which share about 50% amino acid sequence identity (48). PRODH1 is encoded on chromosome 19, is expressed almost exclusively in liver and kidney, and catalyzes oxidation of L-hydroxyproline. PRODH2 is encoded on chromosome 22q11, is expressed more widely than PRODH1 (brain, heart, pancreas, kidney, liver) and specifically oxidizes L-proline.
PRODH2 is part of the p53 signaling pathway with the PRODH2 gene identified as a p53 inducible gene (49). Up-regulation of PRODH2 and proline oxidation in lung, renal, and colon carcinoma cells has been shown to generate ROS and induce cell death by mitochondrial dependent processes (50–55). Perturbation of mitochondrial membranes by ROS causes the release of cytochrome c into the cytosol and subsequent activation of the intrinsic caspase pathway. Because the p53-apoptosis pathway involves ROS, PRODH2 appears to play a role in p53-mediated apoptosis by modulating the cellular redox environment. Indeed, antisense repression of PRODH2 prevents p53-induced apoptosis (55). Thus, PRODH2 is a pro-apoptotic protein that helps reduce carcinogenesis in humans by serving as a ROS generator. Accordingly, PRODH2 is often referred to as proline oxidase in the literature.
Bacterial monofunctional PRODHs are potentially attractive model systems for understanding the structure and biochemical function of human PRODHs. Although the sequence identity between TtPRODH and human PRODH1/2 is less than 20 %, conserved motifs 3–9 are clearly present in the sequences of both human PRODH1 and PRODH2. Considering residues within 10 Å of the active site, there is 45 % sequence conservation between human PRODH1/2 and TtPRODH. These data strongly suggest that the human enzymes have the (βα)8 catalytic core and active site structure common to TtPRODH and PutA86-669. On the other hand, human PRODH1 and PRODH2 have 536 and 600 residues, respectively, compared to only 307 for TtPRODH, and so the human enzymes clearly have additional structural elements not found in TtPRODH.
Interestingly, analysis of human PRODH1/2 amino acid sequences suggests that the conformation of FAD in human PRODH1/2 is similar to that of PutA rather than TtPRODH. Both human enzymes have Asn at the position equivalent to E. coli PutA Asn488. Furthermore, sequence alignments suggest that the human enzymes have the equivalent of PutA α5a and that Leu replaces the stacking Trp. We note that Leu is also present at this position in some branch 2A PutAs. Thus, the FAD conformation observed in E. coli PutA is probably present in the human enzymes and the conformation observed in TtPRODH seems to be a unique signature of bacterial monofunctional PRODHs.
Production of proline-dependent superoxide is central to the role of PRODH2 in p53-mediated apoptosis (54,56). It is therefore highly significant that we observed reactivity of TtPRODH with molecular oxygen resulting in superoxide generation. Reactivity of a FAD-dependent dehydrogenase with molecular oxygen implies that the reduced FAD is accessible to solvent. E. coli PutA is essentially nonreactive with molecular oxygen (44), suggesting that the FAD remains sequestered even after the active site opens to release P5C. On the other hand, H. pylori PutA reacts strongly with molecular oxygen indicating that O2 has access to the reduced cofactor (44). Krishnan and Becker have suggested that Asn291 of H. pylori PutA, which is replaced by the bulkier Tyr437 in E. coli PutA, may account for the differences in O2 reactivity of these two PutAs (44). This particular Tyr is part of conserved motif 5 (Table 3, Tyr437 in E. coli PutA). It forms a water-mediated hydrogen bond to the O atom of the THFA ring (Fig. 5B) and is in position to protect the active site from bulk solvent by virtue of its location on the edge of the proline-binding site (see Tyr190 in Fig. 2B). Tyrosine, being larger than Asn, may afford more protection of the active site from solvent. Interestingly, human PRODH2 and TtPRODH - both ROS generators -have Tyr at this position (Tyr446 in PRODH2 and Tyr190 in TtPRODH, Fig. 2A). Thus, the Asn hypothesis, which may explain the difference in O2 reactivity between E. coli and H. pylori PutAs, does not explain the O2 reactivity of TtPRODH and human PRODH2. The TtPRODH structure shows that α8 is important for protecting the FAD from solvent and that there is sufficient flexibility in the β8-α8 loop to allow movement of α8 away from the proline binding pocket resulting in exposure of the isoalloxazine. These results suggest that movement of α8 may contribute to O2 reactivity of PRODHs.
Acknowledgments
We thank Jay Nix of ALS beamline 4.2.2 for help with data collection and processing, and Beverly DaGue of the MU Proteomics Core for help with mass spectral analyses.
This research was supported by NIH grants GM065546 (to J.J.T.) and GM061068 (to D.F.B.), and the University of Nebraska Agricultural Research Division, supported in part by funds provided through the Hatch Act. Part of this research was performed at the Advanced Light Source, which is supported by the Director, Office of Science, Office of Basic Energy Sciences, Materials Sciences Division, of the U.S. Department of Energy under Contract No. DE-AC03-76SF00098 at Lawrence Berkeley National Laboratory.
The abbreviations used are
- P5C
Δ1-pyrroline-5-carboxylate
- PRODH
proline dehydrogenase
- P5CDH
Δ1-pyrroline-5-carboxylate dehydrogenase
- PutA
Proline utilization A
- TtPRODH
Thermus thermophilus proline dehydrogenase
- TtP5CDH
Thermus thermophilus Δ1-pyrroline-5-carboxylate dehydrogenase
- SAD
single-wavelength anomalous diffraction
- DCPIP
dichlorophenolindophenol
- THFA
L-tetrahydro-2-furoic acid
- o-AB
o-aminobenzaldehyde
- TIM
triosephosphate isomerase
- PDB
Protein Data Bank
- SASA
solvent accessible surface area
- ROS
reactive oxygen species
- PDH1 and PDH2
proline dehydrogenase complexes from Pyrococcus horikoshii
Footnotes
Coordinates and structure factor amplitudes have been deposited in the PDB under accession code 2G37
References
- 1.Adams E, Frank L. Annu Rev Biochem. 1980;49:1005–1061. doi: 10.1146/annurev.bi.49.070180.005041. [DOI] [PubMed] [Google Scholar]
- 2.Phang JM. Curr Top Cell Reg. 1985;25:92–132. doi: 10.1016/b978-0-12-152825-6.50008-4. [DOI] [PubMed] [Google Scholar]
- 3.Zhang M, White TA, Schuermann JP, Baban BA, Becker DF, Tanner JJ. Biochemistry. 2004;43(39):12539–12548. doi: 10.1021/bi048737e. [DOI] [PMC free article] [PubMed] [Google Scholar]
- 4.Lee YH, Nadaraia S, Gu D, Becker DF, Tanner JJ. Nat Struct Biol. 2003;10(2):109–114. doi: 10.1038/nsb885. [DOI] [PMC free article] [PubMed] [Google Scholar]
- 5.Inagaki E, Ohshima N, Takahashi H, Kuroishi C, Yokoyama S, Tahirov TH. J Mol Biol. 2006;362(3):490–501. doi: 10.1016/j.jmb.2006.07.048. [DOI] [PubMed] [Google Scholar]
- 6.Tsuge H, Kawakami R, Sakuraba H, Ago H, Miyano M, Aki K, Katunuma N, Ohshima T. J Biol Chem. 2005;280(35):31045–31049. doi: 10.1074/jbc.C500234200. [DOI] [PubMed] [Google Scholar]
- 7.Menzel R, Roth J. J Biol Chem. 1981;256(18):9762–9766. [PubMed] [Google Scholar]
- 8.Brown E, Wood JM. J Biol Chem. 1992;267(18):13086–13092. [PubMed] [Google Scholar]
- 9.Muro-Pastor AM, Maloy S. J Biol Chem. 1995;270(17):9819–9827. doi: 10.1074/jbc.270.17.9819. [DOI] [PubMed] [Google Scholar]
- 10.Muro-Pastor AM, Ostrovsky P, Maloy S. J Bacteriol. 1997;179(8):2788–2791. doi: 10.1128/jb.179.8.2788-2791.1997. [DOI] [PMC free article] [PubMed] [Google Scholar]
- 11.Becker DF, Thomas EA. Biochemistry. 2001;40:4714–4722. doi: 10.1021/bi0019491. [DOI] [PubMed] [Google Scholar]
- 12.Zhu W, Becker DF. Biochemistry. 2003;42(18):5469–5477. doi: 10.1021/bi0272196. [DOI] [PubMed] [Google Scholar]
- 13.Zhang W, Zhou Y, Becker DF. Biochemistry. 2004;43(41):13165–13174. doi: 10.1021/bi048596g. [DOI] [PMC free article] [PubMed] [Google Scholar]
- 14.Krishnan N, Becker DF. Biochemistry. 2005;44(25):9130–9139. doi: 10.1021/bi050629k. [DOI] [PMC free article] [PubMed] [Google Scholar]
- 15.Larson JD, Jenkins JL, Schuermann JP, Zhou Y, Becker DF, Tanner JJ. Protein Sci. 2006;15:1–12. doi: 10.1110/ps.062425706. [DOI] [PMC free article] [PubMed] [Google Scholar]
- 16.Miles EW, Rhee S, Davies DR. J Biol Chem. 1999;274(18):12193–12196. doi: 10.1074/jbc.274.18.12193. [DOI] [PubMed] [Google Scholar]
- 17.Huang X, Holden HM, Raushel FM. Annu Rev Biochem. 2001;70:149–180. doi: 10.1146/annurev.biochem.70.1.149. [DOI] [PubMed] [Google Scholar]
- 18.Surber MW, Maloy S. Arch Biochem Biophys. 1998;354:281–287. doi: 10.1006/abbi.1998.0697. [DOI] [PubMed] [Google Scholar]
- 19.Marcotte EM, Pellegrini M, Ng HL, Rice DW, Yeates TO, Eisenberg D. Science. 1999;285(5428):751–753. doi: 10.1126/science.285.5428.751. [DOI] [PubMed] [Google Scholar]
- 20.White TA, Tanner JJ. Acta Crystallogr. 2005;F61(Pt 8):737–739. doi: 10.1107/S1744309105019779. [DOI] [PMC free article] [PubMed] [Google Scholar]
- 21.Doublie S. Methods Enzymol. 1997;276:523–530. [PubMed] [Google Scholar]
- 22.Matthews BW. J Mol Biol. 1968;33:491–497. doi: 10.1016/0022-2836(68)90205-2. [DOI] [PubMed] [Google Scholar]
- 23.Pflugrath JW. Acta Crystallogr. 1999;D55:1718–1725. doi: 10.1107/s090744499900935x. [DOI] [PubMed] [Google Scholar]
- 24.Terwilliger TC. Methods Enzymol. 2003;374:22–37. doi: 10.1016/S0076-6879(03)74002-6. [DOI] [PubMed] [Google Scholar]
- 25.Cowtan K, Main P. Acta Crystallogr Crystallogr. 1998;54(Pt 4):487–493. doi: 10.1107/s0907444997011980. [DOI] [PubMed] [Google Scholar]
- 26.Morris RJ, Perrakis A, Lamzin VS. Acta Crystallogr. 2002;D58(Pt 6 Pt 2):968–975. doi: 10.1107/s0907444902005462. [DOI] [PubMed] [Google Scholar]
- 27.Winn MD, Murshudov GN, Papiz MZ. Methods Enzymol. 2003;374:300–321. doi: 10.1016/S0076-6879(03)74014-2. [DOI] [PubMed] [Google Scholar]
- 28.van Aalten DM, Bywater R, Findlay JB, Hendlich M, Hooft RW, Vriend G. J Comput Aided Mol Des. 1996;10(3):255–262. doi: 10.1007/BF00355047. [DOI] [PubMed] [Google Scholar]
- 29.Potterton E, Briggs P, Turkenburg M, Dodson E. Acta Crystallogr. 2003;D59(Pt 7):1131–1137. doi: 10.1107/s0907444903008126. [DOI] [PubMed] [Google Scholar]
- 30.Project CC. Acta Crystallogr. 1994;D50:760–763. [Google Scholar]
- 31.Berman HM, Westbrook J, Feng Z, Gilliland G, Bhat TN, Weissig H, Shindyalov IN, Bourne PE. Nucl Acids Res. 2000;28:235–242. doi: 10.1093/nar/28.1.235. [DOI] [PMC free article] [PubMed] [Google Scholar]
- 32.Dixon M. Biochem J. 1953;55(1):170–171. doi: 10.1042/bj0550170. [DOI] [PMC free article] [PubMed] [Google Scholar]
- 33.Stankovich MT. Anal Biochem. 1980;109(2):295–308. doi: 10.1016/0003-2697(80)90652-1. [DOI] [PubMed] [Google Scholar]
- 34.Brown ED, Wood JM. J Biol Chem. 1993;268(12):8972–8979. [PubMed] [Google Scholar]
- 35.Mezl VA, Knox WE. Anal Biochem. 1976;74(2):430–440. doi: 10.1016/0003-2697(76)90223-2. [DOI] [PubMed] [Google Scholar]
- 36.Tarpey MM, Fridovich I. Circ Res. 2001;89(3):224–236. doi: 10.1161/hh1501.094365. [DOI] [PubMed] [Google Scholar]
- 37.Thompson JD, Higgins DG, Gibson TJ. Nucleic Acids Res. 1994;22(22):4673–4680. doi: 10.1093/nar/22.22.4673. [DOI] [PMC free article] [PubMed] [Google Scholar]
- 38.Walden H, Bell GS, Russell RJ, Siebers B, Hensel R, Taylor GL. J Mol Biol. 2001;306(4):745–757. doi: 10.1006/jmbi.2000.4433. [DOI] [PubMed] [Google Scholar]
- 39.Zhang W, Zhang M, Zhu W, Zhou Y, Wanduragala S, Rewinkel D, Tanner JJ, Becker DF. Biochemistry. 2007;46(2):483–491. doi: 10.1021/bi061935g. [DOI] [PMC free article] [PubMed] [Google Scholar]
- 40.Sobolev V, Sorokine A, Prilusky J, Abola EE, Edelman M. Bioinformatics. 1999;15(4):327–332. doi: 10.1093/bioinformatics/15.4.327. [DOI] [PubMed] [Google Scholar]
- 41.Vinod MP, Bellur P, Becker DF. Biochemistry. 2002;41:6525–6532. doi: 10.1021/bi025706f. [DOI] [PubMed] [Google Scholar]
- 42.Zhu W, Gincherman Y, Docherty P, Spilling CD, Becker DF. Arch Biochem Biophys. 2002;408(1):131–136. doi: 10.1016/s0003-9861(02)00535-0. [DOI] [PubMed] [Google Scholar]
- 43.Wood JM. J Bacteriol. 1981;146:895–901. doi: 10.1128/jb.146.3.895-901.1981. [DOI] [PMC free article] [PubMed] [Google Scholar]
- 44.Krishnan N, Becker DF. J Bacteriol. 2006;188(4):1227–1235. doi: 10.1128/JB.188.4.1227-1235.2006. [DOI] [PMC free article] [PubMed] [Google Scholar]
- 45.Bottoms CA, Smith PE, Tanner JJ. Protein Sci. 2002;11(9):2125–2137. doi: 10.1110/ps.0213502. [DOI] [PMC free article] [PubMed] [Google Scholar]
- 46.Chen CC, Wilson TH. J Biol Chem. 1986;261(6):2599–2604. [PubMed] [Google Scholar]
- 47.Gu D, Zhou Y, Kallhoff V, Baban B, Tanner JJ, Becker DF. J Biol Chem. 2004;279(30):31171–31176. doi: 10.1074/jbc.M403701200. [DOI] [PMC free article] [PubMed] [Google Scholar]
- 48.Phang JM, Hu CA, Valle D. Disorders of proline and hydroxyproline metabolism. In: Scriver CR, Beaudet AL, Sly WS, Valle D, editors. Metabolic and molecular basis of inherited disease. McGraw Hiss; New York: 2001. [Google Scholar]
- 49.Polyak K, Xia Y, Zweier JL, Kinzler KW, Vogelstein B. Nature. 1997;389(6648):300–305. doi: 10.1038/38525. [DOI] [PubMed] [Google Scholar]
- 50.Hu CA, Donald SP, Yu J, Lin WW, Liu Z, Steel G, Obie C, Valle D, Phang JM. Mol Cell Biochem. 2006 doi: 10.1007/s11010-006-9276-6. [DOI] [PubMed] [Google Scholar]
- 51.Rivera A, Maxwell SA. J Biol Chem. 2005;280(32):29346–29354. doi: 10.1074/jbc.M504852200. [DOI] [PubMed] [Google Scholar]
- 52.Pandhare J, Cooper SK, Phang JM. J Biol Chem. 2006;281(4):2044–2052. doi: 10.1074/jbc.M507867200. [DOI] [PubMed] [Google Scholar]
- 53.Maxwell SA, Davis GE. Proc Natl Acad Sci USA. 2000;97(24):13009–13014. doi: 10.1073/pnas.230445997. [DOI] [PMC free article] [PubMed] [Google Scholar]
- 54.Liu Y, Borchert GL, Donald SP, Surazynski A, Hu CA, Weydert CJ, Oberley LW, Phang JM. Carcinogenesis. 2005;26(8):1335–1342. doi: 10.1093/carcin/bgi083. [DOI] [PubMed] [Google Scholar]
- 55.Maxwell SA, Rivera A. J Biol Chem. 2003;278(11):9784–9789. doi: 10.1074/jbc.M210012200. [DOI] [PubMed] [Google Scholar]
- 56.Donald SP, Sun XY, Hu CA, Yu J, Mei JM, Valle D, Phang JM. Cancer Res. 2001;61(5):1810–1815. [PubMed] [Google Scholar]
- 57.Engh RA, Huber R. Acta Crystallogr. 1991;A47(4):392–400. [Google Scholar]
- 58.Laskowski RA, MacArthur MW, Moss DS, Thornton JM. J Appl Crystallogr. 1993;26:283–291. [Google Scholar]
- 59.DeLano WL. The PyMOL Molecular Graphics System. 2002 ( http://www.pymol.org)