

Abstract
We report on the first, to our knowledge, successful detection of a fluorescent unnatural amino acid (fUAA), Lys(BODIPYFL), incorporated into a membrane protein (the muscle nicotinic acetylcholine receptor, nAChR) in a living cell. Xenopus oocytes were injected with a frameshift-suppressor tRNA, amino-acylated with Lys(BODIPYFL) and nAChR (α/β19′GGGU/γ/δ) mRNAs. We measured fluorescence from oocytes expressing nAChR β19′Lys(BODIPYFL), using time-resolved total internal reflection fluorescence microscopy. Under conditions of relatively low receptor density (<0.1 receptors/μm2), we observed puncta with diffraction-limited profiles that were consistent with the point-spread function of our microscope. Furthermore, diffraction-limited puncta displayed step decreases in fluorescence intensity, consistent with single-molecule photobleaching. The puncta densities agreed with macroscopic ACh-induced current densities, showing that the fUAA was incorporated, and that receptors were functional. Dose-response relations for the nAChR β19′Lys(BODIPYFL) receptors were similar to those for wild-type receptors. We also studied nAChR β19′Lys(BODIPYFL) receptors labeled with α-bungarotoxin monoconjugated with Alexa488 (αBtxAlexa488). The nAChR has two αBtx binding sites, and puncta containing the Lys(BODIPYFL) labeled with αBtxAlexa488 yielded the expected three discrete photobleaching steps. We also performed positive control experiments with a nAChR containing enhanced green fluorescent protein in the γ-subunit M3-M4 loop, which confirmed our nAChR β19′Lys(BODIPYFL) measurements. Thus, we report on the cell-based single-molecule detection of nAChR β19′Lys(BODIPYFL).
Introduction
Fluorescent labeling of proteins is a valuable technique for understanding biological processes at the cellular and subcellular levels. In a widely used method with subcellular resolution, a fluorescent protein (FP) (Fig. 1 A) (1) is genetically fused to a protein of interest (2,3). Such FP fusions are used to measure protein expression levels, colocalization, and trafficking. The FP moieties, however, are typically ∼27 kDa, and therefore may interfere with protein function, folding, and stability. Several methods were developed to overcome these limitations. For example, fluorophores with appropriate chemical groups can react with appropriate amino-acid side chains, but such fluorophores label all proteins in a nonselective manner in living cells (4,5). The selective posttranslational labeling of proteins was achieved by introducing unnatural amino acids that can then be derivatized via bio-orthogonal reactions (6–8). However, these reactions may not reach completion, and the reagents may partition nonspecifically into membranes. Orthogonal enzymatic labeling approaches have expanded the toolkit for protein labeling, but require the insertion of a peptide sequence and subsequent labeling (9,10). Peptide sequences with binding affinity or reactivity toward lanthanide ions (11,12) and synthetic dyes (13) can also be encoded into proteins and synthetic peptides. Nevertheless, the intracellular labeling of proteins remains challenging.
Figure 1.
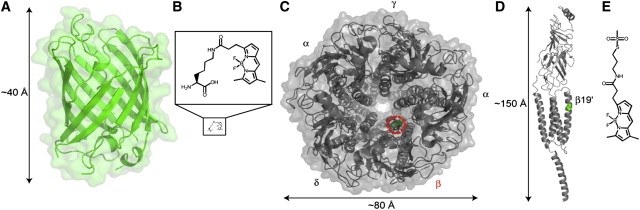
Structure of molecules studied in these experiments. (A) Crystal structure of GFP, Protein Data Bank accession code 1EMA. (B) Structure of Lys(BODIPYFL): same scale as GFP (bottom), and magnified (top). (C) Top view of Torpedo nAChR cryo-EM structure, Protein Data Bank accession code 2BG9. Green residue with red-dashed circle indicates nAChR β19′ site. (D) Side view of nAChR β-subunit, with 19′ site indicated in green. (E) Structure of BODIPYFL-C3-MTS.
Fluorescent unnatural amino acids (fUAAs) represent an attractive alternative strategy. Previously, fUAAs were incorporated into various types of proteins, using nonsense (14–19) and frameshift (15,18) suppression methodologies. Orthogonal tRNA/aminoacyl-tRNA synthetase pairs that can incorporate fUAAs were also developed (20–22). Several fUAAs were incorporated into functional proteins and detected with conventional cuvette or gel-based fluorescence measurements. Fluorescence moieties that were incorporated include: 5-hydroxytryptophan (21), 7-azatryptophan (16), dansyl (20), coumarin (23), NBD-Dap (14), Aladan (19), and BODIPYFL derivatives (15,18). These fluorophores span a wide spectral range, indicating the generality of nonsense and frameshift-suppression methodologies for the site-specific incorporation of fUAAs into proteins.
For example, fUAAs were previously incorporated into receptors and ion channels heterologously expressed in Xenopus oocytes by nonsense suppression. The NBD-Dap and Aladan were incorporated into the functional neurokinin-2 (NK2) receptor (14) and voltage-gated potassium channel Kir2.1 (19), respectively. Plasma membranes from oocytes were isolated, and the fluorescence of NBD-Dap incorporated into the NK2 receptor was measured with cuvette fluorescence spectrometry. In addition, a NK2 cysteine mutant was labeled with a tetramethylrhodamine (TMR) thiol-reactive fluorescent probe, and Förster (or fluorescence) resonance energy transfer (FRET) was detected between the NBD donor and TMR (14). However, to the best of our knowledge, there are no reports of fluorescence imaging with fUAAs incorporated into membrane proteins in living cells. Live-cell fluorescence imaging is essential in understanding the fundamental function and trafficking of ion-channel proteins. This is especially true of neuronal ion-channel proteins, whose function (24) and expression patterns (25) have subcellular specificity.
To extend fUAA incorporation to living cells and also to the single-molecule level, we chose an ion-channel molecule that is well-characterized, but still poses important scientific questions. We studied the incorporation of Lys(BODIPYFL) (Fig. 1 B) into the mouse muscle nicotinic acetylcholine receptor (nAChR) heterologously expressed in Xenopus oocytes. The nAChRs are cation-selective, ligand-gated ion channels (LGICs) in the pentameric Cys-loop superfamily. Muscle nAChR has a subunit stoichiometry of 2α1/β1/δ/γ. Each subunit contains an extracellular ligand-binding domain, a transmembrane region with four α-helices (M1, M2, M3, and M4), and a substantial intracellular region between the M3 and M4 helices (Fig. 1 C–D) (26,27). The ACh binding sites are at the α-γ and α-δ subunit interfaces. The transmembrane M2 α-helices from each subunit line the pore axis (28). The M2 transmembrane regions of all LGICs are spanned by >20 amino acids, whose sequence is often summarized according to a numbering system (29) in which 0′ is the most intracellular, N-terminal position of the M2 helix. Despite extensive structure-function studies on the conformational changes that translate ligand-binding at the ACh binding site into the opening of the gate ∼60 Å away (30–33), the nature and order of structural motions are still undetermined.
This lack of direct conformational measurements arises in part because many residues in the M2 domain and other “buried” domains are at best partially accessible for posttranslational fluorescent labeling using conventional methods such as cysteine reactions. Therefore, we incorporated the fUAA Lys(BODIPYFL) into the nAChR β-subunit M2 domain 19′ position (β19′) (Fig. 1 D), a site that was partially probed by fluorescence labeling (30). The nAChR β19′ site is an important gating residue and a candidate for future single-molecule FRET studies.
We used single-molecule total internal reflection fluorescence (TIRF) microscopy to measure fluorescent nAChRs. We studied the photobleaching of diffraction-limited puncta to assess the incorporation of fUAA. We also compared fluorescence signals from the nAChR β19′Lys(BODIPYFL) labeled with a second fluorophore, α-bungarotoxin monoconjugated with Alexa488 (αBtxAlexa488). We compared signals from nAChR containing enhanced green fluorescent protein in the γ-subunit M3-M4 loop (γeGFP) with our nAChR β19′Lys(BODIPYFL) observations. Fluorescence measurements with nAChR β19′C labeled with BODIPYFL-C3-MTS (Fig. 1 E), a thiol-reactive BODIPYFL variant, were not possible because BODIPYFL-C3-MTS does not label the β19′C residue. Thus, our study illustrates the advantages and current limitations of biosynthetically incorporating fUAAs into ion channels at buried residues.
Methods
Reagents and materials
Preparation of α-NVOC-L-Lys(BODIPYFL)-O-dCA
All reagents were purchased from Sigma-Aldrich (St. Louis, Mo.) unless otherwise noted. The high-performance liquid chromatography (HPLC) instrumentation was described elsewhere (35). We prepared α-NVOC-L-Lys(BODIPYFL)-OCH2CN using the protocol reported for α-NVOC-ɛ-(6-(biotinoyl)amino)hexanoyl-L-lysine cyanomethylester (35). Briefly, ɛ-Boc-L-Lys (100 mg, 0.41 mmol; Bachem, Torrance, CA), NVOC-Cl (168 mg, 0.62 mmol), and Na2CO3 (65 mg, 0.62 mmol) were dissolved in 18 MΩ H2O/dioxane (1:1.4, 85 mL) and stirred at room temperature for 8 h. The presence of product was confirmed with APCI−-MS: calculated for C21H30N3O10− 484.19; found [M − H]−: 484.1. Then, 15 mL of 1 M NaHSO4 were added to the reaction, and α-NVOC-ɛ-Boc-L-Lys was extracted with CH2Cl2 (30 mL × 3). The CH2Cl2 fractions were combined and removed by rotary evaporation. The sample was not further purified, and α-NVOC-ɛ-Boc-L-Lys (∼19.8 mg, 0.04 mmol) was dissolved in CH2Cl2 (3 mL). The TFA (3 mL) was added, and the mixture was stirred at room temperature. The CH2Cl2 was added 30 min later, and the solvents were removed with rotary evaporation. The α-NVOC-L-Lys was purified with semipreparative HPLC, using a linear gradient of 100% 25 mM NH4Ac buffer (pH 4.5) against the organic phase (98%/2% ACN/18 MΩ H2O) for ∼60 min. Fractions corresponding to the 350-nm absorption peak from the NVOC group were pooled and lyophilized. The NVOC absorption extinction coefficient at 260 nm ɛ260 (2140 M−1 cm−1) was used to determine that 12.1 mg (77% yield) of product were obtained. The presence of α-NVOC-L-Lys was confirmed by positive mode atmospheric pressure chemical pressure ionization mass spectrometry: calculated for C16H24N3O8+ 386.16; found [M + H]+: 386.1. Twelve milligrams of α-NVOC-L-Lys and 5 mg of 4,4-difluoro-5,7-dimethyl-4-bora-3a,4a-diaza-s-indacene-3-propionic acid, succinimidyl ester (BODIPY FL, SE, Invitrogen, Carlsbad, CA), were dissolved in 2 mL of dimethylformamide (DMF) and 4.4 μL of diisopropylethylamine, and mixed for 7 h. An aqueous workup was performed with 25 mL of 1 M NaHSO4, and the product was extracted with CH2Cl2 (30 mL × 3). The CH2Cl2 extractions were pooled together and dried over Na2SO4 for 1 h. The CH2Cl2 was removed with rotary evaporation. The DMF was removed by simultaneously immersing the round-bottomed flask with the sample in a 60°C water bath and attaching it to a high vacuum line with solvent traps. Next, the sample was mixed with 42 μL of ClCH2CN, 3 μL of triethylamine, and 1 mL of DMF. The reaction was allowed to proceed for ∼7 h before an aqueous workup was performed with 15 mL of NaHCO3 and CH2Cl2 (25 mL × 3). The organic phase was dried over Na2SO4 for 30 min, and the CH2Cl2 was removed with rotary evaporation. The product was purified with semipreparative HPLC, using a linear gradient of 100% 25 mM NH4Ac buffer (pH 4.5) against the organic phase (98%/2% ACN/18 MΩ H2O) for ∼60 min. The fractions that had both absorbance peaks of the NVOC (∼350 nm) and BOPIDYFL (∼504 nm) and identical elution times were collected, pooled, and lyophilized. The product yield was 6.8 mg (76% yield). The sample was identified by positive mode electrospray ionization mass spectrometry: calculated for C32H38BF2N6O9+ 699.28; found [M + H]+: 699.2, and the solvent was lyophilized. The 1H NMR (300 MHz, CD3CN) δ 7.70 (s, 1H), 7.36 (s, 1H), 7.13 (s, 1H), 7.00 (d, 1H), 6.44 (m, 2H), 6.31 (d, 1H), 6.23 (s, 1H), 5.43 (m, 2H), 4.82 (s, 2H), 4.24 (m, 1H), 3.95 (s, 3H), 3.89 (s, 3H), 3.15 (m, 4H), 2.53 (m, 2H), 2.27 (s, 3H), 2.17 (m, 3H), 1.8 (m, 2H), and 1.42 (m, 4H).
The α-NVOC-L-Lys(BODIPYFL)-O-CH2CN and dCA were dissolved in 1 mL of DMF and stirred under argon (Ar) for ∼24 h (in vacuo). The presence of sample was confirmed with analytical HPLC. Preparative HPLC was used to purify α-NVOC-L-Lys(BODIPYFL)-O-dCA, and negative mode electrospray ionization mass spectrometry: calculated for C49H59BF2N13O21P2− 1,276.35; found [M − H]−: 1276.4 confirmed the presence of product from the fractions that contained absorption peaks at 350 and 505 nm. The product yield was 36.1 μg (1.6% yield), based on the BODIPYFL absorption 504-nm absorption peak and an extinction coefficient of ɛ504 (80,000 M−1cm−1) (36).
Preparation of BODIPYFL-C3-MTS
Twelve milligrams of 3-aminopropyl methanethiosulfonate hydrobromide (Toronto Research Chemicals, Toronto, Ontario, Canada) and 250 μg of 4,4-difluoro-5,7-dimethyl-4-bora-3a,4a-diaza-s-indacene-3-propionic acid, succinimidyl ester (BODIPY FL, SE, Invitrogen), were dissolved in 1 mL of DMF and 10 μL of diisopropylethylamine and mixed for 1.5 h. The product was purified with semipreparative HPLC, using a linear gradient of aqueous phase (2%/98% ACN/18 MΩ H2O) against the organic phase (98%/2% ACN/18 MΩ H2O) for ∼30 min. The fractions that had the BOPIDYFL (∼504 nm) absorbance peak were collected, pooled, and lyophilized. The sample was then identified by positive mode electrospray ionization mass spectrometry: calculated for [M + K]+ 482.13; found [M + K]+: 482.0, and the solvent was lyophilized. The product yield was determined to be 324 μg (57% yield), based on the BODIPYFL absorption 504-nm absorption peak and extinction coefficient of ɛ504 (80,000 M−1cm−1) (36).
Preparation of YFaFSACCC-α-NVOC-L-Lys(BODIPYFL)
The YFaFSACCC tRNA was prepared by linearization of pUC19 containing the YFaFSACCC gene with Fok1, which yields 74mer-tRNA upon in vitro transcription with the MegaShortScript kit (Ambion, Austin, TX) (37). The dCA-α-NVOC-L-Lys(BODIPYFL) was ligated to the 74mer-YFaFSACCC with T4 RNA ligase, which yielded YFaFSACCC-α-NVOC-L-Lys(BODIPYFL) as previously described (38–40). The product was desalted with a CHROMA SPIN-30 DEPC-H2O column (Clonetech, Mountain View, CA). The presence of product was confirmed with ultraviolet absorption at 260 nm and matrix assisted laser desorption ionization mass spectrometry. The major peak indicated that YFaFSACCC-α-NVOC-L-Lys(BODIPYFL) was the principal product of the ligation reaction.
Construct preparation and mRNA transcription
The mouse muscle nAChR subunits (α, γ, and δ) are in the pAMV vector. The β19′GGGU construct was prepared by QuikChange (Stratagene, La Jolla, CA) mutagenesis on the masked β-subunit in the pAMV vector (37). The mutation was verified by sequencing (California Institute of Technology Sequencing/Structure Analysis Facility). The mRNAs were prepared from NotI linearized plasmid DNA, using a T7 mMessage mMachine kit (Ambion), and were purified with the RNeasy Mini kit (Qiagen, Valencia, CA). Concentration was determined by absorption at 260 nm.
The γeGFP construction was prepared as follows. The eGFP insertion in the γ-M3-M4 cytoplasmic domain has no effect on the electrophysiological properties of nicotinic receptors (αβγeGFPδ) (41). Therefore, we inserted eGFP after position S380 in the γ-M3-M4 cytoplasmic loop by polymerase chain reaction. The construct was synthesized from three segments by polymerase chain reaction. Primers to amplify the first segment are γeGFP - Forward No. 1 (ACC ATG GCA CAA GGG GGC CAG AGA CCT CAT CTC CTC TTG CTG, where ATG is the initiation codon of the γ-subunit); γeGFP -Reverse No. 1 (5′- CAG CTC CTC GCC CTT GCT CAC CAT TGA GGA AGA GCC ATT CTG GAG TCG-3′; bold sequences represent the N-terminal of eGFP). The second segment was synthesized by γeGFP -Forward No. 2 (5′- CGA CTC CAG AAT GGC TCT TCC TCA ATG GTG AGC AAG GGC GAG GAG CTG -3′; bold sequences represent the N-terminus of the eGFP) and γeGFP -Reverse No. 2 (5′- CTC TCG AGC CAT GAT GGG CCA CCC CTT GTA CAG CTC GTC CAT GCC GAG -3′; bold sequences represent the C-terminus of eGFP). The third segment was synthesized by the following γeGFP -Forward No. 3 (5′- CTC GGC ATG GAC GAG CTG TAC AAG GGG TGG CCC ATC ATG GCT CGA GAG -3′; bold sequences represent the C-terminus of the eGFP) and γeGFP -Reverse No. 3 (5′- GTC GAC TCA GTC TGG CAA AGG CAG GTA GGG GCG GGG GTC TCC -3′; bold TCA represents the termination codon of the γ-subunit). Finally, the entire construct was amplified from all three segments, using γeGFP -Forward No. 1 and γeGFP -Reverse No. 3, and was subcloned into the pAMV vector. The entire construct was verified by DNA sequencing (Davis Sequencing, Davis, CA).
Oocyte preparation, injection, and αBtxAlexa488 labeling
Stage VI oocytes from Xenopus laevis were isolated and maintained at 16°C in ND96 solution consisting of 96 mM NaCl, 2 mM KCl, 1 mM MgCl2, 1.8 mM CaCl2, and 5 mM HEPES (pH 7.5), supplemented with Na pyruvate (2.5 mM), gentamycin (50 μg/mL), theophylline (0.6 mM), and horse serum (5%). Before injection, YFaFSACCC-α-NVOC-L-Lys(BODIPYFL) was irradiated at 350 nm to cleave the NVOC group, yielding the deprotected tRNA-fUAA (YFaFSACCC-Lys(BODIPYFL)). Then the YFaFSACCC-Lys(BODIPYFL) was kept at 4°C until mixing with the mRNA and loaded for oocyte injection. Each oocyte was injected with a 1:1 volume mixture of YFaFSACCC-Lys(BODIPYFL) (12.5 or 25 ng) and mRNA (25 ng of total concentration ratio of 2:5:1:1 for α/β19′GGGU/γ/δ subunits) in a 50-nL volume. Wild-type (WT) nAChR α, β, and δ and either WT γ or γeGFP mRNA were mixed at a ratio of 2:1:1:1 and diluted to a final concentration of 1 ng/25 nL.
Oocytes were labeled with α-bungarotoxin conjugated to Alexa Fluor 488 (αBtxAlexa488) (Invitrogen), dissolved in ND96. We experimented with various labeling concentrations and incubation times, and determined that incubating oocytes with 20–40 nM αBtxAlexa488 for 8–12 h resulted in optimal labeling. The incubations were terminated by transferring oocytes to a 5 mg/mL bovine serum albumin solution, followed by two ∼30-min washes in ND96 before imaging. The manufacturer furnished αBtxAlexa488 at a nominal concentration of 1 μg/μL. We determined the molar ratio of αBtx to Alexa Fluor 488 more precisely, using the known αBtxAlexa488 MW = 8600 (αBtx MW = 7966.23 Da, Alexa Fluor 488 carboxylic acid = 532.5 Da, and linker MW = unknown, assumed to be 100 Da), the Alexa488 absorption peak at 488 nm, the extinction coefficient of 65,000 M−1cm−1 (36), and the NanoDrop (Thermo Scientific, Wilmington, DE) A280 protein assay. The molar ratio of αBtx/Alexa488 was 1:0.74. The attempted labeling of the nAChR β19′C receptor with 5 nM and 5 μM BODIPYFL-C3-MTS was performed as previously reported (30).
Electrophysiology
A two-electrode voltage clamp was used to record currents from oocytes. Recordings were performed 24–48 h after injection with a GeneClamp 500 amplifier (Axon Instruments, Union City, CA). The pipette microelectrodes were filled with 3 M KCl, and had resistances ranging from 0.5–2 MΩ. Oocytes were perfused continuously with a calcium-free solution containing 96 mM NaCl, 2 mM KCl, 1 mM MgCl2, and 5 mM HEPES (pH 7.5). The ACh-induced currents were recorded in response to a series of ACh applications (1–1000 μM).
Total internal reflection fluorescence microscopy
Xenopus oocytes were prepared for single-molecule TIRF microscopy as follows. The oocytes were transferred to a petri dish filled with hypertonic solution (220 mM Na aspartate, 10 mM EDTA, 2 mM MgCl2, and 10 mM HEPES, pH 7.4) and incubated for 5–10 min. The vitelline membrane was removed with forceps, under a dissecting microscope. Oocytes were transferred to an imaging chamber mounted on the microscope stage. The imaging chamber bottom had a glass coverslip that was cleaned with one of two protocols. The first protocol consisted of rinsing with 90% EtOH and 18 MΩ water. Alternatively, they were immersed in a solution composed of (v/v) 90% 18 MΩ water/7% H2SO4/3% H2O2. The oocyte was positioned with the animal pole oriented toward the coverslip. The vegetal pole was not used because of a high autofluorescence background. Experiments were performed at 18–20°C, to minimize sample drift and maximize the amount of time the oocytes remained mechanically stable. Before imaging, we allowed oocytes to incubate in the imaging chamber for ∼10 min, to maximize adherence. Next, transmitted bright-field illumination was used to confirm oocyte adherence, using coarse focus. Oocytes typically adhered over a circular area ≥200 μm in diameter. A region of interest was selected to focus and establish the TIRF condition, using laser excitation (<140 mW/cm2). An adjacent area was used to conduct measurements, so as to limit unintended photobleaching during fine focus. In experiments where macroscopic experiments show adequate expression, nearly all injected oocytes yield TIRF images with clearly isolated puncta. The most informative data are generated from images whose puncta density is in the measurable range, i.e., 0.001–0.06/μm2. Anomalously high backgrounds are found in the <5% of oocytes that collapse and tear in the imaging chamber. These oocytes were most likely damaged during vitelline membrane removal, and are excluded from analysis. The TIRF microscope for collecting images consists of a Melles-Griot Ar ion laser (CVI Melles Griot, Carlsbad, CA) coupled to a fiber optic that extended to an Olympus TIRF illuminator adapted to an IX-71 Olympus inverted microscope (Center Valley, PA). The Ar laser emits three wavelengths: at 457 nm (∼2 mW), 488 nm (∼15.6 mW), and 514 nm (∼10 mW). We selected the 488-nm wavelength, required to excite and detect Lys(BODIPYFL), γeGFP, and αBtxAlexa488, using the Z488 filter cube (Chroma Technology Corp., Rockingham, VT). The unfiltered maximum power at the objective entrance was 4.4 mW (∼140 mW/cm2). Where appropriate, neutral density filters were used to reduce power by up to threefold during imaging. The integration time was 0.5 s for all images. A 100× 1.45-NA TIRF objective (Olympus) was used. Time-lapse images were captured with a Photometrics Cascade 650 front-illuminated CCD camera (Princeton Instruments, Trenton, NJ). The frame area at ×100 magnification is 48.3 × 36.4 μm = 1728.1 μm2. Slidebook (Intelligent Imaging Innovations, Inc., Santa Monica, CA) was used to acquire data. The data were subsequently processed and analyzed with ImageJ (National Institutes of Health, Bethesda, MD) (42), Clampfit 9.2 (Axon Instruments, Foster City, CA), Origin 7.0 (OriginLab, Northampton, MA), and MatLab R2006a (The MathWorks, Inc., Natick, MA).
Image analysis
The images acquired with Slidebook were exported as 16-bit time series stack files in TIFF format. The ImageJ (National Institutes of Health) region of interest (ROI) manager was used to document the puncta in the first frame of time stacks. Rectangular 15 × 15 pixel ROIs, centered on a putative single punctum, were duplicated and batch-processed using MatLab R2006a. The point-spread function (PSF) of individual puncta were fit to a two-dimensional Gaussian function:
| (1) |
where (xc, yc) is the centroid of the punctum, Sx and Sy are the respective standard deviations along the x axis and y axis, A is the amplitude, and B is the baseline. Next, the full width at half-maximum (FWHMx,y) along the x and y axes were determined, , and compared against the FWHMtheoretical PSF of the microscope, which is approximated by the equation (43,44):
| (2) |
where λemission is the emission peak of the fluorescent molecule, and NA is the numerical aperture of the objective (NA = 1.45). The PSF is deformed by several factors, including spherical aberrations, excitation-field nonuniformity (45,46), pixel nonuniformity, background nonuniformity (45), and others. Demuro and Parker reported that muscle nAChRs undergo lateral motions of ±<50 nm on a time scale of ∼10 s (47). Therefore, puncta with FWHMx,y = 195 ± 74.5 nm (or 2.91 ± 1 pixels) were classified as diffraction-limited, immobile spots, and were selected for puncta density and photobleaching analysis. Time-lapse images with minimal lateral and vertical drift were selected for photobleaching step analysis. The peak pixel value against time was plotted for ROIs with puncta that fulfilled the stated FWHMx,y criteria. Time-lapse traces were imported into Clampfit and analyzed.
Results
In the nonsense and frameshift-suppression methodologies for site-specific UAA incorporation, the chemically amino-acylated tRNA is a stoichiometric reagent that limits the number of functional channels that can be expressed (48). This low expression level is well-suited to the sensitivity of electrophysiology. Here we demonstrate that single-molecule TIRF microscopy complements the sensitivity of electrophysiology. TIRF microscopy excites only molecules that are within ∼100 nm of the glass surface, thereby minimizing interference from cytoplasmic autofluorescence, including unincorporated fUAAs (tRNA-fUAA or free fUAA). Thus, TIRF microscopy, integrated with a CCD camera with single-molecule sensitivity, enables the optical detection of ion channels expressed at the plasma membrane in low numbers (< 0.015/μm2).
tRNA-fUAA and heterologous expression in Xenopus oocytes
Based on previous cell-free synthesis applications (15,49,50) and photophysical properties, i.e., favorable absorption coefficient (ɛ, ∼80,000–91,000 M−1 cm−1) and quantum yield approaching 1.0 (15,36), Lys(BODIPYFL) (Fig. 1 B) was selected as the fUAA for incorporation into nAChR. The single amino-acid substitution of Lys(BODIPYFL) (Fig. 1 B) is presumably less perturbing than substituting eGFP (Fig. 1 A) into the transmembrane α-helix (Fig. 1 D). For fUAA incorporation, we chose to use the yeast Phe frameshift-suppressor (YFaFSACCC) that recognizes the quadruplet codon GGGU and contains seven mutations in the acceptor stem (denoted by lower-case “a”) to avoid recognition by endogenous aminoacyl-tRNA synthetases (aaRSs). The YFaFSACCC is recognized least by the endogenous aaRSs of any suppressor tRNA screened in our laboratories, and therefore should not incorporate natural amino acids at the suppression site (37,51,52). As described in Methods, we first synthesized dCA-Lys(BODIPYFL), the fUAA chemically amino-acylated on the dinucleotide deoxyCA, and then enzymatically ligated dCA-Lys(BODIPYFL) to the frameshift-suppressor tRNA lacking the terminal CA nucleotides (74mer-YFaFSACCC), which yielded YFaFSACCC-Lys(BODIPYFL), the full-length 76mer-tRNA ligated to the fUAA. The YFaFSACCC-Lys(BODIPYFL) was mixed with nAChR α/β19′GGGU/γ/δ mRNA and injected into Xenopus oocytes. After incubation for 1–2 days, the presence of nAChR β19′Lys(BODIPYFL) on the plasma membrane was confirmed with two-electrode voltage-clamp electrophysiology (currents for a series of 5-s ACh applications are shown in Fig. 2 A). The average maximal currents evoked by 1 mM ACh (Imax) were 6.3 ± 0.6 μA (n = 5 oocytes) and 3.5 ± 0.2 μA (n = 4 oocytes) for oocytes injected with 25 and 12.5 ng YFaFSACCC-Lys(BODIPYFL), respectively. The ACh dose-response relationships were generated for nAChR β19′Lys(BODIPYFL) and WT nAChR. The measured EC50 values were 38 ± 2 and 60 ± 4 μM ACh, respectively, and the Hill coefficients were 1.1 ± 0.05 and 1.3 ± 0.01, respectively (n = 5 and 9 oocytes, respectively) (Fig. 2 B). Substantially smaller currents were detected from oocytes injected with nAChR β19′GGGU mRNA only (Imax = 0.78 ± 0.5 μA; n = 3 oocytes) or nAChR β19′GGGU mRNA with 74mer-YFaFSACCC (Imax = 1.1 ± 0.3 μA; n = 3 oocytes) (Fig. 2 C).
Figure 2.
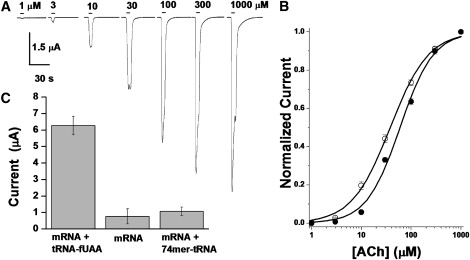
Electrophysiological properties of oocytes expressing nAChR β19′Lys(BODIPYFL). (A) Representative ACh-induced currents during a dose-response series, in an oocyte expressing nAChR β19′Lys(BODIPYFL) receptor. Each ACh application lasted 5 s. (B) Dose-response curve for nAChR β19′Lys(BODIPYFL) (open circles), compared with WT data (solid circles). Error bars are mean ± SE (n = 5 oocytes). Smooth curves represent a fitted single-component dose-response relationship for nAChR β19′Lys(BODIPYFL) (EC50, 38 ± 2 μM; Hill coefficient, 1.1 ± 0.05) and WT (EC50, 60 ± 4 μM; Hill coefficient, 1.3 ± 0.01). (C) Average current induced by 1- mM ACh application in oocytes injected with 25 ng of α/β19′GGGU/γ/δ mRNA + 25 ng YFaFSACCC-Lys(BODIPYFL) (mRNA + tRNA-fUAA), 25 ng α/β19′GGGU/γ/δ mRNA only (mRNA), and 25 ng α/β19′GGGU/γ/δ mRNA + 25 ng 74mer-YFaFSACCC (mRNA + 74mer-tRNA).
Single-molecule TIRF microscopy of an incorporated fUAA
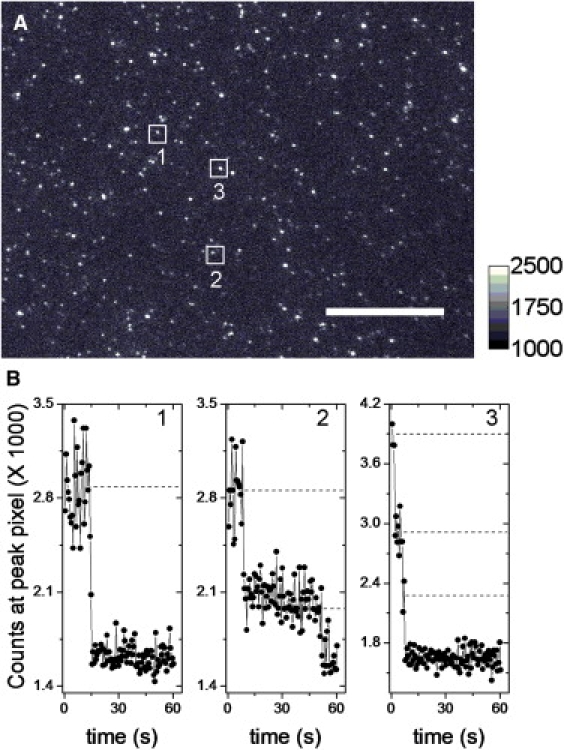
Single-molecule TIRF microscopy was used to detect the presence of nAChR β19′Lys(BODIPYFL) in the plasma membrane (Fig. 3, A and B). Sparse fluorescent puncta (<0.10 puncta/μm2) were detected 24 h after coinjection of YFaFSACCC-Lys(BODIPYFL) (12.5 ng/oocyte) with nAChR β19′GGGU mRNA (25 ng/oocyte; n = 5 oocytes; Fig. 3 A and Fig. S1 A in the Supplementary Material). Control oocytes from the same batch were always injected with YFaFSACCC-Lys(BODIPYFL), (i.e., with tRNA-fUAA, but no mRNA), and sparse puncta were detected at lower levels (< 0.015 puncta/μm2) (Fig. S1 B). The PSF of emission profiles (Fig. 3 B) of fluorescent single molecules were fitted to a two-dimensional Gaussian function (45,53) (Fig. 3 C). We compared the two-dimensional Gaussian FWHMx,y along the x and y axes against the theoretical FWHM. The emission peak of BODIPYFL is ∼515 nm (36). Therefore, we defined puncta with a FWHMx,y = 195 ± 74.5 nm (1 pixel) as diffraction-limited spots for further analysis. Twenty percent to 50% of all puncta detected were diffraction-limited regions, consistent with the PSF of the TIRF microscope. Time-series traces with single-molecule photobleaching events were observed from puncta with diffraction-limited regions (Fig. 3 D). Time-series imaging experiments demonstrated that the puncta originated from one (80%), two (17%), or three (3%) molecules (n = 3 oocytes, 151 puncta), as determined by discrete photobleaching events. Thus, although the majority of puncta represented a single molecule, a subset represented more than one molecule per diffraction-limited spot.
Figure 3.
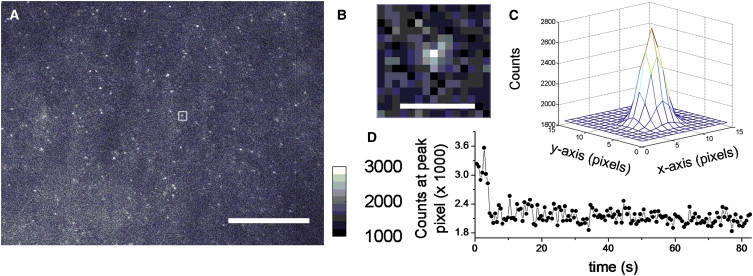
TIRF microscopy images of a representative oocyte expressing nAChR β19′Lys(BODIPYFL). (A) An oocyte injected with nAChR α/β19′GGGU/γ/δ mRNA and YFaFSACCC-Lys(BODIPYFL). Scale bar represents 12 μm. The counts calibration bar with linear dynamic range is selected for best display. The square is a representative punctum selected for presentation. (B) Representative punctum in 15 × 15 pixel region corresponding to square in A. Scale bar represents 10 pixels, or 0.74 μm. (C) Two-dimensional Gaussian fit of punctum in B. (D) Single-molecule time-series photobleaching trace from selected punctum.
To verify our observations with nAChR β19′Lys(BODIPYFL), we synthesized a thiol-reactive BODIPYFL derivative, BODIPYFL-C3-MTS (Fig. 1 E). The nAChR β19′C was previously labeled with sulforhodamine-MTS (MTSR), and voltage-clamp fluorometry was performed (30). Thus, we experimented with labeling nAChR β19′C with BODIPYFL-C3-MTS, to compare the two labeling strategies directly. However, the TIRF microscopy images show no difference between uninjected oocytes and those expressing nAChR β19′C labeled with BODIPYFL-C3-MTS. This observation agrees with reports that nAChR β19′C is primarily accessible to positively charged thiol-reactive probes (54).
Ulbrich and Isacoff demonstrated the power of counting ion-channel subunits by using genetically fused fluorescent proteins (55). Therefore, we evaluated an alternative strategy, which consisted of generating a nAChR mutant with genetically fused eGFP. Previous data indicated that function and trafficking are well-preserved when FPs are incorporated into the M3-M4 intracellular loop of muscle (and neuronal α4β2) nicotinic receptors (41,56,57). Thus, a nAChR γ-subunit construct with eGFP inserted in the M3-M4 loop (nAChR γeGFP) served as a positive control for our observations with nAChR β19′Lys(BODIPYFL). The nAChR γeGFP receptors were heterologously expressed in oocytes at similar levels as in nAChR β19′Lys(BODIPYFL), and diffraction-limited puncta were detected (Fig. 4 A and Fig. S1 C). Puncta from uninjected oocytes were essentially nonexistent (Fig. S1 D). The nAChR γeGFP puncta consisted of ∼1 (80%) (Fig. 4 B) and 2 (20%) photobleaching steps (n = 3 oocytes, 179 puncta), i.e., similar to nAChR β19′Lys(BODIPYFL). The amplitudes obtained from the Gaussian fits of individual puncta from nAChR β19'Lys(BODIPYFL) and nAChR γeGFP at a similar excitation power density (133 mW/cm2) were compared. The nAChR β19′Lys(BODIPYFL) and nAChR γeGFP displayed log-normal distributions (58), with a peak value at 1064 counts and log standard deviation (log SD) of 0.43 (n = 3 oocytes, 135 puncta), and a peak value at 501 counts with a log SD of 0.51 (n = 2 oocytes, 78 puncta), respectively (Fig. 5).
Figure 4.
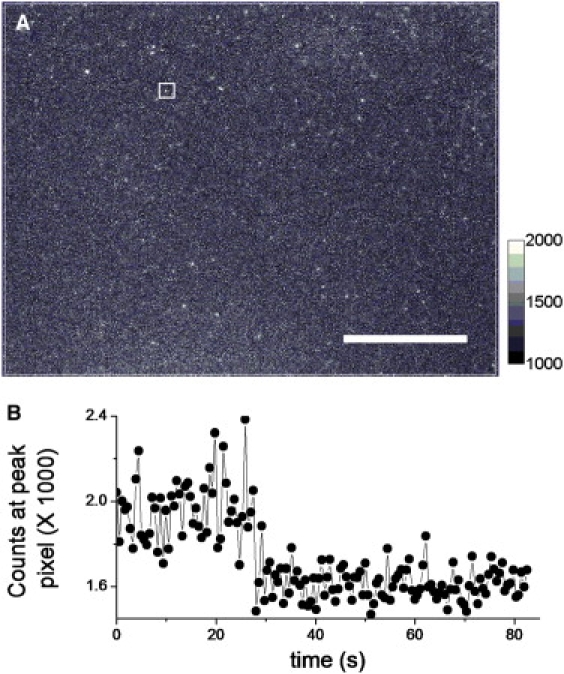
TIRF microscopy images of representative oocyte expressing nAChR γeGFP. (A) An oocyte injected with nAChR γeGFP. Scale bar represents 12 μm. The counts calibration bar with linear dynamic range is selected for best display. (B) Representative single-molecule time-series trace from selected punctum.
Figure 5.
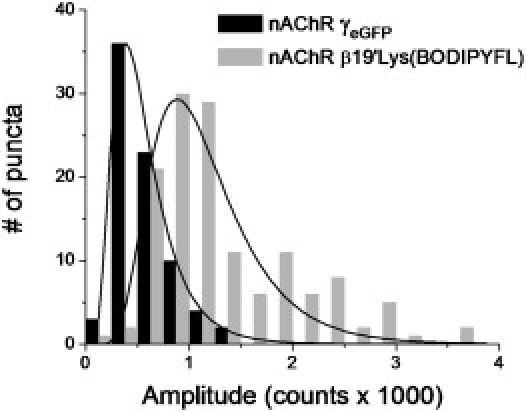
Histograms of puncta amplitudes from oocytes expressing either nAChR γeGFP (black bars) or nAChR β19′Lys(BODIPYFL) (gray bars), using similar imaging conditions. The nAChR β19′Lys(BODIPYFL) and nAChR γeGFP displayed log-normal distributions with a peak value at 1064 counts and a log SD of 0.43 (n = 3 oocytes, 135 puncta), and a peak value at 501 counts and a log SD of 0.51 (n = 2 oocytes, 78 puncta), respectively.
nAChR fluorescent ligand confirms the presence of nAChR β19′Lys(BODIPYFL) and nAChR γeGFP
To gain confidence that the puncta originated from nAChR β19′Lys(BODIPYFL) and nAChR γeGFP receptors, we compared the signals with those for receptors labeled with α-bungarotoxin monoconjugated to Alexa488 (αBtxAlexa488). Two αBtx molecules bind each muscle nAChR irreversibly (59) on the time scale of interest in this study. Thus, time-series traces with three photobleaching events were expected when we labeled nAChR β19′Lys(BODIPYFL) and nAChR γeGFP. First, WT nAChRs were used to determine the αBtxAlexa488 baseline level of labeling and the photobleaching step distribution. The WT nAChR was expressed at similar levels as nAChR β19′Lys(BODIPYFL), as confirmed by ACh-induced currents (Imax = ∼2 μA). The WT nAChR labeled with αBtxAlexa488 displayed puncta (Fig. S2 A) with a log-normal amplitude distribution with a peak value at 773 counts and a log SD of 0.45 (n = 2 oocytes, 149 puncta; 43 mW/cm2), and the peak value increased to 1157 counts with a log SD of 0.43 at a higher power density (n = 1 oocyte; 102 puncta; 69 mW/cm2) (Fig. 6 A). All photobleaching step analysis was restricted to a relatively low power density of 43 mW/cm2, to resolve multiple steps before photobleaching. The WT nAChR labeled with αBtxAlexa488 resulted in 1 (48% ± 2%), 2 (43% ± 3%), 3 (6% ± 1%), and 4 (3% ± 1%) detected photobleaching steps (n = 2 oocytes, 144 puncta) (Fig. 6 B). Despite the two αBtx sites per receptor, WT receptors labeled with αBtxAlexa488 displayed a plurality (∼48%) of single bleach steps under all conditions. We ascribe this result to the incomplete labeling of αBtxAlexa488 (∼74% of αBtx are labeled by a fluorescent Alexa488; see Methods) and to the unintentional photobleaching of fluorescent molecules during sample-handling and a brief fine focus before image acquisition. Thus, if (1), ∼20% of puncta contain two receptors and 80% contain one receptor, as based on results from nAChR β19′Lys(BODIPYFL) and nAChR γeGFP, and (2), 74% of the αBtx have a fluorescent Alexa488, then the theoretical binomial fluorescent dye distribution per puncta is: 0 (6%), 1 (32%), 2 (48%), 3 (8%), and 4 (6%). Excluding the nonmeasurable nonfluorescent dyes (0 steps), the theoretical photobleaching step distribution becomes 1 (34%), 2 (51%), 3 (9%), and 4 (6%). However, Alexa488 photobleaches during fine focus. The measured photobleaching step distribution is adequately explained by assuming that the original 74% of fluorescent αBtx molecules decreased to 57%: the theoretical observable distribution becomes 1 (49%), 2 (41%), 3 (8%), and 4 (2%). We use the following assumptions throughout our step photobleaching analysis: 20% of diffraction-limited puncta contain two nAChRs, and 57% of the αBtx contain fluorescent Alexa488.
Figure 6.

TIRF microscopy of oocyte expressing WT nAChR labeled with αBtxAlexa488. (A) WT nAChRs labeled with αBtxAlexa488. Representative puncta in boxed squares correspond to one and two photobleaching steps. Scale bar equals 12 μm. (B) Representative traces, with one and two photobleaching steps. Dashed guidelines indicate fluorescence levels.
The nAChR γeGFP were labeled with αBtxAlexa488 (Fig. 7 A and Fig. S2 B), and we detected a distribution of 1 (40% ± 3%), 2 (33% ± 2%), 3 (18% ± 3%), and ≥4 (9% ± 3%) photobleaching steps (n = 2 oocytes, 148 puncta) (Fig. 7 B). Interestingly, the puncta density ratio between the nAChR γeGFP receptors and the receptors labeled with αBtxAlexa488 was 0.33 (n = 4; two oocyte batches). The apparent underreporting by the γeGFP label, compared with αBtxAlexa488, arises from at least two factors. The first is unintended photobleaching during fine focus: eGFP bleaches more quickly than Alexa488. The second is that <100% of eGFP molecules reach the mature fluorescent state (2). Again, if we assume that αBtxAlexa488 is reporting the presence of only 57% of receptors, then the expected binomial distribution for photobleaching steps is: 1 (36%), 2 (41%), 3 (15%), and 4–6 (8%).
Figure 7.
TIRF microscopy of oocyte expressing nAChR γeGFP labeled with αBtxAlexa488. (A) nAChR γeGFP labeled with αBtxAlexa488. Puncta in boxes are diffraction-limited spots with 1, 2, and 3 photobleaching steps. Scale bar represents 12 μm. The intensity calibration bar with linear dynamic range is selected for best display. (B) Representative traces with 1, 2, and 3 photobleaching steps. Dashed guidelines indicate fluorescence levels.
As expected, a subset of puncta containing the nAChR β19′Lys(BODIPYFL) labeled with αBtxAlexa488 yielded three discrete photobleaching steps, in agreement with the predicted stoichiometry (Fig. 8, A and B, and Fig. S2 C). The oocytes injected with nAChR β19′GGGU mRNA and YFaFSACCC-Lys(BODIPYFL), and incubated with αBtxAlexa488, displayed puncta with 1 (44% ± 8%), 2 (36% ± 2%), 3 (18% ± 8%), and 4–6 (2% ± 1%) photobleaching steps (n = 3 oocytes, 194 puncta). The puncta density ratio between nAChR β19′Lys(BODIPYFL) and nAChR β19′Lys(BODIPYFL) labeled with αBtxAlexa488 was 0.47. If the probability of a punctum having one detectable Lys(BODIPYFL) per nAChR is 47%, then the binomial distribution for measurable photobleaching steps is: 1 (31%), 2 (41%), 3 (19%), and 4–6 (9%). Thus, the measured photobleaching-step percentages are within ∼13% of values expected from straightforward molecular labeling (Fig. 9 A).
Figure 8.
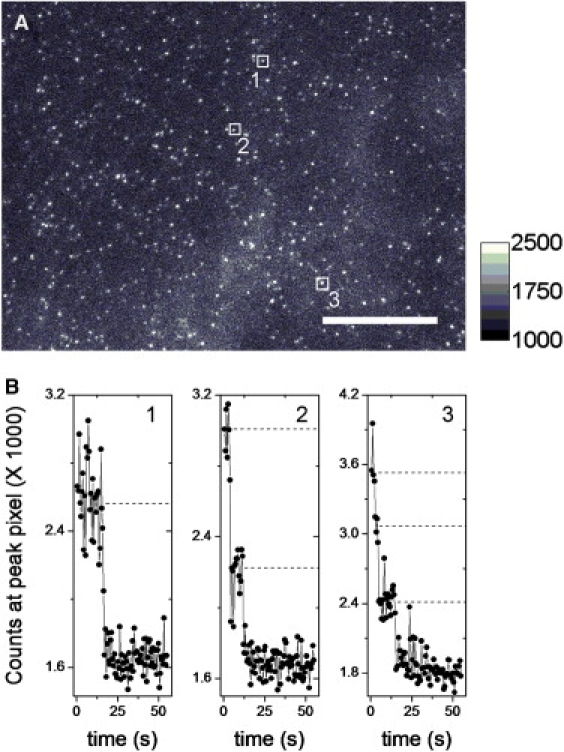
TIRF microscopy of an oocyte expressing nAChR β19′Lys(BODIPYFL) labeled with αBtxAlexa488. (A) TIRF image of an oocyte expressing nAChR β19′Lys(BODIPYFL) receptors labeled with αBtxAlexa488. Puncta in boxes are diffraction-limited spots with 1, 2, and 3 photobleaching steps. Scale bar represents 12 μm. The intensity calibration bar with linear dynamic range selected for best display. (B) Representative traces with 1, 2, and 3 photobleaching steps, corresponding to puncta in squares. Dashed guidelines indicate fluorescence levels.
Figure 9.
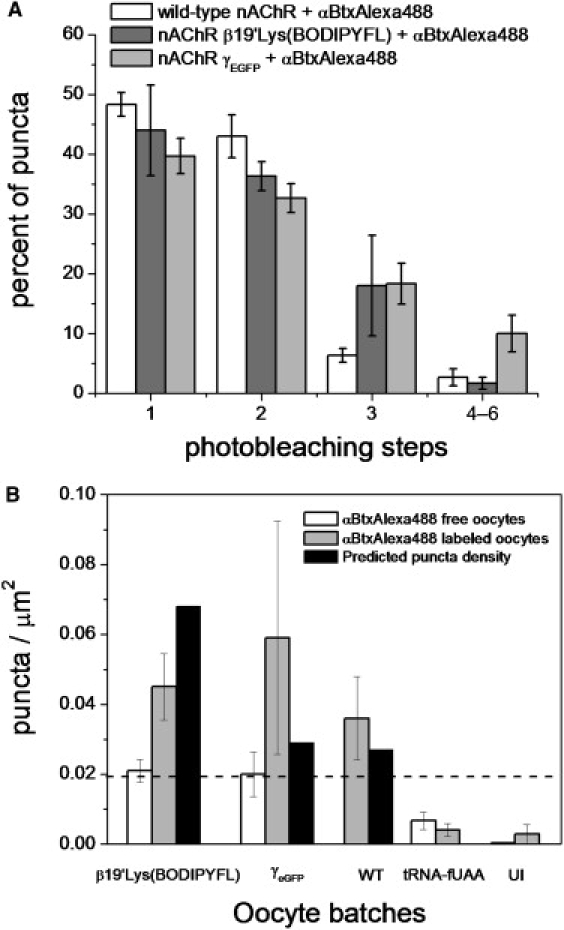
Summary of photobleaching steps and puncta-density statistics. (A) Percent of puncta versus number of photobleaching steps measured for oocytes with surface-expressed WT nAChRs, nAChR β19′Lys(BODIPYFL), and nAChR γeGFP labeled with αBtxAlexa488, and imaged under similar conditions. Error bars report the mean ± SE. (B) Average puncta density for oocytes expressing nAChR β19′Lys(BODIPYFL) (β19′Lys(BODIPYFL)), nAChR γeGFP (γeGFP), WT nAChR (WT), YFaFSACCC-Lys(BODIPYFL) (tRNA-fUAA), and uninjected (UI) oocytes with and without αBtxAlexa488 labeling. The puncta density predicted from current density is plotted for nAChR β19′Lys(BODIPYFL), nAChR γeGFP, and WT nAChR oocytes. Dashed line represents correspondence between puncta density of 0.019/μm2 and expected current of 1 μA. Error bars report mean ± SE.
Fluorescent puncta density and current density analysis
We observed that the optimal single-molecule TIRF microscopy range was Imax = 1–5 μA for WT nAChRs (subsequently labeled with αBtxAlexa488) and for nAChR γeGFP. In oocytes with ACh-induced currents <1 μA, no nAChR γeGFP receptors were detected. Thus, we compared puncta density with recorded currents. We made the following assumptions: 1), The nAChRs were distributed homogenously throughout the oocyte plasma membrane. 2), The oocyte plasma membrane uniformly adhered to the glass coverslip during single-molecule TIRF imaging, so that the measured image frames can be extrapolated to the entire oocyte. 3), Stage VI Xenopus oocyte plasma membrane capacitance is 0.25 μF (reported range, 0.19–0.25 μF) (60,61). 4), The specific membrane capacitance is 0.8 μF/cm2 (62), implying that the average total oocyte plasma membrane area is 3.13 × 107 μm2. 5), Desensitization was negligible during the growth phase of ACh-induced currents, so that Imax measures the simultaneous activation of all receptors. 6), Receptors in microvilli that contribute to capacitance measurements are retained during imaging (63). Additional experimental details were as follows: 7), The image frame area was 1758.1 μm2. 8), The oocyte holding potential was −60 mV. 9), Under the ionic conditions of our experiments, the single-channel nAChR conductance was 36 pS (64).
In experiments on WT nAChRs, Imax = 1.4 ± 0.5 μA, implying an expected density of 0.027 receptors/μm2. When these oocytes were labeled with αBtxAlexa488, we measured 0.036 ± 0.01 puncta/μm2 (range, 0.017–0.058/μm2; n = 3 oocytes) (Fig. 9 B).
In experiments with nAChR γeGFP, Imax = 1.5 ± 0.8 μA, leading to an expected receptor density of 0.029/μm2. The measured puncta density was 0.020 ± 0.006/μm2 (range, 0.013–0.032/μm2; n = 3 oocytes) (Fig. 9 B). Other oocytes from this nAChR γeGFP batch were also labeled with αBtxAlexa488. The measured puncta density for nAChR γeGFP labeled with αBtxAlexa488 was 0.059 ± 0.03/μm2 (range, 0.018–0.126/μm2; n = 3 oocytes) (Fig. 9 B). Puncta with single-molecule profiles were observed at a lower density for relevant control oocytes: the measured puncta density for uninjected and unlabeled oocytes was 0.0003 ± 0.0003 puncta/μm2 (range, 0.0–0.001/μm2; n = 4 oocytes) (Fig. S1 D).
The average puncta density for coinjection of nAChR β19′GGGU mRNA (25 ng/oocyte) and 12.5 ng YFaFSACCC-Lys(BODIPYFL) was 0.021 ± 0.003/μm2 (range, 0.015–0.028; n = 5 oocytes). The expected puncta density was 0.068 puncta/μm2 for this batch (Imax = 3.5 ± 0.2 μA, n = 4 oocytes) (Fig. 9 B). When these oocytes expressing nAChR β19′Lys(BODIPYFL) receptors were labeled with αBtxAlexa488 (Fig. S2 C), the puncta density was 0.045 ± 0.009/μm2 (range, 0.027–0.07/μm2; n = 6 oocytes) (Fig. 9 B). Thus, as expected from the data regarding labeling and dye photobleaching (Figs. 3 A and 8 A), the di-labeling of nAChRs revealed receptors that went undetected in experiments incorporating Lys(BODIPFYFL). Control oocytes from the same batch were injected (as usual) with YFaFSACCC-Lys(BODIPYFL) (12.5 ng) (i.e., with tRNA-fUAA but no mRNA), to assess how unincorporated Lys(BODIPYFL) contributed to the observed puncta. In these control oocytes, puncta were detected at a much lower average density of 0.007 ± 0.002/μm2 (range, 0.003–0.014/μm2; n = 5 oocytes) (Fig. 9 B and Fig. S1 B). When other similarly injected control oocytes were labeled with αBtxAlexa488, we measured a puncta density of 0.004 ± 0.002/μm2 (range, 0.002–0.008/μm2; n = 3 oocytes) (Fig. 9 B and Fig. S2 D). Another type of control used uninjected oocytes incubated with αBtxAlexa488; the puncta density was 0.003 ± 0.002/μm2 (range, 0.0–0.006; n = 3 oocytes) (Fig. 9 B and Fig. S2 E). Thus, the experimental values were all internally consistent within a factor of 3.2, which is acceptable, given the number of assumptions made. Two types of control yielded much lower puncta densities (Fig. 9 B).
Discussion
We performed imaging of Xenopus oocytes heterologously expressing nAChR β19′Lys(BODIPYFL) in the plasma membrane. Background signals were minimized by using the frameshift-suppressor tRNA (YFaFSACCC) (37,51,52). The frameshift strategy was crucial, because the more common nonsense-suppression strategy, using the amber suppressor tRNA (THG73), produced unacceptably high background signals (data not shown). The β19′ site is buried in the resting state of the receptor (Fig. 1 C), and the efficient incorporation of Lys(BODIPYFL) demonstrates an advantage over genetic FP insertions or posttranslational labeling, such as BODIPYFL-C3-MTS (Fig. 1 E) labeling of β19′C, which was not possible. Plasma membrane imaging of channels incorporating fUAAs with single-molecule TIRF microscopy may be considered a technique that extends beyond the incorporation of fUAAs in receptors and subsequent purification and reconstitution.
The puncta originating from nAChR β19′Lys(BODIPYFL) were brighter than those puncta from nAChR γeGFP, by an average factor of ∼2 (Fig. 5), in agreement with the known photophysics of BODIPYFL and eGFP in solution (2,15,36). This is surprising, considering that Lys(BODIPYFL) is incorporated in the interior of an ion channel (Fig. 1 C) and interacts with many other amino acids. Also, labeling with the highly specific fluorescent ligand, αBtxAlexa488, allowed us to confirm that nAChR molecules produced most of the puncta from oocytes expressing nAChR β19′Lys(BODIPYFL) and nAChR γeGFP receptors (Figs. 7 and 8). The αBtxAlexa488 studies suggest that ∼47% of the predicted Lys(BODIPYFL) are detected. Thus, similar to FPs (65,66) and quantum dots (67), there is a nonfluorescent fraction of molecules, but there are partially different reasons for each fluorophore. Dye photobleaching during synthesis, handling, expression, and focusing of a subset of nAChR β19′Lys(BODIPYFL) are the primary reasons for the dark nAChR fraction. Although our data on αBtxAlexa488 labeling might be limited by impurities in the commercial αBtxAlexa488, the resolved multistep photobleaching was consistent with the known 2:1 αBtxAlexa488/nAChR stoichiometry (59).
In general, the single-molecule labeling schemes based on genetically encoding (fUAA and eGFP) yield a ratio, (puncta density)/(receptor density expected from electrophysiology), between 0.5 and 2. The experiments with the tightly bound ligand, αBtxAlexa488, gave a ratio of 3–4. We consider this agreement quite satisfactory, considering the numerous assumptions 1–6 (above in Fluorescent Puncta Density and Current Density Analysis). The measured ratio would be changed in unknown directions by variable adherence. Although the puncta density differed between mono-labeled and di-labeled receptors because of photobleaching, many viable single fluorophores were still present, enabling parallel single-molecule measurements.
An important advantage of small-molecule fluorophores is that they are less likely than fluorescent proteins to perturb protein structure, function, and trafficking (see comparison of FP size in Fig. 1 A compared with Lys(BODIPYFL) in Fig. 1 B). This study describes a methodology to incorporate small-molecule fluorophores directly into nascent proteins, using UAA incorporation technology, and allows for the detection of single-membrane proteins in live cellular membranes. Site-specific and single-step fUAA incorporation will facilitate investigations of many membrane proteins, but are particularly useful in measuring the gating dynamics, colocalization, and trafficking in ion channels, because these channels provide complementary single-molecule measurements of function. The incorporation of fUAAs is particularly important for sites within α-helices (Fig. 1 D) and within other structural motifs that may not tolerate the large perturbation of fluorescent proteins (Fig. 1 A).
Finally, although the focus of our report is live-cell imaging, recent reports describe the super-resolution microscopy of fixed cells (45,68). The localization of fluorescent molecules with ∼2-nm resolution was reported. The resolution of single molecules is dependent on dye brightness (69). In addition, it was proposed that the power of super-resolution microcopy will be significantly enhanced with genetically encoded synthetic dyes into proteins (70). The puncta originating from nAChR β19′Lys(BODIPYFL) were brighter than those puncta from nAChR γeGFP, by an average factor of ∼2 (Fig. 5). Thus, Lys(BODIPYFL) is an attractive alternative to FPs for fixed-cell super-resolution microscopy.
Uncited references
(34).
Supplementary Material
Two figures are available at http://www.biophysj.org/biophysj/supplemental/S0006-3495(08)00012-X.
Supplementary Material
Acknowledgments
We gratefully acknowledge the assistance of Dr. E. James Petersson at the outset of this project. We thank Dr. Shelly Tzlil for single-molecule discussions, and for help with programming. Mr. Edward Wang provided assistance with ImageJ Java programming and data documentation. We also thank the members of the Lester and Dougherty Laboratory Group for invaluable discussions.
R.P. was supported by postdoctoral fellowships from the Ford Foundation and American Psychological Association Diversity Program in Neuroscience. M.I.D. was supported by a National Research Service Award from the National Institutes of Health. E.A.R. is a National Science Foundation Predoctoral Fellow. This work was supported by National Institutes of Health grants NS 11756, NS 34407, and HL 79350.
References
- 1.Ormo M., Cubitt A.B., Kallio K., Gross L.A., Tsien R.Y. Crystal structure of the Aequorea victoria green fluorescent protein. Science. 1996;273:1392–1395. doi: 10.1126/science.273.5280.1392. [DOI] [PubMed] [Google Scholar]
- 2.Tsien R.Y. The green fluorescent protein. Annu. Rev. Biochem. 1998;67:509–544. doi: 10.1146/annurev.biochem.67.1.509. [DOI] [PubMed] [Google Scholar]
- 3.Shaner N.C., Steinbach P.A., Tsien R.Y. A guide to choosing fluorescent proteins. Nat. Methods. 2005;2:905–909. doi: 10.1038/nmeth819. [DOI] [PubMed] [Google Scholar]
- 4.Mannuzzu L.M., Moronne M.M., Isacoff E.Y. Direct physical measure of conformational rearrangement underlying potassium channel gating. Science. 1996;271:213–216. doi: 10.1126/science.271.5246.213. [DOI] [PubMed] [Google Scholar]
- 5.Cha A., Bezanilla F. Characterizing voltage-dependent conformational changes in the Shaker K+ channel with fluorescence. Neuron. 1997;19:1127–1140. doi: 10.1016/s0896-6273(00)80403-1. [DOI] [PubMed] [Google Scholar]
- 6.Beatty K.E., Liu J.C., Xie F., Dieterich D.C., Schuman E.M. Fluorescence visualization of newly synthesized proteins in mammalian cells. Angew. Chem. Int. Ed. Engl. 2006;45:7364–7367. doi: 10.1002/anie.200602114. [DOI] [PubMed] [Google Scholar]
- 7.Beatty K.E., Xie F., Wang Q., Tirrell D.A. Selective dye-labeling of newly synthesized proteins in bacterial cells. J. Am. Chem. Soc. 2005;127:14150–14151. doi: 10.1021/ja054643w. [DOI] [PubMed] [Google Scholar]
- 8.Deiters A., Cropp T.A., Summerer D., Mukherji M., Schultz P.G. Site-specific PEGylation of proteins containing unnatural amino acids. Bioorg. Med. Chem. Lett. 2004;14:5743–5745. doi: 10.1016/j.bmcl.2004.09.059. [DOI] [PubMed] [Google Scholar]
- 9.George N., Pick H., Vogel H., Johnsson N., Johnsson K. Specific labeling of cell surface proteins with chemically diverse compounds. J. Am. Chem. Soc. 2004;126:8896–8897. doi: 10.1021/ja048396s. [DOI] [PubMed] [Google Scholar]
- 10.Chen I., Howarth M., Lin W., Ting A.Y. Site-specific labeling of cell surface proteins with biophysical probes using biotin ligase. Nat. Methods. 2005;2:99–104. doi: 10.1038/nmeth735. [DOI] [PubMed] [Google Scholar]
- 11.Franz K.J., Nitz M., Imperiali B. Lanthanide-binding tags as versatile protein coexpression probes. ChemBioChem. 2003;4:265–271. doi: 10.1002/cbic.200390046. [DOI] [PubMed] [Google Scholar]
- 12.Vazquez-Ibar J.L., Weinglass A.B., Kaback H.R. Engineering a terbium-binding site into an integral membrane protein for luminescence energy transfer. Proc. Natl. Acad. Sci. USA. 2002;99:3487–3492. doi: 10.1073/pnas.052703599. [DOI] [PMC free article] [PubMed] [Google Scholar]
- 13.Griffin B.A., Adams S.R., Tsien R.Y. Specific covalent labeling of recombinant protein molecules inside live cells. Science. 1998;281:269–272. doi: 10.1126/science.281.5374.269. [DOI] [PubMed] [Google Scholar]
- 14.Turcatti G., Nemeth K., Edgerton M.D., Meseth U., Talabot F. Probing the structure and function of the tachykinin neurokinin-2 receptor through biosynthetic incorporation of fluorescent amino acids at specific sites. J. Biol. Chem. 1996;271:19991–19998. doi: 10.1074/jbc.271.33.19991. [DOI] [PubMed] [Google Scholar]
- 15.Kajihara D., Abe R., Iijima I., Komiyama C., Sisido M. FRET analysis of protein conformational change through position-specific incorporation of fluorescent amino acids. Nat. Methods. 2006;3:923–929. doi: 10.1038/nmeth945. [DOI] [PubMed] [Google Scholar]
- 16.Anderson R.D., Zhou J., Hecht S.M. Fluorescence resonance energy transfer between unnatural amino acids in a structurally modified dihydrofolate reductase. J. Am. Chem. Soc. 2002;124:9674–9675. doi: 10.1021/ja0205939. [DOI] [PubMed] [Google Scholar]
- 17.Cornish V.W., Benson D.R., Altenbach C.A., Hideg K., Hubbell W.L. Site-specific incorporation of biophysical probes into proteins. Proc. Natl. Acad. Sci. USA. 1994;91:2910–2914. doi: 10.1073/pnas.91.8.2910. [DOI] [PMC free article] [PubMed] [Google Scholar]
- 18.Hohsaka T., Abe R., Shiraga K., Sisido M. Incorporation of fluorescently labeled nonnatural amino acids into proteins in an E. coli in vitro translation system. Nucleic Acids Res. 2003;1(Suppl 3):271–272. doi: 10.1093/nass/3.1.271. [DOI] [PubMed] [Google Scholar]
- 19.Cohen B.E., McAnaney T.B., Park E.S., Jan Y.N., Boxer S.G. Probing protein electrostatics with a synthetic fluorescent amino acid. Science. 2002;296:1700–1703. doi: 10.1126/science.1069346. [DOI] [PubMed] [Google Scholar]
- 20.Summerer D., Chen S., Wu N., Deiters A., Chin J.W. A genetically encoded fluorescent amino acid. Proc. Natl. Acad. Sci. USA. 2006;103:9785–9789. doi: 10.1073/pnas.0603965103. [DOI] [PMC free article] [PubMed] [Google Scholar]
- 21.Zhang Z., Alfonta L., Tian F., Bursulaya B., Uryu S. Selective incorporation of 5-hydroxy tryptophan into proteins in mammalian cells. Proc. Natl. Acad. Sci. USA. 2004;101:8882–8887. doi: 10.1073/pnas.0307029101. [DOI] [PMC free article] [PubMed] [Google Scholar]
- 22.Wang W., Takimoto J.K., Louie G.V., Baiga T.J., Noel J.P. Genetically encoding unnatural amino acids for cellular and neuronal studies. Nat. Neurosci. 2007;10:1063–1072. doi: 10.1038/nn1932. [DOI] [PMC free article] [PubMed] [Google Scholar]
- 23.Wang J., Xie J., Schultz P.G. A genetically encoded fluorescent amino acid. J. Am. Chem. Soc. 2006;128:8738–8739. doi: 10.1021/ja062666k. [DOI] [PubMed] [Google Scholar]
- 24.Chen X., Johnston D. Constitutively active G-protein-gated inwardly rectifying K+ channels in dendrites of hippocampal CA1 pyramidal neurons. J. Neurosci. 2005;25:3787–3792. doi: 10.1523/JNEUROSCI.5312-04.2005. [DOI] [PMC free article] [PubMed] [Google Scholar]
- 25.Nashmi R., Xiao C., Deshpande P., McKinney S., Grady S.R. Chronic nicotine cell specifically upregulates functional α 4∗ nicotinic receptors: basis for both tolerance in midbrain and enhanced long-term potentiation in perforant path. J. Neurosci. 2007;27:8202–8218. doi: 10.1523/JNEUROSCI.2199-07.2007. [DOI] [PMC free article] [PubMed] [Google Scholar]
- 26.Miyazawa A., Fujiyoshi Y., Unwin N. Structure and gating mechanism of the acetylcholine receptor pore. Nature. 2003;423:949–955. doi: 10.1038/nature01748. [DOI] [PubMed] [Google Scholar]
- 27.Unwin N. Refined structure of the nicotinic acetylcholine receptor at 4Å resolution. J. Mol. Biol. 2005;346:967–989. doi: 10.1016/j.jmb.2004.12.031. [DOI] [PubMed] [Google Scholar]
- 28.Paas Y., Gibor G., Grailhe R., Savatier-Duclert N., Dufresne V. Pore conformations and gating mechanism of a Cys-loop receptor. Proc. Natl. Acad. Sci. USA. 2005;102:15877–15882. doi: 10.1073/pnas.0507599102. [DOI] [PMC free article] [PubMed] [Google Scholar]
- 29.Miller C. Genetic manipulation of ion channels: a new approach to structure and mechanism. Neuron. 1989;2:1195–1205. doi: 10.1016/0896-6273(89)90304-8. [DOI] [PubMed] [Google Scholar]
- 30.Dahan D.S., Dibas M.I., Petersson E.J., Auyeung V.C., Chanda B. A fluorophore attached to nicotinic acetylcholine receptor β M2 detects productive binding of agonist to the α delta site. Proc. Natl. Acad. Sci. USA. 2004;101:10195–10200. doi: 10.1073/pnas.0301885101. [DOI] [PMC free article] [PubMed] [Google Scholar]
- 31.Lummis S.C., Beene D.L., Lee L.W., Lester H.A., Broadhurst R.W. Cis-trans isomerization at a proline opens the pore of a neurotransmitter-gated ion channel. Nature. 2005;438:248–252. doi: 10.1038/nature04130. [DOI] [PubMed] [Google Scholar]
- 32.Mitra A., Cymes G.D., Auerbach A. Dynamics of the acetylcholine receptor pore at the gating transition state. Proc. Natl. Acad. Sci. USA. 2005;102:15069–15074. doi: 10.1073/pnas.0505090102. [DOI] [PMC free article] [PubMed] [Google Scholar]
- 33.Wilson G., Karlin A. Acetylcholine receptor channel structure in the resting, open, and desensitized states probed with the substituted-cysteine-accessibility method. Proc. Natl. Acad. Sci. USA. 2001;98:1241–1248. doi: 10.1073/pnas.031567798. [DOI] [PMC free article] [PubMed] [Google Scholar]
- 34.Reference deleted in proof.
- 35.Gallivan J.P., Lester H.A., Dougherty D.A. Site-specific incorporation of biotinylated amino acids to identify surface-exposed residues in integral membrane proteins. Chem. Biol. 1997;4:739–749. doi: 10.1016/s1074-5521(97)90312-4. [DOI] [PubMed] [Google Scholar]
- 36.Haugland R.P. The handbook. In: Spence M.T.Z., editor. A Guide to Fluorescent Probes and Labeling Technologies. Invitrogen Corp.; Carlsbad, CA: 2005. pp. 46–56. [Google Scholar]
- 37.Rodriguez E.A., Lester H.A., Dougherty D.A. In vivo incorporation of multiple unnatural amino acids through nonsense and frameshift suppression. Proc. Natl. Acad. Sci. USA. 2006;103:8650–8655. doi: 10.1073/pnas.0510817103. [DOI] [PMC free article] [PubMed] [Google Scholar]
- 38.Noren C.J., Anthony-Cahill S.J., Griffith M.C., Schultz P.G. A general-method for site-specific incorporation of unnatural amino-acids into proteins. Science. 1989;244:182–188. doi: 10.1126/science.2649980. [DOI] [PubMed] [Google Scholar]
- 39.Nowak M.W., Gallivan J.P., Silverman S.K., Labarca C.G., Dougherty D.A. In vivo incorporation of unnatural amino acids into ion channels in a Xenopus oocyte expression system. Methods Enzymol. 1998;293:504–529. doi: 10.1016/s0076-6879(98)93031-2. [DOI] [PubMed] [Google Scholar]
- 40.Nowak M.W., Kearney P.C., Sampson J.R., Saks M.E., Labarca C.G. Nicotinic receptor binding site probed with unnatural amino acid incorporation in intact cells. Science. 1995;268:439–442. doi: 10.1126/science.7716551. [DOI] [PubMed] [Google Scholar]
- 41.Gensler S., Sander A., Korngreen A., Traina G., Giese G. Assembly and clustering of acetylcholine receptors containing GFP-tagged ɛ or γ subunits: selective targeting to the neuromuscular junction in vivo. Eur. J. Biochem. 2001;268:2209–2217. doi: 10.1046/j.1432-1327.2001.02093.x. [DOI] [PubMed] [Google Scholar]
- 42.Rasband, W. S. 2008. ImageJ, National Institutes of Health. http://rsb.info.nih.gov/ij/.
- 43.Hess S.T., Girirajan T.P., Mason M.D. Ultra-high resolution imaging by fluorescence photoactivation localization microscopy. Biophys. J. 2006;91:4258–4272. doi: 10.1529/biophysj.106.091116. [DOI] [PMC free article] [PubMed] [Google Scholar]
- 44.Pawley J.B. Plenum Press; New York: 2006. Handbook of Biological Confocal Microscopy. [Google Scholar]
- 45.Betzig E., Patterson G.H., Sougrat R., Lindwasser O.W., Olenych S. Imaging intracellular fluorescent proteins at nanometer resolution. Science. 2006;313:1642–1645. doi: 10.1126/science.1127344. [DOI] [PubMed] [Google Scholar]
- 46.Michalet X., Lacoste T.D., Weiss S. Ultrahigh-resolution colocalization of spectrally separable point-like fluorescent probes. Methods. 2001;25:87–102. doi: 10.1006/meth.2001.1218. [DOI] [PubMed] [Google Scholar]
- 47.Demuro A., Parker I. Optical patch-clamping: single-channel recording by imaging Ca2+ flux through individual muscle acetylcholine receptor channels. J. Gen. Physiol. 2005;126:179–192. doi: 10.1085/jgp.200509331. [DOI] [PMC free article] [PubMed] [Google Scholar]
- 48.Dougherty D.A. Unnatural amino acids as probes of protein structure and function. Curr. Opin. Chem. Biol. 2000;4:645–652. doi: 10.1016/s1367-5931(00)00148-4. [DOI] [PubMed] [Google Scholar]
- 49.Mamaev S., Olejnik J., Olejnik E.K., Rothschild K.J. Cell-free N-terminal protein labeling using initiator suppressor tRNA. Anal. Biochem. 2004;326:25–32. doi: 10.1016/j.ab.2003.11.002. [DOI] [PubMed] [Google Scholar]
- 50.Woolhead C.A., McCormick P.J., Johnson A.E. Nascent membrane and secretory proteins differ in FRET-detected folding far inside the ribosome and in their exposure to ribosomal proteins. Cell. 2004;116:725–736. doi: 10.1016/s0092-8674(04)00169-2. [DOI] [PubMed] [Google Scholar]
- 51.Rodriguez E.A., Lester H.A., Dougherty D.A. Improved amber and opal suppressor tRNAs for incorporation of unnatural amino acids in vivo. Part 1: minimizing misacylation. RNA. 2007;13:1703–1714. doi: 10.1261/rna.666807. [DOI] [PMC free article] [PubMed] [Google Scholar]
- 52.Rodriguez E.A., Lester H.A., Dougherty D.A. Improved amber and opal suppressor tRNAs for incorporation of unnatural amino acids in vivo. Part 2: evaluating suppression efficiency. RNA. 2007;13:1715–1722. doi: 10.1261/rna.667607. [DOI] [PMC free article] [PubMed] [Google Scholar]
- 53.Yildiz A., Forkey J.N., McKinney S.A., Ha T., Goldman Y.E. Myosin V walks hand-over-hand: single fluorophore imaging with 1.5-nm localization. Science. 2003;300:2061–2065. doi: 10.1126/science.1084398. [DOI] [PubMed] [Google Scholar]
- 54.Zhang H., Karlin A. Contribution of the beta subunit M2 segment to the ion-conducting pathway of the acetylcholine receptor. Biochemistry. 1998;37:7952–7964. doi: 10.1021/bi980143m. [DOI] [PubMed] [Google Scholar]
- 55.Ulbrich M.H., Isacoff E.Y. Subunit counting in membrane-bound proteins. Nat. Methods. 2007;4:319–321. doi: 10.1038/NMETH1024. [DOI] [PMC free article] [PubMed] [Google Scholar]
- 56.Slimko E.M., Lester H.A. Codon optimization of Caenorhabditis elegans GluCl ion channel genes for mammalian cells dramatically improves expression levels. J. Neurosci. Methods. 2003;124:75–81. doi: 10.1016/s0165-0270(02)00362-x. [DOI] [PubMed] [Google Scholar]
- 57.Nashmi R., Dickinson M.E., McKinney S., Jareb M., Labarca C. Assembly of α4β2 nicotinic acetylcholine receptors assessed with functional fluorescently labeled subunits: effects of localization, trafficking, and nicotine-induced upregulation in clonal mammalian cells and in cultured midbrain neurons. J. Neurosci. 2003;23:11554–11567. doi: 10.1523/JNEUROSCI.23-37-11554.2003. [DOI] [PMC free article] [PubMed] [Google Scholar]
- 58.Carobbi, C. F. M., M. Cati, and L. M. Millanta. 2003. Using the log-normal distribution in the statistical treatment of experimental data affected by large dispersion. In Electromagnetic Compatibility, 2003 IEEE International Symposium on. vol. 812. 812–816.
- 59.Changeux J.P., Edelstein S.J. Odile Jacob; New York: 2005. Nicotinic Acetylcholine Receptors: From Molecular Biology to Cognition. [Google Scholar]
- 60.Tong Y., Brandt G.S., Li M., Shapovalov G., Slimko E. Tyrosine decaging leads to substantial membrane trafficking during modulation of an inward rectifier potassium channel. J. Gen. Physiol. 2001;117:103–118. doi: 10.1085/jgp.117.2.103. [DOI] [PMC free article] [PubMed] [Google Scholar]
- 61.Krafte D.S., Lester H.A. Expression of functional sodium channels in stage II–III Xenopus oocytes. J. Neurosci. Methods. 1989;26:211–215. doi: 10.1016/0165-0270(89)90118-0. [DOI] [PubMed] [Google Scholar]
- 62.Hille B. Sinauer; Sunderland, MA: 2001. Ionic Channels of Excitable Membranes. [Google Scholar]
- 63.Sonnleitner A., Mannuzzu L.M., Terakawa S., Isacoff E.Y. Structural rearrangements in single ion channels detected optically in living cells. Proc. Natl. Acad. Sci. USA. 2002;99:12759–12764. doi: 10.1073/pnas.192261499. [DOI] [PMC free article] [PubMed] [Google Scholar]
- 64.Charnet P., Labarca C., Leonard R.J., Vogelaar N.J., Czyzyk L. An open-channel blocker interacts with adjacent turns of α-helices in the nicotinic acetylcholine receptor. Neuron. 1990;2:87–95. doi: 10.1016/0896-6273(90)90445-l. [DOI] [PubMed] [Google Scholar]
- 65.Baird G.S., Zacharias D.A., Tsien R.Y. Biochemistry, mutagenesis, and oligomerization of DsRed, a red fluorescent protein from coral. Proc. Natl. Acad. Sci. USA. 2000;97:11984–11989. doi: 10.1073/pnas.97.22.11984. [DOI] [PMC free article] [PubMed] [Google Scholar]
- 66.Haupts U., Maiti S., Schwille P., Webb W.W. Dynamics of fluorescence fluctuations in green fluorescent protein observed by fluorescence correlation spectroscopy. Proc. Natl. Acad. Sci. USA. 1998;95:13573–13578. doi: 10.1073/pnas.95.23.13573. [DOI] [PMC free article] [PubMed] [Google Scholar]
- 67.Yao J., Larson D.R., Vishwasrao H.D., Zipfel W.R., Webb W.W. Blinking and nonradiant dark fraction of water-soluble quantum dots in aqueous solution. Proc. Natl. Acad. Sci. USA. 2005;102:14284–14289. doi: 10.1073/pnas.0506523102. [DOI] [PMC free article] [PubMed] [Google Scholar]
- 68.Huang B., Wang W., Bates M., Zhuang X. Three-dimensional super-resolution imaging by stochastic optical reconstruction microscopy. Science. 2008;319:810–813. doi: 10.1126/science.1153529. [DOI] [PMC free article] [PubMed] [Google Scholar]
- 69.Thompson R.E., Larson D.R., Webb W.W. Precise nanometer localization analysis for individual fluorescent probes. Biophys. J. 2002;82:2775–2783. doi: 10.1016/S0006-3495(02)75618-X. [DOI] [PMC free article] [PubMed] [Google Scholar]
- 70.Moerner W.E. Single-molecule mountains yield nanoscale cell images. Nat. Methods. 2006;3:781–782. doi: 10.1038/nmeth1006-781. [DOI] [PMC free article] [PubMed] [Google Scholar]
Associated Data
This section collects any data citations, data availability statements, or supplementary materials included in this article.