

Abstract
Isothermal titration calorimetry was used to monitor the energetic landscape of a catalytic RNA, specifically that of the hepatitis delta virus ribozyme. Using mutants that isolated various tertiary interactions, the thermodynamic parameters of several ribozyme-substrate intermediates were determined. The results shed light on the impact of several tertiary interactions on the global structure of the ribozyme. In addition, the data indicate that the formation of the P1.1 pseudoknot is the limiting step of the molecular mechanism. Last, as illustrated here, isothermal titration calorimetry appears to be a method of choice for the elucidation of an RNA's folding pathway.
Introduction
An RNA molecule possesses a hierarchical structure in which the primary sequence determines the secondary structure, which, in turn, determines the tertiary folding in a process that only minimally alters the secondary structure but is essential in the formation of an active three-dimensional structure. Several approaches permit the identification of the tertiary interactions within an RNA molecule (1); however, their contribution, in terms of energy, to the global structure remains unknown. Isothermal titration calorimetry (ITC) is a powerful technique for studying the thermodynamics of bimolecular interactions (2). When substances bind, heat is either generated or absorbed. Measurement of this heat leads to a complete inventory of the energetic parameters of the molecular interaction in a single experiment (i.e., ΔH, ΔS, and ΔG). ITC offers the advantage of being a true “in-solution” method because there is no chemical tagging or immobilization of binding components. It is widely used in the field of protein science, but its application in RNA science remains in its infancy (3): to date only simple RNA duplexes and helical junction formation have been studied using this technique (4–7). In the work presented here, ITC was extensively applied to the analysis of the tertiary interactions taking place within the catalytic center of an RNA enzyme.
Both the genomic and antigenomic hepatitis delta virus (HDV) RNA strands include a self-cleaving RNA motif that generates 2′-3′-cyclic phosphate and 5′-hydroxyl termini (see Shih and Been (8) and Bergeron et al. (9). According to the pseudoknot model secondary structure, which is well supported by experimental data, the self-cleaving RNA strands are composed of one stem (the P1 stem), one pseudoknot (the P2 stem), two stem-loops (P3-L3 and P4-L4), and three single-stranded junctions (J1/2, J1/4, and J4/2; see Fig. 1). Both the J1/4 junction and the L3 loop are single-stranded in the initial stages of folding but are subsequently involved in the formation of a pseudoknot that consists of two Watson-Crick basepairs involving pairing between the cytosines located in positions 24 and 25 and the guanosines located in positions 40 and 41 (10). The P2 and P4 stems are located on each side of the catalytic center and only play a structural role (8,9). The catalytic center is formed by the P1 stem, the P1.1 pseudoknot, P3-L3 stem loop, and the J4/2 junction that includes the catalytic cytosine (i.e., C-76). Both x-ray diffraction and nuclear magnetic resonance experiments have provided high-resolution information on the tertiary structure of the HDV catalytic RNA (11–13). Briefly, the catalytic core is formed by two coaxial helices resulting from the stacking of the P1/P1.1/P4 stems and of the P2/P3 stems (Fig. 1 A). Several other biochemical approaches, including chemically synthesized ribozymes (Rzs) and substrates with site-specific functional modifications, cross-linking experiments and fluorescence spectroscopy, to name only a few examples, have been used to identify the important chemical groups within the catalytic center as well as to reveal the interactions that are taking place during folding (14–19).
Figure 1.
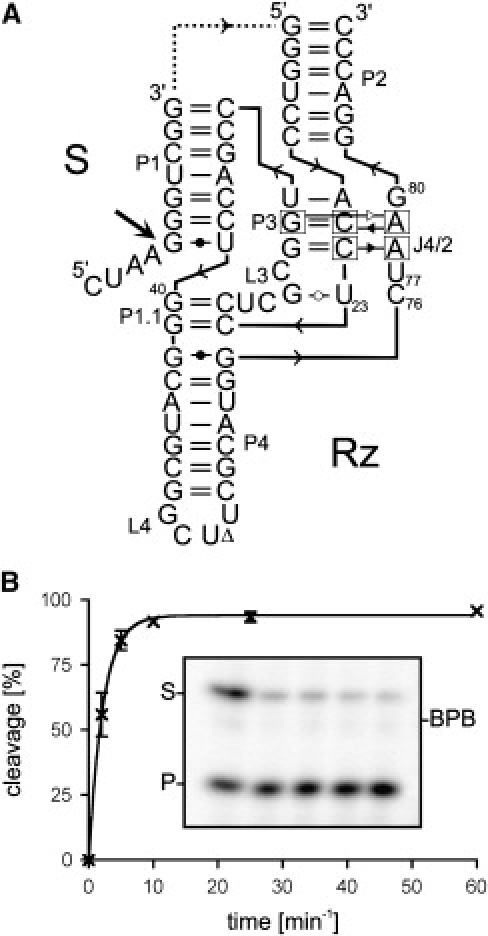
Structure and cleavage activity of the HDV Rz. (A) Secondary structure and nucleotide sequence of the HDV Rz derived from the antigenomic hepatitis delta virus genome. The dotted line corresponds to the J1/2 junction that has been removed in the trans-acting Rz. The numbering system is that of Shih and Been (8), and the representation of the structure is in accordance with Lescoute and Westhof (30). The arrow indicates the cleavage site. (B) Fraction of substrate cleaved as a function of the reaction time. The inset shows an autoradiogram of a denaturing polyacrylamide gel of the cleavage reaction. The position of the bromophenol blue dye (BPB), the substrate (S), and the product (P) are indicated. From left to right, the aliquots were removed after 2, 5, 10, 25, and 60 min.
The self-cleaving sequence has been divided into two molecules, one of which is a ribozyme (HDV Rz) that possesses the catalytic properties required to successively cleave several molecules of substrate (S) (see Fig. 1). In most cases, this was achieved by removing the J1/2 junction, although other versions of the Rz have also been reported. The use of the trans-acting version has facilitated the study of the molecular mechanism of the HDV Rz, as well as permitted the elucidation of its complex kinetic pathway. Briefly, the Rz binds its substrate through the formation of the P1 stem, producing a Rz-substrate complex (RzS). This step is magnesium independent, and requires at the very least the presence of monovalent ions (20). Next, upon the addition of magnesium ions, several structural transitions occur that have been shown to be essential for the formation of an active RzS ternary complex (21; see also Results and Discussion section). Finally, once the C-76 is positioned near the scissile phosphate, an acid-base catalysis takes place (22).
Importantly, the network of interactions that evolve along the folding pathway of the HDV Rz provides a highly ordered catalytic center, as is revealed by the crystal structure (11,12). This conclusion receives physical support from several unusual properties of the self-cleaving RNA motifs (23). For example, it is extremely stable, possessing an optimal reaction temperature of ∼65°C, and retains activity at temperatures as high as 80°C and in buffers containing 5 M urea. Unlike the hammerhead Rz, the HDV Rz does not appear able to easily access alternative folding pathways. Most likely this is because of the comparatively limited flexibility of the HDV Rz's tightly packed tertiary structure. Clearly, this makes HDV Rz an ideal candidate with which to investigate the potential of ITC to document the folding pathway of an RNA molecule.
Materials and Methods
Rz and substrate synthesis
The Rzs were synthesized by in vitro transcription. Briefly, the trans-acting Rzs' DNA templates were prepared by PCR using Pwo DNA polymerase (Roche Diagnostics, Basel, Switzerland), an oligonucleotide that included the T7 RNA promoter followed by the full-length sequence of the desired Rz and an oligonucleotide complementary to the T7 RNA promoter. In vitro transcription reactions were carried out at 37°C for 2 h in a final volume of 100 μL containing 200 pmol of DNA template, 15 units of RNA Guard (Amersham Biosciences, Piscataway, NJ), 80 mM HEPES-KOH (pH 7.5), 24 mM MgCl2, 2 mM spermidine, 40 mM DTT, 5 mM of each NTP, 0.01 units of yeast pyrophosphatase (Roche Diagnostics), and 10 μg of purified T7 RNA polymerase. The transcripts were then DNase treated, ethanol precipitated, ethanol washed, dissolved in water, and purified on denaturing 8% polyacrylamide gels (19:1 ratio of acrylamide to bisacrylamide) using 50 mM Tris-borate (pH 7.5), 8 M urea, and 1 mM EDTA solution as running buffer, and formamide dye (95% formamide, 10 mM EDTA, 0.025% bromophenol blue and 0.025% xylene cyanol) as loading buffer. The reaction products were visualized by UV shadowing, and the bands corresponding to the correct sizes were excised. The transcripts were eluted from the gel slices, the RNA ethanol precipitated, and the quantity of nucleic acid determined by spectroscopy at 260 nm. Substrate and the SdC4 analog were purchased from Integrated DNA Technologies (San Diego, CA) and were purified by PAGE as described above.
RNA radioactive labeling
Purified substrates were dephosphorylated using 5 units of Antartic phosphatase as described by the manufacturer (New England BioLabs, Ipswitch, MA). The dephosphorylated RNA (5 pmol) was 5′-end-labeled by incubation with 5 units of T4 polynucleotide kinase (Amersham Biosciences) in a final volume of 10 μL containing 1.6 pmol [γ-32P]-ATP (6000 Ci/mmol, Amersham Biosciences), 50 mM Tris-HCl (pH 7.5), 10 mM MgCl2, 50 mM KCl at 37°C for 2 h. The reactions were stopped by adding formamide dye, and the RNA was purified by denaturing PAGE electrophoresis. The bands of the correct sizes containing the 5′-end-labeled RNAs were excised, and the RNA was recovered as described above.
Cleavage assays
Cleavage reactions were carried out in 20-μL reaction mixtures containing 50 mM Tris-HCl (pH 7.5) and 10 mM MgCl2 at 37°C under single-turnover conditions ([Rz]>>[S]). Before the reaction, trace amounts of 5′-end-labeled substrates (<1 nM) and nonradioactive Rzs (100 nM) were mixed together, heated at 80°C for 1 min, snap-cooled on ice for 2 min, and then incubated at 37°C for 5 min (except in the case of the temperature-dependence experiment). The cleavage reactions were initiated by the addition of MgCl2. Aliquots (2 μL) were removed at various times up to 1 h and were quenched by the addition of 10 μL of formamide dye buffer. The mixtures were fractionated on denaturing 20% PAGE gels and exposed to PhosphorImager screens (Molecular Dynamics, Sunnyvale, CA). The extent of cleavage was determined from measurements of the radioactivity present both in the substrate and in the 5′-product bands at each time point using the ImageQuant software. The fractions of cleaved substrate were determined, and the rate of cleavage (kobs) obtained by fitting the data to the equation At = A0(1 − e−kt), where At is the percentage of cleavage at time t, A0 is the maximum percentage cleavage (endpoint), and k is the rate constant (kobs). Each rate constant was calculated from at least two independent measurements. Kinetics assays were performed using various Rz concentrations (5 nM to 400 nM). The values of kobs obtained were plotted as a function of the Rz concentration to determine the other kinetic constants (k2 and KM′).
Under multiple-turnover conditions, the Rz (50 nM) was incubated in the presence of various concentrations of substrate (50 nM to 5 μM). The values of kobs obtained were plotted as a function of the substrate concentration.
Isothermal titration calorimetry
All ITC experiments were performed at 25°C (except in the case of the temperature-dependence experiment) with a reference power of 15 μcal s−1 (the VP-ITC from MicroCal can measure energies ranging from 0 to 35 μcal s−1). Both the lyophilized substrate and the Rz were dissolved in buffer containing 50 mM Tris-HCl (pH 7.5) and 10 mM MgCl2. Before the titration, the RNA samples were degassed for 10 min at 20°C. Exact RNA concentrations were verified using spectrophotometer readings at 260 nm on extra RNA solution that remained after both syringe and experimental cell filling. Substrates at a concentration of 50 μM were used to titrate mutant Rzs at a concentration of 5 μM. The c values, which are the ratios of the concentrations of the reactants in the sample cell to the dissociation constants, were between 0.5 and 500 for each experiment (representing the range in which useful data can be obtained (24,25)). Before the initiation of an experiment, a short heat pulse was applied for internal calibration of the apparatus. An initial delay of 60 s was used before the first injection, and then 29 injections of 10 μL each at an injection rate of 0.5 μL s−1 (290 μL total injection volume), with the individual injections spaced 240 s apart, were performed, and the spectra were recorded.
Data from each experiment were analyzed using the single set of identical sites model from Origin ITC software (MicroCal Software, Northampton, MA). The point corresponding to the first injection was not considered because of the mechanical backlash in the screw that drives the syringe plunger, which alters the volume of the injection. After correction of the raw data for the dilution factor caused by each injection, the integration of the resulting data provided the heat ΔQ(i) that had to be added or removed to restore the thermal equilibrium between the experimental and reference cells after each injection of substrate. The binding affinity KA (1/mol), the stoichiometry (n), the enthalpy ΔH (cal/mol), and the entropy ΔS (cal/mol·K) were calculated using the equation:
where q is the heat released, v is the known volume of the reaction, KA is the association constant, and Li is the ligand concentration at the ith injection (2). Relative Gibbs free energy (ΔG) was derived using the relation
All experiments were performed at least twice, and average values are reported with errors. To compare changes in the substrate binding to the different mutated Rzs, the differences in free energy values (ΔΔG) were calculated. Finally, the determination of the heat capacity (ΔCp) experiment was performed using the Rz-A78U/A79U mutant and experimental temperatures ranging between 20°C and 35°C.
Results and Discussion
HDV Rz folds into a tight structure that limits alternative folding pathways (23). This fact was nicely illustrated by preliminary experiments that showed that a version of the trans-acting HDV Rz exhibited efficient cleavage of a small substrate under single-turnover conditions ([Rz] >> [S]; Fig. 1). Trace amounts of 32P-5′-end-labeled substrate (<1 nM) were incubated in the presence of an excess of Rz (100 nM), and the cleavage was monitored at 25°C. The 95% cleavage level was reached after <10 min of reaction time, and the maximum cleavage level reached up to 97–98%. Identification of such an HDV Rz, specifically one that showed almost complete cleavage, was a prerequisite to be able to subsequently perform ITC experiments.
To further characterize this new version of the HDV Rz, kinetic analyses were performed using 5 to 400 nM of Rz, and the pseudo-first-order constants were determined at 25°C. Catalytic constant (k2) and apparent Michaelis-Menten (KM′) values of 0.63 ± 0.03 min−1 and 18.7 ± 2.2 nM, respectively, were calculated. Kinetic analyses were also performed under multiple-turnover conditions ([S]>>[Rz]), conditions more relevant to those of the ITC experiments. In this case, the Rz (50 nM) was incubated in the presence of various concentrations of a mixture of 32P-end-labeled radioactive and nonradioactive substrates (50 nM to 5 μM). This led to the determination of a catalytic constant (kcat) of 0.79 ± 0.06 min−1 and a KM′ of 163 ± 35 nM at 25°C. The catalytic constants k2 and kcat in both conditions were almost identical, although the KM′ under single-turnover conditions was 10-fold less than that observed under multiple-turnover conditions (i.e., 18.7 nM compared to 163 nM, respectively). Similar catalytic constants and different binding constants have been previously reported for another version of HDV Rz at both 37°C and 56°C (26). Under single-turnover conditions the KM′, which is the concentration of Rz at half-maximum rate, represents the apparent dissociation constant of the RzS∗ complex (transition complex) (26). Conversely, under multiple-turnover conditions, the apparent KM is a measure of the Rz bound in any form to the substrate (RzS, RzS′, etc.). The difference in KM′ between the two conditions suggests that the RzS complex is undergoing a slow internal conformational rearrangement that yields an RzS′ complex. Finally, the similarities of the catalytic constant obtained are an indication that the rate-limiting step was the same regardless of the conditions.
ITC monitoring of the Rz-substrate complex formation
Analyses were performed by incubating the Rz in the ITC experimental cell and then injecting the substrate (S) every 4 min for period of 2 h (see Materials and Methods section). Both samples were in the same reaction buffer containing 50 mM Tris-HCl (pH 7.5) and 10 mM MgCl2, thereby avoiding any mismatch buffer effect. Several other buffers were tested, and similar results were obtained under the conditions used in this study. The heat energy changes accompanying both the RzS complex formation and the induced RNA-folding processes were detected for each peak as the power (dq/dt, μcal·s−1) required to maintain a zero temperature difference between the experimental and reference cells (24,25). The heat energy change is dependent on the values of the association constant (KA) for the RzS complex, the enthalpy (ΔH), the entropy (ΔS) and the stoichiometry of the reaction (n). These parameters can be determined by fitting the titration results to predetermined binding models and then evaluating the relative Gibbs free energy (ΔG) (25).
Initially, we focused on the formation of the RzS complex, that is, the formation of the P1 stem, to simplify the situation. Fig. 2 illustrates a typical example of ITC analysis using the mutant Rz-U23A, which prevents P1 stem docking, thereby isolating the formation of the P1 stem (Fig. 2 A). Panel B of Fig. 2 shows the raw ITC data for the sequential injection of substrate into Rz-U23A Rzs at 25°C, and the inset illustrates the integration of each injection as a function of the molar ratio of substrate. From these data, the stoichiometry (n) was calculated to be 0.89 ± 0.04, suggesting that, although the folding process is interrupted at the first step, almost all of the Rz molecules still bound a substrate molecule. In other words, a single molecule of substrate bound to one molecule of Rz. The KA for this RzS complex was determined to be 1.04 ± 0.05 × 10⁷ M−1 (see Table 1). The inverse constant (1/KA or KD), 9.6 × 10⁻⁸ M (i.e., 96 nM), is in the same range as the KM determined under multiple-turnover conditions. However, it is important to note that the significances of the binding constants are not identical. The KM′ includes all of the steps involved along the folding pathway, although the most important, in terms of energy, is the formation of the 7-bp P1 stem.
Figure 2.
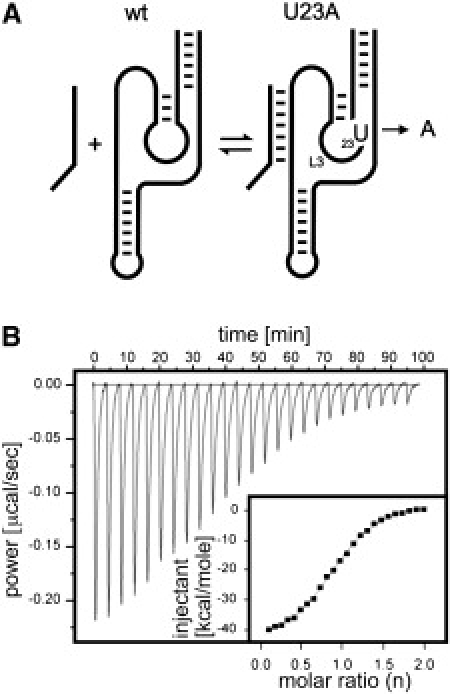
ITC monitoring of the RzS binding step. (A) Schematic representation of the secondary structure of the Rz-U23A mutant. (B) Raw data for the sequential injections of substrate into Rz-U23A Rz at 25°C. The inset shows the integration of each injection as a function of the molar ratio of substrate.
Table 1.
Thermodynamic data for the mutated Rzs
| Mutant | n | KA (M−1) | ΔH (kcal/mol) | TΔS (kcal/mol) | ΔG (kcal/mol) |
|---|---|---|---|---|---|
| Rz-U23A | 0.89 ± 0.04 | 1.04 ± 0.05 × 10⁷ | −60.1 ± 0.9 | −50.4 ± 0.9 | −9.7 ± 0.1 |
| Rz-G40A/G41A | 0.93 ± 0.02 | 1.18 ± 0.08 × 10⁷ | −54.3 ± 0.6 | −44.6 ± 0.5 | −9.7 ± 0.1 |
| Rz-A78U/A79U | 0.91 ± 0.03 | 3.14 ± 0.35 × 10⁶ | −50.9 ± 0.2 | −42.0 ± 0.2 | −8.9 ± 0.2 |
| Rz-ΔU77 | 0.88 ± 0.05 | 3.91 ± 0.29 × 10⁶ | −69.7 ± 2.4 | −60.7 ± 2.2 | −9.0 ± 0.1 |
| Rz-C76A | 1.04 ± 0.05 | 2.53 ± 0.05 × 10⁷ | −40.7 ± 0.6 | −30.4 ± 0.6 | −10.3 ± 0.1 |
For this mutant, ΔH and TΔS values of −60.1 ± 0.9 kcal/mol and −50.4 ± 0.9 kcal/mol, respectively, were determined (Table 1). This corresponds to a calculated Gibbs free energy value (ΔG) of −9.7 kcal/mol for the RzS complex including the Rz-U23A mutant. This is a relative value because the contribution of the Rz alone was subtracted. Therefore, the unbound Rz and substrate have an arbitrary ΔG value of 0 kcal/mol. To corroborate the results obtained with the Rz-U23A mutant, an experiment using the active Rz in the presence of NaCl (i.e., in the absence of any MgCl2), conditions that also stop the folding after the formation of the P1 stem, was shown to yield identical data (data not shown).
ITC experiments monitoring the formation of the tertiary interactions
The folding pathway of HDV Rz has been divided into discrete steps using mutants that halt the folding process in intermediate conformations (see below). These stalled intermediates provide a means with which to measure the thermodynamic contributions of specific tertiary interactions to the overall global folding, using ITC. Assuming that each intermediate RzS structure represents a sequential step along the folding pathway and that in solution it adopts a single, stable structure, then the thermodynamics of the process can be measured incrementally to determine precisely how each interaction contributes to the formation of the complete, folded Rz. Consequently, ITC monitoring was then performed with all of the available mutants.
After the formation of the P1 stem in the RzS complex (named RzS1 for convenience), there are four subsequent steps that have been identified along the folding pathway (for a review see Nehdi et al. (21)). Cross-linking experiments demonstrated that the substrate is docked within the catalytic center of the Rz (17). Specifically, it has been shown that UV irradiation of a substrate including a 4-thiouridine led to the isolation of a subsequent RzS complex (RzS2) possessing a novel covalent bond between the substrate U-4 and either C-22 or U-23 of the Rz. It is because of this that the Rz-U23A mutant permits the trapping of the RzS1 complex, isolating the formation of the P1 stem (Fig. 3 A). The docking of the P1 stem is followed by the formation of the P1.1 pseudoknot that involves two guanosines from the J1/2 junction and two cytosines from the L3 loop (10,11). This new conformational transition leads to the formation of the RzS3 complex. Mutating the two guanosines of the J1/2 junction to adenosines prevents the formation of the P1.1 pseudoknot and, consequently, isolates the RzS2 complex (Rz-G40A/G41A) (10,21). After the formation of the P1.1 pseudoknot, an A-minor motif forms between the adenosine residues of the J4/2 junction and residues from the P3 stem, yielding the RzS4 complex. More specifically, according to the crystal structure established using the genomic version of the HDV Rz (11), A-78 and A-79 of the J4/2 junction form a base-triplet interaction in the P3-P1 junction and are also involved in a two-tiered ribose-zipper interaction with C-21 and C-22. Mutating the two adenosines from the J4/2 junction to uridines traps the RzS3 complex that includes the P1.1 pseudoknot (Rz-A78U/A79U) (21). Subsequent to the formation of the RzS3 there is formation of the A-minor motif within the RzS4 (11,21). Deletion of U-77 led to the formation of an inactive Rz that isolated a RzS4 that included this motif (Rz-ΔU77) (21). Finally, there is the formation of a trefoil turn at position U-77 that positions the C-76 deeper inside the catalytic site (11). It has also been suggested that this step may be accompanied by basepair switching at the bottom of the P2 stem (also see below). The RzS5 complex that should include both conformation transitions can be isolated using a mutation of the catalytic cytosine that prevents the chemical step from occurring (Rz-C76A) (26).
Figure 3.
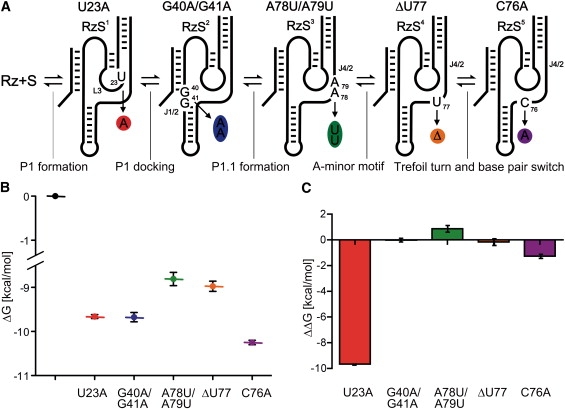
ITC analysis of the tertiary structure interactions involved in the folding pathway. (A) Schematic representation of the secondary structure of the various mutants. The mutations are circled using the same colors used to report the thermodynamic parameters. (B) Presentation of the ΔG values for each mutant taking into account its position along the folding pathway; consequently, it represents the evolution of ΔG in terms of the RzS complexes. (C) Representation of the ΔΔG values for each mutant.
ITC monitoring was performed with all of the mutants (i.e., RzS1 to RzS5), and the results are presented in Table 1. The average stoichiometry between the Rz and the S was found to be 0.93 ± 0.11, supporting the notion of structural homogeneity and the presence of a single binding site for the substrate regardless of the intermediate in question. The KA varied from 3.14 × 10⁶ M to 2.53 × 10⁷ M. This corresponds to KD values of 300 to 40 nM, respectively, near the KM value of 163 ± 35 nM determined for the Rz at 25°C. In general, repetition of these experiments led to values that varied by <10%. More importantly, for an experiment in which several mutants were synthesized at the same time, the small differences were always consistently observed. Analysis of both ΔH and TΔS clearly illustrates that the folding pathway of HDV Rz is enthalpy-driven (Table 1). Specifically, the enthalpy value determined for each RzS is always larger than the corresponding entropy value.
More interesting is the analysis of the ΔG values (Table 1). The ΔG values of the different complexes are in the same order as the intermediates along the folding pathway, thus essentially providing a representation equivalent to the progress of ΔG in time (Fig. 3 B). Alternatively, the ΔΔG (i.e., the difference between the ΔG value of a particular complex and that of the preceding one) were illustrated to isolate the contribution of a specific interaction in terms of free energy (Fig. 3 C). Together, these illustrations led to several observations. First, as expected, the formation of the P1 stem, a secondary structure motif, is clearly more energetically favored than is any tertiary interaction along the folding pathway. Second, the overall ΔG tends to a net stabilization of 10.3 kcal/mol, but the contribution that occurs after P1 stem formation is limited to only 0.5 kcal/mol, indicating that, after the formation of the P1 stem, the folding pathway is a succession of small rearrangements. For example, the docking of the P1 stem, which was isolated using the Rz-G40A/G41A mutant that prevents the formation of the P1.1 pseudoknot, gives a ΔG stabilization of only 0.08 kcal/mol (i.e., RzS2). Third, the formation of the two GC basepairs of the P1.1 pseudoknot, which traps the substrate inside of the catalytic center, appears to be a process that requires energy even though a new stem is formed (RzS3). In this case, the increase in order overcompensates for the exothermicity of the new interactions. However, all subsequent conformational transitions favor ΔG. Fourth, it is surprising that the Rz-C76A mutant produced a significant reduction in ΔG even though no interaction is known to occur inside the catalytic center. This important reduction was confirmed by the identical values obtained using the original Rz in the presence of an uncleavable substrate analog containing a deoxyribonucleotide located at the cleavage site (SdC4; data not shown). The last step includes both the basepair switch at the bottom of the P2 stem and the formation of the trefoil turn next to the catalytic cytosine. These two conformational transitions are probably accompanied by extrusion of both G-80 and U-77 outside the catalytic core (21). Most likely moving these two nucleotides out of the catalytic center reduces the tension within the structure, thereby lowering the ΔG of the system.
It should be noted that a possible explanation for the difference of the ΔG values might be if the ground states of the free mutant Rz (i.e., in absence of substrate) are not similar. To verify this hypothesis, ITC analyses were performed for each mutant Rz in the presence of both the substrate and 100 mM NaCl (no MgCl2), conditions that also stop the folding after the formation of the P1 stem as mentioned previously (data not shown). If the ground states of the mutants are different, we should observe differences between the ΔG values, whereas if this is not the case, the ΔG values should be virtually identical. Our experiments provided ΔG values that showed differences that vary by <1%. These small differences are within the error of the ΔG values. This indicates that the differences in ΔG values observed previously were not the result of different ground states for the various mutant Rzs. In any case, if differences in the ground state existed, they minimally alter the ΔG values.
Altogether, these results show that the binding of the substrate is affected by the tertiary interactions that take place within the Rz. Finally, the analysis of both the ΔG and ΔΔG values also revealed that the limiting step of the folding pathway is the formation of the P1.1 pseudoknot, which is the only endothermic step of the pathway (Fig. 3, B and C, RzS3 complex). This finding identifies the rate-limiting step that was previously suggested, but not confirmed, to be a conformational transition that takes place before the chemical step (11,18,20).
It should be noted that instead of using the ITC results, the ΔG values can be calculated from the equilibrium constants (KD) obtained from the binding shift assays using the substrate and the multiple mutated Rzs. This technique yielded values of KD that, on average, varied by ±20%. Clearly, these results have the potential of prompting false conclusions when they are used to determine the ΔG values (see Table S1 and Fig. S1 in the Supplementary Material). Thus, binding shift assays appear to be insufficiently precise to document a Rz's folding pathway.
Temperature dependence
To further characterize the limiting step, mainly the formation of the RzS3 complex, experiments were performed using the Rz-A78U/A79U mutant at various temperatures. These experiments also aimed to verify whether or not the enthalpy is temperature-dependent because the driving force could be different as a result of temperature changes. Initially, cleavage activity experiments were performed at different temperatures under single-turnover conditions (i.e., [Rz] = 100 nM and [S] < 1 nM). The values of the rate constants (kobs) were determined at several temperatures between 15°C and 50°C, and an Arrhenius plot was drawn (Fig. 4 A). The optimal temperature of the Rz was estimated to be 44°C, which is in good agreement with data reported for other versions of the HDV Rz (27). This optimal temperature is relatively low compared to those determined for the hammerhead Rz (55°C (27)). The relatively low optimal temperature is most likely an indication that the inactivation of the Rz is dependent on tertiary interactions rather than secondary structure unfolding, which would suggest a higher temperature. The slope of the linear portion of the curve was then used to estimate the activation energy (14.9 kcal/mol).
Figure 4.
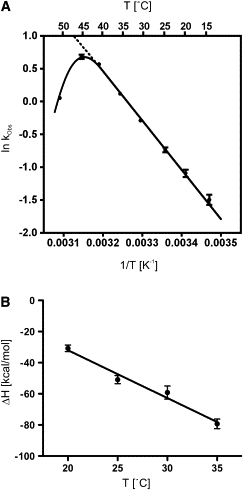
Characterization of the temperature dependence of cleavage's kinetic parameters. (A) Temperature dependence of the rate constant (kobs). The reactions were performed under single-turnover conditions at the indicated temperatures. (B) Temperature dependence of the enthalpy (ΔH). ITC experiments were performed as described previously using Rz-A78U/A79U at the indicated temperatures. The ΔH values were plotted as a function of the temperature.
Subsequently, ITC experiments were performed at different temperatures using the Rz-A78U/A79U mutant, which isolates P1.1 pseudoknot formation, in the presence of 10 mM MgCl2. Specifically, the formation of the RzS3 complex was monitored at temperatures between 20°C and 35°C. Both the enthalpy and entropy values are reported in Table 2. Clearly, the ΔH value is larger than the TΔS value at all temperatures, showing that the limiting step of the folding pathway is always enthalpy-driven. In fact, both parameters vary proportionally as a function of the temperature. Plotting the ΔH values at different temperatures yielded a linear dependence with a slope of −3.1 ± 0.3 kcal/mol·K (Fig. 4 B). This value corresponds to the heat capacity (ΔCp), a measure of the enthalpy as a function of the temperature (28). To determine if this heat capacity is dominated by either the P1 formation or the tertiary interactions, ΔCp was also determined for the Rz-U23A. A ΔCp of −2.5 ± 0.2 kcal/mol·K was evaluated for this mutant. This indicates that the heat capacity is dominated by the P1 formation. Each basepair has an average contribution of −0.36 kcal/mol·K, which is in good agreement with data reported for basepairs of multibranched RNA motifs (5). Clearly, these data show that the limiting step is enthalpy-driven regardless of the incubation temperature, at least for temperatures in the range where the HDV Rz is active.
Table 2.
Thermodynamic data for the Rz-A78U/A79U mutant at various temperatures
| T (K) | ΔH (kcal/mol) | TΔS (kcal/mol) | ΔG (kcal/mol) |
|---|---|---|---|
| 293.2 | −30.8 ± 2.1 | −21.5 ± 2.2 | −9.3 ± 0.2 |
| 298.2 | −50.9 ± 2.6 | −42.0 ± 2.7 | −8.9 ± 0.3 |
| 303.2 | −59.2 ± 4.2 | −50.0 ± 3.9 | −9.1 ± 0.4 |
| 308.2 | −79.3 ± 3.1 | −69.3 ± 2.8 | −10.0 ± 0.2 |
It might appear unexpected that the formation of the P1.1 pseudoknot is the limiting step because it involves the formation of two GC basepairs (i.e., six H-bonds), that is of basepairs that are more stabilizing than the other tertiary interactions. However, the formation of the pseudoknot may require the disruption of several interactions between water molecules and the RNA bases, which, on the surface, would appear to be more important than the gain obtained from the formation of the GC basepairs. Based on what is known for proteins, the physical origin of the RNA heat capacity is mainly attributed to the water molecules released from aromatic surfaces during folding (29). This phenomenon occurs when duplexes are formed, or stacked on top of each other, and when single-stranded regions are involved in specific motifs such as the P1.1 pseudoknot. In that sense, heat capacity can be understood as an approximation of the extent of the interaction network formed during the folding of an RNA species.
Refinement of the folding pathway using ITC
Between the formation of the ribose zipper motif and the final positioning of the catalytic cytosine (C-76), two conformational transitions occur, specifically the trefoil turn of the uridine located at position 77 (U-77) and the switch of the C19-G81 basepair to the C19-G80 basepair at the bottom of the P2 stem. To evaluate the energetic contributions of these two transitions, several mutations that prevent the formation of the C19-G80 basepair were examined (data not shown). One of these mutants resulted from the substitution of U-80 for G-80 (Rz-G80U; Fig. 5 A). This mutant exhibited only a residual cleavage activity (∼4%; Fig. 5 B). Because cleavage occurred, this mutant could not be analyzed using ITC because the release of the 5′-product significantly influences the data, specifically the entropy. Consequently, a double mutant including the G80U substitution as well as the C76A substitution was synthesized (Fig. 5 A). We rationalized that 96% of the RzS complex will be trapped at the basepair switch step by the presence of the G80U mutation and that the other 4% will be trapped at the subsequent step by the C76A mutation. This Rz-G80U/C76A mutant was completely deprived of any cleavage activity. ITC analysis of this mutant led to a ΔG value that was intermediate between that of the Rz-ΔU77 mutant, which was proposed to trap the RzS complex after the formation of the A-minor motif, and the Rz-C76A mutant (see Fig. 5 C) but was closer to the latter. Because the Rz-G80U/C76A mutant should permit the formation of the trefoil turn, we suggest that this tertiary motif has an important contribution in reducing the ΔG value. However, this does not imply that the basepair switching is less important in terms of ΔG stabilization. We hypothesized that, after the formation of the A-minor motif, the more important issue is that both the trefoil turn and the basepair switching are required to relax the catalytic center as well as to position the catalytic cytosine.
Figure 5.
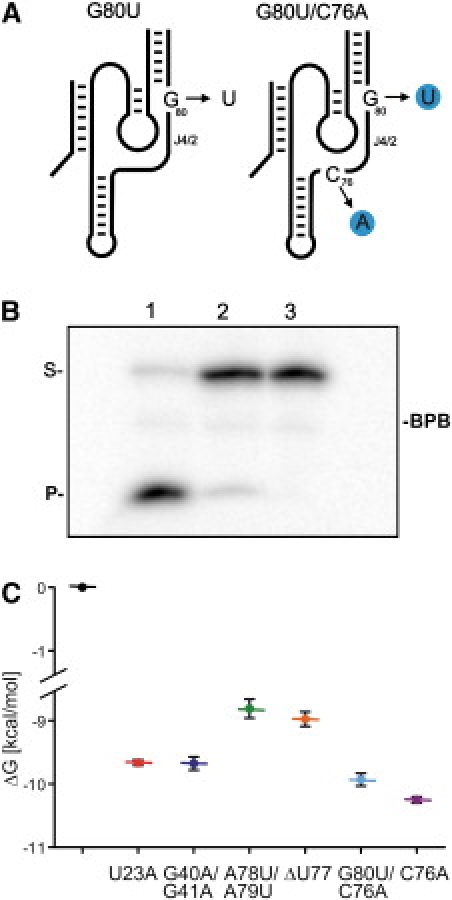
Structure, cleavage activity, and ITC analysis of the Rz-G80U/C76A mutants. (A) Schematic representation of the secondary structure of the HDV Rz. The G80U and C76A mutations are indicated by the blue circles. (B) Autoradiogram of a denaturing PAGE gel of the cleavage reaction performed with a trace amount of 5′-32P-labeled substrate and 200 nM of either the original Rz (lane 1), the Rz-G80U mutant (lane 2), or the Rz-G80U/C76A (lane 3) mutant. Aliquots were removed after 1 h and analyzed on the gel. The positions of both the substrate (S) and the product (P) are indicated. (C) Revised evolution of the Gibbs free energy (ΔG) including the value for the Rz-G80U/C76A mutant (light blue).
Conclusions
This study shows that ITC permits documentation of the energetic landscape of the tertiary interactions taking place along the folding pathway of a catalytic RNA species. Specifically, it provides the thermodynamic parameters for the complete system and, consequently, the impact of a given tertiary interaction on the global structure. Therefore, these values cannot be used directly for RNA structure prediction. More importantly, ITC appears to be a method of choice with which to characterize the bimolecular interactions of RNA molecules, just as it is for proteins. In both cases the limiting factor is the homogeneity of the complexes analyzed. HDV Rz, which adopts a tightly packed tertiary structure, appears suitable for ITC analysis. The formation of the network of interactions within its catalytic center most likely drives the folding pathway yielding homogeneous, or almost homogeneous, populations of RzS complexes (23). This hypothesis received support from several pieces of physical evidence of the study presented here including that the Rz exhibited cleavage at almost completion and that all ITC curves were well fitted using single-site binding models. However, it is an important assumption that needs to be verified for any other RNA species subject to ITC analysis.
In the case of the HDV Rz, ITC shows that its folding pathway is enthalpy-driven and that it produces a more ordered system. The substrate is trapped in the catalytic center by the formation of the P1.1 pseudoknot, which is the limiting step of the process. The P1.1 pseudoknot required some energy to be formed most likely to undergo the important conformational change that stacks together P1-P1.1-P4 burying aromatic moieties. Structural rearrangements then successively occur, contributing to the correct positioning of the catalytic cytosine near the scissile phosphate within the RzS∗ transition complex. Clearly, ITC provides a new dimension in the study of the molecular mechanism of HDV Rz and has great potential in the study of many more RNA species.
Supplementary Material
Electrophoretic mobility shift assay materials and methods, one figure, and one table are available at http://www.biophysj.org/biophysj/supplemental/S0006-3495(08)00031-3.
Supplementary Material
Acknowledgments
The authors thank Mr. Nathaniel Robichaud for technical assistance.
This work was supported by a grant from the Canadian Institute for Health Research (CIHR; MOP-44022). The RNA group is supported by a grant from the CIHR, and by the Université de Sherbrooke. J.P.P. holds the Canada Research Chair in Genomics and Catalytic RNA. M.B. is a CIHR New Investigator. J.P.P. and M.B. are members of the Infectious Diseases group of the Centre de Recherche Clinique Étienne-Lebel.
References
- 1.Lilley D.M.J. Structure, folding and mechanisms of ribozymes. Curr. Opin. Struct. Biol. 2005;15:313–323. doi: 10.1016/j.sbi.2005.05.002. [DOI] [PubMed] [Google Scholar]
- 2.Ladbury J.E., Chowdhry B.Z. Sensing the heat: the application of isothermal titration calorimetry to thermodynamic studies of biomolecular interactions. Chem. Biol. 1996;3:791–801. doi: 10.1016/s1074-5521(96)90063-0. [DOI] [PubMed] [Google Scholar]
- 3.Feig A.L. Applications of isothermal titration calorimetry in RNA biochemistry and biophysics. Biopolymers. 2007;87:293–300. doi: 10.1002/bip.20816. [DOI] [PMC free article] [PubMed] [Google Scholar]
- 4.Mikulecky P.J., Feig A.L. Heat capacity changes associated with DNA duplex formation: salt- and sequence-dependent effects. Biochemistry. 2006;45:604–616. doi: 10.1021/bi0517178. [DOI] [PMC free article] [PubMed] [Google Scholar]
- 5.Mathews D.H., Turner D.H. Experimentally derived nearest-neighbor parameters for the stability of RNA three- and four-way multibranch loops. Biochemistry. 2002;41:869–880. doi: 10.1021/bi011441d. [DOI] [PubMed] [Google Scholar]
- 6.Hammann C., Cooper A., Lilley D.M.J. Thermodynamics of ion-induced RNA folding in the hammerhead ribozyme: an isothermal titration calorimetric study. Biochemistry. 2001;40:1423–1429. doi: 10.1021/bi002231o. [DOI] [PubMed] [Google Scholar]
- 7.Mikulecky P.J., Takach J.C., Feig A.L. Entropy-driven folding of an RNA helical junction: an isothermal titration calorimetric analysis of the hammerhead ribozyme. Biochemistry. 2004;43:5870–5881. doi: 10.1021/bi0360657. [DOI] [PMC free article] [PubMed] [Google Scholar]
- 8.Shih I.H., Been M.D. Catalytic strategies of the hepatitis delta virus ribozymes. Annu. Rev. Biochem. 2002;71:887–917. doi: 10.1146/annurev.biochem.71.110601.135349. [DOI] [PubMed] [Google Scholar]
- 9.Bergeron L., Ouellet J., Perreault J.P. Ribozyme-based gene-inactivation systems require a fine comprehension of their substrates specificities; The case of delta ribozyme. Curr. Med. Chem. 2003;10:2589–2597. doi: 10.2174/0929867033456486. [DOI] [PMC free article] [PubMed] [Google Scholar]
- 10.Wadkins T.S., Perrotta A.T., Ferré D'Amaré A.R., Doudna J.A., Been M.D. A nested pseudoknot is required for self-cleavage activity of both the genomic and antigenomic hepatitis delta virus ribozymes. RNA. 1999;6:720–727. doi: 10.1017/s1355838299990209. [DOI] [PMC free article] [PubMed] [Google Scholar]
- 11.Ferré D'Amaré A.R., Zhou K., Doudna J.A. Crystal structure of a hepatitis delta virus ribozyme. Nature. 1998;395:567–574. doi: 10.1038/26912. [DOI] [PubMed] [Google Scholar]
- 12.Ke A., Zhou K., Ding F., Cate J., Doudna J.A. A conformational switch controls hepatitis delta virus ribozyme catalysis. Nature. 2004;429:201–205. doi: 10.1038/nature02522. [DOI] [PubMed] [Google Scholar]
- 13.Tanaka Y., Hori T., Tagaya M., Sakamoto T., Kurihara M. Imino proton NMR analysis of HDV ribozymes: Nested double pseudoknot structure and Mg2+ ion-binding site close to the catalytic core in solution. Nucleic Acids Res. 2002;30:766–774. doi: 10.1093/nar/30.3.766. [DOI] [PMC free article] [PubMed] [Google Scholar]
- 14.Fiola K., Perreault J.P. Kinetic and binding analysis of the catalytic involvement of ribose moieties of a trans-acting delta ribozyme. J. Biol. Chem. 2002;277:26508–26516. doi: 10.1074/jbc.M203468200. [DOI] [PMC free article] [PubMed] [Google Scholar]
- 15.Nishikawa F., Shiria M., Nishikawa S. Site-specific modification of functional groups in genomic hepatitis delta virus (HDV) ribozyme. Eur. J. Biochem. 2002;269:5792–5803. doi: 10.1046/j.1432-1033.2002.03280.x. [DOI] [PubMed] [Google Scholar]
- 16.Reymond C., Ouellet J., Bisaillon M., Perreault J.P. Examination of the folding pathway of the antigenomic hepatitis delta virus ribozyme reveals key interactions of the L3 loop. RNA. 2006;13:44–54. doi: 10.1261/rna.263407. [DOI] [PMC free article] [PubMed] [Google Scholar]
- 17.Ouellet J., Perreault J.P. Cross-linking experiments reveal the presence of novel structural features between a hepatitis delta virus ribozyme and its substrate. RNA. 2004;10:1059–1072. doi: 10.1261/rna.7230604. [DOI] [PMC free article] [PubMed] [Google Scholar]
- 18.Pereira M.J.B., Harris D.A., Rueda D., Walters N.G. Reaction pathway of the trans-acting hepatitis delta virus ribozyme: a conformational change accompanies catalysis. Biochemistry. 2002;41:730–740. doi: 10.1021/bi011963t. [DOI] [PubMed] [Google Scholar]
- 19.Harris D.A., Rueda D., Walter N.G. Local conformational changes in the catalytic core of the trans-acting hepatitis delta virus ribozyme accompany catalysis. Biochemistry. 2002;41:12051–12061. doi: 10.1021/bi026101m. [DOI] [PubMed] [Google Scholar]
- 20.Ananvoranich S., Perreault J.P. The kinetics and magnesium requirements for the folding of antigenomic delta ribozymes. Biochem. Biophys. Res. Commun. 2000;270:600–607. doi: 10.1006/bbrc.2000.2465. [DOI] [PubMed] [Google Scholar]
- 21.Nehdi A., Perreault J., Beaudoin J.D., Perreault J.P. A novel structural rearrangement of hepatitis delta virus antigenomic ribozyme. Nucleic Acids Res. 2007;35:6820–6831. doi: 10.1093/nar/gkm674. [DOI] [PMC free article] [PubMed] [Google Scholar]
- 22.Bevilacqua P.C., Yajima R. Nucleobase catalysis in ribozyme mechanism. Curr. Opin. Chem. Biol. 2006;10:455–464. doi: 10.1016/j.cbpa.2006.08.014. [DOI] [PubMed] [Google Scholar]
- 23.Doherty E.A., Doudna J.A. Ribozyme structure and mechanism. Annu. Rev. Biochem. 2000;69:597–615. doi: 10.1146/annurev.biochem.69.1.597. [DOI] [PubMed] [Google Scholar]
- 24.Turnbull W.B., Daranas A.H. On the value of c: can low affinity systems be studied by isothermal titration calorimetry? J. Am. Chem. Soc. 2003;125:14859–14866. doi: 10.1021/ja036166s. [DOI] [PubMed] [Google Scholar]
- 25.Wiseman T., Williston S., Brandts J.F., Lin L.N. Rapid measurement of binding constants and heats of binding using a new titration calorimeter. Anal. Biochem. 1989;179:131–137. doi: 10.1016/0003-2697(89)90213-3. [DOI] [PubMed] [Google Scholar]
- 26.Mercure S., Lafontaine D.A., Ananvoranich S., Perreault J.P. Kinetic analysis of delta ribozyme cleavage. Biochemistry. 1998;37:16975–16982. doi: 10.1021/bi9809775. [DOI] [PMC free article] [PubMed] [Google Scholar]
- 27.Uhlenbeck O.C. A small catalytic oligoribonucleotide. Nature. 1987;328:596–600. doi: 10.1038/328596a0. [DOI] [PubMed] [Google Scholar]
- 28.Fang X.W., Golden B.L., Littrell K., Shelton V., Thiyagarajan P. The thermodynamic origin of the stability of a thermophilic ribozyme. Proc. Natl. Acad. Sci. USA. 2001;98:4355–4360. doi: 10.1073/pnas.071050698. [DOI] [PMC free article] [PubMed] [Google Scholar]
- 29.Mikulecky P.J., Feig A.L. Heat capacity changes in RNA folding: application of perturbation theory to hammerhead ribozyme cold denaturation. Nucleic Acids Res. 2004;32:3967–3976. doi: 10.1093/nar/gkh723. [DOI] [PMC free article] [PubMed] [Google Scholar]
- 30.Lescoute A., Westhof E. The interaction networks of structured RNAs. Nucleic Acids Res. 2006;34:6587–6604. doi: 10.1093/nar/gkl963. [DOI] [PMC free article] [PubMed] [Google Scholar]
Associated Data
This section collects any data citations, data availability statements, or supplementary materials included in this article.