

Abstract
Cones show briefer light responses than rods and do not saturate even under very bright light. Using purified rod and cone homogenates, we measured the activity of guanylate cyclase (GC), an enzyme responsible for cGMP synthesis and therefore recovery of a light response. The basal GC activity was 36 times higher in cones than in rods: It was mainly caused by higher expression levels of GC in cones (GC-C) than in rods (GC-R). With identification and quantification of GC-activating protein (GCAP) subtypes expressed in rods and cones together with determination of kinetic parameters of GC activation in the presence and absence of GCAP, we estimated the in situ GC activity in rods and cones at low and high Ca2+ concentrations. It was revealed that the GC activity would be >10 times higher in cones than in rods in both the dark-adapted and the light-adapted states. Electrophysiological estimation of the GC activity measured in the truncated preparations of rod and cone outer segments gave consistent results. Our estimation of the in situ GC activity reasonably explained the rapid recovery and nonsaturating behavior of cone light responses.
Keywords: Ca2+, guanylate cyclase-activating protein, guanylate cyclase, phototransduction, rods
In the vertebrate retina, there are 2 types of photoreceptors, rods and cones. They differ in several aspects. Rods show higher sensitivity to light than cones. Because of this difference, rods mediate twilight vision and cones mediate daylight vision. The range of light intensity where cones show light adaptation is much wider than that of rods, and cones essentially do not saturate even under very bright light (1). Time course of a flashlight response of a cone is much faster than that of a rod, which increases the time resolution of our daylight vision (2).
The molecular mechanism of generation and termination of a light response is well documented in rods (3, 4): Rods use cGMP as the second messenger that mediates photon absorption by a visual pigment to the closure of the cGMP-gated cation channel. The cGMP level in the outer segment (OS) decreases as a result of hydrolysis by cGMP phosphodiesterase (PDE) that is activated in the light. The level of cGMP is restored after a light by guanylate cyclase (GC), a synthesizing enzyme of cGMP from GTP. Those studies were made mainly in rods. Although it is known that a similar mechanism is present in cones (3–5), our knowledge of cones is limited. In previous studies, however, we have shown that some of the reactions essential for characterizing light responses are quantitatively different between rods and cones (6–8).
In rods and cones, the cytoplasmic Ca2+ concentration decreases in the light, and GC is activated (9) by a family of Ca2+-binding proteins, GC-activating proteins (GCAPs) (10, 11). Because cGMP directly determines the electrical activity of rods and cones, the regulation of its synthesis is very critical for the function of rods and cones. Electrophysiological analysis using GCAP-deficient mouse rods showed that this family of proteins is essential for normal recovery of a light response and the reduction of light sensitivity of a rod during light adaptation (12). Although many studies have been performed on GC activity in rods, little is known about GC activity in cones.
In the present study, using purified carp (Cyprinus carpio) rods and cones (6, 7), we measured GC activity, identified the subtypes of GC and GCAP, and quantified them. We also determined the kinetic parameters of the activation of GC by GCAP in rods and cones. Based on these parameters and the quantified expression level of each subtype of GC and GCAP, we estimated the in situ GC activities in rods and cones and tried to explain briefer light responses and nonsaturating behavior of light responses in cones.
Results
Higher Basal GC Activity in Cones Than in Rods.
Using homogenates of purified carp rods and cones, we measured GC activity. Fig. 1A shows the time course of cGMP synthesis in rod and cone homogenates. We routinely quantified rods and cones by measuring the amount of visual pigments in each sample, and the GC activity in this study was defined in units of per visual pigment present. This expression is useful for the comparison of the GC activities per unit volume of the OS between rods and cones, because (i) the density of the visual pigment in the OS is similar between rods and cones (13) and (ii) GC was solely expressed in the OS (see Expression of Different Subtypes of GC in Rods and Cones). As shown in Fig. 1A, GC activity is obviously much higher in cones than in rods. The initial velocity of the reaction in rods was 0.066 ± 0.004 cGMP synthesized per pigment per min (cGMP/pigment·min) at a high Ca2+ concentration (0.3 mM CaCl2) and was 0.18 ± 0.01 cGMP/pigment·min at a low Ca2+ concentration (0.8 mM EGTA). The activity we obtained at the high Ca2+ concentration was similar to that reported in bovine rod OS (ROS) (9). The initial velocities of the reaction in cones were much higher and were 2.4 ± 0.6 cGMP/pigment·min at the high Ca2+ concentration and 2.7 ± 0.7 cGMP/pigment·min at the low Ca2+ concentration (Fig. 1B).
Fig. 1.

Time course of cGMP synthesis in rod and cone homogenates. (A) Time course of cGMP synthesis in rod (circles) and cone (triangles) homogenates measured at a high Ca2+ concentration (0.3 mM CaCl2, open symbols) and a low Ca2+ concentration (0.8 mM EGTA, filled symbols). The amount of cGMP synthesized is expressed as the number of cGMP molecules per visual pigment present and is plotted against time after addition of GTP. The result is shown as mean ± SD (n = 3). (B) Initial rates of cGMP synthesis in rod and cone homogenates calculated from the data in A at 2.5 min after addition of GTP.
It has been known that GC is activated by GCAP at low Ca2+ concentrations (10, 11). Consistently, our result showed that, in both rods and cones, GC activity was higher at low Ca2+ concentrations. However, the effect was small, which was probably because of dilution of GCAPs in our homogenates (see GCAP mRNAs Expressed in the Carp Retina). Because addition of GCAP did not affect the GC activity at high Ca2+ concentrations (see Regulation of GCs by GCAPs), we concluded that the basal GC activity, i.e., the activity at the high Ca2+ concentration, is 36 (2.4/0.066) times higher in cones than in rods in our purified homogenates.
The cGMP synthetic activity decreased with time during incubation (Fig. 1A). The underlying mechanism of this decrease is not known. However, because excess amount of cGMP (2.5 mM) was present throughout the measurement (see SI Text) and only a small portion of GTP (<15 μM) was allowed to be converted to cGMP, the apparent decrease cannot be attributed to a product inhibition or run-out of the substrate.
Expression of Different Subtypes of GC in Rods and Cones.
As shown, the basal GC activity in our cone homogenates was much higher than that in our rod homogenates (Fig. 1). This result suggested that GCs in rods and cones could be different in their expression levels and/or subtypes expressed.
To clarify this point, we first determined the GC subtype expressed in carp rods and cones. The expression pattern of phototransduction proteins including GCs and GCAPs in rods versus cones varies among vertebrates (3, 12). In teleost, 4 types of GCs, termed OlGC3, OlGC4 (OlGC-R1), OlGC5 (OlGC-C), and OlGC-R2, have been cloned from ocular or retinal cDNA libraries of medaka (14, 15). OlGC-R1 and OlGC-R2 are expressed in rods, and OlGC-C is expressed in cones (15). By using a carp retinal cDNA library, we screened the DNA fragments corresponding to these GCs and obtained 3 of the carp orthologs: GC-R1, GC-R2, and GC-C (Fig. S1A). The carp OlGC3 ortholog was not obtained probably because OlGC3 is expressed in the eye (14) but not in the retina (15).
To identify the subtypes of GC expressed in rods and cones and to quantify it, we raised specific antiserum against a C-terminal partial peptide of each GC (Fig. S2A). Using these antisera or antibody obtained after purification, immunoblot analysis was performed (Fig. S2 B–D). The result showed that GC-R1 and GC-R2 were expressed in rods and GC-C was expressed in cones. All of the GCs, GC-R1, GC-R2 and GC-C, were present in the membrane fraction. The contents of GC-R1 and GC-R2 in the rod membrane fraction were 1.3 ± 0.4 (n = 21) and 0.10 ± 0.03 (n = 6) per 1,000 rod pigment molecules, respectively (Fig. 2). Assuming that the visual pigment concentration is 3 mM (13), these values can be converted to 3.9 ± 1.2 and 0.3 ± 0.1 μM, respectively. The content of GC-C in the cone membrane fraction was 24 ± 7.4 per 1,000 cone pigments (72 ± 22 μM; n = 13) (Fig. 2). It was evident that (i) GC-R1 was the major GC subtype expressed in rods, (ii) GC expressed in cones was GC-C, and (iii) the expression level of GC was 17 (24/1.4) times higher in cones. Because GC expression levels were estimated by using C-terminal partial GC peptides as the molar standards (see Materials and Methods), the estimated GC expression levels in rods and cones may slightly be overestimated or underestimated. However, with different methods, we confirmed that our estimation is acceptable (see SI Text).
Fig. 2.

Quantification of GCs and GCAPs in rods and cones. Quantified expression levels of GC and GCAP in rods (upper half) and cones (lower half). The expression levels are shown as the number of molecules present per 1,000 visual pigment molecules. The concentration of each molecule was calculated based on the visual pigment concentration (3 mM) and is shown at the right of each bar.
Previous studies showed that GCs in rods and cones are expressed mainly in the OS (10, 16). Because our purified rods and cones retain the inner segments (ISs) (6, 17), we tried to confirm that GCs in carp are expressed in the OS. For this study, we used OS-rich and IS-rich preparations of rods and cones (8). The result showed that the GC content expressed in units of per visual pigment present did not change significantly even when the IS content increased or decreased in rods (Fig. S3A) or cones (Fig. S3B), which indicated that GCs are present only in the OS of rods and cones.
Although rods contain both GC-R1 and GC-R2, in the present study, we assumed that GC-R1 and GC-R2 show similar specific activity. From the measured amounts of GCs (Fig. 2) in rods (GC-R; i.e., GC-R1 plus GC-R2) and in cones (GC-C), and their activities in rods and cones (Fig. 1B), we calculated the specific basal activities of GC-R and GC-C (Table 1). The result showed that the specific basal GC activity is slightly (2 times) higher in GC-C than in GC-R, and therefore, that the 36 times higher basal GC activity in cones is caused mainly by a higher expression level of GC-C over GC-R.
Table 1.
Specific activity, Michaelis constant (KmGCAP), and expected concentration of each form of GC
| GC form | Specific activity (cGMP/GC-s) | KmGCAP, μM | Concentration, μM |
|---|---|---|---|
| GC-R | |||
| Basal | 0.79 | 2.33 | |
| GCAP1-bound | 11.8 | 2.0 | 0.45 |
| GCAP2-bound | 6.8 | 0.63 | 1.42 |
| GCAP3-bound | 13.1 | 0.23 | |
| GC-C | |||
| Basal | 1.7 | 40.4 | |
| GCAP3-bound | 5.7 | 1.8 | 31.6 |
GCAP mRNAs Expressed in the Carp Retina.
In Fig. 1, the Ca2+ effect on the GC activity was not observed significantly either in the cone homogenates or the rod homogenates in contrast to previous studies done in mammalian rods where the GC activity is increased by 10 times or so (9, 11). These results suggested that carp GCAP dissociated from GC or membranes in our rod or cone homogenates so that the concentration of GCAP was too low to exert its effect in our measurements in Fig. 1. To examine the effect of GCAP on the GC activity, we then attempted to determine the subtypes of GCAP expressed in rods and cones. In previous studies, 3 GCAP proteins (GCAP1, GCAP2, and GCAP3) have been confirmed to be expressed in photoreceptor cells (18), and 3 additional GCAPs (GCAP4, GCAP5, and GCAP7) have been suggested to be present in zebrafish cones (19). To determine the subtypes expressed in the carp retina, DNA fragments corresponding to the carp orthologs of these GCAPs were obtained (Fig. S1B), and the relative abundance of these mRNAs in the carp retina was analyzed by real-time RT-PCR (Fig. S4). The result showed that GCAP1, GCAP2, GCAP3, and GCAP5 mRNAs were expressed at high levels in the carp retina, whereas GCAP4 and GCAP7 were not detected appreciably.
Expression of Different Subtypes of GCAP in Rods and Cones.
To identify the GCAP subtype expressed in rods and cones, we obtained recombinant GCAP1, GCAP2, GCAP3, and GCAP5 in Escherichia coli. Then, specific antiserum against each GCAP was raised (Fig. S5A), and expression level of each GCAP in rods and cones was examined by immunoblot analysis (Fig. S5 B–D). Signals of GCAP1 and GCAP2 were mainly obtained in the rod soluble fraction, and signals of GCAP3 were mostly detected in the cone soluble fraction (Fig. S5 B and C). The signal of GCAP5 was not detected in rods or cones (Fig. S5B). Thus, similarly as GCs, rods and cones express different subtypes of GCAP. The quantity of each GCAP expressed in rods or cones was estimated by immunoblot analysis (Fig. S5 C and D). The contents of GCAP1 and GCAP2 in rods were 0.28 ± 0.22 (n = 18) and 0.60 ± 0.25 (n = 16) per 1,000 rod pigments, respectively. Assuming that the visual pigment concentration is 3 mM, these values can be converted to 0.84 ± 0.66 and 1.80 ± 0.75 μM, respectively. In cones, the content of GCAP3 was 11 ± 3.9 per 1,000 cone pigments (33 ± 12 μM; n = 4) (Fig. 2). Although the expression level of GCAP molecules in cones was 13 times [33 μM/(0.84 μM + 1.8 μM)] higher than that in rods, the amount of GCAPs is approximately half that of GC in both rods and cones (Fig. 2).
To confirm that GCAPs were not lost during purification of our rods and cones, we quantified GCAPs in the whole retina by immunoblots. The contents of GCAP1 and GCAP2 were 0.3 and 1.0 per 1,000 rod pigments, respectively and were similar to those obtained in our purified rods: 0.28 ± 0.22 (GCAP1) and 0.60 ± 0.25 (GCAP2) per 1,000 rod pigments. Quantification of GCAP3 was difficult because it was not easy to measure the quantity of cone visual pigments in the retinal homogenate. However, if we assume that the population of cones is ≈2% to that of rods (6), our best estimate of the quantity of GCAP3 per 1,000 molecules of cone visual pigment was 7.3. The value was close to that we obtained in our purified cones (11 ± 3.9 per 1,000 cone pigments; Fig. 2). These results indicated that GCAPs were not lost significantly during purification of our rods and cones.
Regulation of GCs by GCAPs.
The stimulatory effects of Ca2+-free form of GCAPs on each of GC were measured. Rod GCs (GC-R1 plus GC-R2) were activated by all subtypes of GCAP examined (GCAP1–GCAP5; Fig. 3A and Fig. S6A), whereas cone GC (GC-C) was activated only by GCAP3 and GCAP4 (Fig. 3B and Fig. S6B). Because we neither detected the expression of GCAP4 (Fig. S4) nor GCAP5 (Fig. S5B) in the carp retina, we only studied the effects of 3 subtypes of GCAPs, GCAP1–GCAP3.
Fig. 3.

Regulation of GC activity by GCAPs. (A) Dose-dependent activation of GC-R by recombinant GCAPs. GC activity was plotted against the concentration of GCAP added. The data were fitted by a Michaelis–Menten equation. The result is shown as mean ± SD (n = 3). (B) Dose-dependent activation of GC-C by recombinant GCAPs. The data for GCAP3 were fitted with a Michaelis–Menten equation. The result is shown as mean ± SD (n = 3). (C) Activation of GC-R by GCAP1 and GCAP2. The GC-R activity was measured in the presence or absence of GCAP1 and GCAP2, and at a high Ca2+ concentration (open bar) and a low Ca2+ concentration (filled bar). All of the activities measured were normalized to the activity measured in the absence of added GCAP at the high Ca2+ concentration. The result is shown as mean ± SD (n = 6). (D) Activation of GC-C by GCAP3. The GC-C activity was measured in the presence and absence of GCAP3 and at a high Ca2+ concentration (open bar) and a low Ca2+ concentration (filled bar). All of the activities measured were normalized to the activity measured in the absence of added GCAP3 at the high Ca2+ concentration. The result is shown as mean ± SD (n = 6).
Fig. 3 A and B shows the GC-R and GC-C activities, respectively, as a function of added recombinant GCAPs. The data were fitted by a Michaelis–Menten equation (solid lines in Fig. 3 A and B) to determine the maximum activity of GC and the concentration of GCAP that induces half-maximal activation of GC (KmGCAP). Maximum activities of GC-R activated by GCAP1, GCAP2, and GCAP3 were 0.99, 0.57, and 1.1 cGMP/pigment·min, respectively, and that of GC-C activated by GCAP3 was 8.2 cGMP/pigment·min. Assuming that the pigment concentration is 3 mM, these activities could be converted to the activities expressed in concentrations: 50, 29 and 55 μM cGMP synthesized per s for GC-R in rods with GCAP1, GCAP2, and GCAP3, respectively, and 410 μM cGMP synthesized per s for GC-C with GCAP3 in cones. Based on the expression levels of GC-R in rods and GC-C in cones (Fig. 2), we calculated the specific activities of GC-R and GC-C in the presence of GCAP (Table 1). It was found that the specific activity of GC-R in the presence of GCAP was generally higher than that of GC-C. The KmGCAP values were also determined (Table 1).
Because GCAP1 and GCAP2 were both expressed in rods significantly (Fig. 2), it was examined whether the effects of GCAP1 and GCAP2 are additive under a pseudophysiological condition (Fig. 3C): The concentrations of GCAPs were set to be similar to those calculated as the concentrations in vivo (0.5 μM GCAP1 and 2.5 μM GCAP2; see Fig. 2). The results showed that the activity in the presence of both GCAP1 and GCAP2 was fairly equal to the sum of the activities elicited by either GCAP1 or GCAP2 (Fig. 3C, broken lines). This finding indicates that at the physiological concentrations of GCAPs the effects of GCAP1 and GCAP2 are additive. When GC-R was maximally activated by GCAP1, GC-R was not activated further by addition of GCAP2. However, when GC-R was maximally activated by GCAP2, GCAP1 further increased the activity to the maximum level that was achieved by a saturating dose of GCAP1. The Ca2+-bound form of GCAPs did not affect the GC activity in rods (Fig. 3C) or cones (Fig. 3D).
Higher GC Activity in Truncated COS Than in Truncated ROS.
The synthesis of cGMP from GTP was observed electrophysiologically by using a truncated preparation of a rod OS (tROS) (20) and that of a cone OS (tCOS; see Fig. 4A) at low Ca2+ concentrations in the dark. In this study, because of technical difficulties of preparation of tROS of carp, we used frog tROS. Then a cGMP solution was internally perfused from the open end of tROS or tCOS to measure the diffusion of a small molecule like cGMP under the assumption that cGMP opens a cGMP-gated channel without significant delays once the molecule reaches to the channel. In both tROS and tCOS, the membrane current started to flow on application of cGMP without significant delays (thin black traces for tROS and thin red traces for tCOS in Fig. 4B; n = 3 in both preparations; a measurement in each sample is indicated by a continuous, broken, or dotted trace).
Fig. 4.

GC activity in tROS and tCOS. (A) Diagram illustrating the truncation and perfusion of tCOS. (B) Time course of generation of a current induced by perfusion of 1 mM cGMP (thin traces) or 1 mM GTP (thick traces) in a frog tROS (black traces) and a tCOS of carp red cone (red traces). Perfusion first with cGMP and then GTP was made for 3 tROS and 3 tCOS preparations. Traces of the same color and pattern (continuous, broken, or dotted lines) indicate that they were recorded in the same sample. The current amplitude is expressed as the percentage of the maximum. The maximum current obtained by perfusion with 1 mM GTP was similar to that obtained by 1 mM cGMP. (C) Calculated time course of the rise of the mean intracellular cGMP concentration in tROS (black traces) and tCOS (red traces) preparations. The mean cGMP concentration in the OS was estimated by applying a Hill equation to the current induced by GTP (see Higher GC Activity in Truncated COS Than in Truncated ROS). The horizontal line indicates the cGMP concentration that induces 80% of the maximum current. The pattern of a trace corresponds to that in B. (D) Time course of the rate of change of cGMP concentration. Based on the cGMP concentration increase shown in C, the rate of change of cGMP concentration was calculated in a 200-ms time window for tROS (black traces) and tCOS (red traces). Arrowhead indicates the rate in tCOS determined at the 80% saturation of the current. The pattern of a trace corresponds to those in B and C.
Then, GTP instead of cGMP was perfused at low Ca2+ concentrations in the tROS or the tCOS in which the diffusion of cGMP had been measured before the application of GTP (thick traces in Fig. 4B). In Fig. 4 B–D, the same continuous, broken, or dotted trace pattern was used to indicate in which sample the trace was recorded. In tROSs, the current was observed with significant delays (Fig. 4B, thick black traces) whereas in tCOSs the current started to flow with only slight delays (Fig. 4B, thick red traces). Because the diffusion time course of a small molecule like cGMP (and therefore probably GTP also) was similar between tROS and tCOS (thin black and red traces in Fig. 4B), the results clearly indicated that it took more time in tROS to synthesize cGMP than in tCOS, which showed that the GC activity in the truncated forms of the OS is much higher in cones than in rods.
We then attempted to estimate the GC activity from the rate of current rise in tROS and in tCOS. Fractional current amplitude is described with a Hill equation:
where J is the current amplitude at the cGMP concentration, [cG], Jmax is its maximum current, KmChannel is the cGMP concentration that produces a half-maximal current, and n is the Hill coefficient of the cGMP-gated channel. Reported KmChannel value and n are 20–40 μM and 2–3, respectively, in rods (21, 22), and 40–80 μM and 1.6–3.0, respectively, in cones (23, 24). By adopting 30 μM as the KmChannel and 2.5 as the Hill coefficient in rods, and 60 μM as the KmChannel and 2.3 as the Hill coefficient in cones, we estimated the time course of the increase in the mean cGMP concentration in the tROS preparation (black traces in Fig. 4C) and the tCOS preparation (red traces in Fig. 4C). From these results, the rate of change of cGMP concentration was calculated (Fig. 4D). Because the synthesized cGMP could either be hydrolyzed by PDE or diffuse out of the OS (25), the actual rate of cGMP synthesis would be higher than the rate shown in Fig. 4D. However, under the assumption that the hydrolysis or diffusion of synthesized cGMP was minimal, we considered that the rate in Fig. 4D reflected the GC activity. Because the calculated cGMP concentration is not reliable when J/Jmax is close to 1, GC activity at the time when J/Jmax was 0.8 was arbitrarily determined (in Fig. 4C, at 52 μM cGMP in tROS indicated by a black horizontal line, and at 110 μM cGMP in tCOS indicated by a red horizontal line). At this time point, the rate was 29 μM cGMP synthesized per s in tROS (black arrowheads in Fig. 4D) and 140–300 μM cGMP synthesized per s in tCOS (red arrowheads in Fig. 4D). We obtained very similar GC activities among 3 tROS preparations. It was probably because at the time when we observed this amplitude of the current in tROS, GTP diffused in the entire tROS uniformly (compare thin and thick black traces in Fig. 4B) so that the constant GC activity was elicited in the entire region of tROS. In contrast, the determined GC activities in tCOS varied among the 3 preparations. It was probably because diffusion of GTP slightly different in each preparation of tCOS and depending on the efficiency of the diffusion, the time course of cGMP synthesis differed in each tCOS. Although it was not possible to determine the GC activity at low Ca2+ concentrations in tCOS uniquely, it was evident that in tROS and tCOS, the minimally disrupted preparations probably containing endogenous GCAPs, the maximum activity of GC is 5–10 times (140/29-300/29) higher in cones. The activities at low Ca2+ concentrations determined by this electrophysiological method (29 μM cGMP synthesized per s in rods and 140–300 μM cGMP synthesized per s in cones) are similar to the maximum activities determined biochemically (50 μM cGMP synthesized per s in rods and 410 μM cGMP synthesized per s in cones). Slightly lower values in the electrophysiological determination could be caused by lower expression levels of GCAPs than GC molecules in rods and cones (Fig. 2 and see Discussion).
Discussion
In this study, we found that the basal activity of GC in a unit volume of OS is 36 times higher in cones than in rods (Fig. 1). We also found that carp rods and cones express different subtypes of GC and GCAP. From quantification of GCs and GCAPs, it was found that GCs are expressed more abundantly by 17 times in cones than in rods and that the expression level of GCAP is approximately half that of GC in both rods and cones (Fig. 2). The kinetic parameters were determined in the reactions of appropriate combinations of GC and GCAP in rods and cones (Fig. 3). We further estimated the GC activities in tROS and tCOS by measuring the current induced by application of GTP and found that the activity was 5–10 times higher in tCOS than in tROS (Fig. 4).
Estimation of the GC Activity in Intact Rods and Cones.
GCAPs activate GC at low Ca2+ concentrations. However, as we quantified in this study (Fig. 2), the amount of GCAPs was approximately half that of GC in both rods [(GCAP1 + GCAP2)/(GC-R1 + GC-R2) = 2.6 μM/4.2 μM] and cones (GCAP3/GC-C = 33 μM/72 μM). This result indicates that not all GC molecules associate with GCAP molecules in intact cells. We determined the specific activity of the GCAP-bound form of GC in rods and cones (Table 1). Therefore, with determination of each population of GC that is associated with each subtype of GCAP, we can estimate the GC activity in intact photoreceptors. There have been debates about the functional forms of GC and GCAP: It has been suggested that GC and possibly GCAP, too, form a dimer to function (26). In the following, however, because the detailed activation mechanisms are not known yet, and because it is likely that 1 GCAP molecule associates with 1 GC molecule (27, 28), we simply assume that a single molecule of GC is activated by a single molecule of GCAP (or a dimer form of GC is activated by a dimer form of GCAP). Then, the binding of GCAP to GC is expressed in the following scheme:
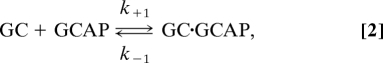 |
where k+1 and k−1 are the rate constants of the forward and the backward reaction, respectively. Under the condition of equilibrium, based on the quantified amount of each subtype of GC and GCAP (Fig. 2) together with the Michaelis constant (KmGCAP; i.e., k−1/k+1) of each reaction (Table 1), concentrations of GCAP-bound and -unbound forms of GCs in rods and cones were determined (see SI Text). Then, using the specific activity of each form (Table 1), the in situ GC activity was calculated.
The result showed that, in rods, GC activity at a high Ca2+ concentration (3.3 μM/s) increases by 7 times (22 μM/s) by lowering the Ca2+ concentration, and in cones, GC activity at a high Ca2+ concentration (120 μM/s) increases by 2 times (249 μM/s) by lowering the Ca2+ concentration (Fig. 5). Although the magnitude of the increase in the GC activity in cones (2-fold) was lower than that of rods (7-fold), the actual range of the regulation of the cGMP synthesis covers a range of 130 μM/s in cones (from 120 μM/s at high Ca2+ concentrations to 249 μM/s at low Ca2+ concentrations). This range of the regulation in cones was 9 times wider than that in rods (19 μM/s; from 3.3 to 22 μM/s). This wider range of the regulation of cGMP synthesis seems to be one of the mechanisms that characterize the cone light responses.
Fig. 5.

Estimation of GC activity in carp rods and cones in vivo. Total activity of GC was calculated from our present experimental results: expression levels of GCs and GCAPs in rods and cones (Fig. 2), the determined specific activity of GCAP-free and GCAP-bound form of a single GC molecule (Table 1), and determined Michaelis constant in each pair of GC and GCAP (Table 1). GC activity is expressed as the concentration of cGMP synthesized in ROS or COS per s. The white bar represents the GC activity brought about by its basal activity in rods and cones. The gray and black bars represent the activity of rod GCs of the GCAP1- and the GCAP2-bound forms, respectively. The hatched bar represents the activity of GCAP3-bound form of GC-C. The data in rods are shown as an inset with an expanded activity scale.
One question is why the basal activity of GC is much higher in cones. It is known that cone pigments are less stable than rod pigments, which leads to thermal activation of visual pigments (29, 30). The resultant activation of PDE induces hydrolysis of cGMP in the dark more in cones than in rods (29). Presumably, the high basal rate of GC found in this study is required to compensate for the high dark activity of cGMP hydrolysis in cones. This rapid turnover mechanism of cGMP metabolism in the dark and the wider range of the regulation of the cGMP synthesis could contribute to establish a rapid equilibrium of the cGMP concentration even when the system is perturbed by exogenous factors like photons (31). We speculate that this is one of the mechanisms that explain rapid recovery of a light response observed in cones.
Possible Contribution of High GC Activity During Light Adaptation in Cones.
It has been known that cones essentially do not saturate (1), which suggests that the recovery process of a light response is very much effective in cones. As shown in the present study, cones are able to synthesize cGMP at a rate of 250 μM/s at low Ca2+ concentrations. The maximum activity of cGMP hydrolysis by PDE in cones was 18 cGMP hydrolyzed per pigment present per s (6) that corresponds to 50 mM cGMP hydrolyzed per s. Although this maximum PDE activity is much higher than our estimated counteracting maximum activity of GC in cones, the actual PDE activity would be much lower under in situ conditions where the cGMP concentration is known to be much lower than the Michaelis constant of PDE for cGMP (KmPDE). This point could be critical to consider the mechanism of the contribution of GC on the light response in cones.
Let us assume that a very bright steady light stimulus is given to a cone and PDE is maximally activated. Because of this PDE activation, the cytoplasmic cGMP concentration could be decreased suddenly to a very low level. Then we could expect that the cytoplasmic Ca2+ concentration is reduced to its lowest level. At this stage, GC is maximally activated to its highest level, 250 μM/s for instance. We now consider the equilibrium level of cGMP under this condition: cGMP concentration would reach to a stationary level when cGMP hydrolysis and cGMP synthesis is balanced at 250 μM cGMP hydrolyzed and synthesized per s, respectively. Eq. 3 shows a Michaelis–Menten relation of PDE activity (V) as functions of the maximum PDE activity (Vmax), Michaelis constant (KmPDE), and cGMP concentration ([cG]):
In Eq. 3, with the KmPDE value of 100 μM (4), Vmax of 50 mM cGMP hydrolyzed per s as above, and a PDE activity (V) of 250 μM cGMP hydrolyzed per s, we can calculate that [cG] is 0.5 μM. In other words, at 0.5 μM cGMP, the hydrolysis and the synthesis of cGMP are balanced, and the cGMP concentration reaches an equilibrated state.
At this concentration of cGMP (0.5 μM), based on Eq. 2 with KmChannel = 60 μM, n = 2.3, and [cG] in the dark to be 2 μM (4), we found that 4% of the original dark current flows. In similar calculations in rods, the remaining current was found to be almost 0 (0.005%). The result of this sort of the calculation depends on the parameters used. However, it is evident that the maximum GC activity measured in our study can reasonably explain why cones are relieved from saturation even under very bright light.
Materials and Methods
The detailed methods and materials used in this study are given in SI Text.
Preparation of Purified Rods and Cones, and OS-Rich and IS-Rich Rods and Cones.
Carp (C. carpio) rods and cones were purified with Percoll stepwise density gradient (6, 7). The animal was cared for according to the institutional guidelines. The OS-rich and IS-rich rods and cones were obtained as reported (8). The OS was detached mechanically from the IS by passing through a needle, and the OS-rich and the IS-rich fractions were separated by centrifugation.
Measurement of GC Activity.
GC activity was measured as described (32) with some modifications.
Isolation of cDNA Clones for GCs and GCAPs.
To determine the carp GC and GCAP sequences, we synthesized degenerated primers based on the amino acid sequence conserved among these teleost proteins (Table S1) and screened the carp retinal cDNA library. The nucleotide sequences were determined with an ABI PRISM 3100 DNA sequencer (Applied Biosystems).
Measurement of Expression Levels of GCAP mRNAs with Real-Time RT-PCR.
Real-time RT-PCR was performed as described (33) by using an ABI PRISM 7300 (Applied Biosystems). All PCRs were performed in duplicate by using cDNA obtained from 3 animals. Primers used are shown in Table S2.
Expression and Purification of GCAPs.
Expression vectors of carp GCAPs and medaka GCAP1 (a kind gift from F. Tokunaga at Osaka University) were used to transform competent E. coli BL21 (DE3) carrying pBB131, an expression vector of N-myristoyltransferase (kindly provided by J. Gordon at Washington University, St. Louis). Expression of GCAP in E. coli was carried out as described (32), and the proteins were purified by a DEAE-Sepharose CL6B column and a Phenyl Sepharose CL4B column (GE Healthcare Biosciences). See Table S3 for primers and vector used.
Preparation of Polyclonal Antisera and Quantification of GCs and GCAPs by Immunoblot.
Anti-GC-R1 and GC-R2 antiserum were raised in mice against the GST-fused C-terminal peptides of GC-R1 and GC-R2, and anti-GC-C antiserum was raised in a rabbit against a GC-C C-terminal peptide. Anti-GC-C specific antibody was obtained by further affinity-purification with the GC-C peptide. Anti-GCAP1, GCAP2, GCAP3, and GCAP5 antiserum were raised against recombinant medaka GCAP1, carp GCAP2, carp GCAP3, and carp GCAP5 in mice, respectively.
GCs and GCAPs were quantified by immunoblot (7) by using recombinant maltose-binding protein (MBP)-fused GC C-terminal peptides (34) (see SI Text) and recombinant GCAP proteins, respectively, as the molar standards.
Measurements of Membrane Currents from tROS and tCOS Preparations.
The membrane current of truncated preparations of a frog ROS or a carp red COS was measured after perfusion with exogenous 1 mM cGMP or 1 mM GTP as described (35). For a stable current measurement in tCOS, suction electrodes were made so that the inner diameter of the electrode became smaller gradually along the long axis from the electrode tip.
Supplementary Material
Acknowledgments.
We thank Mr. N. Hanaki and Dr. Y. Shimauchi-Matsukawa for their contribution to the early stage of this study. This work was supported by Japan Society for the Promotion of Science Grants 20370060 (to S.K.) and 20700350 (S.T.), the Human Frontier Science Program (S.K.), and the Naito Foundation (S.T.).
Footnotes
The authors declare no conflict of interest.
This article is a PNAS Direct Submission.
Data deposition: The sequences reported in this paper have been deposited in the GenBank database (accession nos. AB469894, AB469895, AB469896, AB469897, AB469898, AB469899, AB469900, AB469901, and AB469902).
This article contains supporting information online at www.pnas.org/cgi/content/full/0812781106/DCSupplemental.
References
- 1.Burkhardt DA. Light adaptation and photopigment bleaching in cone photoreceptors in situ in the retina of the turtle. J Neurosci. 1994;14:1091–1105. doi: 10.1523/JNEUROSCI.14-03-01091.1994. [DOI] [PMC free article] [PubMed] [Google Scholar]
- 2.Baylor DA. Photoreceptor signals and vision. Invest Ophthalmol Visual Sci. 1987;28:34–49. [PubMed] [Google Scholar]
- 3.Fu Y, Yau K-W. Phototransduction in mouse rods and cones. Eur J Physiol. 2007;454:805–819. doi: 10.1007/s00424-006-0194-y. [DOI] [PMC free article] [PubMed] [Google Scholar]
- 4.Pugh EN, Jr, Lamb TD. Amplification and kinetics of the activation steps in phototransduction. Biochim Biophys Acta. 1993;1141:111–149. doi: 10.1016/0005-2728(93)90038-h. [DOI] [PubMed] [Google Scholar]
- 5.Kawamura S, Tachibanaki S. Rod and cone photoreceptors: Molecular basis of the difference in their physiology. Comp Biochem Physiol A. 2008;150:369–377. doi: 10.1016/j.cbpa.2008.04.600. [DOI] [PubMed] [Google Scholar]
- 6.Tachibanaki S, Tsushima S, Kawamura S. Low amplification and fast visual pigment phosphorylation as mechanisms characterizing cone photoresponses. Proc Natl Acad Sci USA. 2001;98:14044–14049. doi: 10.1073/pnas.241396898. [DOI] [PMC free article] [PubMed] [Google Scholar]
- 7.Tachibanaki S, et al. Highly effective phosphorylation by G protein-coupled receptor kinase 7 of light-activated visual pigment in cones. Proc Natl Acad Sci USA. 2005;102:9329–9334. doi: 10.1073/pnas.0501875102. [DOI] [PMC free article] [PubMed] [Google Scholar]
- 8.Miyazono S, Shimauchi-Matsukawa Y, Tachibanaki S, Kawamura S. Highly efficient retinal metabolism in cones. Proc Natl Acad Sci USA. 2008;105:16051–16056. doi: 10.1073/pnas.0806593105. [DOI] [PMC free article] [PubMed] [Google Scholar]
- 9.Koch K-W, Stryer L. Highly cooperative feedback control of retinal rod guanylate cyclase by calcium ions. Nature. 1988;334:64–66. doi: 10.1038/334064a0. [DOI] [PubMed] [Google Scholar]
- 10.Dizhoor AM, et al. The human photoreceptor membrane guanylyl cyclase, RetGC, is present in outer segments and is regulated by calcium and a soluble activator. Neuron. 1994;12:1345–1352. doi: 10.1016/0896-6273(94)90449-9. [DOI] [PubMed] [Google Scholar]
- 11.Gorczyca WA, Gray-Keller MP, Detwiler PB, Palczewski K. Purification and physiological evaluation of a guanylate cyclase activating protein from retinal rods. Proc Natl Acad Sci USA. 1994;91:4014–4018. doi: 10.1073/pnas.91.9.4014. [DOI] [PMC free article] [PubMed] [Google Scholar]
- 12.Mendez A, et al. Role of guanylate cyclase-activating proteins (GCAPs) in setting the flash sensitivity of rod photoreceptors. Proc Natl Acad Sci USA. 2001;98:9948–9953. doi: 10.1073/pnas.171308998. [DOI] [PMC free article] [PubMed] [Google Scholar]
- 13.Harosi FI. Absorption spectra and linear dichroism of some amphibian photoreceptors. J Gen Physiol. 1975;66:357–382. doi: 10.1085/jgp.66.3.357. [DOI] [PMC free article] [PubMed] [Google Scholar]
- 14.Seimiya M, Kusakabe T, Suzuki N. Primary structure and differential gene expression of three membrane forms of guanylyl cyclase found in the eye of the teleost Oryzias latipes. J Biol Chem. 1997;272:23407–23417. doi: 10.1074/jbc.272.37.23407. [DOI] [PubMed] [Google Scholar]
- 15.Hisatomi O, et al. Three kinds of guanylate cyclase expressed in medaka photoreceptor cells in both retina and pineal organ. Biochem Biophys Res Commun. 1999;255:216–220. doi: 10.1006/bbrc.1999.0165. [DOI] [PubMed] [Google Scholar]
- 16.Haire SE, et al. Light-driven cone arrestin translocation in cones of postnatal guanylate cyclase-1 knockout mouse retina treated with AAV-GC1. Invest Ophthalmol Visual Sci. 2006;47:3745–3753. doi: 10.1167/iovs.06-0086. [DOI] [PMC free article] [PubMed] [Google Scholar]
- 17.Shimauchi-Matsukawa Y, Aman Y, Tachibanaki S, Kawamura S. Identification of differentially expressed genes in carp rods and cones. Mol Vis. 2008;14:358–369. [PMC free article] [PubMed] [Google Scholar]
- 18.Imanishi Y, et al. Characterization of retinal guanylate cyclase-activating protein 3 (GCAP3) from zebrafish to man. Eur J Neurosci. 2002;15:63–78. doi: 10.1046/j.0953-816x.2001.01835.x. [DOI] [PMC free article] [PubMed] [Google Scholar]
- 19.Imanishi Y, et al. Diversity of guanylate cyclase-activating proteins (GCAPs) in teleost fish: Characterization of three novel GCAPs (GCAP4, GCAP5, GCAP7) from zebrafish (Danio rerio) and prediction of eight GCAPs (GCAP1–8) in pufferfish (Fugu rubripes) J Mol Evol. 2004;59:204–217. doi: 10.1007/s00239-004-2614-y. [DOI] [PMC free article] [PubMed] [Google Scholar]
- 20.Kawamura S, Murakami M. Regulation of cGMP levels by guanylate cyclase in truncated frog rod outer segments. J Gen Physiol. 1989;94:649–668. doi: 10.1085/jgp.94.4.649. [DOI] [PMC free article] [PubMed] [Google Scholar]
- 21.Nakatani K, Koutalos Y, Yau K-W. Ca2+ modulation of the cGMP-gated channel of bullfrog retinal rod photoreceptors. J Physiol (London) 1995;484:69–79. doi: 10.1113/jphysiol.1995.sp020648. [DOI] [PMC free article] [PubMed] [Google Scholar]
- 22.Sagoo MS, Lagnado L. The action of cytoplasmic calcium on the cGMP-activated channel in salamander rod photoreceptors. J Physiol (London) 1996;497:309–319. doi: 10.1113/jphysiol.1996.sp021770. [DOI] [PMC free article] [PubMed] [Google Scholar]
- 23.Haynes L, Yau K-W. Cyclic GMP-sensitive conductance in outer segment membrane of catfish cones. Nature. 1985;317:61–64. doi: 10.1038/317061a0. [DOI] [PubMed] [Google Scholar]
- 24.Picones A, Korenbrot JI. Analysis of fluctuations in the cGMP-dependent currents of cone photoreceptor outer segments. Biophys J. 1994;66:360–365. doi: 10.1016/s0006-3495(94)80785-4. [DOI] [PMC free article] [PubMed] [Google Scholar]
- 25.Koutalos Y, Nakatani K, Tamura T, Yau K-W. Characterization of guanylate cyclase activity in single retinal rod outer segments. J Gen Physiol. 1995;106:863–890. doi: 10.1085/jgp.106.5.863. [DOI] [PMC free article] [PubMed] [Google Scholar]
- 26.Koch KW. Target recognition of guanylate cyclase by guanylate cyclase-activating proteins. Adv Exp Med Biol. 2002;514:349–360. doi: 10.1007/978-1-4615-0121-3_21. [DOI] [PubMed] [Google Scholar]
- 27.Olshevskaya EV, Ermilov AN, Dizhoor AM. Dimerization of guanylyl cyclase-activating protein and a mechanism of guanylyl cyclase activation. J Biol Chem. 1999;274:25583–25587. doi: 10.1074/jbc.274.36.25583. [DOI] [PubMed] [Google Scholar]
- 28.Sokal I, et al. Calcium-sensitive regions of GCAP1 as observed by chemical modifications, fluorescence, and EPR spectroscopies. J Biol Chem. 2001;276:43361–43373. doi: 10.1074/jbc.M103614200. [DOI] [PMC free article] [PubMed] [Google Scholar]
- 29.Rieke F, Baylor DA. Origin and functional impact of dark noise in retinal cones. Neuron. 2000;26:181–186. doi: 10.1016/s0896-6273(00)81148-4. [DOI] [PubMed] [Google Scholar]
- 30.Sakurai K, et al. Physiological properties of rod photoreceptor cells in green-sensitive cone pigment knockin mice. J Gen Physiol. 2007;130:21–39. doi: 10.1085/jgp.200609729. [DOI] [PMC free article] [PubMed] [Google Scholar]
- 31.Rieke F, Baylor DA. Molecular origin of continuous dark noise in rod photoreceptors. Biophys J. 1996;71:2553–2572. doi: 10.1016/S0006-3495(96)79448-1. [DOI] [PMC free article] [PubMed] [Google Scholar]
- 32.Hurley JB, Dizhoor AM. Heterologous expression and assays for photoreceptor guanylyl cyclases and guanylyl cyclase-activating proteins. Methods Enzymol. 2000;315:708–717. doi: 10.1016/s0076-6879(00)15876-8. [DOI] [PubMed] [Google Scholar]
- 33.Shimauchi-Matsukawa Y, Aman Y, Tachibanaki S, Kawamura S. Isolation and characterization of visual pigment kinase-related genes in carp retina: Polyphyly in GRK1 subtypes, GRK1A and 1B. Mol Vis. 2005;11:1220–1228. [PubMed] [Google Scholar]
- 34.Helten A, Säftel W, Koch KW. Expression level and activity profile of membrane-bound guanylate cyclase type 2 in rod outer segments. J Neurochem. 2007;103:1439–1446. doi: 10.1111/j.1471-4159.2007.04923.x. [DOI] [PubMed] [Google Scholar]
- 35.Kawamura S, Murakami M. Calcium-dependent regulation of cyclic GMP phosphodiesterase by a protein from frog retinal rods. Nature. 1991;349:420–423. doi: 10.1038/349420a0. [DOI] [PubMed] [Google Scholar]
Associated Data
This section collects any data citations, data availability statements, or supplementary materials included in this article.