

Abstract
The CHARMM-GUI Membrane Builder (http://www.charmm-gui.org/input/membrane), an intuitive, straightforward, web-based graphical user interface, was expanded to automate the building process of heterogeneous lipid bilayers, with or without a protein and with support for up to 32 different lipid types. The efficacy of these new features was tested by building and simulating lipid bilayers that resemble yeast membranes, composed of cholesterol, dipalmitoylphosphatidylcholine, dioleoylphosphatidylcholine, palmitoyloleoylphosphatidylethanolamine, palmitoyloleoylphosphatidylamine, and palmitoyloleoylphosphatidylserine. Four membranes with varying concentrations of cholesterol and phospholipids were simulated, for a total of 170 ns at 303.15 K. Unsaturated phospholipid chain concentration had the largest influence on membrane properties, such as average lipid surface area, density profiles, deuterium order parameters, and cholesterol tilt angle. Simulations with a high concentration of unsaturated chains (73%, membraneunsat) resulted in a significant increase in lipid surface area and a decrease in deuterium order parameters, compared with membranes with a high concentration of saturated chains (60–63%, membranesat). The average tilt angle of cholesterol with respect to bilayer normal was largest, and the distribution was significantly broader for membraneunsat. Moreover, short-lived cholesterol orientations parallel to the membrane surface existed only for membraneunsat. The membranesat simulations were in a liquid-ordered state, and agree with similar experimental cholesterol-containing membranes.
Introduction
Studying biological phenomena related to lipid membranes or membrane proteins in atomic detail has been of great interest to computational biophysicists, and there has been steady progress in molecular dynamics (MD) simulation studies of lipid membranes and membrane-associated proteins and peptides (1–7). MD simulations are particularly useful in such systems because they can provide the dynamics and energetics of membrane-associated proteins or peptides at the atomic level, which is generally hard to obtain from experiments. Originally, MD simulations of membranes consisted mainly of pure lipid bilayers (8–10), but have progressed to the point where bilayers may now contain sterols, such as cholesterol (11–13), and two or three phospholipids (3,14,15). Computing resources are certainly at a stage where researchers can study more realistic membranes containing five or more phospholipids. However, the complexity of building such realistic and heterogeneous membranes makes this a considerable challenge.
To simplify and automate the building process of protein/membrane complex systems for MD simulations, we developed a graphical user interface (GUI), Membrane Builder (16), available at the CHARMM-GUI website (http://www.charmm-gui.org) (17) that is a superset of a GUI for the biomolecular simulation program CHARMM (18). Using Membrane Builder, a user can upload a membrane protein structure, or download from a database and choose a certain lipid type to generate a realistically packed (homogeneous) lipid bilayer around the protein. The complicated process of building protein/membrane systems can be dramatically simplified by automating the process and providing an intuitive, straightforward user interface.
It is well-known that more than one kind of lipid molecule forms a lipid membrane, and the organization and composition of lipid molecules are very important for a membrane's biological functions, which range from membrane trafficking to signal transduction (19–21). Moreover, it was reported that for some proteins, the heterogeneity of a membrane is particularly important for protein function (2,20,22). Not surprisingly, it becomes more difficult to build a heterogeneous membrane with different lipid compositions for MD simulations. This often requires modification of existing lipid membranes by changing individual lipid molecules to different types of lipids at desired concentrations. To address this difficulty, we extended Membrane Builder to incorporate the generation option of heterogeneous lipid bilayers. The lipids available for bilayer generation are numerous (Supporting Material, Table S1), and the interface allows a user to select more than one kind of lipid to build membranes of different compositions. In addition to the protein/membrane system, a user can now generate a lipid bilayer system without proteins.
Here, we describe the step-by-step procedure for using Membrane Builder to generate a heterogeneous mixed membrane. We then demonstrate Membrane Builder's efficacy using MD simulations of yeast-like membranes (23), which are composed of six different lipid types: cholesterol, DPPC (dipalmitoylphosphatidylcholine), DOPC (dioleoylphosphatidylcholine), POPE (palmitoyloleoylphosphatidylethanolamine), POPA (palmitoyloleoylphosphatidylamine), and POPS (palmitoyloleoylphosphatidylserine). To our knowledge, this is the first MD simulation of a membrane representative of a true yeast membrane. Moreover, most membranes that are reported in the literature to represent a single-celled organism or mammalian membrane typically involve just two phospholipids and cholesterol (3,14,15). It was our aim to consider the high diversity of phospholipids in yeast membranes, and to determine their influence on the various structural and dynamic properties of membranes. Such simulations also help provide more realistic initial lipid areas in Membrane Builder, depending on concentrations of saturated and unsaturated phospholipids as well as cholesterol, which will greatly reduce the equilibration time of heterogeneous mixed membranes.
Materials and Methods
General protein/membrane complex building process in Membrane Builder
Because the overall building process of a protein/membrane system remains the same as described previously (16), we briefly describe the step-by-step building procedure and emphasize its new features. This building procedure consists of six steps for the protein/membrane complex (Fig. S1), where each step is designed to incorporate user-specified parameters through a web browser and generate/execute CHARMM input files. For a lipid bilayer alone, the building procedure starts with the size-determination step (Fig. S1, step 3). Individual input and output files or archives of the entire files from each step are available for downloading and editing. An online tutorial (http://www.charmm-gui.org/tutorial/membrane) can help users understand the overall process.
Step 1: Read protein structure
The building process of a protein/membrane system starts with reading a protein structure into CHARMM. Users can upload their own protein structure, or specify a Protein Data Bank (PDB) entry identification and a database to download the PDB file. Because protein structures from the OPM (Orientations of Proteins in Membranes) database (24) are preoriented with respect to membrane normal (the Z axis by definition), the use of the OPM database is recommended over the PDB database (25) in Membrane Builder.
Step 2: Orient protein
Membrane Builder defines the Z axis as membrane normal, and Z = 0 as the center of the membrane bilayer. Thus, the protein structure must be aligned along the Z axis, and its hydrophobic region needs to be placed around Z = 0. Detailed options to assist with the orientation of the protein and the pore-water generation are described in Jo et al. (16).
Step 3: Determine system size
This is a critical step to determine the system size, based on a number of user-specified parameters such as lipid types, number of lipids in the bilayer membrane, system shape, and water thickness on the top and bottom of the system. In the case of generating a lipid bilayer alone, this will be the initial step. The option for generating a heterogeneous lipid bilayer is added on top of the homogeneous lipid bilayer option, to avoid any confusion between the previous and the new interface. However, heterogeneous lipid bilayer generation is a general way of building the bilayer membrane, and can be used to generate a homogeneous lipid bilayer by selecting only one lipid type. Because the generation of a homogeneous lipid bilayer was described in our previous study (16), only the new procedures for heterogeneous lipid bilayer generation are described here. Thirty-two lipid molecules are available in Membrane Builder (Table S1). Because the surface area of a lipid type is directly related to the system size calculation, having an accurate value of the surface area is important. Although experimental lipid surface areas are available for DLPC (dilauroylphosphatidylcholine), DMPC (dimyristoylphosphatidylchone), DOPC, DPPC, POPC, and stearoyl-containing membranes (see references in Table S1 and Eldho et al. (26)), the areas of many lipid molecules are unknown. Therefore, we made initial guesses as adopted from the known surface area of a lipid by comparing the headgroup (Table S1), or as based on MD simulations (DAPC) (27). A user can adjust the lipid area if necessary.
First, to determine bilayer size in XY, a user can freely choose a ratio between different lipid types, or explicitly define the number of lipids. If a ratio of different lipid types is specified, then the system size is determined by the user's initial guess about XY lengths. If a user specifies the number of lipid molecules in a bilayer, the system size in XY is determined by a ratio of the XY dimension. It is recommended to have the same XY lengths, unless users have specific reasons. Because a membrane is allowed to have different types and amounts of lipid molecules for the lower and upper leaflets, the resulting lipid bilayer probably has a different system size in XY for each leaflet. To avoid such situations, proceeding to the next step is not allowed until the difference in area of each leaflet is less than the smallest surface area among the lipid molecules used for the lipid bilayer.
Second, the size along the Z axis is determined by specifying the thickness of bulk water from the protein extent along Z. In the case of some membrane proteins or peptides that do not span the bilayer, the size along Z is determined by the specified water thickness from Z = 20 Å or Z = −20 Å, i.e., approximately from the lipid headgroup. In the case of membranes without proteins, users can choose the per-lipid hydration number option for the water layer, which defines the total number of water molecules by multiplying the number of lipids and the hydration number. After the system size is defined, Membrane Builder provides a detailed summary of the system size and a model bilayer system, using lipid-like pseudoatoms (step3_packing.pdb). This model protein/membrane system can provide an idea about the system size and initial lipid distribution. If the size is smaller or larger than expected, users can go back to the previous step and adjust parameters as needed.
Step 4: Build components
In this step, components of the system such as lipid bilayer, bulk water, and ions are generated. If pore water was generated in step 2, the user can refine the components in this step to ensure that no water molecules are left outside the protein in the membrane hydrophobic core region (see Pore Water Generation in Jo et al. (16)). To make the system neutral for long-range electrostatic interactions using the particle-mesh-Ewald method (28), Membrane Builder generates an appropriate number of ions, depending on the user-specified ion concentration. The initial configuration of ions is then determined through Monte Carlo simulations using a primitive model, i.e., van der Waals and scaled Coulombic interactions.
A heterogeneous lipid bilayer is generated by the replacement method originally developed by Woolf and Roux (29,30), and further optimized in our previous study (16). In general, the replacement method uses lipid-like pseudoatoms to generate lipid packing around a protein, and replaces these pseudoatoms with lipid molecules. We use a single-type pseudoatom with an atomic radius of 5.4 Å to approximate the headgroups of different lipids. Such spheres provide tight packing and optimal distances between lipid headgroups. Initially, each pseudoatom is randomly distributed on the XY plane at Z = 15 Å and Z = −15 Å, and short dynamics simulations are performed with planar harmonic restraints to maintain the pseudoatoms on each plane. If there is a protein, then its coordinates are fixed. This model bilayer is generated at the end of step 3 (step3_packing.pdb). In step 4, each pseudoatom is sequentially selected, and its XY coordinates, together with the Zp value (phosphate position or O3 position for cholesterol in Table S1), are used to place the headgroup of a randomly selected lipid molecule from the corresponding lipid structural library. A structural library of each lipid molecule that consists of 2000 different conformations was generated from homogeneous or heterogeneous membrane simulations (see Materials and Methods in Jo et al. (16) for lipid library generation), and is freely available in the CHARMM-GUI Archive (http://www.charmm-gui.org/archive/lipid). The process uses a different initial random seed number, and thus will generate a different lipid bilayer conformation each time.
Steps 5 and 6: Assemble components and equilibrate the system
Each component that was generated in the previous step is assembled in step 5. The user must take a close look at the system and verify whether the system has been built as intended. Because of the significant computing resources required for system equilibration, Membrane Builder does not provide the equilibrated structure. Instead, Membrane Builder provides six consecutive CHARMM input files for system equilibration and production inputs (see Jo et al. (16) for the detailed equilibration process).
Resolving bad contacts
The replacement method is a general, easy approach for incorporating many different lipid molecules. However, it is inevitable that bad contacts between 1) protein/lipid and 2) lipid/lipid may occur. 1) Distance is a good measure for detecting protein/lipid bad contacts. If a randomly selected lipid molecule has a contact distance of <1.2 Å with a protein, the lipid molecule will be replaced with another lipid molecule until the criterion is satisfied. 2) In general, lipid/lipid bad contacts are easily relieved during minimization. However, bad contacts between cholesterol and other types of lipid molecules may become severe and cannot be removed through simple minimization. For example, a lipid tail could penetrate a cholesterol ring, resulting in abnormal bond lengths in the ring during minimization and dynamics. To detect and resolve such bad contacts reliably, we incorporated another process after the generation of the lipid bilayer in step 4. First, the lipid bilayer, including cholesterol molecules, is minimized. If unusually high bond energy is found after minimization because of cholesterol ring penetration by neighboring lipid tails, then the cholesterol molecule is translated away from the membrane along the Z direction and subsequently translated back to its original position, while minimization is performed for the cholesterol and lipid molecules near the cholesterol (all others are fixed). Image atoms are included to detect and resolve bad contacts at the boundaries between the primary system and its images. If the ring penetration cannot be resolved after this step, Membrane Builder will notify the user that the membrane bilayer contains a bad contact that cannot be relieved, and will recommend regenerating the lipid bilayer. Because a different random seed number will be used, the regenerated bilayer may not have bad contacts.
Yeast-like membrane systems
To illustrate the efficacy of the automated heterogeneous Membrane Builder and better understand the structure and dynamics of complex membranes, we constructed and simulated three membrane models called “CPRΔ1”, “CPRΔ1sat”, and “Hypo”. These were based on the CPR1-Δ1 strain of yeast (23). For yeast, most prevalent phospholipids are phosphatidylcholine (PC), phosphatidylethanolamine (PE), phosphatidylinositol (PI), phosphatidic acid (PA), and phosphatidylserine (PS). Because CHARMM force-field parameters are not available for PI, only the other four headgroups were considered. Yeast membranes also contain sterols, primarily ergosterol. However, our model membranes contained cholesterol, which only differs from ergosterol in the saturation of the sterol aliphatic tail and the center six-membered ring. Because singly unsaturated aliphatic chains have the highest concentration in yeast membranes (23), POPA, POPS, POPE, DOPC, DPPC, and cholesterol (Chol) were used to build the yeast-like membranes (see Fig. S2 for the structure of each lipid molecule).
The membrane-only generation option in Membrane Builder was used to build the three yeast models, using the initial system sizes and the ratio of different lipid molecules in Table S2 and 0.15 M KCl. Each system was equilibrated for 0.425 ns, using the equilibration input files generated by Membrane Builder. Finally, the MD trajectories of each system were generated, using the all-atom parameter set of optimized lipid parameters (C27r (31,32)) and the modified TIP3P water model (33). Nosé-Hoover temperature control (34) maintained a constant temperature of 303.15 K, and the Langevin-piston algorithm (35) was used to maintain constant pressure at 1 atm along the Z direction, while the XY area varied, with a constant surface tension of γ = 0 dyn/cm for NPγT (constant pressure, surface tension, and temperature) dynamics. An additional simulation, denoted CPRΔ1sat-γ10, was run at γ = 10 dyn/cm, and its starting structure was the 15-ns snapshot of CPRΔ1sat. The van der Waals interactions were smoothly switched off at 10−12 Å by a force-switching function (36). Long-range electrostatic interactions were calculated using the particle-mesh-Ewald method, with a mesh of 96 × 96 × 96 grid points for fast Fourier transformation, κ = 0.34 Å−1, and a sixth-order B-spline interpolation (28). All bond lengths involving hydrogen atoms were fixed using the SHAKE algorithm (37), enabling the 2-fs time step. The first structures of each system are shown in Fig. S2, and coordinates were saved every picosecond for analysis.
The volume or surface area (SA) of a lipid depends not only on temperature but also on the lipid concentrations (15,38). For these MD simulations, the initial equilibration of 0.425 ns was followed by a period of change in the average SA per lipid (Fig. 1). Consequently, each run required different equilibration periods to reach a stable XY box length. The total simulation time for CPRΔ1, CPRΔ1sat, CPRΔ1sat-γ10, and Hypo beyond the initial equilibration was 20, 35, 25, and 30 ns, respectively. Only the last 10 ns of each run were used in the analysis described below. The final structures of our simulations are shown in Fig. S2.
Figure 1.
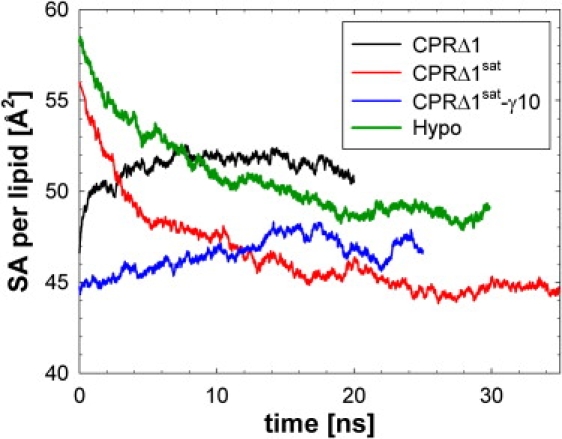
Average surface area (SA) per lipid for four membrane trajectories after a constrained equilibration period of 0.425 ns.
Trajectory analysis
The structural and dynamic properties of the lipids and overall membrane were compared for these four MD simulations. In addition to the average overall SA per lipid (box length-squared divided by number of phospholipids and cholesterol per leaflet), the individual average SA was estimated according to the approach of Pandit et al. (11), with Voronoi tessellation. Three key atoms, located approximately at the hydrophobic/hydrophilic interface, defined a lipid, i.e., the two carbonyl carbon atoms and the carbon that connects the two aliphatic chains to the carbon leading to the phosphate. For Chol, only the hydroxyl oxygen was used. Details of this method can be found elsewhere (11). Delaunay triangulation was used to determine the circumcenters of triangles that resulted in vertices for the Voronoi polygons to obtain lipid areas, and the Quickhull program (39) was used for this geometric calculation. The electron-density profile normal for the interface, ρ(Z), was obtained from an average of all snapshots, following the method of Feller et al. (40). As a measure of chain order, the deuterium order parameters were obtained from simulations using standard equations (31). The orientation of Chol was determined by measuring the angle of the molecule (see Cournia et al. (13)) with respect to bilayer normal. The lateral mean-squared displacement of the lipid center of mass was also calculated in our investigation of lipid dynamics.
Results
Four membrane simulations are analyzed to examine the effects of lipid tail saturation, Chol concentration, and surface tension on various structural and dynamic properties. The CPRΔ1 model is the most yeast-like, and contains a relatively high concentration of unsaturated lipid chains. The influence of tail saturation is studied using the CPRΔ1sat membrane model, which is similar to CPRΔ1 but flips the amount of DPPC and DOPC, so that DPPC is the dominant lipid (Table S2). Simulations with the C27r force field of pure bilayers require a nonzero small surface tension in NPγT or NPAT (constant pressure, area, and temperature) simulations to prevent the overthickening of membranes with most lipids compared with experiments (41–43). Consequently, an additional simulation was run for the CPRΔ1sat membrane model, with an imposed surface tension of 10 dyn/cm (CPRΔ1sat-γ10). Although the optimal surface tension or area is not known for these six component bilayers, this simulation gives a general range of property values that should correspond to the experiments. The fourth membrane model, Hypo, consists of a membrane similar to CPRΔ1sat, but with only 10% Chol on a lipid-only basis.
Surface areas per lipid
The average SA for many pure lipid bilayers is well-known experimentally (44), and the addition of Chol to most membranes results in a reduction of average SA per lipid (38,45). The pure component SAs for lipids were used in the starting structures for the CPRΔ1sat and Hypo MD simulations, which contain 22% and 10% Chol (lipid-only basis), respectively. Because Chol condenses bilayers with lipids in our yeast-model membranes, these two simulations show a decrease in the average SA per lipid (Fig. 1). The decrease in SA per lipid from the pure lipid bilayer can be significant, e.g., the average SA per lipid of DMPC bilayers containing 25% Chol is reduced by 22% compared with pure DMPC bilayers (38). A similar reduction in surface area exists for the CPRΔ1sat simulation containing 22% Chol. The overestimation of the initial SA required a significant amount of time to equilibrate these bilayers, i.e., to reach a converged SA (Fig. 1). Consequently, the initial system size for CPRΔ1 simulation was based on individual SAs that corresponded to the CPRΔ1sat simulation (Table 1) and required only 10 ns of equilibration.
Table 1.
Average lipid surface areas, given as Å2/lipid (± SE)
| Model | All | POPA | POPS | POPE | DOPC | DPPC | Chol |
|---|---|---|---|---|---|---|---|
| CPRΔ1 | 51.6 ± 0.2 | 56.4 ± 0.6 | 53.9 ± 1.0 | 57.8 ± 0.4 | 58.9 ± 0.3 | 55.6 ± 0.5 | 30.7 ± 0.2 |
| CPRΔ1sat | 44.6 ± 0.1 | 47.5 ± 0.4 | 51.6 ± 0.3 | 50.4 ± 0.1 | 51.2 ± 0.8 | 49.4 ± 0.1 | 26.7 ± 0.2 |
| CPRΔ1sat-γ10 | 47.2 ± 0.3 | 48.6 ± 0.8 | 52.5 ± 0.7 | 52.6 ± 0.2 | 57.1 ± 0.9 | 51.4 ± 0.1 | 29.9 ± 0.2 |
| Hypo | 48.8 ± 0.2 | 53.7 ± 0.7 | 50.6 ± 0.5 | 51.8 ± 0.3 | 55.3 ± 0.5 | 49.4 ± 0.1 | 27.0 ± 0.4 |
The overall average SA per lipid follows the expected trend, based on the concentration of saturated lipid chains and Chol (Table 1): CPRΔ1, CPRΔ1sat-γ10, Hypo, and CPRΔ1sat are in order of decreasing SA per lipid. In general, this was also the case for the six lipids in these membranes (Table 1). The increase in surface tension to 10 dyn/cm results in a 2.6-Å2/lipid increase compared with CPRΔ1sat. Of the five phospholipids, DOPC and DPPC are experimentally well-characterized as pure bilayers (44,46). The SA for liquid crystalline DOPC at 303.15 K is 67.4 ± 1.0 Å2/lipid (46), and is reduced by over 10 Å2 for yeast-like membranes (Table 1). The SA for the liquid crystalline (323.15 K) (46) and gel (293.15 K) (44) phases of DPPC are 63.0 ± 1.0 and 47.9 ± 1.0 Å2/lipid, respectively. For MD simulations with the highest concentrations of DPPC, the SA for this lipid is 1.5–3.5 Å2 larger than the gel phase. Moreover, the change in Chol concentration between the CPRΔ1sat and Hypo membranes has no effect on the average DPPC SA.
Electron-density profiles
The SA of a lipid gives the average spatial extent of a lipid in the XY plane, but electron-density profiles (EDPs) along the Z axis (membrane normal) can give information such as membrane thickness, location of molecules within a membrane, and leaflet overlap. The total electron density of a bilayer has three distinct regions: bulk water density (|Z| > 30), phospholipid headgroup (|Z| ∼ 22Å), and a low-density trough (Z = 0). The EDP appears similar for all simulations (Fig. 2). However, the largest difference occurs between simulations with ∼40% DPPC and ∼10% DOPC (CPRΔ1sat, CPRΔ1sat-γ10, and Hypo), and with ∼40% DOPC and ∼10% DPPC (CPRΔ1). The density at the center of the bilayer is 10% higher for CPRΔ1, which suggests that the increase in chain disorder results in an increase in chain interdigitation. This simulation also has the smallest membrane thickness (DHH) of 43.0 ± 0.1 Å, as measured by the distance between the maximum density of each leaflet. The simulations with a higher concentration of saturated chains have a DHH of 45.2 ± 0.8 Å (Hypo), 45.8 ± 0.6 Å (CPRΔ1sat-γ10), and 46.8 ± 0.6 Å (CPRΔ1sat). Increasing the surface tension (CPRΔ1sat-γ10) and decreasing the Chol concentration (Hypo) both have a thinning effect on DHH, consistent with previous simulations (47) and experiments (38).
Figure 2.
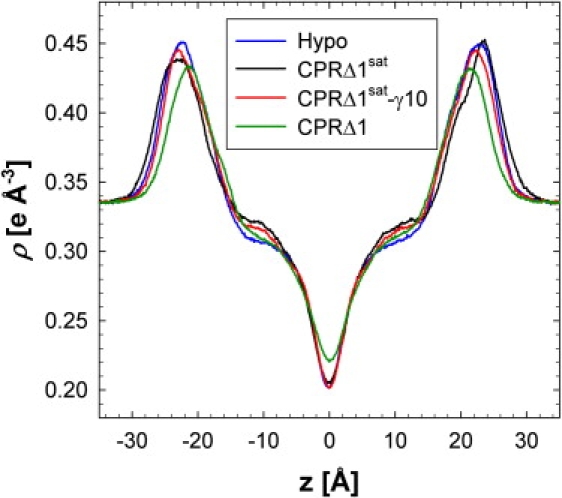
Average electron-density profiles (for last 10 ns of trajectory).
Individual phospholipid densities are compared in Fig. 3 for CPRΔ1 (these are scaled densities, for easy comparison of the five lipids). Clearly, DOPC has the largest density at the center of the bilayer, and is the reason why the CPRΔ1 membrane has the highest density for the methyl trough (Z = 0). POPS has the broadest headgroup distribution and the highest preference for the bulk water phase. The maximum density of POPA, which is devoid of a choline or serine, is closest to the center of the bilayer (Z = 16.5 Å). In general, the headgroup determines the location of the maximum density for each lipid where PS is farthest from the center of the bilayer, followed by PC, PE, and PA (Fig. 3).
Figure 3.
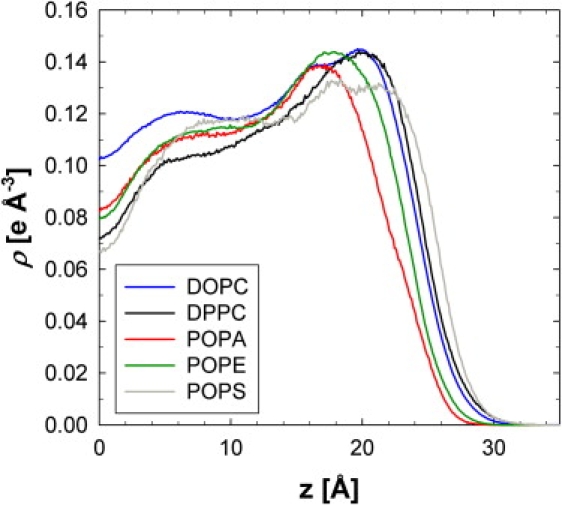
Scaled and symmetrized electron density of five phospholipids for CPRΔ1 simulation. For comparison, densities are scaled to amount of DOPC in this simulation.
The EDP for Chol has a similar grouping to that of the total EDP (Fig. S3). The highest electron density (center of the aromatic rings) is grouped by the simulations with the highest phospholipid chain saturation (Z ∼ ±11.5 Å) and the Hypo simulation (Z ∼ ±10.7 Å). The Chol molecules in the Hypo simulation tend to penetrate deeper into the opposing leaflet. The more fluid-like nature of this bilayer results in more evenly distributed molecules.
Lipid aliphatic chain-ordering
The deuterium order parameters (|SCD|) for the aliphatic chain measure the average angle of a C-H vector with respect to bilayer normal. As the average |SCD| increases, the amount of chain order also increases. Therefore, lipids in the liquid-disordered phase (Lα for DPPC) have lower-order parameters than those in the liquid-ordered phase (Lβ for DPPC, gel). Cholesterol is well-known to induce chain order for many phospholipids, such as those with saturated chains (48,49). This behavior is also evident in our simulations (Fig. 4). CPRΔ1sat has the highest order, and is similar to DMPC with 30% Chol (49) and DPPC with 50% Chol (48). The effect of adding more Chol, from 25% to 50%, exerts only a minimal change in ordering (a slight increase near the headgroup) (48), and suggests that CPRΔ1sat is in good agreement with the experiment. The change in |SCD| is nearly identical when the amount of Chol is reduced or there is an imposed surface tension. Based on these results, DPPC is likely to be in a liquid-ordered state for the three simulations (CPRΔ1sat, CPRΔ1sat-γ10, and Hypo), and the chain order is significantly higher than the liquid-disordered state at 314.15 K (Fig. 4). This is likely because of the presence of Chol, and because the simulation temperature is well below the liquid-ordered/disordered transition point for a pure DPPC bilayer.
Figure 4.
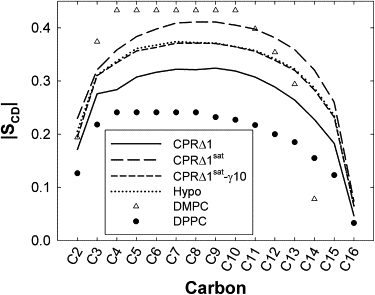
Calculated aliphatic chain deuterium order parameters (|SCD|) for chain 2 of DPPC, compared with measured values of DPPC (41°C) and DMPC with 30 mol % of cholesterol at 298 K (49). Standard error for calculated values of |SCD| is 0.01.
The |SCD| for DPPC is significantly lower for membranes with an increased amount of lipids with unsaturated chains. The |SCD| for CPRΔ1 lies between the liquid-ordered/disordered states (Fig. 4). Although there is certainly more chain order than in a pure Lα DPPC bilayer, the ordering is not as high as in the liquid-ordered state. The average |SCD| for each phospholipid in CPRΔ1 is shown in Fig. S4. The values of |SCD| for saturated chains past the eighth carbon position (C8) are similar and independent of the headgroup. However, the largest deviations between these lipids exist near the lipid headgroup for chain 1 (Fig. S4, top), where POPS has the highest order, and POPE has the lowest order. DOPC is the only lipid in these membranes with two unsaturated chains. The result is a sharp decrease in order at the double bond between C9 and C10. The values of |SCD| for phospholipids with chain 2 unsaturated are similar (Fig. S4, bottom), and are statistically identical for C9 and C10. POPS has the highest |SCD| at C14, and DOPC the lowest.
Dynamics of lipids
Based on the |SCD| and average lipid areas, the lipids are in a condensed state compared with the liquid-disordered state, and are likely to have low diffusion constants. The mean-squared displacement for DPPC is shown in Fig. S5 for CPRΔ1, and was similar for all simulations. However, there appears to be a finite size effect in these membranes, resulting in an overall leaflet motion that dominates individual lipid motions. This is known to occur for membranes of 36 lipids per leaflet with Lα DPPC, but to disappear with larger membranes (144 lipids per leaflet) (50). Although our yeast-like membranes are considerably larger than 36 lipids per leaflet, this finite size effect exists, and likely occurred because our simulations were in a liquid-ordered or liquid-ordered-like state. Therefore, a diffusion constant for lipids in these membranes cannot be obtained without larger simulations, and is beyond the scope of this study.
Cholesterol tilt angle
The orientation of Chol in the bilayer with respect to membrane normal was determined using the tilt angle, as defined by the rings of the sterol (Fig. 5). The mean values for this angle are 12.4° (CPRΔ1sat), 15.3° (CPRΔ1sat-γ10), 15.3° (Hypo), and 18.6° (CPRΔ1). A surface tension of 10 dyn/cm has the same effect as decreasing the Chol concentration. The average tilt angle was slightly higher than in a simulation by Cournia et al. (13), but was consistent with their DPPC/Chol membranes at a higher concentration of Chol (40%). These tilt angles are consistent with 2H NMR results that reported a 15–24° tilt angle for Chol in PE and PC membranes (51).
Figure 5.
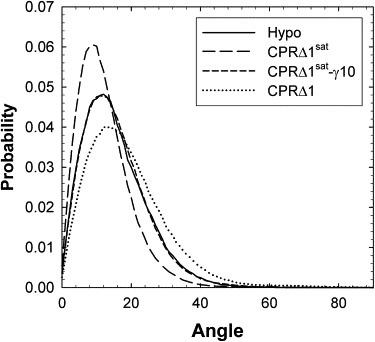
Probability distribution for angle of cholesterol (defined by the C3–C17 (13) that connects two opposite portions of the sterol ring) with respect to bilayer normal.
Although the mode of these distributions changes proportionally with the mean, the larger effect on Chol and phospholipid chain saturation is in the breadth of the tilt angle distributions. CPRΔ1sat has a narrow tilt angle distribution, and a decrease in the amount of phospholipid chain saturation results in a significantly broader distribution (CPRΔ1). Moreover, the CPRΔ1 simulation contains low populations of Chol orientations that are essentially parallel to the bilayer surface, when surrounded primarily by DOPC (Fig. 6).
Figure 6.
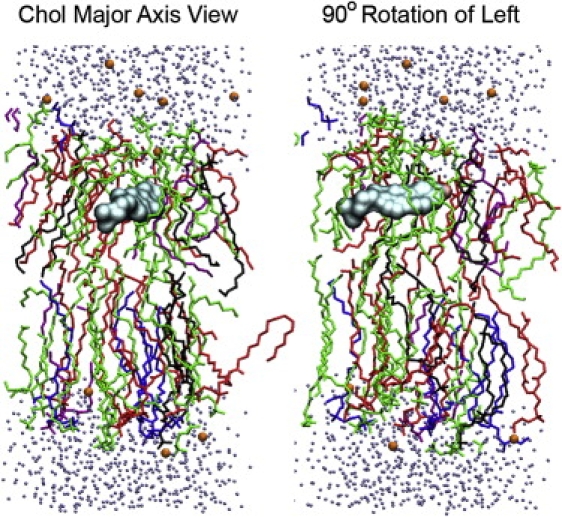
Snapshot from CPRΔ1 at 4 ns, centered on cholesterol (Chol) that is orientated parallel to bilayer surface. Lipids are colored as follows: DOPC (green), DPPC (blue), POPA (black), POPE (red), and POPS (purple).
Discussion
The MD simulations of mixed lipid bilayers typically involve the use of NPT, or equivalently the NP(γ = 0)T ensembles for most force fields except for the CHARMM force field (11,12,52). However, NPT simulations with the CHARMM force field result in significantly thicker membranes and SAs that are small compared with the experiment (41–43). Consequently, most MD simulations of pure lipid bilayers with the CHARMM force field use the NPAT or NPγT ensemble. The use of these two ensembles is supported by the finite size effects of small lipid patches used in these MD simulations (53). A flaccid bilayer should have zero surface tension, but a small patch of this macroscopic bilayer suppresses undulations and may have a finite surface tension. Subsequent theoretical work (54) supports this notion, although this work leads to smaller surface tensions than C27r-based simulations. In addition, the electrostatic potential drop across the lipid bilayer is known to be overestimated with C27r (55). This and an undersaturation of water in the glycerol region of the lipid suggest that the partial charges in C27r may require adjustment. Sonne et al. (56) changed these charges using quantum mechanics, and 20-ns DPPC NPT simulations agree favorably with the experimental surface area. Additional changes in the atomic partial charges to match solvation free energies resulted in NPAT simulations with small and reasonable values of surface tension for several lipids, and will be available in future releases of CHARMM (J. B. Klauda, R. M. Venable, A. D. MacKerell Jr., B. R. Brooks, and R. W. Pastor, unpublished data).
The appropriateness of using the NPγT or NPT ensemble is not the focus of this study, but is our reason for running two CPRΔ1sat simulations at surface tensions of 0 and 10 dyn/cm, especially with C27r. The SA per lipid is typically known for a pure bilayer, and the use of the NPAT or NPγT ensemble works well for CHARMM (43), but for most mixed lipid bilayers, the SA is not available. The effect of a 10-dyn/cm surface tension increases the average SA per lipid by 6% (Table 1), and decreases the deuterium order parameters by 10% (Fig. 4). The values of |SCD| of DPPC are expected to be lower than of DMPC with 30% Chol, and both CPRΔ1sat and CPRΔ1sat-γ10 follow this trend. These results likely indicate bounds to the areas and the |SCD| for this yeast-like membrane.
A change in Chol concentration can influence various properties of a bilayer. For example, Chol is known to condense lipid bilayers, such that the average SA per lipid is reduced compared with a bilayer without Chol (38,45). This same trend is evident in our five-component yeast membranes when CPRΔ1sat (22% Chol) and Hypo (10% Chol) were compared (Fig. 1 and Table 1). There is a 9% decrease in average SA per lipid with a 12% increase in Chol concentration, and consequently the membrane thickness is smaller for Hypo (Fig. 2). This decrease in membrane thickness also decreases the |SCD| of DPPC by 10%. The values of |SCD| of Hypo are nearly identical to those of CPRΔ1sat-γ10, which was likely attributable to an identical DHH (45.2 ± 0.8 Å for Hypo, and 45.8 ± 0.6 Å for CPRΔ1sat-γ10) and a similar average SA per lipid (Table 1). The density at the center of the bilayer is invariant to changes in Chol concentration, which is dominated by the alkane density from the phospholipids and the Chol tails.
A change in concentration of phospholipids with saturated chains has a larger effect on the electron density, order parameters, and Chol orientation compared with a change in Chol concentration. The yeast-like membrane models can be split into two groups, i.e., simulations with a 60–63% (CPRΔ1sat, CPRΔ1sat-γ10, and Hypo) concentration of fully saturated phospholipid chains, and the simulation with a 27% concentration of fully saturated phospholipid chains (CPRΔ1). The simulations with mainly saturated chains have a lower SA per lipid (Table 1). There is a 10% increase in average DPPC SA per lipid when the simulation contains mainly unsaturated phospholipid chains. The EDPs show the largest differences between these two groups. A decrease in chain saturation leads to a decrease in DHH and an increase in density at the center of the bilayer (Fig. 2). There is also a significant decrease in |SCD| of DPPC of up to 20% for the unsaturated chains. Moreover, Chol has an increased probability to tilt away from bilayer normal for the simulation with less chain saturation. Consequently, some Chol can lie parallel to the bilayer surface (Fig. 6), which deviates from the standard orientation that is only slightly tilted with respect to bilayer normal (51). Cholesterol prefers to interact with saturated chain lipids, and experiments (57) and simulations (27) have indicated that polyunsaturated lipids can cause a significant amount of Chol to lie parallel to the bilayer surface. However, for polyunsaturated lipids, these parallel-oriented Chol molecules tend to exist at the center of the bilayer. Although course-grained simulations resulted in such Chol orientations (27), we are, to our knowledge, the first to report a parallel orientation of Chol in an all-atom simulation. These orientations are short-lived in CPRΔ1 (<1 ns), but do occur with different Chol molecules in different leaflets, suggesting that these are rare but real events.
Based on these simulations, the suggested SAs for Membrane Builder were changed to account for phospholipid chain saturation (Table S1). Although users can choose their own estimated SA per lipid, the website will use the areas in Table S1 as defaults if unspecified. For low Chol concentrations (<5%), the pure lipid bilayer areas will be used. If the Chol concentration is >5%, the appropriate estimated areas will be picked from either the saturated or unsaturated columns in Table S1. If the number of saturated chains is equal to that of the unsaturated chains, the saturated column will be used. These estimates should reduce the amount of equilibrium time needed to obtain the SA per lipid of complex membrane mixtures with Chol created by the CHARMM-GUI Membrane Builder. Ultimately, this should be of benefit to a wide range of scientists who simulate complex lipid membranes, both with and without peptides and proteins.
Supporting Material
Five figures, two tables, and references are available at http://www.biophysj.org/biophysj/supplemental/S0006-3495(09)00791-7.
Supporting Material
Acknowledgments
We are grateful to Scott E. Feller for providing the lipid libraries of SAPC, SDPC, SEPC, SOPC, and SPPC.
This work was supported by the University of Kansas (W.I.), the University of Maryland (J.B.K), and the Alfred P. Sloan Research Fellowship (W.I.). Our research was also supported in part by the National Science Foundation (grant OCI-0503992) through TeraGrid resources provided by Purdue University.
Footnotes
Sunhwan Jo and Joseph B. Lim contributed equally to this work.
Contributor Information
Jeffery B. Klauda, Email: jbklauda@umd.edu.
Wonpil Im, Email: wonpil@ku.edu.
References
- 1.Roux B., Schulten K. Computational studies of membrane channels. Structure. 2004;12:1343–1351. doi: 10.1016/j.str.2004.06.013. [DOI] [PubMed] [Google Scholar]
- 2.Lee A.G. How lipids affect the activities of integral membrane proteins. Biochim. Biophys. Acta. 2004;1666:62–87. doi: 10.1016/j.bbamem.2004.05.012. [DOI] [PubMed] [Google Scholar]
- 3.Risselada H.J., Marrink S.J. The molecular face of lipid rafts in model membranes. Proc. Natl. Acad. Sci. USA. 2008;105:17367–17372. doi: 10.1073/pnas.0807527105. [DOI] [PMC free article] [PubMed] [Google Scholar]
- 4.Klauda J.B., Brooks B.R. Sugar binding in lactose permease: anomeric state of a disaccharide influences binding structure. J. Mol. Biol. 2007;367:1523–1534. doi: 10.1016/j.jmb.2007.02.001. [DOI] [PMC free article] [PubMed] [Google Scholar]
- 5.Klauda J.B., Pastor R.W., Brooks B.R., Roberts M.F., Redfield A.G. Rotation of lipids in membranes: MD simulation, 31P spin-lattice relaxation, and rigid-body dynamics. Biophys. J. 2008;94:3074–3083. doi: 10.1529/biophysj.107.121806. [DOI] [PMC free article] [PubMed] [Google Scholar]
- 6.Lee J., Im W. Transmembrane helix tilting: insights from calculating the potential of mean force. Phys. Rev. Lett. 2008;100:018103. doi: 10.1103/PhysRevLett.100.018103. [DOI] [PubMed] [Google Scholar]
- 7.Lee J., Im W. Role of hydrogen bonding and helix-lipid interactions in transmembrane helix association. J. Am. Chem. Soc. 2008;130:6456–6462. doi: 10.1021/ja711239h. [DOI] [PubMed] [Google Scholar]
- 8.Venable R.M., Zhang Y.H., Hardy B.J., Pastor R.W. Molecular-dynamics simulations of a lipid bilayer and of hexadecane—an investigation of membrane fluidity. Science. 1993;262:223–226. doi: 10.1126/science.8211140. [DOI] [PubMed] [Google Scholar]
- 9.Feller S.E. Molecular dynamics simulations of lipid bilayers. Curr. Opin. Colloid Interface Sci. 2000;5:217–223. [Google Scholar]
- 10.Lindahl E., Edholm O. Molecular dynamics simulation of NMR relaxation rates and slow dynamics in lipid bilayers. J. Chem. Phys. 2001;115:4938–4950. [Google Scholar]
- 11.Pandit S.A., Vasudevan S., Chiu S.W., Mashl R.J., Jakobsson E. Sphingomyelin-cholesterol domains in phospholipid membranes: atomistic simulation. Biophys. J. 2004;87:1092–1100. doi: 10.1529/biophysj.104.041939. [DOI] [PMC free article] [PubMed] [Google Scholar]
- 12.Edholm O., Nagle J.F. Areas of molecules in membranes consisting of mixtures. Biophys. J. 2005;89:1827–1832. doi: 10.1529/biophysj.105.064329. [DOI] [PMC free article] [PubMed] [Google Scholar]
- 13.Cournia Z., Ullmann G.M., Smith J.C. Differential effects of cholesterol, ergosterol and lanosterol on a dipalmitoyl phosphatidylcholine membrane: a molecular dynamics simulation study. J. Phys. Chem. B. 2007;111:1786–1801. doi: 10.1021/jp065172i. [DOI] [PubMed] [Google Scholar]
- 14.Pitman M.C., Suits F., Gawrisch K., Feller S.E. Molecular dynamics investigation of dynamical properties of phosphatidylethanolamine lipid bilayers. J. Chem. Phys. 2005;122:244715. doi: 10.1063/1.1899153. [DOI] [PubMed] [Google Scholar]
- 15.Leekumjorn S., Sum A.K. Molecular simulation study of structural and dynamic properties of mixed DPPC/DPPE bilayers. Biophys. J. 2006;90:3951–3965. doi: 10.1529/biophysj.105.076596. [DOI] [PMC free article] [PubMed] [Google Scholar]
- 16.Jo S., Kim T., Im W. Automated builder and database of protein/membrane complexes for molecular dynamics simulations. PLoS ONE. 2007;2:e880. doi: 10.1371/journal.pone.0000880. [DOI] [PMC free article] [PubMed] [Google Scholar]
- 17.Jo S., Kim T., Iyer V.G., Im W. CHARMM-GUI: a web-based graphical user interface for CHARMM. J. Comput. Chem. 2008;29:1859–1865. doi: 10.1002/jcc.20945. [DOI] [PubMed] [Google Scholar]
- 18.Brooks B.R., Bruccoleri R.E., Olafson B.D., States D.J., Swaminathan S. CHARMM: a program for macromolecular energy, minimization, and dynamics calculations. J. Comput. Chem. 1983;4:187–217. [Google Scholar]
- 19.Simons K., Vaz W.L. Model systems, lipid rafts, and cell membranes. Annu. Rev. Biophys. Biomol. Struct. 2004;33:269–295. doi: 10.1146/annurev.biophys.32.110601.141803. [DOI] [PubMed] [Google Scholar]
- 20.Maxfield F.R., Tabas I. Role of cholesterol and lipid organization in disease. Nature. 2005;438:612–621. doi: 10.1038/nature04399. [DOI] [PubMed] [Google Scholar]
- 21.Holowka D., Gosse J.A., Hammond A.T., Han X., Sengupta P. Lipid segregation and IgE receptor signaling: a decade of progress. Biochim. Biophys. Acta. 2005;1746:252–259. doi: 10.1016/j.bbamcr.2005.06.007. [DOI] [PubMed] [Google Scholar]
- 22.Grossfield A., Feller S.E., Pitman M.C. A role for direct interactions in the modulation of rhodopsin by omega-3 polyunsaturated lipids. Proc. Natl. Acad. Sci. USA. 2006;103:4888–4893. doi: 10.1073/pnas.0508352103. [DOI] [PMC free article] [PubMed] [Google Scholar]
- 23.Daum G., Tuller G., Nemec T., Hrastnik C., Balliano G. Systematic analysis of yeast strains with possible defects in lipid metabolism. Yeast. 1999;15:601–614. doi: 10.1002/(SICI)1097-0061(199905)15:7<601::AID-YEA390>3.0.CO;2-N. [DOI] [PubMed] [Google Scholar]
- 24.Lomize M.A., Lomize A.L., Pogozheva I.D., Mosberg H.I. OPM: Orientations of Proteins in Membranes database. Bioinformatics. 2006;22:623–625. doi: 10.1093/bioinformatics/btk023. [DOI] [PubMed] [Google Scholar]
- 25.Berman H.M., Battistuz T., Bhat T.N., Bluhm W.F., Bourne P.E. The Protein Data Bank. Acta Crystallogr. D Biol. Crystallogr. 2002;58:899–907. doi: 10.1107/s0907444902003451. [DOI] [PubMed] [Google Scholar]
- 26.Eldho N.V., Feller S.E., Tristram-Nagle S., Polozov I.V., Gawrisch K. Polyunsaturated docosahexaenoic vs. docosapentaenoic acid differences in lipid matrix properties from the loss of one double bond. J. Am. Chem. Soc. 2003;125:6409–6421. doi: 10.1021/ja029029o. [DOI] [PubMed] [Google Scholar]
- 27.Marrink S.J., deVries A.H., Harroun T.A., Katsaras J., Wassall S.R. Cholesterol shows preference for the interior of polyunsaturated lipid membranes. J. Am. Chem. Soc. 2008;130:10–11. doi: 10.1021/ja076641c. [DOI] [PubMed] [Google Scholar]
- 28.Essmann U., Perera L., Berkowitz M.L., Darden T., Lee H. A smooth particle mesh Ewald method. J. Chem. Phys. 1995;103:8577–8593. [Google Scholar]
- 29.Woolf T.B., Roux B. Structure, energetics, and dynamics of lipid-protein interactions: a molecular dynamics study of the gramicidin A channel in a DMPC bilayer. Proteins. 1996;24:92–114. doi: 10.1002/(SICI)1097-0134(199601)24:1<92::AID-PROT7>3.0.CO;2-Q. [DOI] [PubMed] [Google Scholar]
- 30.Woolf T.B., Roux B. Molecular dynamics simulation of the gramicidin channel in a phospholipid bilayer. Proc. Natl. Acad. Sci. USA. 1994;91:11631–11635. doi: 10.1073/pnas.91.24.11631. [DOI] [PMC free article] [PubMed] [Google Scholar]
- 31.Klauda J.B., Brooks B.R., MacKerell A.D., Venable R.M., Pastor R.W. An ab initio study on the torsional surface of alkanes and its effect on molecular simulations of alkanes and a DPPC bilayer. J. Phys. Chem. B. 2005;109:5300–5311. doi: 10.1021/jp0468096. [DOI] [PubMed] [Google Scholar]
- 32.Klauda J.B., Pastor R.W., Brooks B.R. Adjacent gauche stabilization in linear alkanes: implications for polymer models and conformational analysis. J. Phys. Chem. B. 2005;109:15684–15686. doi: 10.1021/jp0527608. [DOI] [PMC free article] [PubMed] [Google Scholar]
- 33.Jorgensen W.L., Chandrasekhar J., Madura J.D., Impey R.W., Klein M.L. Comparison of simple potential functions for simulating liquid water. J. Chem. Phys. 1983;79:926–935. [Google Scholar]
- 34.Hoover W.G. Canonical dynamics: equilibrium phase-space distributions. Phys. Rev. A. 1985;31:1695–1697. doi: 10.1103/physreva.31.1695. [DOI] [PubMed] [Google Scholar]
- 35.Feller S.E., Zhang Y., Pastor R.W., Brooks B.R. Constant pressure molecular dynamics simulation: the Langevin piston method. J. Chem. Phys. 1995;103:4613. [Google Scholar]
- 36.Steinbach P.J., Brooks B.R. New spherical-cutoff methods for long-range forces in macromolecular simulation. J. Comput. Chem. 1994;15:667–683. [Google Scholar]
- 37.Barth E., Kuczera K., Leimkuhler B., Skeel R.D. Algorithms for constrained molecular dynamics. J. Comput. Chem. 1995;16:1192–1209. [Google Scholar]
- 38.Hung W.C., Lee M.T., Chen F.Y., Huang H.W. The condensing effect of cholesterol in lipid bilayers. Biophys. J. 2007;92:3960–3967. doi: 10.1529/biophysj.106.099234. [DOI] [PMC free article] [PubMed] [Google Scholar]
- 39.Barber C.B., Dobkin D.P., Huhdanpaa H. The Quickhull algorithm for convex hulls. ACM Trans. Math. Softw. 1996;22:469–483. [Google Scholar]
- 40.Feller S.E., Venable R.M., Pastor R.W. Computer simulation of a DPPC phospholipid bilayer: structural changes as a function of molecular surface area. Langmuir. 1997;13:6555–6561. [Google Scholar]
- 41.Benz R.W., Castro-Roman F., Tobias D.J., White S.H. Experimental validation of molecular dynamics simulations of lipid bilayers: a new approach. Biophys. J. 2005;88:805–817. doi: 10.1529/biophysj.104.046821. [DOI] [PMC free article] [PubMed] [Google Scholar]
- 42.Skibinsky A., Venable R.M., Pastor R.W. A molecular dynamics study of the response of lipid bilayers and monolayers to trehalose. Biophys. J. 2005;89:4111–4121. doi: 10.1529/biophysj.105.065953. [DOI] [PMC free article] [PubMed] [Google Scholar]
- 43.Klauda J.B., Kučerka N., Brooks B.R., Pastor R.W., Nagle J.F. Simulation-based methods for interpreting x-ray data from lipid bilayers. Biophys. J. 2006;90:2796–2807. doi: 10.1529/biophysj.105.075697. [DOI] [PMC free article] [PubMed] [Google Scholar]
- 44.Nagle J.F., Tristram-Nagle S. Structure of lipid bilayers. Biochimica et Biophysica Acta. 2000;1469:159–195. doi: 10.1016/s0304-4157(00)00016-2. [DOI] [PMC free article] [PubMed] [Google Scholar]
- 45.McIntosh T.J. Effect of cholesterol on structure of phosphatidylcholine bilayers. Biochim. Biophys. Acta. 1978;513:43–58. doi: 10.1016/0005-2736(78)90110-4. [DOI] [PubMed] [Google Scholar]
- 46.Kucerka N., Nagle J.F., Sachs J.N., Feller S.E., Pencer J. Lipid bilayer structure determined by the simultaneous analysis of neutron and x-ray scattering data. Biophys. J. 2008;95:2356–2367. doi: 10.1529/biophysj.108.132662. [DOI] [PMC free article] [PubMed] [Google Scholar]
- 47.Feller S.E., Pastor R.W. Constant surface tension simulations of lipid bilayers: the sensitivity of surface areas and compressibilities. J. Chem. Phys. 1999;111:1281–1287. [Google Scholar]
- 48.Sankaram M.B., Thompson T.E. Modulation of phospholipid acyl chain order by cholesterol. A solid-state deuterium nuclear magnetic resonance study. Biochemistry. 1990;29:10676–10684. doi: 10.1021/bi00499a015. [DOI] [PubMed] [Google Scholar]
- 49.Douliez J.P., Leonard A., Dufourc E.J. Restatement of order parameters in biomembranes—calculation of C–C bond order parameters from C-D quadrupolar splittings. Biophys. J. 1995;68:1727–1739. doi: 10.1016/S0006-3495(95)80350-4. [DOI] [PMC free article] [PubMed] [Google Scholar]
- 50.Klauda J.B., Brooks B.R., Pastor R.W. Dynamical motions of lipids and a finite size effect in simulations of bilayers. J. Chem. Phys. 2006;125:144710. doi: 10.1063/1.2354486. [DOI] [PMC free article] [PubMed] [Google Scholar]
- 51.Shaikh S.R., Cherezov V., Caffrey M., Soni S.P., LoCascio D. Molecular organization of cholesterol in unsaturated phosphatidylethanolamines: x-ray diffraction and solid state H-2 NMR reveal differences with phosphatidylcholines. J. Am. Chem. Soc. 2006;128:5375–5383. doi: 10.1021/ja057949b. [DOI] [PubMed] [Google Scholar]
- 52.Patra M., Karttunen M., Hyvonen M.T., Falck E., Vattulainen I. Lipid bilayers driven to a wrong lane in molecular dynamics simulations by subtle changes in long-range electrostatic interactions. J. Phys. Chem. B. 2004;108:4485–4494. [Google Scholar]
- 53.Feller S.E., Pastor R.W. On simulating lipid bilayers with an applied surface tension: periodic boundary conditions and undulations. Biophys. J. 1996;71:1350–1355. doi: 10.1016/S0006-3495(96)79337-2. [DOI] [PMC free article] [PubMed] [Google Scholar]
- 54.Marsh D. Renormalization of the tension and area expansion modulus in fluid membranes. Biophys. J. 1997;73:865–869. doi: 10.1016/S0006-3495(97)78119-0. [DOI] [PMC free article] [PubMed] [Google Scholar]
- 55.Klauda J.B., Wu X.W., Pastor R.W., Brooks B.R. Long-range Lennard-Jones and electrostatic interactions in interfaces: application of the isotropic periodic sum method. J. Phys. Chem. B. 2007;111:4393–4400. doi: 10.1021/jp068767m. [DOI] [PMC free article] [PubMed] [Google Scholar]
- 56.Sonne J., Jensen M.O., Hansen F.Y., Hemmingsen L., Peters G.H. Reparameterization of all-atom dipalmitoylphosphatidylcholine lipid parameters enables simulation of fluid bilayers at zero tension. Biophys. J. 2007;92:4157–4167. doi: 10.1529/biophysj.106.087130. [DOI] [PMC free article] [PubMed] [Google Scholar]
- 57.Harroun T.A., Katsaras J., Wassall S.R. Cholesterol is found to reside in the center of a polyunsaturated lipid membrane. Biochemistry. 2008;47:7090–7096. doi: 10.1021/bi800123b. [DOI] [PubMed] [Google Scholar]
Associated Data
This section collects any data citations, data availability statements, or supplementary materials included in this article.