

Abstract
Measurement of live-cell binding interactions is vital for understanding the biochemical reactions that drive cellular processes. Here, we develop, characterize, and apply a new procedure to extract information about binding to an immobile substrate from fluorescence correlation spectroscopy (FCS) autocorrelation data. We show that existing methods for analyzing such data by two-component diffusion fits can produce inaccurate estimates of diffusion constants and bound fractions, or even fail altogether to fit FCS binding data. By analyzing live-cell FCS measurements, we show that our new model can satisfactorily account for the binding interactions introduced by attaching a DNA binding domain to the dimerization domain derived from a site-specific transcription factor (the vitellogenin binding protein (VBP)). We find that our FCS estimates are quantitatively consistent with our fluorescence recovery after photobleaching (FRAP) measurements on the same VBP domains. However, due to the fast binding interactions introduced by the DNA binding domain, FCS generates independent estimates for the diffusion constant (6.7 ± 2.4 μm2/s) and the association (2 ± 1.2 s−1) and dissociation (19 ± 7 s−1) rates, whereas FRAP produces only a single, but a consistent, estimate, the effective-diffusion constant (4.4 ± 1.4 μm2/s), which depends on all three parameters. We apply this new FCS method to evaluate the efficacy of a potential anticancer drug that inhibits DNA binding of VBP in vitro and find that in vivo the drug inhibits DNA binding in only a subset of cells. In sum, we provide a straightforward approach to directly measure binding rates from FCS data.
Introduction
Recent advances in light microscopy have made it possible to probe molecular interactions within live cells (1). One important assay is the measurement of in vivo association and dissociation rates (2). These rates may differ considerably from their in vitro counterparts. For example, transcription factors are bound much more transiently in vivo (3,4) (on the order of seconds) than expected from in vitro measurements (on the order of minutes to hours). The in vivo observations have now generated a much more dynamic picture of transcription complex assembly (5). In addition to providing new insights into cellular function, measurements of in vivo binding rates also provide the raw materials for accurate mathematical modeling of cellular processes, a central goal of systems biology (6).
One technique for measuring in vivo association and dissociation rates is fluorescence recovery after photobleaching (FRAP) (7,8). In this procedure, a region of interest within a cell is irreversibly photobleached, and then the rate at which fluorescence recovers within the region is quantified. The recovery curve is fit using a mathematical model that incorporates diffusion and binding terms (9–12). In the best case, the fitted parameters provide independent estimates of the free-diffusion constant and the association and dissociation rates, although under less optimal conditions only ratios of some of these parameters can be estimated (12).
FRAP is well suited for measuring the association and dissociation rates of moderately fast binding interactions, namely those that give rise to recoveries that range from a few seconds to a few minutes. This timescale is easily measured on standard confocal microscopes, which are now widely used to perform FRAP. However, faster binding interactions that produce very rapid recoveries on the order of a second or less are more difficult to measure by FRAP. Even when recovery curves can be measured, such fast interactions frequently restrict the FRAP estimate to an effective diffusion constant, which only indirectly captures the retardation due to binding (9).
Rapid molecular dynamics have traditionally been analyzed by an alternate approach better suited to these kinetics, namely fluorescence correlation spectroscopy (FCS) (13). In FCS, the fluctuations in the concentration of a fluorescent molecule within a small femtoliter volume are used to compute an autocorrelation function, which is then usually fit with a model for diffusion. Binding interactions can be detected if the labeled molecule binds to a much larger molecule that diffuses significantly more slowly than does the free, labeled molecule. When this occurs, the FCS data will be well fit by a model with two diffusing components (14). The fractions of the fast and slow components correspond to the fractions of free and bound molecules. This FCS approach has been widely used in live cells to estimate the fraction of bound molecules (15–18), but unfortunately it does not provide estimates of association and dissociation rates, and furthermore is not strictly applicable to immobile binding sites.
Here, we derive and apply an FCS model for diffusion and binding that can be used to estimate association and dissociation rates at immobile binding sites within live cells directly from an FCS autocorrelation function. We apply the model to the dimerization and binding domains derived from the transcription factor vitellogenin binding protein (VBP), which is one member of the large and important family of leucine-zipper transcription factors (19). Using the dimerization and binding domains of VBP, we estimate in live cells its association and dissociation rates of binding to chromatin. We analyze kinetics of the same molecule by FRAP, obtaining results quantitatively consistent with the FCS predictions. However, due to the rapid binding interactions of VBP with chromatin, the FRAP estimate provides only an effective-diffusion constant and thus no direct estimate of association and dissociation rates. Thus, our analysis demonstrates the feasibility and advantages of estimating association and dissociation rates of fast binding interactions directly from FCS data.
Theory
Full model
We consider a molecule that diffuses with diffusion constant Df and binds to an immobile substrate with association and dissociation rates and koff. and are the fluctuations in the concentrations of free and bound molecules, respectively. If a large pool of free binding sites exists, the appropriate diffusion and binding equations are (see Supporting Material)
| (1) |
These equations have been extensively studied in the FRAP literature (9,10,12,20). They are a specific case of the generalized diffusion-and-binding system for FCS first considered by Elson and Magde, and later by Aragon and Pecora (21) and Krichevksy and Bonnet (22). All of these FCS analyses used Fourier transforms to solve for the general case of m diffusing species, each reacting with the remaining m − 1 components (23).
The Elson and Magde theory was based on a cosine illumination pattern in z, which was later adapted by Krichevsky and Bonnet (22) to a Gaussian z profile, an illumination pattern that is more appropriate for current confocal and two-photon FCS instruments. Thus, for our derivation of the specific autocorrelation function corresponding to Eq. 1 above, we used the Bonnet solution, with the number of chemical components set to two and the diffusion constant for the bound species set to zero. As shown in the Supporting Material, this yields the autocorrelation function, G(t), which we call the full model for diffusion and binding:
| (2) |
where N is the number of fluorescent molecules in the observation volume, μ = 1,2 for one- or two-photon excitation, respectively, wxy and wz are the width and height of the observation volume, which can be measured using standard procedures (see Supporting Material), and is the Fourier transform variable. The term accounts for the illumination profile:
| (3) |
and the term accounts for the diffusion and chemical kinetics:
| (4) |
with λ values given by
| (5) |
and ϕ given by
| (6) |
where and .
The full model solution (Eq. 2) thus depends on four unknown parameters, Df, , koff, and N, which can be determined by fitting to experimental data.
As a check, we compared a 2D (xy) version of Eq. 2 to the 2D “stick and diffuse” model recently derived to account for the binding of endocytotic vesicles to an immobile membrane scaffold (24). The derivation of the “stick and diffuse” model was not based on chemical kinetics, but rather on the probabilities of adhering to and diffusing on a 2D surface. We found that the 2D version of our diffusion-and-binding model agreed with the “stick and diffuse” model for a wide range of , koff, and Df values (data not shown), reinforcing the validity of both approaches.
Simplified regimes
Our diffusion-and-binding model (Eq. 2) should be capable of fitting all possible autocorrelation functions that could arise by the binding of a diffusing molecule to an immobile substrate. However, in FRAP, the comparable full-model solution reduces under different conditions to four simpler equations, which in all but one case impose restrictions on the parameters that can be estimated (12). In the Results section, we present a comparable analysis for FCS.
The four simplified equations describe the pure-diffusion, effective-diffusion, hybrid-model, and reaction-dominant regimes. The derivations for each of these regimes are given in the Supporting Material. Table 1 summarizes this analysis by providing for each regime the simplified autocorrelation function that describes it and the parameters that can be estimated when FCS data lie in that regime. The validity of the full diffusion-and-binding model and its simplified regimes was confirmed by fitting Monte Carlo simulated data sets (see Fig. S1 in Supporting Material).
Table 1.
Autocorrelation functions and measurable parameters for the four FCS simplified regimes
| Regime name | Conditions | Autocorrelation function | Measurable parameters | ||
|---|---|---|---|---|---|
| Pure diffusion | where and ω = wz/wxy | Df | |||
| Effective diffusion | where and ω = wz/wxy | ||||
| Hybrid model | where | and koff | |||
| Reaction dominant | where and | Df, and koff |
Variables are defined in the Theory section. “Conditions” describe when the simplified regime is a good approximation to the full model. When the bound fraction is either low or high, the pure-diffusion or the hybrid model, respectively, is a good approximation. When the time to diffuse through the illumination volume is either much longer or much shorter than the time to associate with a binding site, the effective-diffusion or the reaction-dominant model, respectively, is a good approximation. As shown under “Measurable parameters”, the reaction-dominant regime is the only simplified regime in which the diffusion constant, association and dissociation rates can be determined independently. (Note that “reaction-dominant” as we define it for FCS includes both a diffusive phase and a binding phase, unlike in our original definition for FRAP (12). We extend the FRAP formula for the reaction-dominant model in the Supporting Material).
Methods
Cell culture and transient transfection of GFP-tagged constructs were performed as previously described by Mueller et al. (25) (for details, see Supporting Material).
Experimental FCS and FRAP protocol
FCS experiments were performed with a two-photon FCS system (see Supporting Material). We calibrated the two-photon excitation volume before each experiment by measuring the diffusion coefficients of Alexa 488 (Invitrogen, Carlsbad, CA) and enhanced green fluorescent protein (eGFP) (Biovision, Mountain View, CA) using a wavelength of 970 nm, which resulted in volume dimensions of wxy = 0.35 μm and wz = 1.5 μm.
Cells were kept at 37°C on the microscope stage using an objective heater (Bioptechs, Butler, PA). To identify a suitable spot for acquiring FCS data, we acquired two-photon images of the entire cell. Regions were selected that occupied a central section of the nucleus far from both the nuclear envelope and nucleoli. We set the laser excitation power at <8 mW at the microscope entrance to avoid excitation saturation effects and to minimize photobleaching. We acquired FCS data for 10–20 s, and repeated each measurement five times at the same location. These data were averaged and then fit, producing estimates for that location, before moving to another spot in the same cell. Two or three different locations per nucleus were chosen, and at least 15 averaged curves were analyzed per sample. We rejected data with artifacts due to either visible photobleaching (gradual decay of the fluorescence intensity) or cell mobility (a sudden variation in the photon counts).
FRAP experiments were carried out as described by Mueller et al. (25) (for details see Supporting Material).
FCS data analysis
The reaction-diffusion models used are described in the Theory section and Table 1. In addition, we also fit some data with a two-component diffusion model (14):
| (7) |
where D1 are D2 are the diffusion constants of the two species, which are presumed to be of equal brightness, ρ and 1 − ρ are the fractions of molecules diffusing at rates D1 and D2, and ω is defined in Table 1.
Analysis of FCS data was performed with routines written in Matlab (The MathWorks, Natick, MA). For each time point ti, the average y(ti) of the five autocorrelation functions obtained at a single location was calculated, together with its standard deviation σ(ti). The averaged single-spot data were then fit to the full reaction-diffusion model (Eq. 2) and also to each of the simplified-regime models (Table 1). We used numerical integration to compute both the full and the hybrid models. All other models were given by closed-form solutions. In all cases, we used the nlinfit routine to minimize the quantity χ2, defined as
| (8) |
where yf represents the fitted function. This fit then yielded estimated parameters for that location. Estimated parameters for other locations in that cell or for other cells were then averaged together to provide mean values and standard deviations.
To select which model was more appropriate to describe the experimental data, we performed F-tests at the 95% confidence level, based on the reduced (26).
Results
Analysis of the FCS diffusion-and-binding model
To determine when restrictions on parameter estimation would arise in the FCS diffusion-and-binding model, we compared the full-model solution (Eq. 2) to the solutions for each of the simplified models (Table 1). By performing this comparison over a range of association () and dissociation (koff) rates, we generated a regime space that defines when the simplified formulas are accurate approximations to the full model (Fig. 1 A).
Figure 1.
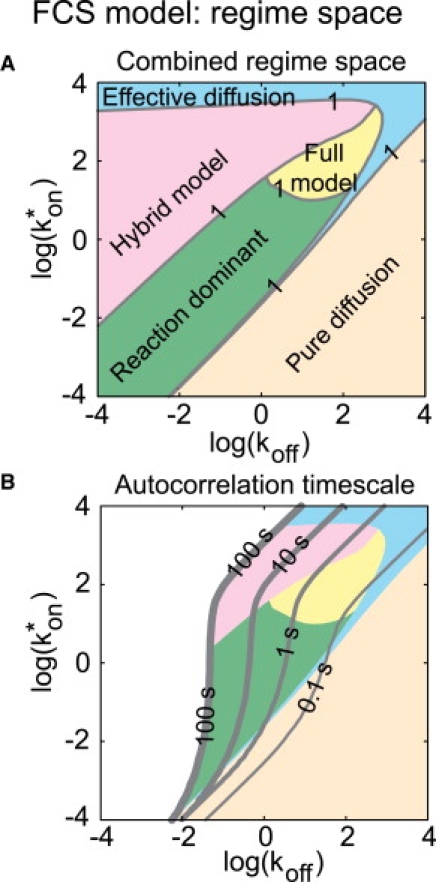
(A) The idealized regimes are combined to generate a regime space showing where each idealized model is a reasonable approximation to the full model (sum of residuals between full and idealized models <1). When constructing this composite regime space, overlaps between idealized regimes were resolved by selecting the idealized model with the fewest number of parameters. The details of the calculation of the regime space and a plot for each simplified model are provided in the Supporting Material (Fig. S2, A–E). (B) To determine which regimes could impact typical FCS measurements, we computed the time at which the autocorrelation function drops to 1% of its initial value (gray lines). Note that all regimes are encountered on typical FCS timescales of 0.1–10 s. This regime space was calculated for a cellular diffusion constant of 10 μm2/s, close to the theoretically predicted value for VBP-B-ZIP.
To define what parts of this regime space would yield decay times easily measured in FCS experiments, we varied and koff and calculated the corresponding decay time of the autocorrelation function. We found that any of the simplified regimes could yield decay times of a few seconds (Fig. 1 B), which is a practical upper bound on typical FCS measurements (27). Thus, any of the four simplified regimes could be expected to arise in FCS measurements on biological samples.
This means that it is important to test whether a simplified regime can fit experimental data, since several of the simplified regimes impose restrictions on what parameters can be estimated. If the one-component diffusion model fits the data, then only one parameter can be determined: the ratio . If the hybrid model fits the data, then two parameters can be determined: koff and the ratio . (Note that in either of these cases, more information can be obtained if the free-diffusion constant (Df) can be estimated independently). If the reaction-dominant model fits the data, then all three parameters, Df, , and koff, can be determined independently. If none of the simplified models fits the data, but the full model fits, then all three parameters can be determined independently.
Application of the FCS diffusion-and-binding model to domains derived from the transcription factor VBP
FCS measurements were made using a custom two-photon microscope equipped with a correlator board. Using this instrument, the signal intensity of the eGFP constructs examined here remained constant over the period of data acquisition, suggesting minimal photobleaching. FCS data were obtained from individual cells and then fit to yield single-cell parameter estimates, which were then averaged over many cells. All of the figures in this article show examples of single-cell fits, and Table 2 contains the averaged parameter estimates from many such fits.
Table 2.
Estimated parameters with standard deviations obtained from FCS or FRAP fits
| Estimated parameters |
||
|---|---|---|
| Molecule | FCS | FRAP |
| eGFP | Df = 23 ± 7 μm2/s | Df = 26 ± 5 μm2/s |
| VBP-L-ZIP | Df = 13 ± 4 μm2/s | Df = 14 ± 4 μm2/s |
| VBP-L-ZIP + drug | Df = 11 ± 3 μm2/s | Not measured |
| VBP-B-ZIP | Df = 6.7 ± 2.4 μm2/s, s−1, koff = 19 ± 7 s−1 | Deff = 4.4 ± 1.4 μm2/s |
| VBP-B-ZIP + drug(∼60% of cells) | Df = 5.6 ± 1.9 μm2/s | Not measured |
| VBP-B-ZIP + drug(∼40% of cells) | Df = 4.4 ± 1.5 μm2/s, s−1, koff = 18 ± 17 s−1 | Not measured |
The values for Df for eGFP, VBP-L-ZIP, and VBP-B-ZIP are consistent with the increasing sizes of these molecules. Furthermore, the FRAP and FCS measurements yield consistent results for eGFP, VBP-L-ZIP, and VBP-B-ZIP (for the latter, see the formula for Deff in Table 1). “+ drug” indicates that the putative DNA binding inhibitor NSC13746 was added at a 100-μM concentration. VBP-B-ZIP lacks a DNA binding domain, and so, as expected, the drug has no detectable effect on the VBP-L-ZIP diffusion constant. VBP-B-ZIP, which contains a DNA binding domain, shows inhibition of DNA binding in 60% of the cells, as indicated by a one-component, pure-diffusion fit. The remaining 40% of cells appear unaffected by the drug.
As a control, we first performed FCS measurements on unconjugated eGFP in nuclei (Fig. 2 A). Both FCS (Fig. 2 B) and FRAP (Fig. 2 C) data on single cells were well fit by a one-component diffusion model. The estimated diffusion constants from these two independent measurements were within error (Table 2) and also consistent with published estimates from other cells (16,17,28). These results suggest that our conditions for live-cell FCS and FRAP were appropriate.
Figure 2.
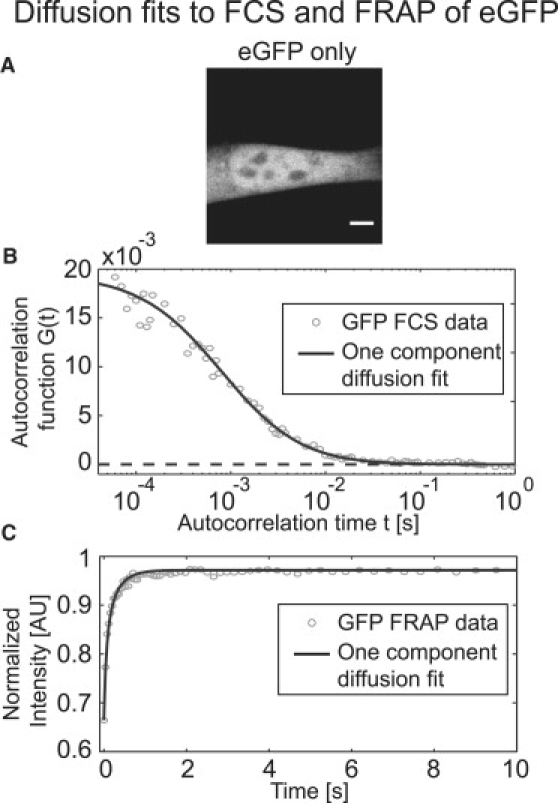
FCS and FRAP experiments yield consistent estimates for the diffusion constant of unconjugated eGFP in NIH-3T3 cells. (A) Confocal image of an NIH-3T3 nucleus. Scale bar, 5 μm. (B) The FCS autocorrelation function (gray circles) is well described by a pure-diffusion model (black line, Df = 19 μm2/s). (C) The experimental FRAP recovery curve (gray circles, Df = 24 μm2/s) is also well modeled by a pure-diffusion fit (black line). The estimated parameters listed here and in subsequent figure captions correspond to the curves shown, and so are from single-spot data. The averages from many such fits with standard deviations are reported in Table 2.
To evaluate the diffusion-and-binding model, we then performed FCS on two related molecules, only one of which was expected to bind DNA, because only it contained a DNA binding domain. The two molecules were both derived from the transcription factor VBP. VBP is a member of the basic leucine zipper family of transcription factors, which contain a basic domain responsible for DNA binding and a “leucine zipper” domain required for dimerization (Fig. 3 A) (19).
Figure 3.
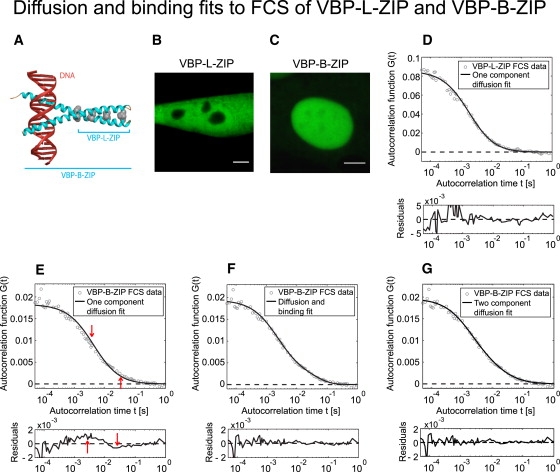
(A) The presence of a DNA binding domain in VBP-B-ZIP requires a binding term in the FCS model. VBP-B-ZIP contains a DNA binding domain and a leucine zipper region, whereas VBP-L-ZIP contains only the leucine zipper. (B and C) These eGFP-tagged constructs are transfected into NIH-3T3 cells (VBP-L-ZIP-GFP (B) and VBP-B-ZIP-GFP (C)). Note that the DNA binding domain leads to nuclear localization in C compared to B. Scale bars, 5 μm. (D and E) The FCS autocorrelation curves obtained for VBP-L-ZIP are well described by a pure-diffusion model (black line, Df = 8.3 μm2/s), but those for VBP-B-ZIP are not (E). Arrows in E indicate discrepancies between the fit and the VBP-B-ZIP data, with the residuals plot shown below. (F) The full diffusion-and-binding model provides a better fit to the VBP-B-ZIP data (Df = 6.4 μm2/s, 3 s−1, koff = 22 s−1), confirmed by a sixfold decrease in ( for pure-diffusion fit versus = 0.36 for the full-model fit). Plots of residuals also reveal a consistent pattern of overshoot or undershoot in E (arrows), but only random fluctuations in D or F. (G) A two-component diffusion fit also yields a good fit to the VBP-B-ZIP FCS data, with estimates for this cell of D1 = 8.6 μm2/s, D2 = 0.9 μm2/s, and a fast fraction of ρ = 0.72.
One of the molecules we examined (VBP-L-ZIP) contained only the leucine zipper (Fig. 3 B). This molecule dimerizes but does not bind to DNA in vitro (29). Consistent with this, in vivo single-cell autocorrelation functions for VBP-L-ZIP were well fit by a one-component diffusion model (Fig. 3 D). The average diffusion constant (13 ± 4 μm2/s (Table 2)) was consistent with free diffusion of VBP-L-ZIP, as predicted from its estimated hydrodynamic radius (see Supporting Material for an overview of this calculation).
The other molecule we examined (VBP-B-ZIP) contained both the leucine zipper and the basic region that binds to DNA in vitro (29). Consistent with this, the in vivo VBP-B-ZIP FCS data were not well fit by a one-component diffusion model (Fig. 3 E), whereas the full diffusion-and-binding model yielded good fits (Fig. 3 F). To determine whether these fits could reliably estimate Df, , and koff, we tested whether the VBP-B-ZIP data could be fit with any of the simplified models, and found that only the reaction-dominant model yielded a good fit, indicating that independent estimates of Df, , and koff are possible (Table 1). The estimated VBP-B-ZIP diffusion constant (6.7 ± 2.4 μm2/s (Table 2)) is consistent with its predicted free-diffusion constant based on the hydrodynamic radius of VBP-B-ZIP (see Supporting Material). The predicted association and dissociation rates of binding (Table 2) suggest transient interactions with chromatin with an association time of ∼500 ms () and a residence time of ∼50 ms (1/koff).
In sum, the VBP-L-ZIP and VBP-B-ZIP domains provide a simple test of the diffusion-and-binding model. Without the DNA binding domain, a one-component diffusion model suffices to explain the FCS data (VBP-L-ZIP). With the DNA binding domain, the one-component diffusion model fails, and a diffusion-and-binding model is now required to yield a good fit to the FCS data (VBP-B-ZIP).
Comparison of the diffusion-and-binding model to the two-component diffusion model
As noted in the Introduction, previous FCS analyses of binding interactions within live cells have typically employed two-component diffusion fits. We found that the VBP-B-ZIP data could also be well fit by a two-component diffusion model (Eq. 7) (Fig. 3 G).
Traditionally, in two-component fits, the slow fraction has been interpreted as bound and the fast fraction as freely diffusing with a diffusion constant equal to the diffusion constant of that fraction (15–18). For VBP-B-ZIP, this predicts an average bound fraction of 19% and an average free-diffusion constant of 7.5 ± 2.7 μm2/s. These estimates are close to the corresponding predictions from the diffusion-and-binding model fits (a bound fraction of 11% and a free-diffusion constant of 6.7 ± 2.4 μm2/s).
To test whether two-component diffusion fits would always agree with diffusion-and-binding model fits, we used the diffusion-and-binding model to generate autocorrelation functions over the range of association and dissociation rates measurable by FCS (as defined in Fig. 1 B). Then we fit these curves with two-component diffusion models. The two-component fit and/or its predictions became progressively worse as the fraction of bound molecules increased, with errors in estimated parameters increasing to >100% (Fig. S3, A–E).
In sum, our comparisons of the diffusion-and-binding model to the two-component diffusion model demonstrate that in many cases the latter model would not be able to fit data reflecting diffusion and binding. In those cases where the two-component diffusion model could fit diffusion and binding data, only a subset of fits would yield reasonably accurate estimates for the free-diffusion constant and bound fraction (VBP-B-ZIP is an example of such a case). However, even in these optimal cases, the two-component model cannot provide estimates of the association and dissociation rates.
Comparison of FCS and FRAP measurements
To check our FCS measurements, we also performed FRAP on VBP-B-ZIP and VBP-L-ZIP. Consistent with FCS, single-cell FRAP data for VBP-L-ZIP (which should not bind to DNA) were well fit by a pure-diffusion model (Fig. 4 A). The average estimated diffusion constant was nearly identical to that obtained from FCS (Table 2).
Figure 4.
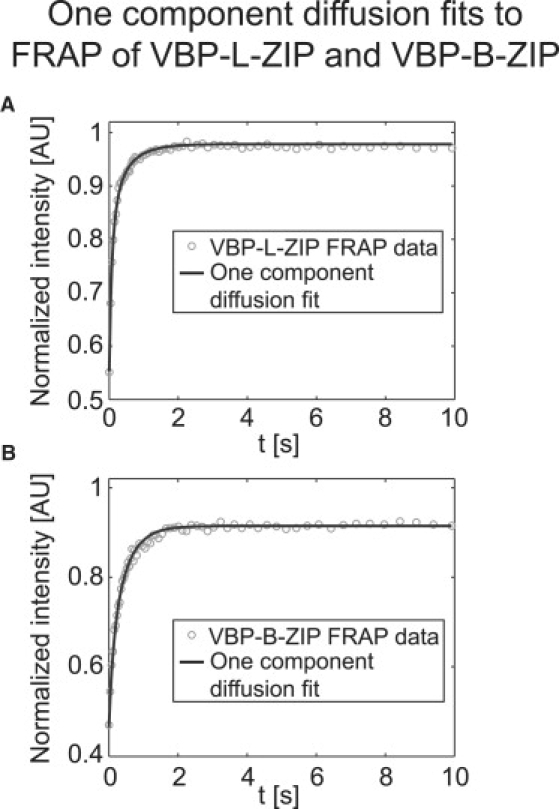
FRAP experiments on VBP proteins. (A) VBP-L-ZIP experimental FRAP curves (gray circles) are well described by a pure-diffusion fit (black line), yielding for this cell Df = 20.8 μm2/s. (B) VBP-B-ZIP experimental FRAP curves are also well fit by a diffusion model (black line), although here, the estimated diffusion coefficient (Deff = 6.1 μm2/s) most likely reflects effective diffusion. Please note that the incomplete recoveries do not correspond to an immobile fraction but rather reflect the loss of fluorescence due to photobleaching within a finite nucleus, which is accounted for in the FRAP model (25).
A diffusion model also yielded a good fit to the FRAP data for VBP-B-ZIP (Fig. 4 B), but now the average predicted diffusion constant was slower than that predicted by FCS. This slower diffusion constant is explicable as effective diffusion. Using the FCS estimates for the diffusion constant and the association and dissociation rates, the equation for the effective-diffusion constant in Table 1 predicts that Deff = 5.8 ± 2.6 μm2/s for VBP-B-ZIP, similar to the 4.4 ± 1.4 μm2/s measured by FRAP. Thus, the FRAP and FCS estimates appear to be consistent for VBP-B-ZIP.
To understand why FRAP yields only an effective-diffusion constant for VBP-B-ZIP, whereas FCS provides an independent estimate for the free-diffusion constant and the association and dissociation rates, we computed the regime spaces for the FRAP and FCS experiments. As expected, we found that the point () corresponding to the VBP-B-ZIP association and dissociation rates measured by FCS lay in the reaction-dominant regime for FCS (Fig. S4 A), consistent with the reaction-dominant FCS fit that yielded independent estimates for these parameters. The same () point, however, lay in the effective-diffusion regime for FRAP (Fig. S4 B), consistent with the effective-diffusion fit of the FRAP data.
This shift in the regime spaces between FCS and FRAP cannot be explained by the faster acquisition rate of FCS experiments. When we simulated FCS curves with a much slower acquisition rate (10 ms, see Fig. S4 C), we obtained only a minor shift in the regime space.
Rather, the differences between FCS and FRAP regime spaces can be explained by the difference in spot size between the FCS illumination volume and the FRAP photobleach. When we simulated an identical spot size for the two procedures, we obtained nearly identical regime spaces for each (Fig. S4, D and E). This shows that the smaller spot size in FCS is responsible for its ability to independently estimate the association and dissociation rates of VBP-B-ZIP.
Application of the diffusion-and-binding model to assay a small-molecule inhibitor of VBP-B-ZIP DNA binding
An antimony-containing water-soluble compound NSC13746 has been developed that binds to the basic region of VBP-B-ZIP and inhibits its binding to DNA in vitro (30). This molecule has potential therapeutic use in cancers that involve promiscuously activated forms of leucine zipper transcription factors. To test the efficacy of NSC13746 in live cells, we incubated cells with a concentration of the drug 10 times higher than the concentration used in vitro, and then used FCS to measure the effects on DNA binding of VBP-B-ZIP (30).
Two distinct populations of drug-treated cells were detected by FCS. In 60% of the cells the drug dramatically inhibited DNA binding of VBP-B-ZIP, as indicated by a one-component diffusion fit to the FCS data (Fig. 5 A) yielding an estimated diffusion constant that was within the error of the estimated diffusion constant of VBP-B-ZIP in untreated cells (Table 2). In the remaining 40% of cells, the drug appeared to have little effect on DNA binding of VBP-B-ZIP, as indicated by a diffusion-and-binding model fit to the FCS data (Fig. 5 B) that yielded estimates for the association and dissociation rates statistically indistinguishable from those obtained for control cells not treated with the drug (Table 2).
Figure 5.
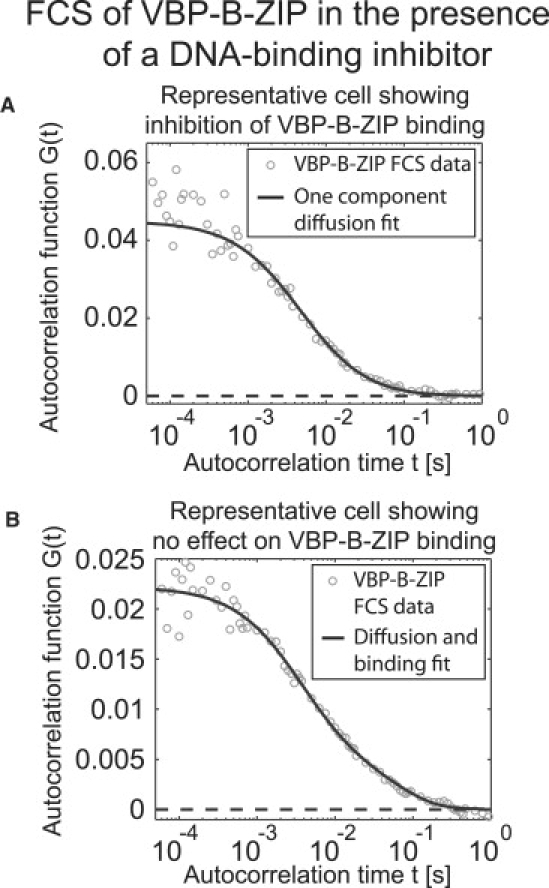
FCS detects a differential effect on DNA binding in the presence of an inhibitor. Cells containing transfected VBP-B-ZIP were incubated with 100 μM of the inhibitor NSC13746 for ∼2 h, after which FCS was performed. Approximately 60% of the cells containing VBP-B-ZIP produced FCS data that were well fit by a pure-diffusion model, yielding an estimated diffusion constant that was statistically indistinguishable from that estimated for freely diffusing VBP-B-ZIP (Table 2). (The fit in A yielded Df = 4.4 μm2/s). F-tests on these data confirmed that no statistically relevant improvement was achieved when using the diffusion-and-binding model. Thus, in this population of cells, the inhibitor appeared to significantly inhibit DNA binding. In contrast, 40% of the cells containing VBP-B-ZIP produced FCS data that were well fit by only the diffusion-and-binding model. The average estimated parameters from this subpopulation were indistinguishable from those obtained for untreated cells (Table 2). (The fit in B yielded Df = 6.7 μm2/s, s−1, koff = 15 s−1). Thus, in these cells, the inhibitor had no apparent effect on DNA binding.
As a control, the drug was also tested on cells transfected with the VBP-L-ZIP construct, which lacks the DNA binding domain. The FCS data from all of these drug-treated VBP-L-ZIP cells were fit in the same way (Fig. S5), namely with a one-component diffusion fit that predicted a diffusion constant statistically indistinguishable from that estimated in untreated VBP-L-ZIP cells (Table 2). Thus, the drug appeared to have no effect on VBP-L-ZIP, indicating that its effects on VBP-B-ZIP were specific for the VBP-B-ZIP DNA binding domain. In sum, our data suggest that the compound NSC13746 can inhibit binding of VBP-B-ZIP to DNA in live cells, but only in some cells.
Discussion
A diffusion-and-binding model for FCS
We have developed and analyzed a model that can be used to fit FCS data for a diffusing molecule that also binds to an immobile substrate. We presumed that the concentration of free binding sites is large relative to the concentration of free, fluorescently-labeled molecules, a condition that is likely to hold for transcription factors binding to the large number of nonspecific sites spread throughout the nucleus.
When fit to experimental autocorrelation data, the model can yield independent estimates for the molecule's diffusion constant and its association and dissociation rates of binding. We showed that in theory, these three parameters can often be estimated independently under typical conditions for live-cell analysis, namely, with autocorrelation functions that decay on a timescale of seconds or less. However, the theory shows that in two cases, notably for molecules with fast association rates, reliable estimates are only available for either one parameter (an effective-diffusion constant that depends on the free-diffusion constant and the association and dissociation rates) or two parameters (the dissociation rate and the ratio of the diffusion constant to the association rate). An awareness of these limitations in parameter estimation is important when applying such models to experimental data.
We tested the diffusion-and-binding model using a simple and well-defined system based on the dimerization and DNA binding domains from the transcription factor VBP. One molecule that we tested, VBP-L-ZIP, contained only the dimerization domain but no DNA binding domain and accordingly was well fit by a pure-diffusion model yielding a diffusion constant consistent with the size of VBP-L-ZIP. The second molecule that we tested, VBP-B-ZIP, contained both the dimerization domain and the DNA binding domain and accordingly was no longer fit by a pure-diffusion model but instead required the full diffusion-and-binding model. The predicted diffusion constant for VBP-B-ZIP was consistent with its size, and the predicted binding rates suggested transient interactions with chromatin. These results show that binding behavior alters FCS data in a predictable way that can be accounted for by the diffusion-and-binding model.
We also compared this model to the traditional approach in FCS binding analysis, which has been based on a two-component diffusion fit. For VBP-B-ZIP, both the two-component diffusion model and the diffusion-and-binding model yielded similar estimates for the free-diffusion constant and the fraction of molecules bound. However, the diffusion-and-binding model had an advantage, because it also provided estimates of the association and dissociation rates of binding.
By considering a wide range of binding rates, we showed that agreement between the two models was not guaranteed. We found that for data corresponding to diffusion and binding events, the two-component diffusion fit could often yield inaccurate estimates or no fit whatsoever. Thus, in these cases, application of the two-component diffusion model would lead either to erroneous results in the estimates for free-diffusion constants and bound fractions or to the conclusion that other models, such as anomalous diffusion, would better describe the data.
In sum, compared to the widely used two-component diffusion model, the diffusion-and-binding model has a number of advantages for the analysis of binding interactions with immobile substrates. For such cases, our new model better reflects the underlying dynamics and so has the potential to provide more information and improved accuracy than two-component diffusion fits. These favorable features suggest that the diffusion-and-binding model will be useful in analyzing FCS data in other cases where diffusion and binding are suspected of playing a role.
Comparison of FCS and FRAP
Although both FCS and FRAP have the potential to provide estimates of in vivo binding rates, there have been only a few direct comparisons of these two distinct approaches (16,32,33). Our analysis shows that the two procedures yield good agreement for the VBP-L-ZIP and VBP-B-ZIP fragments. For VBP-L-ZIP, both approaches produced identical estimates for the diffusion constant. For VBP-B-ZIP, there was also consistency: FRAP yielded an effective-diffusion constant that was expected based on the FCS estimates for the VBP-B-ZIP diffusion constant and its association and dissociation rates.
It is interesting to note that for the binding characteristics of VBP-B-ZIP, FCS had an advantage over FRAP because it provided independent estimates of three parameters: the free-diffusion constant, the association rate, and the dissociation rate. As we have shown, this was caused by the smaller spot size of FCS, which resulted in the VBP-B-ZIP association and dissociation rates lying within the full-model regime, where independent estimates of all three parameters could reliably be made. In contrast, the larger spot size of FRAP placed the VBP-B-ZIP binding rates within the effective-diffusion regime, thereby restricting the FRAP estimates to just one parameter.
In principle, this limitation in FRAP could be overcome by bleaching small, diffraction-limited spots. However, current FRAP models for diffusion and binding are applicable only to larger bleach spots, because these produce a more cylindrical 3D bleach pattern (4). Smaller bleach spots have a complicated 3D profile and would introduce axial dependence into the FRAP model (34).
Thus, FCS is preferable in the analysis of molecules with fast association rates. On the other hand, molecules with tighter binding that gives rise to longer residence times, would be difficult to measure by FCS due to either drift of the specimen or photobleaching (27,35). If we assume that a typical fluorescent molecule emits a few thousand photons before bleaching, then a rough calculation suggests an upper bound of ∼1 s on residence times measurable by FCS given typical illumination intensities. Thus, FRAP and FCS will likely provide complementary approaches to measure in vivo binding, but when possible, the application of both, as we have done here, may lend more confidence to the estimates obtained by either approach alone.
It is important to emphasize that although the quantitative consistency between the FRAP and FCS estimates is encouraging, the estimates are only as accurate as the underlying model. One strength of our current analysis is that we have used a model for FRAP and FCS that corresponds to the known in vitro properties of the VBP dimerization and binding domains. However, both the FRAP and FCS models presume simple Fickian diffusion and single-step bimolecular binding reactions. Thus, the current estimates may improve if future tests demonstrate that these or other assumptions are significant oversimplifications.
An in vivo assay of drug efficacy
We used the diffusion-and-binding model to investigate the effects of the drug NSC13746 on VBP-B-ZIP binding to DNA. This compound binds to the basic region of all VBP-B-ZIP transcription factors (30). This inhibits DNA binding in vitro.
Notably, our in vivo analysis by FCS revealed a differential effect of the drug across the cell population: ∼40% of the cells showed no effects on DNA binding in the presence of 100 μM NSC13746, whereas the remaining ∼60% of the cells appeared to exhibit a dramatic reduction in DNA binding. Note that the drug concentration used was 10 times higher than that which inhibited DNA binding in vitro (30).
The differential effect observed in vivo might arise due to differential uptake or degradation of the drug in different cells, or differential modification of the VBP-B-ZIP peptide such that the drug binds poorly to VBP-B-ZIP in a subset of cells. These various hypotheses should now be investigated. Understanding how such a differential effect might arise, and then overcoming it, is important for drugs like NSC13746 that might be used therapeutically. Mosaic responses can have important clinical consequences, since single cells that survive a treatment regimen may lead to relapse. Techniques that can detect and quantify these mosaic responses are intrinsically more useful than those that can only average the response over a cell population. Thus, the FCS analysis we have developed here may provide a useful tool for testing other drugs to assay their effects on binding in single, living cells.
Supporting Material
Supporting methods and model derivations including thirty-six equations and five figures are available at http://www.biophysj.org/biophysj/supplemental/S0006-3495(09)00889-3.
Supporting Material
Acknowledgments
Two-photon imaging and FCS measurements were carried out using a system built in the ultrafast laser microscopy facility at the National Heart, Lung and Blood Institute (collaboration between O.S.S., L.M.B., and L.M.F.). FRAP experiments were carried out in the National Cancer Institute's fluorescence imaging facility. We thank Tatiana Karpova for expert technical assistance, Florian Mueller for providing the code for FRAP regime analysis and fitting, and Dan Sisan and Carolyn Smith for comments on the manuscript.
This research was supported in part by the intramural program of the National Institutes of Health, National Cancer Institute, and Center for Cancer Research. Commercial names of materials and apparatus are identified only to specify the experimental procedures. This does not imply a recommendation by the National Institute of Standards and Technology, nor does it imply that they are the best available for the purpose.
Footnotes
Ariel Michelman-Ribeiro and Davide Mazza contributed equally to this work.
Ariel Michelman-Ribeiro's present address is Semiconductor Electronics Division, Electronics and Electrical Engineering Laboratory, National Institute of Standards and Technology, Gaithersburg, MD 20899.
References
- 1.Day R.N., Schaufele F. Imaging molecular interactions in living cells. Mol. Endocrinol. 2005;19:1675–1686. doi: 10.1210/me.2005-0028. [DOI] [PMC free article] [PubMed] [Google Scholar]
- 2.Phair R.D., Misteli T. Kinetic modelling approaches to in vivo imaging. Nat. Rev. Mol. Cell Biol. 2001;2:898–907. doi: 10.1038/35103000. [DOI] [PubMed] [Google Scholar]
- 3.McNally J.G., Müller W.G., Walker D., Wolford R., Hager G.L. The glucocorticoid receptor: rapid exchange with regulatory sites in living cells. Science. 2000;287:1262–1265. doi: 10.1126/science.287.5456.1262. [DOI] [PubMed] [Google Scholar]
- 4.Sprague B.L., Muller F., Pego R.L., Bungay P.M., Stavreva D.A. Analysis of binding at a single spatially localized cluster of binding sites by fluorescence recovery after photobleaching. Biophys. J. 2006;91:1169–1191. doi: 10.1529/biophysj.105.073676. [DOI] [PMC free article] [PubMed] [Google Scholar]
- 5.Hager G.L., Elbi C., Johnson T.A., Voss T., Nagaich A.K. Chromatin dynamics and the evolution of alternate promoter states. Chromosome Res. 2006;14:107–116. doi: 10.1007/s10577-006-1030-0. [DOI] [PubMed] [Google Scholar]
- 6.Janes K.A., Lauffenburger D.A. A biological approach to computational models of proteomic networks. Curr. Opin. Chem. Biol. 2006;10:73–80. doi: 10.1016/j.cbpa.2005.12.016. [DOI] [PubMed] [Google Scholar]
- 7.Sprague B.L., McNally J.G. FRAP analysis of binding: proper and fitting. Trends Cell Biol. 2005;15:84–91. doi: 10.1016/j.tcb.2004.12.001. [DOI] [PubMed] [Google Scholar]
- 8.Houtsmuller A.B. Fluorescence recovery after photobleaching: application to nuclear proteins. Adv. Biochem. Eng. Biotechnol. 2005;95:177–199. doi: 10.1007/b102214. [DOI] [PubMed] [Google Scholar]
- 9.Beaudouin J., Mora-Bermudez F., Klee T., Daigle N., Ellenberg J. Dissecting the contribution of diffusion and interactions to the mobility of nuclear proteins. Biophys. J. 2006;90:1878–1894. doi: 10.1529/biophysj.105.071241. [DOI] [PMC free article] [PubMed] [Google Scholar]
- 10.Carrero G., Crawford E., Hendzel M.J., de Vries G. Characterizing fluorescence recovery curves for nuclear proteins undergoing binding events. Bull. Math. Biol. 2004;66:1515–1545. doi: 10.1016/j.bulm.2004.02.005. [DOI] [PubMed] [Google Scholar]
- 11.Lele T., Oh P., Nickerson J.A., Ingber D.E. An improved mathematical approach for determination of molecular kinetics in living cells with FRAP. Mech. Chem. Biosyst. 2004;1:181–190. [PubMed] [Google Scholar]
- 12.Sprague B.L., Pego R.L., Stavreva D.A., McNally J.G. Analysis of binding reactions by fluorescence recovery after photobleaching. Biophys. J. 2004;86:3473–3495. doi: 10.1529/biophysj.103.026765. [DOI] [PMC free article] [PubMed] [Google Scholar]
- 13.Elson E.L. Fluorescence correlation spectroscopy measures molecular transport in cells. Traffic. 2001;2:789–796. doi: 10.1034/j.1600-0854.2001.21107.x. [DOI] [PubMed] [Google Scholar]
- 14.Schwille P., Bieschke J., Oehlenschlager F. Kinetic investigations by fluorescence correlation spectroscopy: the analytical and diagnostic potential of diffusion studies. Biophys. Chem. 1997;66:211–228. doi: 10.1016/s0301-4622(97)00061-6. [DOI] [PubMed] [Google Scholar]
- 15.Rigler R., Pramanik A., Jonasson P., Kratz G., Jansson O.T. Specific binding of proinsulin C-peptide to human cell membranes. Proc. Natl. Acad. Sci. USA. 1999;96:13318–13323. doi: 10.1073/pnas.96.23.13318. [DOI] [PMC free article] [PubMed] [Google Scholar]
- 16.Renz M., Langowski J. Dynamics of the CapG actin-binding protein in the cell nucleus studied by FRAP and FCS. Chromosome Res. 2008;16:427–437. doi: 10.1007/s10577-008-1234-6. [DOI] [PubMed] [Google Scholar]
- 17.Mikuni S., Tamura M., Kinjo M. Analysis of intranuclear binding process of glucocorticoid receptor using fluorescence correlation spectroscopy. FEBS Lett. 2007;581:389–393. doi: 10.1016/j.febslet.2006.12.038. [DOI] [PubMed] [Google Scholar]
- 18.Merkle D., Zheng D., Ohrt T., Crell K., Schwille P. Cellular dynamics of Ku: characterization and purification of Ku-eGFP. Chem. Bio. Chem. 2008;9:1251–1259. doi: 10.1002/cbic.200700750. [DOI] [PubMed] [Google Scholar]
- 19.Vinson C., Myakishev M., Acharya A., Mir A.A., Moll J.R. Classification of human B-ZIP proteins based on dimerization properties. Mol. Cell. Biol. 2002;22:6321–6335. doi: 10.1128/MCB.22.18.6321-6335.2002. [DOI] [PMC free article] [PubMed] [Google Scholar]
- 20.Kaufman E.N., Jain R.K. Quantification of transport and binding parameters using fluorescence recovery after photobleaching. Potential for in vivo applications. Biophys. J. 1990;58:873–885. doi: 10.1016/S0006-3495(90)82432-2. [DOI] [PMC free article] [PubMed] [Google Scholar]
- 21.Aragon S.R., Pecora R. Fluorescence correlation spectroscopy as a probe of molecular dynamics. J. Chem. Phys. 2008;64:1791–1803. [Google Scholar]
- 22.Krichevsky O., Bonnet G. Fluorescence correlation spectroscopy: the technique and its applications. Rep. Prog. Phys. 2002;65:251–297. [Google Scholar]
- 23.Elson E.L., Magde D. Fluorescence correlation spectroscopy. I. Conceptual basis and theory. Biopolymers. 1974;13:1–27. doi: 10.1002/bip.1974.360130103. [DOI] [PubMed] [Google Scholar]
- 24.Yeung C., Shtrahman M., Wu X.L. Stick-and-diffuse and caged diffusion: a comparison of two models of synaptic vesicle dynamics. Biophys. J. 2007;92:2271–2280. doi: 10.1529/biophysj.106.081794. [DOI] [PMC free article] [PubMed] [Google Scholar]
- 25.Mueller F., Wach P., McNally J.G. Evidence for a common mode of transcription factor interaction with chromatin as revealed by improved quantitative fluorescence recovery after photobleaching. Biophys. J. 2008;94:3323–3339. doi: 10.1529/biophysj.107.123182. [DOI] [PMC free article] [PubMed] [Google Scholar]
- 26.Bevington P.R., Robinson D.K. McGraw Hill; New York: 1992. Data reduction and error analysis for the physical sciences. [Google Scholar]
- 27.Bates I.R., Wiseman P.W., Hanrahan J.W. Investigating membrane protein dynamics in living cells. Biochem. Cell Biol. 2006;84:825–831. doi: 10.1139/o06-189. [DOI] [PubMed] [Google Scholar]
- 28.Bhattacharya D., Mazumder A., Miriam S.A., Shivashankar G.V. EGFP-tagged core and linker histones diffuse via distinct mechanisms within living cells. Biophys. J. 2006;91:2326–2336. doi: 10.1529/biophysj.105.079343. [DOI] [PMC free article] [PubMed] [Google Scholar]
- 29.Moll J.R., Olive M., Vinson C. Attractive interhelical electrostatic interactions in the proline- and acidic-rich region (PAR) leucine zipper subfamily preclude heterodimerization with other basic leucine zipper subfamilies. J. Biol. Chem. 2000;275:34826–34832. doi: 10.1074/jbc.M004545200. [DOI] [PubMed] [Google Scholar]
- 30.Rishi V., Potter T., Laudeman J., Reinhart R., Silvers T. A high-throughput fluorescence-anisotropy screen that identifies small molecule inhibitors of the DNA binding of B-ZIP transcription factors. Anal. Biochem. 2005;340:259–271. doi: 10.1016/j.ab.2005.02.012. [DOI] [PubMed] [Google Scholar]
- 31.Reference deleted in proof.
- 32.Schmiedeberg L., Weisshart K., Diekmann S., Meyer Zu H.G., Hemmerich P. High- and low-mobility populations of HP1 in heterochromatin of mammalian cells. Mol. Biol. Cell. 2004;15:2819–2833. doi: 10.1091/mbc.E03-11-0827. [DOI] [PMC free article] [PubMed] [Google Scholar]
- 33.Icenogle R.D., Elson E.L. Fluorescence correlation spectroscopy and photobleaching recovery of multiple binding reactions. II. FPR and FCS measurements at low and high DNA concentrations. Biopolymers. 1983;22:1949–1966. doi: 10.1002/bip.360220809. [DOI] [PubMed] [Google Scholar]
- 34.Mazza D., Cella F., Vicidomini G., Krol S., Diaspro A. Role of three-dimensional bleach distribution in confocal and two-photon fluorescence recovery after photobleaching experiments. Appl. Opt. 2007;46:7401–7411. doi: 10.1364/ao.46.007401. [DOI] [PubMed] [Google Scholar]
- 35.Ries J., Schwille P. New concepts for fluorescence correlation spectroscopy on membranes. Phys. Chem. Chem. Phys. 2008;10:3487–3497. doi: 10.1039/b718132a. [DOI] [PubMed] [Google Scholar]
Associated Data
This section collects any data citations, data availability statements, or supplementary materials included in this article.