

Abstract
We present a self-contained theory for the mechanical response of DNA in single molecule experiments. Our model is based on a one-dimensional continuum description of the DNA molecule and accounts both for its elasticity and for DNA-DNA electrostatic interactions. We consider the classical loading geometry used in experiments where one end of the molecule is attached to a substrate and the other one is pulled by a tensile force and twisted by a given number of turns. We focus on configurations relevant to the limit of a large number of turns, which are made up of two phases, one with linear DNA and the other one with superhelical DNA. The model takes into account thermal fluctuations in the linear phase and electrostatic interactions in the superhelical phase. The values of the torsional stress, of the supercoiling radius and angle, and key features of the experimental extension-rotation curves, namely the slope of the linear region and thermal buckling threshold, are predicted. They are found in good agreement with experimental data.
Introduction
Mechanics of the DNA molecule plays a key role in several biological processes at the cellular level. In several cases, the action of enzymes and proteins on DNA has been found to depend on the mechanical stress present in the molecule. For instance, the torsional moment in DNA controls the action of topoisomerases or RNA-polymerases (1,2). In this context, experiments where forces and torques are applied to a single DNA molecule provide a remarkable opportunity to gain insights into the mechanics of DNA. We are here interested in extension-rotation experiments using either optical or magnetic tweezers (3–8). These experimental setups are equivalent from a mechanical perspective: a dsDNA molecule is fixed at one end on a glass pane while the other end is attached to a bead that pulls and twists it. In these experiments, traction and rotation are controlled differently: for the rotation mode, the twist angle is prescribed and the twist moment varies accordingly; for the stretching mode, the extension can vary although the pulling force is prescribed. DNA is under- or overwound and various molecule conformations are observed (6). In this study, we focus on the overwinding of a dsDNA molecule under large imposed rotations: the molecule coils around itself in a helical way and forms plectonemes, as sketched in Fig. 1. An important feature of the experimental loading curves is the linear decrease of the vertical extension of the molecule as a function of the imposed rotation. We have shown in previous studies (9,10) that this behavior can be captured by a purely elastic rod model based on Kirchhoff-Love elastic rod theory. In this article, we extend this model and investigate the combined effects of elasticity and electrostatics.
Figure 1.
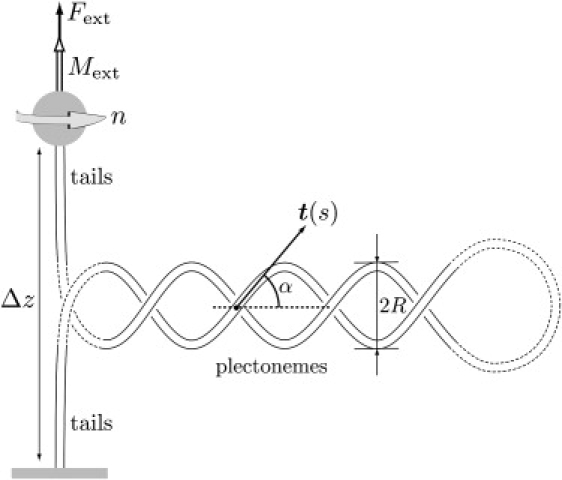
Sketch of the experimental setup: a dsDNA molecule is fixed by one end to a glass pane while the other end is attached to a mechanical system, symbolized by the shaded disk, which allows one to exert a pulling force Fext and impose a rotation 2πn. For large numbers of turns the molecule coils around itself in a helical way and forms plectonemes. The configuration of the molecule is made of two phases: the tails and the plectonemes. The plectonemic phase is characterized by superhelical radius R and angle α between the tangent t(s) and the helices axis. The dashed parts represent the regions we neglect: the matching region between the tails and the plectonemes and the end loop.
The response of plectonemic DNA under stress involves various physical phenomena such as elastic deformations, thermal fluctuations, electrostatic interactions, and self-avoidance. Although some of these effects have been considered in the literature, a model addressing them together is still lacking. Mechanical models of twisted rods in contact have been introduced, from an analytical (11) or numerical (12) perspective, but thermal fluctuations are not treated. A simplified analytical model, including some account for fluctuations but omitting contact forces in the plectonemic region, is proposed in Purohit (13). Statistical mechanics of plectonemic DNA has been approached, either analytically (14,15) or numerically (16) using a Monte Carlo method. The validity of some of these results was questioned in the literature (17,18); in addition, long-range potentials raise convergence issues that have not yet been overcome in Monte Carlo simulations. A composite model, gathering results from torsionally constrained polymer (19) and Monte Carlo simulations, has recently been introduced (20). To date, this is the only model that confronts its predictions against experimental data. However it relies on an assumption of the supercoiling free energy that is not always valid (21,22) and uses parameters extracted from Monte Carlo simulations.
In this article, we present a self-contained analytical model for the mechanical response of plectonemic DNA in extension-rotation experiments, which builds up on previous work (9)—in this previous work, we extracted information from experimental data; our new model is predictive. We focus on the plectonemic regime at large imposed rotations. This corresponds to the linear region in the experimental extension-rotation curves. Our elastic model accounts for DNA-DNA interactions in the plectonemic region and for thermal fluctuations in the tail regions, where they are dominant. It captures the main features of the experimental curves and allows quantitative comparison to experiments with no adjustable parameter.
The article is organized as follows. In the next section, we present our model and derive the equilibrium equations for a DNA molecule comprising plectonemes, for a generic interaction potential. In DNA-DNA Interactions, we describe two representative DNA-DNA interactions potentials available in the literature, which we then plug into our model. The results are then compared with experimental data.
Model
Our description of the DNA molecule is based on a coarse-grained representation (23). We introduce a continuum rod model whose mechanical behavior is similar to that of the molecule, and makes use of effective elastic and electrostatic properties obtained by smoothing out the details at a scale of several basepairs. We deal with an inextensible elastic rod with circular cross section, bending rigidity K0, and twisting rigidity K3. The loading geometry is that of Fig. 1, and applies to the experiments where the lower end of the molecule is clamped on a glass pane and the other end is subjected to a tensile force Fext and rotated by n turns (i.e., an angle 2πn). The imposed rotation is achieved through a torsional moment Mext. Note that the torsional moment has become accessible to experimental measurements (7) only recently.
Geometry
The inextensible rod, of length ℓ, is parameterized by its arc-length s, the origin s = 0 being at the lower end. The rod centerline is described by a vector-valued function r(s) and its unit tangent . The geometric curvature of the rod is noted . The twist is noted τ(s): it describes the relative rotation of neighboring cross sections about the tangent r(s). Note that the twist is a different quantity from the Frénet (geometric) torsion of space curves—the latter is irrelevant in the context of elastic rods.
We consider the geometry of the double-stranded DNA sketched in Fig. 1, which is relevant to the plectonemic regime: two twisted, straight tails are separated by a plectonemic region composed of two identical and uniform helices. Note that each helix is itself a piece of the double-stranded DNA molecule. For a large number of turns n, the loop at the end of the plectonemes and the curved region connecting the tails to the plectonemes are much smaller than the tails and the helical parts, and hence are neglected. Even though we depict the plectonemic region as a single chunk for simplicity, our model applies equally well to the case where the plectonemes are distributed in several places along the molecule. The elastic rod is then made up of two phases, one with linear DNA and the other one with plectonemes. The plectonemic structure in Fig. 1 represents the plectonemic phase collectively. The molecule contour length spent in the tails phase and in the plectonemes are noted ℓt and ℓp, respectively. They sum up to the total length ℓ = ℓp + ℓt. The plectonemic phase is characterized by its superhelical radius R and its superhelical angle α, which are assumed to be uniform: neither R nor α may depend on s, although they depend on the loading. Curvature is zero in the straight tails, and takes a constant value in the plectonemes, which can be evaluated using simple geometry. The integrated squared curvature, which enters into the bending energy, is then found to be (9)
| (1) |
Since the rod has a circular cross section, the twist τ(s) is uniform, dτ/ds = 0 (as shown, for instance, in (24)). The internal torsional moment M(s) in the rod is related to the twist τ(s) by the constitutive law M(s) = K3τ(s). Therefore, its value M(s) is constant along the rod, and equal to the torque Mext = K3τ applied by the bead. In what follows, we study the equilibrium of the rod and compute the parameters R, α, ℓp, and τ = Mext/K3 as a function of the loading (pulling force Fext and number of turns n) by minimizing the energy.
Variational formulation
We derive the energy of the system as a function of the superhelical angle α and radius R, of the twist τ and of the plectonemic contour length ℓp. Equilibrium solutions and their stability will be derived later on by minimizing this energy. The experiments are performed under imposed end rotation: energy minimization is performed under the constraint that the number of turns n imposed on the bead is equal to the link Lk of the DNA molecule. Neglecting the writhe of the tails, the link can be written as (9,10)
| (2) |
where χ = ±1 stands for the chirality of the two helices of the plectonemic phase.
The total energy of the system is the sum of three terms, V = Vel + Vext + Vint, where the first is the strain elastic energy, the second is the potential energy associated with the external load Fext, and the last term accounts for DNA-DNA interactions between the two helices in the plectonemic phase. Note that we introduce an internal energy and not a free energy: no entropic terms or correcting factors coming from statistical mechanics are considered here.
The strain elastic energy of the rod is defined as the sum of a bending term, proportional to the integrated squared curvature, and a stretching term, proportional to the integrated squared twist:
| (3) |
This energy captures the elastic behavior of the rod in response to applied forces and moments; it is zero in the natural (straight, twistless) configuration of the rod. The pulling force is described using a potential energy:
| (4) |
Here is the extension of the molecule along the direction z of application of the pulling force. Since we assume the tails to be straight and neglect the curved region connecting the tails and the plectonemes, in the absence of thermal fluctuations, the vertical extension of the filament reads Δz = ℓt = ℓ – ℓp. We can then rewrite
| (5) |
There is no need to consider any potential energy associated with the rotation of the end attached to the bead since the energy will be minimized for a given rotation of the bead using the constraint on the link.
In previous work (9) we solved this elastic rod model by assuming the superhelical radius to be prescribed and extracted its value from experimental data. Here, we take a more principled approach and complement the above elastic equations with a proper model for DNA-DNA interactions in the plectonemes; in particular, this makes it possible to predict the superhelical radius. These interactions are dominated by different physical effects depending on the separation distance between the two DNA superhelices. In the range of separations relevant to extension-rotation experiments, of approximately several nanometers, electrostatic effects dominate. In our model, interactions are limited to the plectonemic phase and are described by an energy contribution of the form
| (6) |
This energy depends on the superhelical parameters R and α, and is proportional to the plectonemic contour length ℓp, and assumed valid when ℓp is much larger than R.
The total energy of the system is defined as the sum of the elastic, potential, and interaction contributions:
| (7) |
It will be minimized subjected to the end rotation constraint given by Eq. 2. This constraint provides an affine relation between n and ℓp and so can be used to eliminate the quantity ℓp in favor of n. Dropping the constant term (−Fextℓ) in the energy, we obtain
| (8) |
Equilibrium equations
The total energy of the system, given by Eq. 8, takes into account the fixed end rotation since Eq. 2 has been used to eliminate ℓp. The equilibria of the rod are then directly given by minimization of V(α, R, τ) with respect to its three arguments. Canceling the first variation of V (that is, writing , and ), we obtain
| (9a) |
| (9b) |
| (9c) |
In the first term of the last equation, we have eliminated τ in favor of Mext using the constitutive relation Mext = K3τ, and thereby removed the twist rigidity from the equations (its value is not known with good accuracy).
The set of three nonlinear expressions in Eq. 9 must be solved for the three unknown values of the parameters α, R, and Mext at equilibrium, given the value of the external force Fext. This requires an interaction potential U(R, α) to be specified, as is done in the next section. The set of expressions in Eq. 9 extends the model of Clauvelin et al. (9), valid for nonpenetrable tubes, to filaments in long-range interaction (such as electrostatic interactions).
Note that the expressions in Eq. 9 do not depend on the number of turns n. As a result, their solution α, R, and Mext do not depend on n either. The equations describe the equilibrium of two phases; increasing n transfers some arc length from the tail phase to the plectonemic phase, without changing their properties. This invariance with respect to n explains the presence of a linear region in the experimental curves, as shown in the next section.
The term in parentheses in Eq. 9c is always positive. This shows that the sign of the chirality χ = ±1 is opposite to that of n: rotating the bead in the positive direction n > 0, for instance, requires a positive torque Mext, hence a negative χ = −1 by this equation (left-handed superhelices).
Vertical extension of the filament
In extension-rotation experiments the vertical extension of the filament is recorded while the number of turns is increased. The formula Δz = ℓt, valid for straight tails, does not holds in the presence of thermal fluctuations. We account for these fluctuations by introducing a rescaled quantity,
| (10) |
where the correcting factor ρwlc is given by the wormlike chain theory (25) as the solution of
| (11) |
Here kB is the Boltzmann constant and T the absolute temperature. Note that this correcting factor ρwlc is not included in the potential energy Vext in Eq. 5.
To write Δzth as a function of the number of turns n, we use the equality Δz = ℓt = ℓ – ℓp in the right-hand side of Eq. 10, and use for ℓp the expression obtained by solving Eq. 2:
| (12) |
Recall that neither α, R, nor τ = Mext/K3 depend on n; as a result, the extension Δzth depends linearly on the number of turns n in the above equation. This linear dependence is a well-known feature of the experimental curves.
DNA-DNA Interactions
In the variational formulation exposed in the previous section, we have introduced an energy U(R, α) describing DNA-DNA interactions. At moderate distances DNA-DNA interactions in solution mainly originate from electrostatic effects between the charged sites of the two molecules (phosphate groups) and between these charged sites and the counter- and coions present in the solution. The theoretical analysis of the long- and short-range interactions between two polyions in solution has been the subject of numerous studies (26,27), and there is currently a regain of interest in this question due to recent progress in single-molecule experiments (see (28) for a review). In this model the interaction energy U(R, α) is specified independently of the mechanical behavior of the molecule. As a result, we can combine the elastic description of the previous sections with different theories for DNA-DNA interactions. In the following, we illustrate this approach using two representative interaction energies U(α, R) that can be found in the literature.
We favor interaction energies U(R, α) that can be expressed in closed analytical form and have no adjustable parameters; this enables us to make predictions and compare them to experiments, rather than to fit existing data. In the literature on DNA-DNA interactions (28–30), we picked two well-established models satisfying those requirements. The first one, UPB(R, α), derives from the Poisson-Boltzmann equation and was obtained by Ubbink and Odijk (31); the second one, UCC(R, α), is based on the counterion condensation theory (32) and was derived by Ray and Manning (33). These two models address the electrostatics of DNA in solution but their treatment of the interactions between DNA and the ions in solution differ substantially.
Poisson-Boltzmann model
In their study of supercoiled DNA plasmids (31), Ubbink and Odijk derive an analytical expression for the electrostatic interaction energy between two interwound DNA molecules. Their work is based on the Poisson-Boltzmann framework (PB); in the computation of the electrostatic repulsion of the two charged molecules, the presence of the counterions and coions in solution is considered. It has been shown in Stigter (34) that the nonlinear PB problem could be simplified to a linear one by considering screened (Debye-Hückel-like) potentials and renormalized linear charge densities ν. The value of the effective charge ν is obtained by matching the solution of the nonlinear PB equation with the solution of the linear PB equation in the far-field region. However, there is no consensus on the exact value of this effective charge and the various numerical (35,36) or analytical (37,38) studies yield scattered results.
Ubbink and Odijk (31) compute the electrostatic interaction energy per unit length as
| (13a) |
where the angular dependence reads
| (13b) |
Here, kB is the Boltzmann constant, T the temperature in Kelvin, ν the effective linear charge density (in m−1), lB the Bjerrum length, and κD−1 the Debye length. For a typical temperature T = 300 K, we have lB = 0.7 nm, and for a monovalent salt concentration c = 10 mM, the Debye length is κD−1 = 3.07 nm. The value of the effective charge ν depends on salt concentration. Its value for a monovalent salt concentration c = 10 mM is taken as ν = 1.97 nm−1, according to Ubbink and Odijk (31).
The calculation of the interaction energy can be simplified by taking α = 0, hence ϕ(α) = ϕ(0) = 1, which amounts to considering two straight and parallel molecules; this approximation has been used, for instance, in Marko and Siggia (35). In the rest of the article, will refer to the potential obtained under this approximation, namely .
Ray and Manning model
The interaction energy derived by Ray and Manning (33) is based on the counterions condensation theory (32). The authors examine the interaction of two straight and parallel DNA molecules with charged sites in solution (the dependence on the superhelical angle α is neglected). The main point of the theory is to consider that part of the DNA bare charge is neutralized by the condensation of the counterions around the molecule. The energy is the sum of three terms: interactions between pairs of charged sites belonging to the same DNA segment; interactions between pairs of charged sides located on opposite segments; and adsorption energy of the counterions onto the molecule. Three cases are considered, namely short, intermediate, and long interaxial distances between the molecules. The short distance case, below the crystallographic radius of DNA, is not relevant to our analysis. The intermediate case introduces an adjustable parameter, which we try to avoid. Consequently we only use the long-range case, relevant for interdistances larger than the Debye length; in our notations it writes
| (14) |
where b = 0.17 nm is the charge spacing parameter of the DNA molecule, and ξ = lB/b is the dimensionless charge density of DNA (ξ = 4.11 at T = 300 K). The function B0K(x) is the modified Bessel function of the second kind and order 0.
Results
We solve the expressions in Eq. 9 for the superhelical radius R, angle α, and external torque Mext, using one of the interaction energies UPB, , or UCC. These equations are nonlinear and their roots are found numerically using a Newton-Raphson algorithm. We present the results for the superhelical variables R and α in Fig. 2, for the torsional moment Mext in Fig. 3. We also plot derived quantities, to be defined later, such as the slope q of the extension-rotation curves in Fig. 4, and the thermal buckling threshold n★ later in Fig. 6. We compare our results with the model of Moroz and Nelson (20) and with experimental data. To ease comparison with our previous work (9), we use the same set of experimental data. These data were obtained on a 48-kbp λ-phage DNA molecule in a 10 mM phosphate buffer.
Figure 2.
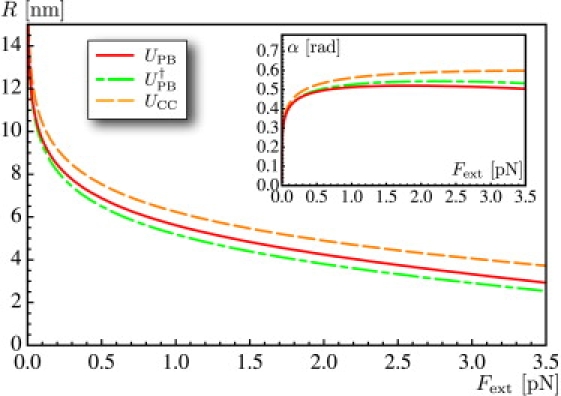
Computed values of the superhelical radius R and angle α (inset) as functions of the pulling force Fext, using one of the interaction energies UPB, , or UCC. These plots are obtained by solving the equilibrium expressions in Eq. 9 for each value of the pulling force Fext. The function α(Fext) decreases for all interaction energies at large enough forces—with the energy UCC, this decrease occurs beyond the domain of forces shown in the figure.
Figure 3.
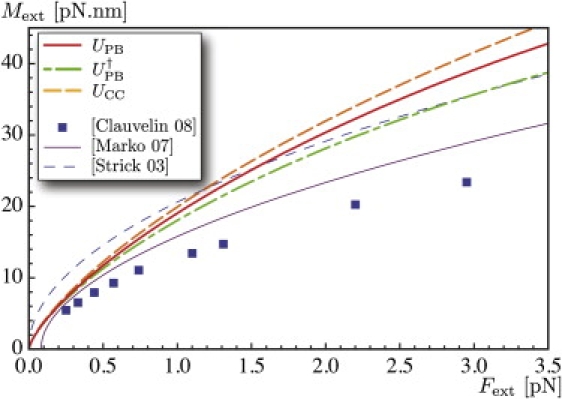
Computed values of the torsional moment in the molecule Mext as a function of the pulling force Fext. We compare the results of this model using the interaction potentials UPB, or UCC, to predictions in Marko (20), namely Marko's Eq. 17 with A = 50 nm, C = 95 nm, and P = 28 nm, and Strick et al. (42), and results from our previous work (9).
Figure 4.
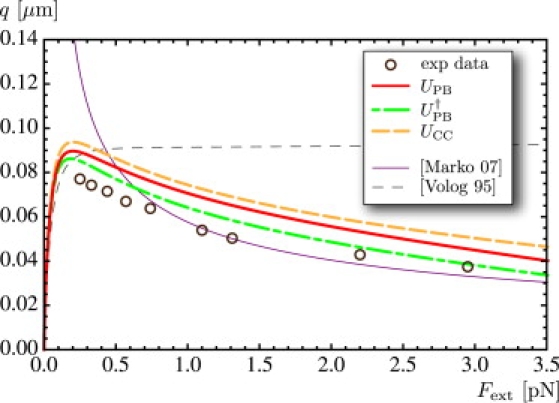
Computed values of the slope of the plectonemic region q as a function of the pulling force Fext. Experimental points (circles) are extracted from the experimental hat curves shown in Fig. 2 of Clauvelin et al. (9). The thin purple curve is obtained from the theory in Marko (20), using the same parameter values as in Fig. 3. The thin dashed curve is drawn using a hard-core potential with effective radius R = 7.85 nm (36).
Figure 6.
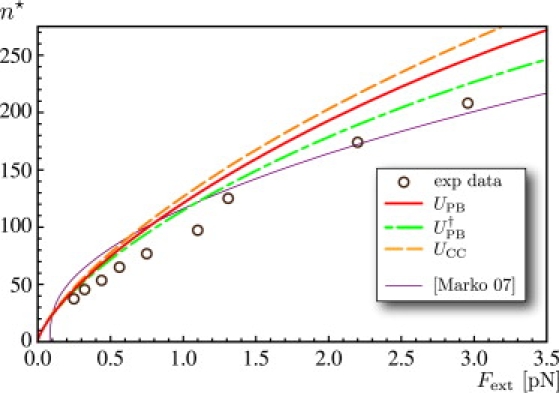
Computed values of the number of turns n★ at the transition as a function of the pulling force Fext, using K3 = 95 nm kBT. Experimental points (circles) are extracted from the curves shown in Fig. 2 of Clauvelin et al. (9). The thin purple curve is obtained from the theory in Marko (20), using the same parameter values as in Fig. 3.
With the interaction energies used in this article, we find that the nonlinear equations have two roots below a threshold value of the force, and no root above. For a salt concentration c = 10 mM, this threshold value of the force is 4.7 pN using UPB, 4.9 pN using , and 6.9 pN using UCC; all these values are above the maximum pulling force applied in typical experiments. We have studied the stability of the two solutions corresponding to the two roots of our equations when the force is below threshold, and found that that with lower α, R is unstable; the other one is stable. We study and plot the latter in the following.
When the force reaches its threshold value, an instability occurs and the stable solution disappears by merging with the unstable one. For larger forces, no stable solution exists and the two helical parts collapse. This may be related to the observation of tightly supercoiled configurations in Bednar et al. (39). The collapse arises when the electrostatic interaction is no longer strong enough to sustain the applied force; the description of collapsed solutions would require an account of hard-core repulsion and other short-range forces.
Superhelical geometry
The quantities R and α are plotted in Fig. 2 as a function of the applied force Fext. The curves R(Fext) and α(Fext) obtained for the different interaction energies UPB, , or UCC are close over the entire range of forces. As will be confirmed later, the predictions based on the different interaction models are all very similar.
As expected, the superhelical radius decreases with the pulling force; note that it becomes less than the Debye length for forces larger than Fext ≈ 2.5 pN. Variation of the supercoiling radius with the applied pulling force invalidates the hard-core approximation of electrostatics interactions, where a constant supercoiling radius is used. Nevertheless, this hard-core approximation is used in some DNA chain models (16,36). The superhelical angle α is known to be a control parameter in the action of the topoisomerases (40). It is plotted in the inset of Fig. 2. In contrast with models of elastic tubes in contact (41), where α increases monotonically and reaches the value π/4 asymptotically at large forces, we find here that it reaches a maximum well below π/4 and then decreases, due to long-range forces. This decrease has already been observed in Clauvelin et al. (9), where the value of the superhelical angle was extracted from experimental data.
Torsional moment
Recall that the torque Mext = K3τ applied by the bead to impose a rotation 2πn does not depend on the number of turns n, see Eq. 9. This quantity is plotted in Fig. 3 as a function of the pulling force Fext. We compare our results 1), with Eq. 17 in Marko (20); 2), with a formula obtained when approximating the plectonemes by a chain of circles (19,42); and 3), with our previous study (9) based on hard-wall interactions. Even though the literature (9,20,42) does not address long-range interactions, all the curves reveal a similar behavior: the moment increases monotonically with the applied force, with a decreasing slope. However, our results show that long-range interactions significantly increase the value of the moment required to achieve a given rotation.
Extension-rotation curve
Our model predicts that the derivative of the vertical extension Δzth with respect to n is constant, i.e., that the extension-rotation curve is linear in the regime of large rotations that we consider. This linear regime is well-known experimentally (see Fig. 5). From Eq. 12, the slope q is given by
| (15) |
Figure 5.
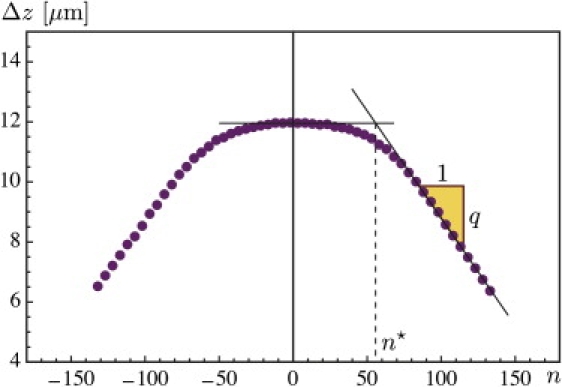
Experimental curve showing the vertical extension Δzexp of a λ-phage DNA 48-kbp molecule as a function of the imposed number of turns n, at constant force Fext = 0.44 pN. The quantity Δzth(n) defined in Eq. 12 is our prediction for the linear part of the experimental curve. The number of turns at the transition n★ and the slope q are also shown.
Its value is computed using the values of α and R obtained earlier by solving the equilibrium equations. In Fig. 4, we plot the slope q as a function of the force, for the three interaction energies. For comparison, we also plot 1), the slope predicted by Marko's model (20); 2), the slope obtained with replacing the electrostatic interaction energy U(R, α) by a hard-core potential with effective radius R = 7.85 nm (36); and 3), the slope read off directly from experimental extension-rotation curves (these experimental data were kindly provided by V. Croquette and have appeared in Fig. 2 of our previous study (9) and in other literature (10,20)).
Our model shows good agreement with the experimental data, which are reproduced in a more consistent manner, especially at low forces, than in Marko (20). In this reference, hard-wall interactions are used with a supercoiling radius independent of the pulling force; this may be the cause of the poorer agreement with experimental data at low forces, when long-range interactions dominate.
A typical extension-rotation curve comprises two regions: a linear region for large n, which we have been discussing so far, and a parabolic region at low n studied in Moroz and Nelson (43). The central region is dominated by thermal effects and will not be addressed here. However, we can characterize the transition between the two regions. The number n★ of turns at which the transition occurs is defined using the linear extrapolations shown in Fig. 5. This n★ corresponds to the onset of the plectonemic regime. In our model, it is computed by setting ℓp = 0 in Eq. 2; this yields n★ = τℓ/(2π). Recall that the value of τ = Mext/K3 is computed from the equilibrium expressions in Eq. 9. In Fig. 6, we plot the value of n★ as a function of the force and compare to the values extracted from the experimental curve as well as the value from the theory in Marko (20).
Discussion and Conclusion
In the previous section, we found that the solutions disappear above a threshold value of the pulling force. This can be interpreted as the fact that the physical solution involves a very short interdistance, although we have retained the long-distance part of Ray and Manning's potential only. This can be cured, in principle, by restoring a complete expression of the potential given in Ray and Manning (33). (Except in the long-distance part used here, Ray and Manning's potential involves physical quantities that are unknown.) In its complete form, the potential is nonmonotonous and several interdistances are possible for a given value of the control parameter. This feature indicates the possibility of a transition from a classical supercoiled state to a tight supercoiled state. A possibly related transition has been reported in experiments (39). When used in conjunction with the complete Ray and Manning's potential, our model could provide a bridge between the analytical expression for the potential and the experiments, and provide a quantitative account of the transition.
Some models for DNA supercoiling replace electrostatics interactions with hard-core interactions between tubes with effective radius; see, e.g., Vologodskii and Marko (16). This effective radius is salt-dependent and is tabulated before supercoiling computations. We have used such a hard-core potential, using the value R = 7.85 nm (36), and found that the predicted slope q was in complete disagreement with experimental data (see Fig. 4).
We have presented an analytical model for DNA supercoiling in extension-rotation experiments. It is based on an elastic description of DNA deformations, carefully accounts for DNA-DNA interactions in the plectonemic region, and makes use of a valid formula for the link. DNA interactions are modeled using long-range forces computed from potentials available from the literature. Their description is compartmentalized from the rest of the theory, which makes it possible to test different interaction energies. We have used our model in combination with two interaction energies. These energies come from different physical contexts and are widely used in the literature. Using either one, we find good agreement with experimental data without adjusting any parameter. This suggests 1), that using yet another energy for electrostatic interactions would yield comparable results; and 2), that DNA tertiary structures are determined to a large extent by the elasticity of the molecule and do not depend heavily on the details of the interaction model. The extension-rotation experiments that are now routinely performed can then be viewed as a way to probe the elastic properties of the molecule. Given that the mechanics of DNA under combined twist and tension can be captured by a relatively simple analytical model, an interesting direction for future research is to extend this model to the mechanical action of proteins, such as RecA, for example, on supercoiled DNA.
Acknowledgments
S.N. thanks Armand Ajdari (Centre National de la Recherche Scientifique) for starting discussions on the subject of electrostatic repulsion in DNA supercoiling.
References
- 1.Koster D.A., Croquette V., Dekker C., Shuman S., Dekker N.H. Friction and torque govern the relaxation of DNA supercoils by eukaryotic topoisomerase IB. Nature. 2005;434:671–674. doi: 10.1038/nature03395. [DOI] [PubMed] [Google Scholar]
- 2.Revyakin A., Ebright R.H., Strick T.R. Promoter unwinding and promoter clearance by RNA polymerase: detection by single-molecule DNA nanomanipulation. Proc. Natl. Acad. Sci. USA. 2004;101:4776–4780. doi: 10.1073/pnas.0307241101. [DOI] [PMC free article] [PubMed] [Google Scholar]
- 3.Smith S.B., Finzi L., Bustamante C. Direct mechanical measurements of the elasticity of single DNA molecules by using magnetic beads. Science. 1992;258:1122–1126. doi: 10.1126/science.1439819. [DOI] [PubMed] [Google Scholar]
- 4.Strick T.R., Allemand J.-F., Bensimon D., Bensimon A., Croquette V. The elasticity of a single supercoiled DNA molecule. Science. 1996;271:1835–1837. doi: 10.1126/science.271.5257.1835. [DOI] [PubMed] [Google Scholar]
- 5.Bustamante C., Macosko J.C., Wuite G.J.L. Grabbing the cat by the tail: manipulating molecules one by one. Nat. Rev. Mol. Cell Biol. 2000;1:130–136. doi: 10.1038/35040072. [DOI] [PubMed] [Google Scholar]
- 6.Charvin G., Allemand J.-F., Strick T., Bensimon D., Croquette V. Twisting DNA: single molecule studies. Contemp. Phys. 2004;45:383–403. [Google Scholar]
- 7.Deufel C., Forth S., Simmons C.R., Dejgosha S., Wang M.D. Nanofabricated quartz cylinders for angular trapping: DNA supercoiling torque detection. Nat. Methods. 2007;4:223–225. doi: 10.1038/nmeth1013. [DOI] [PubMed] [Google Scholar]
- 8.Ritort F. Single-molecule experiments in biological physics: methods and applications. J. Phys. Condens. Matter. 2006;18:R531–R583. doi: 10.1088/0953-8984/18/32/R01. [DOI] [PubMed] [Google Scholar]
- 9.Clauvelin N., Audoly B., Neukirch S. Mechanical response of plectonemic DNA: an analytical solution. Macromolecules. 2008;41:4479–4483. [Google Scholar]
- 10.Neukirch S. Extracting DNA twist rigidity from experimental supercoiling data. Phys. Rev. Lett. 2004;93:198107. doi: 10.1103/PhysRevLett.93.198107. [DOI] [PubMed] [Google Scholar]
- 11.Coleman B.D., Swigon D. Theory of self-contact in Kirchhoff rods with applications to supercoiling of knotted and unknotted DNA plasmids. Philos. Trans. Royal Soc. A Math. Phys Eng. Sci. 2004;362:1281–1299. doi: 10.1098/rsta.2004.1393. [DOI] [PubMed] [Google Scholar]
- 12.Goyal S., Perkins N.C., Lee C.L. Nonlinear dynamics and loop formation in Kirchhoff rods with implications to the mechanics of DNA and cables. J. Comput. Phys. 2005;209:371–389. [Google Scholar]
- 13.Purohit P.K. Plectoneme formation in twisted fluctuating rods. J. Mech. Phys. Solids. 2008;56:1715–1729. [Google Scholar]
- 14.Fain B., Rudnick J., Östlund S. Conformations of linear DNA. Phys. Rev. E Stat. Phys. Plasmas Fluids Relat. Interdiscip. Topics. 1997;55:7364–7368. doi: 10.1103/physreve.60.7239. [DOI] [PubMed] [Google Scholar]
- 15.Bouchiat C., Mézard M. Elastic rod model of a supercoiled DNA molecule. Eur. Phys. J. E. 2000;2:377–402. [Google Scholar]
- 16.Vologodskii A.V., Marko J.F. Extension of torsionally stressed DNA by external force. Biophys. J. 1997;73:123–132. doi: 10.1016/S0006-3495(97)78053-6. [DOI] [PMC free article] [PubMed] [Google Scholar]
- 17.Rossetto V., Maggs A.C. Writhing geometry of open DNA. J. Chem. Phys. 2003;118:9864–9874. [Google Scholar]
- 18.Neukirch S., Starostin E.L. Writhe formulas and antipodal points in plectonemic DNA configurations. Phys. Rev. E. 2008 doi: 10.1103/PhysRevE.78.041912. In press. [DOI] [PubMed] [Google Scholar]
- 19.Moroz J.D., Nelson P. Entropic elasticity of twist-storing polymers. Macromolecules. 1998;31:6333–6347. [Google Scholar]
- 20.Marko J.F. Torque and dynamics of linking number relaxation in stretched supercoiled DNA. Phys. Rev. E Stat. Nonlin. Soft Matter Phys. 2007;76:021926. doi: 10.1103/PhysRevE.76.021926. [DOI] [PubMed] [Google Scholar]
- 21.Klenin K.V., Vologodskii A.V., Anshelevich V.V., Dykhne A.M., Frank-Kamenetskii M.D. Computer simulation of DNA supercoiling. J. Mol. Biol. 1991;217:413–419. doi: 10.1016/0022-2836(91)90745-r. [DOI] [PubMed] [Google Scholar]
- 22.Marko, J. F. 2008. Micromechanics of single supercoiled DNA molecules. In Proceedings of the Institute of Mathematics and its Applications. In press.
- 23.Hunt N.G., Hearst J.E. Elastic model of DNA supercoiling in the infinite-length limit. J. Chem. Phys. 1991;95:9329–9336. [Google Scholar]
- 24.Love A.E.H. 4th Ed. Dover Publications; Mineola, New York: 1944. A Treatise on the Mathematical Theory of Elasticity. [Google Scholar]
- 25.Marko J.F., Siggia E.D. Stretching DNA. Macromolecules. 1995;28:8759–8770. [Google Scholar]
- 26.Brenner S.L., Parsegian V.A. A physical method for deriving the electrostatic interaction between rod-like polyions at all mutual angles. Biophys. J. 1974;14:327–334. doi: 10.1016/S0006-3495(74)85919-9. [DOI] [PMC free article] [PubMed] [Google Scholar]
- 27.Podgornik R., Parsegian V.A. Molecular fluctuations in the packing of polymeric liquid crystals. Macromolecules. 1990;23:2265–2269. [Google Scholar]
- 28.Kornyshev A.A., Lee D.J., Leikin S., Wynveen A. Structure and interactions of biological helices. Rev. Mod. Phys. 2007;79:943–996. [Google Scholar]
- 29.Oosawa F. Interaction between parallel rodlike macroions. Biopolymers. 1968;6:1633–1647. [Google Scholar]
- 30.Téllez G., Trizac E. Exact asymptotic expansions for the cylindrical Poisson-Boltzmann equation. J. Stat. Mech. Theor. Exp. 2006 [Google Scholar]
- 31.Ubbink J., Odijk T. Electrostatic-undulatory theory of plectonemically supercoiled DNA. Biophys. J. 1999;76:2502–2519. doi: 10.1016/S0006-3495(99)77405-9. [DOI] [PMC free article] [PubMed] [Google Scholar]
- 32.Manning G.S. Limiting laws and counterion condensation in polyelectrolyte solutions. I. Colligative properties. J. Chem. Phys. 1969;51:924–933. [Google Scholar]
- 33.Ray J., Manning G.S. An attractive force between two rodlike polyions mediated by the sharing of condensed counterions. Langmuir. 1994;10:2450–2461. [Google Scholar]
- 34.Stigter D. Interactions of highly charged colloidal cylinders with applications to double-stranded DNA. Biopolymers. 1977;16:1435–1448. doi: 10.1002/bip.1977.360160705. [DOI] [PubMed] [Google Scholar]
- 35.Marko J.F., Siggia E.D. Statistical mechanics of supercoiled DNA. Phys. Rev. E Stat. Phys. Plasmas Fluids Relat. Interdiscip. Topics. 1995;52:2912–2938. doi: 10.1103/physreve.52.2912. [DOI] [PubMed] [Google Scholar]
- 36.Vologodskii A., Cozzarelli N. Modeling of long-range electrostatic interactions in DNA. Biopolymers. 1995;35:289–296. doi: 10.1002/bip.360350304. [DOI] [PubMed] [Google Scholar]
- 37.Stroobants A., Lekkerkerker H.N.W., Odijk T. Effect of electrostatic interaction on the liquid crystal phase transition in solutions of rodlike polyelectrolytes. Macromolecules. 1986;19:2232–2238. [Google Scholar]
- 38.Trizac E., Bocquet L., Aubouy M. Simple approach for charge renormalization in highly charged macroions. Phys. Rev. Lett. 2002;89:248301. doi: 10.1103/PhysRevLett.89.248301. [DOI] [PubMed] [Google Scholar]
- 39.Bednar J., Furrer P., Stasiak A., Dubochet J., Egelman E.H. The twist, writhe and overall shape of supercoiled DNA change during counterion-induced transition from a loosely to a tightly interwound superhelix. Possible implications for DNA structure in vivo. J. Mol. Biol. 1994;235:825–847. doi: 10.1006/jmbi.1994.1042. [DOI] [PubMed] [Google Scholar]
- 40.Neuman K.C. Untwisting and untangling DNA: symmetry breaking by topoisomerases. FASEB J. 2008;22 261.3. [Google Scholar]
- 41.Neukirch S., van der Heijden G. Geometry and mechanics of uniform N-plies: from engineering ropes to biological filaments. J. Elast. 2002;69:41–72. [Google Scholar]
- 42.Strick T.R., Dessinges M.-N., Charvin G., Dekker N.H., Allemand J.-F. Stretching of macromolecules and proteins. Rep. Prog. Phys. 2003;66:1–45. [Google Scholar]
- 43.Moroz J.D., Nelson P. Torsional directed walks, entropic elasticity, and DNA twist stiffness. Proc. Natl. Acad. Sci. USA. 1997;94:14418–14422. doi: 10.1073/pnas.94.26.14418. [DOI] [PMC free article] [PubMed] [Google Scholar]