

Abstract
We investigated the coupling between glycolytic and mitochondrial membrane potential oscillations in Saccharomyces cerevisiae under semianaerobic conditions. Glycolysis was measured as NADH autofluorescence, and mitochondrial membrane potential was measured using the fluorescent dye 3,3′-diethyloxacarbocyanine iodide. The responses of glycolytic and membrane potential oscillations to a number of inhibitors of glycolysis, mitochondrial electron flow, and mitochondrial and plasma membrane H+-ATPase were investigated. Furthermore, the glycolytic flux was determined as the rate of production of ethanol in a number of different situations (changing pH or the presence and absence of inhibitors). Finally, the intracellular pH was determined and shown to oscillate. The results support earlier work suggesting that the coupling between glycolysis and mitochondrial membrane potential is mediated by the ADP/ATP antiporter and the mitochondrial F0F1-ATPase. The results further suggest that ATP hydrolysis, through the action of the mitochondrial F0F1-ATPase and plasma membrane H+-ATPase, are important in regulating these oscillations. We conclude that it is glycolysis that drives the oscillations in mitochondrial membrane potential.
Introduction
Oscillatory behavior is known to occur in many different biological settings. Some examples are the circadian rhythms, the mitotic oscillator, oscillations in cyclic AMP in Dictyostelium cells, and oscillations in free calcium in numerous types of cells (1). In addition, many metabolic processes are known to oscillate (2–7). The best-known metabolic oscillator is probably glycolysis in the yeast strain Saccharomyces cerevisiae, but oscillating glycolysis is also found in other cells, e.g., muscle cells and pancreatic β-cells (3).
Mitochondria are best known for their role in energy metabolism. However, it has recently become clear that mitochondria serve many other functions in the cell. In some cells, e.g., neutrophils, the mitochondria are responsible only for a minor part of the ATP production. Instead, it appears that these organelles participate in calcium homeostasis and in apoptosis (8–10). In pancreatic β-cells, the mitochondria serve an important role in the regulation of insulin production, in addition to providing the cells with ATP. Glycolytic oscillations in β-cells are in part regulated by the mitochondria. The resulting oscillations in ATP in turn regulate ion channels in the plasma membrane, generating an oscillating membrane potential, which again controls oscillations in cytoplasmic free calcium and the release of insulin (11). Recently, we reported a similar coupling between an oscillating glycolysis in S. cerevisiae and mitochondrial membrane potential (Δψm) (12,13). It is not yet known whether it is the same coupling that is responsible for other oscillations involving mitochondria, e.g., the synchronized oscillations observed in respiration of S. cerevisiae in continuous culture (14–16). Under those circumstances, mitochondrial function seems to regulate a number of cellular processes, because it was shown that the majority of metabolites in the cells show oscillatory dynamics with 70% of the identified metabolites peaking in conjunction with nicotinamide adenine dinucleotide (NAD(P)H) (17).
Oscillations in yeast glycolysis, as observed in oscillations in NADH autofluorescence, involve anaerobic or semianaerobic conditions (18–21). The latter implies that cyanide has been added to the cells to arrest respiration. Glycolytic oscillations in yeast represent a collective phenomenon. Thus, a single isolated cell displays no oscillations, whereas a suspension of yeast cells will show oscillations, in which all cells oscillate in phase when a certain critical cell density is reached (22,23). This contrasts with the observed oscillations in NAD(P)H and Δψm in single yeast cells under aerobic conditions, which, despite individual cells being synchronized, apparently are independent of cell density (24).
The oscillations in yeast glycolysis are accompanied by oscillations in Δψm (12). However, the mechanism responsible for these membrane potential oscillations is not yet fully understood. Furthermore, it remains uncertain whether the phenomenon represents a coupling between two autonomous oscillators (24,25)—glycolysis and mitochondria—or whether glycolysis drives the oscillations in Δψm. A coupling between yeast glycolysis and Δψm was previously proposed to involve the mitochondrial ADP/ATP antiporter, the F0F1-ATPase, and possibly also components of the respiratory chain (13). This conjecture was based on the observed effects of the inhibitors atractyloside and dicyclohexylcarbodiimide (DCCD). Atractyloside inhibits the mitochondrial ADP/ATP antiporter (26), whereas DCCD inhibits the proton translocating F0F1-ATPase at low concentrations, but seems to have more unspecific effects on respiration at higher concentrations (27,28). High concentrations (100 μM or more) of DCCD have also been shown to inactivate the plasma membrane H+-ATPase of the yeast Kluyveromyces lactis (29). Thus, the observed effect of DCCD on the oscillations (13) could also be due to an effect on this enzyme in S. cerevisiae.
In our study, we have performed simultaneous measurements of oscillations in NADH and Δψm in S. cerevisae, and we have investigated the effect of various inhibitors of glycolysis, mitochondrial electron transport, and mitochondrial and plasma membrane H+-ATPases on the oscillations. We found that NADH and Δψm oscillate in phase. Furthermore, we have found that inhibitors of mitochondrial electron transport have no effect on oscillations in neither NADH nor Δψm, whereas inhibitors of glycolysis inhibit both types of oscillations. Inhibitors of plasma membrane H+-ATPases seem to stimulate the amplitude of oscillations in Δψm at low concentrations, but they inhibit them at higher concentrations. Moreover, we have measured intracellular pH and found that, in addition to showing fairly large changes (up to 0.5 pH unit) because of the action of the two H+-ATPases and the formation of HCO3-, intracellular pH (pHi) also oscillates. These oscillations are due either to oscillations in bicarbonate or to the activity of the plasma membrane H+-ATPase. Our results are in agreement with the idea that it is glycolysis that drives the oscillations in Δψm. Furthermore, our results show that the activities of mitochondrial and plasma membrane proteins are important for the control of glycolysis, and they suggest that the ATP/ADP ratio is the link between the two oscillating systems.
Materials and Methods
Reagents
All reagents were purchased from Sigma-Aldrich (Munich, Germany), except for the fluorescent probes 3,3′-diethyloxacarbocyanine iodide (DiOC2(3)) and 2′,7′-bis (2-carboxyethyl), 5 (and -6) carboxyfluorescein (BCECF), which were obtained from Molecular Probes (Eugene, OR), and the ATP determination kit, which was obtained from Biaffin (Kassel, Germany).
Yeast cells
Yeast cells, Saccharomyces cerevisiae diploid strain X2180, were grown and harvested as described in Poulsen et al. (21). The cells were starved for 3 h at room temperature in 100 mM sodium phosphate buffer, pH 6.8, before use. In all measurements, except for measurements of plasma membrane H+-ATPase activity and intracellular pH (see section, Measurements of intracellular pH), the cells were suspended in 100 mM phosphate buffer, pH 6.8.
Mass spectrometric measurements of oxygen consumption and CO2 and ethanol production
Measurements of the consumption of oxygen and the production of CO2 and ethanol were conducted by use of membrane inlet mass spectrometry, as described in Poulsen et al. (21).
Omeprazole treatment and measurements of proton pumping in intact yeast cells
Omeprazole was dissolved in 0.1 N HCl and left for at least 10 min before being added to the yeast suspension. Yeast cells were suspended in 250 mM sorbitol, and various amounts of omeprazole solution were added to the suspension (concentration range 0–250 μM). The pH was adjusted with HCl at 3.0–3.2. After 10 min the suspension of cells was centrifuged at 18,000 rpm for 2 min in a small bench top centrifuge (Ole Dich Instrumentmakers, Copenhagen, Denmark). The resulting pellet was resuspended in fresh 250 mM sorbitol for measurements of proton pumping activity, or in 100 mM phosphate buffer, pH 6.8, for measurements of NADH and Δψm or pHi.
To measure proton pumping activity, the cells were first suspended in 100 mM phosphate buffer and stored on ice for 2 h to reduce metabolic activity to a minimum. They were then treated with omeprazole as described above and resuspended in 250 mM sorbitol to a density of 2% wet weight. The initial pH was adjusted with HCl or NaOH to pH 5.1, and 30 mM glucose was added to the suspension. The rate of proton pumping was measured as the initial slope of the pH-change immediately after addition of glucose. pH was measured either using a pH-meter or by recording the fluorescence of 2′,7′-bis (2-carboxyethyl), 5 (and -6) BCECF (excitation 470/20 nm, emission 540/10 nm), using the Ocean Optics QE65000 spectrometer (see section, Fluorescence measurements).
Measurements of intracellular pH
Measurements of the pHi in a suspension of yeast cells with oscillating glycolysis were performed essentially as described by Halm et al. (30): To a 2 mL suspension of yeast cells (10% wet weight) were added 3 μL of 4.5 mM 5- (and -6-) carboxyfluorescein diacetate succinimidyl ester (CFSE) in dimethyl sulfoxide. The suspension was mixed thoroughly and incubated at 40°C for 20 min. and then immediately centrifuged at 7000 × g for 3 min. The supernatant was discarded and the pellet was suspended in 100 mM phosphate buffer, pH 6.8, unless otherwise indicated, and stored at 4°C until use. pHi was measured as the ratio of the emissions at 520/1 nm, using excitations of 490/3 nm and 435/3 nm, respectively (30,31). A calibration curve was constructed by first permeabilizing the cells with 70% ethanol for 30 min at 30°C (30). The cells were then resusupended in a citric acid/sodium phosphate buffer at pH values ranging from 5.5 to 8.5 and stained with 5- (and -6-) CFSE, as described above. The calibration curve is shown in Fig. S1 in the Supporting Material. The data could be fitted to a Henderson-Hasselbalch type equation:
| (1) |
The number 2 represents the limit of at low pH. The relationship between pH and R490/435 found in our study is essentially identical to that found by Halm et al. (30).
Measurements of intracellular ATP
Measurements of the average intracellular ATP concentration were made by first quenching the cells with boiling buffered ethanol and subsequently extracting the metabolites as described by Gonzales et al. (32). The ATP concentration in the extract was then measured using the Biaffin ATP determination kit. The cells' protein content was determined according to Lowry et al. (33).
Fluorescence measurements
Simultaneous measurements of NADH autofluorescence and membrane potential-dependent DiOC2(3) fluorescence were made in a QE65000 spectrometer (Ocean Optics, Dunedin, FL) fitted with a temperature-controlled cuvette holder. Temperature was 25 ± 0.02°C. Light was supplied by two Hg-lamps (model St75; Heraeus, Hanau, Germany) powered by two NT HgSt power supplies (Duratec Analysentechnik, GmBH, Hockenheim, Germany). The light from the lamps was guided to the measuring cell using optical fibers (Rapp Optoelectronic, GmBH, Hamburg, Germany) mounted perpendicular to the emission light beam. NADH was excited using an interference filter (355/20 nm) (Edmund Optics Inc., Barrington, NJ), and the emission was measured as the average intensity in the wavelength range 445–470 nm. DiOC2(3) was excited using an Edmund Optics interference filter (500/24 nm), and the emission was measured as the average intensity in the wavelength range 580–620 nm or as the average fluorescence intensity in the range 530–550 nm. A plot of the average fluorescence in the range 530–550 nm against the average fluorescence in the range 580–620 nm gave a straight line with positive slope (data not shown). The autofluorescence measurements of NADH at wavelengths 530–550 nm and 580–620 nm were also taken and found to be negligible compared with the fluorescence of DiOC2(3) at these wavelengths; thus, there was no need to correct for contributions from NADH fluorescence. The pH-dependent fluorescence of BCECF was measured using an Edmund Optics interference filter (472/20) for excitation, and the emission was measured as the average fluorescence intensity in the range 530–550 nm. NADH autofluorescence (excitation 366/3 nm, emission 450/10 nm) and membrane potential-dependent DiOC2(3) fluorescence (excitation 488/3 nm, emission 600/3 nm) were also measured by an FS910 spectrofluorometer (Edinburgh Instruments, Edinburgh, Scotland). Measurements of intracellular pH were performed with the Edinburgh FS910 spectrofluorometer by measuring the ratio of the excitations at 490/3 nm over the excitation at 435/3 nm (emission 520/1 nm). Thus, pHi had to be measured in two separate experiments. The advantage of using the Ocean Optics spectrofluorometer is that this instrument allows for simultaneous measurements of two events such as NADH fluorescence and the fluorescence from DiOC2(3). However, the sensitivity of this instrument is a factor 102 lower than the sensitivity of the Edinburgh Instruments spectrofluorometer. The cells were suspended in a stirred 2 mL sample in a 1 cm ×1 cm × 4.5 cm quartz cuvette. When measuring mitochondrial membrane potential, cells were supplied with 2–6 μM DiOC2(3) at time 0, as described in Andersen et al. (12).
All experiments shown were repeated 3–5 times and were very reproducible.
Results
Measurements of oscillations of NADH and Δψm
Our previous work has shown that the red fluorescence of the carbocyanine dye DiOC2(3) measures almost exclusively Δψm (12). Fig. 1, A–D shows the simultaneous measurements of NADH and Δψm. An increase in DiOC2(3) fluorescence corresponds to hyperpolarization of the membrane potential, whereas a decrease in fluorescence corresponds to a depolarization of membrane potential (12). We noted that there is no apparent phase shift in the two oscillations (Fig. 1, C and D). This observation is substantiated by the phase plot (Fig. 1 E) that reveals a straight line. Similar measurements of green fluorescence of DiOC2(3) (530–550 nm), as well as measurements using a lower concentration (2 μM) of the dye DiOC2(3), gave identical results to those shown in Fig. 1. Thus, because the signal/noise ratio is higher using the spectral region 530–550 nm, we performed the remaining measurements of Δψm using this green fluorescence. This also allowed us to use concentrations of the dye down to 2 μM, which is well below the critical toxic limit of 6 μM (12).
Figure 1.
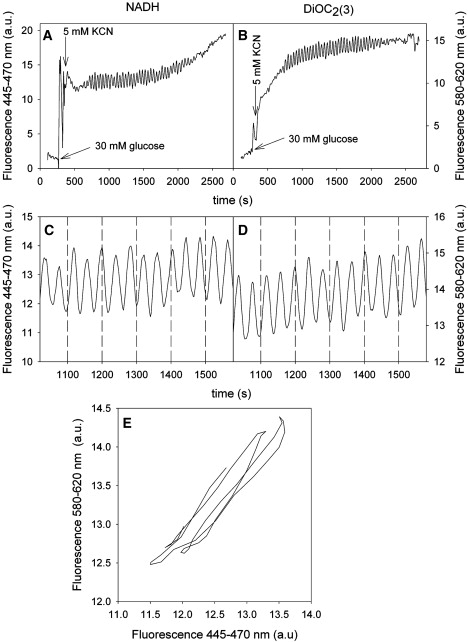
Time series of NADH fluorescence (A, C), DiOC2(3) fluorescence (B, D), and phase plot of DiOC2(3) fluorescence vs. NADH fluorescence (E). Yeast cells were suspended in 100 mM phosphate buffer, pH 6.8, to a cell density of 10% wet weight. At time 0, 4 μM DiOC2(3) were added to the suspension. At times ∼180 s and 240 s, 30 mM glucose and 5 mM KCN were added to the suspension, respectively. Temperature, 25°C.
We have previously shown (12,13) that the oscillations in NADH and Δψm are tightly coupled and that the only way to uncouple them is by adding carbonylcyanide p-trifluoromethoxyphenylhydrazone (FCCP). Immediately after addition of 20 μM FCCP, Δψm is dissipated, whereas the oscillations in NADH continue relatively unaffected (12). Here we have investigated how the oscillations of NADH and Δψm respond to incubating the yeast cells with low and high concentrations of FCCP. Fig. 2 shows the effect on NADH oscillations and oscillations in Δψm of preincubating yeast cells for 10 min with low concentrations (≤1μM) of FCCP. Note that, whereas the size of Δψm and the amplitude of its oscillations decrease (right panel), the size of the autofluorescence of NADH and the amplitude of its oscillations are relatively unaffected by FCCP at these low concentrations (left panel). We were unable to detect any effect of FCCP on the frequency of either of the two types of oscillations. Whereas higher concentrations of FCCP only have the immediate effect of dissipating Δψm, leaving the oscillations in NADH intact (12), we found in our study that exposure to more than 5 μM FCCP for 10 min annihilates oscillations of both NADH and Δψm (data not shown). Similarly, exposure of the cells to a combination of atractyloside and FCCP blocked the oscillations completely.
Figure 2.
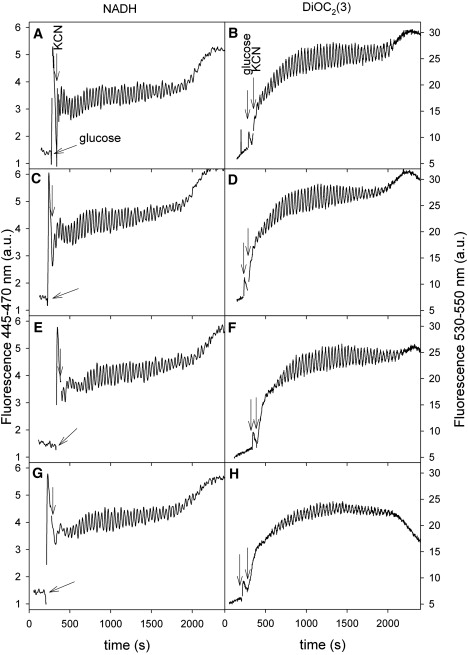
Effect of low (≤1μM) concentrations of FCCP on oscillations of NADH and mitochondrial membrane potential. (A, B) Control. (C, D) 250 nM FCCP. (E, F) 500 nM FCCP. (G, H) 1 μM FCCP. The cells were incubated with the indicated concentrations of FCCP for 10 min before being transferred to the measuring cell. Other conditions as in Fig. 1.
To reveal more about the mechanism responsible for the coupling between the dynamics of NADH and Δψm, we tested the effect of a number of inhibitors of the glycolytic pathway and respiration on the oscillations. The results are summarized in Table S1. The effects of the inhibitors 2-deoxyglucose and iodoacetate clearly demonstrate that glycolysis controls the oscillations of both NADH and Δψm. 2-Deoxyglucose is phosphorylated in a reaction catalyzed by hexokinase (34). However, the deoxyglucose-6-phosphate formed cannot be metabolized further, and hence ATP production by the lower part of glycolysis is inhibited, resulting in a decrease in glucose consumption and accumulation of intracellular glucose (13,34). Iodoacetate is an inhibitor of glyceraldehyde-3-phosphate dehydrogenase (35). The effect of iodoacetate on oscillations of NADH and Δψm is shown in Fig. 3. Note that, whereas addition of iodoacetate results in termination of the oscillations of NADH and Δψm, as well as a decrease in the amount of NADH, Δψm remains hyperpolarized. Similarly, addition of amphotericin B, which induces leakage of K+ out of the cell and influx of protons from the environment (31), inhibits the oscillations of both NADH and Δψm. Hence, the loss of intracellular K+ might inhibit K+-dependent enzymes such as aldolase, phosphofructokinase, and pyruvate kinase (36) and result in loss of the oscillations. The disappearance of the oscillations is accompanied by a slow depolarization of Δψm. (data not shown).
Figure 3.
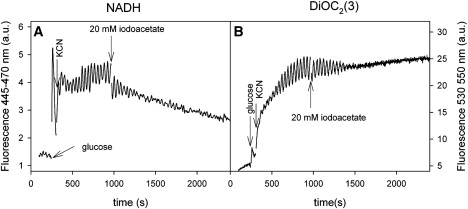
Effect of iodoacetate on oscillations of NADH and Δψm. Yeast cells were suspended to a density of 10% wet weight in 100 mM phosphate buffer and DiOC2(3), glucose and KCN were added as described in Fig. 1. At time ∼1000 s, 20 mM iodoacetate was added to the suspension.
Addition of 5 mM azide resulted in a complete halt of the oscillations of NADH and Δψm and a decrease in the magnitude of Δψm (data not shown). To test if there was any difference in the effect of azide on the two types of oscillations, we incubated yeast cells with lower concentrations of azide (Fig. 4). Note that, as opposed to the effect of FCCP, azide affects the oscillation amplitudes of NADH and Δψm equally. In addition, the magnitude of Δψm is reduced. As to the effect of azide, it is an inhibitor of several processes in the mitochondria: (i), it inhibits respiration at complex IV (cytochrome c oxidase) (37); (ii), it inhibits so-called “nonrespiratory oxygen consumption” in S. cerevisiae (38); and (iii), it is a strong inhibitor of ATP hydrolysis by the mitochondrial F0F1-ATPase (39). Concerning a potential effect on complex IV, we have already added cyanide, which blocks respiration. Measurements using membrane-inlet mass spectrometry showed that there was no oxygen consumption by the yeast cells in the presence of 5 mM cyanide, and further addition of 5 mM azide could therefore not increase this inhibition. Furthermore, addition of 5 mM salicylhydroxamic acid (SHAM), which was shown to inhibit nonrespiratory oxygen consumption (38), did not have any effect on the oscillations (data not shown). This leaves us with the effect of azide on the activity of F0F1-ATPase. In a previous report we proposed that, in addition to the ADP/ATP antiporter, F0F1-ATPase is involved in the coupling of glycolytic oscillations to oscillations in Δψm (13). The observed effect of azide strongly supports this hypothesis.
Figure 4.
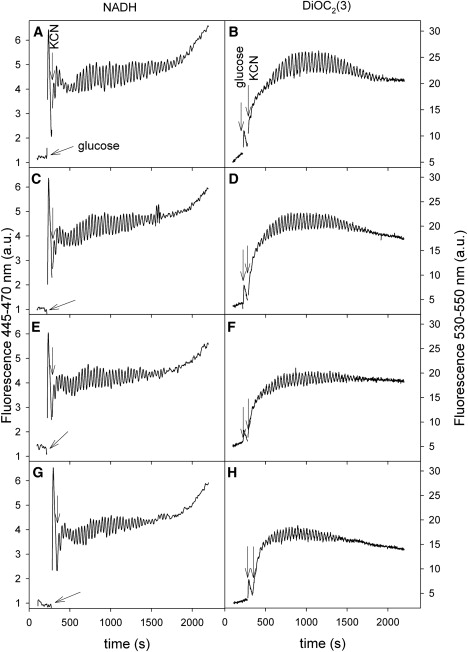
Effect of azide on oscillations of NADH and mitochondrial membrane potential. Yeast cells were suspended in 100 mM phosphate buffer, pH 6.8, to a density of 10% wet weight and incubated with 0 (A, B), 100 μM (C, D), 200 μM (E, F), and 400 μM (G, H) sodium azide for 10 min before being transferred to the measuring cell. Other conditions as in Fig. 1.
Δψm can be generated by reversing the F0F1-ATPase such that protons are pumped out of the matrix into the cytosol while ATP is being hydrolyzed. This results in the generation of a pH gradient and a membrane potential (proton-motive force). However, a proton-motive force may also be generated if parts of the mitochondrial electron transport chain are still active, even when respiration has been inhibited by cyanide. We therefore tested if a part of the mitochondrial electron transport chain could be involved in the generation of Δψm oscillations. However, antimycin A, which inhibits complex III (ubiquinol:cytochrome c oxidoreductase), did not have any effect on the oscillations (Table S1). Membrane-inlet mass spectrometry measurements, performed under aerobic conditions in the absence of cyanide, showed an almost 100% inhibition of respiration by antimycin A at the concentrations used in Table S1. Addition of antimycin (or of any of the other inhibitors listed in Table S1) instead of cyanide did not induce long trains of oscillations in NADH and Δψm. At most, we observed a damped oscillation with 2–3 excursions if we added, e.g., antimycin instead of cyanide after a pulse of glucose.
We have previously shown that DCCD inhibits the oscillations of both NADH and Δψm (13), suggesting the involvement of F0F1-ATPase in the oscillations in Δψm. However, the effect of DCCD is not specific (27–29): At low concentrations it mainly inhibits the F0F1-ATPase, whereas at higher concentrations, as used in our previous study (13), it also inhibits the plasma membrane H+-ATPase of some yeast strains (29). This H+-ATPase may account for up to 60% of the ATP hydrolysis in the cell (31). To investigate whether other inhibitors of the plasma membrane H+-ATPase could affect the oscillations, we tested the effect of omeprazole, which is a strong inhibitor of the H+-K+-ATPase of the gastric mucosa (40). Omeprazole has also been shown to inhibit other P-ATPases, including the S. cerevisiae plasma membrane H+-ATPase (41). Fig. 5 shows the effect of omeprazole on the Δψm oscillations. The oscillations of NADH could not be recorded properly at high concentrations (>100 μM) of omeprazole, because omeprazole has a strong absorption in the UV region and therefore reduces the fluorescence of NADH considerably. However, addition of omeprazole did not cause a significant change in the amplitude of NADH oscillations at concentrations up to 100 μM (data not shown). The recordings of Δψm (Fig. 5) show that, at low concentrations of omeprazole, the amplitude of Δψm oscillations increases with the omeprazole concentration until it reaches a maximum at ∼100 μM of the inhibitor, and then it decreases again. At a concentration of 250 μM omeprazole, the amplitude decreased to below the initial level. Furthermore, the size of Δψm increases with increasing omeprazole concentrations. Fig. 6 A shows a plot of the relative amplitude of the Δψm oscillation against the omeprazole concentration. Unlike the amplitude (Fig. 6 A), the frequency of Δψm oscillations remained constant with changing omeprazole concentration (Fig. 5 A). Measurements of the activity of the plasma membrane H+-ATPase against the concentration of omeprazole are shown in Fig. 6 B. We noted that the activity of the plasma membrane H+-ATPase decreases monotonically with the omeprazole concentration.
Figure 5.

Effect of omeprazole on oscillations of mitochondrial membrane potential. Yeast cells (10% wet weight) suspended in 250 mM sorbitol were treated for 10 min with omeprazole, as described in the “Materials and Methods” section. After centrifugation the cells were suspended (10% wet weight) in 100 mM phosphate buffer and transferred to the measuring cell. The following concentrations of omeprazole were added to the cells: (A) 0 μM; (B) 100 μM; (C) 150 μM; and (D) 250 μM. Other conditions as in Fig. 1.
Figure 6.
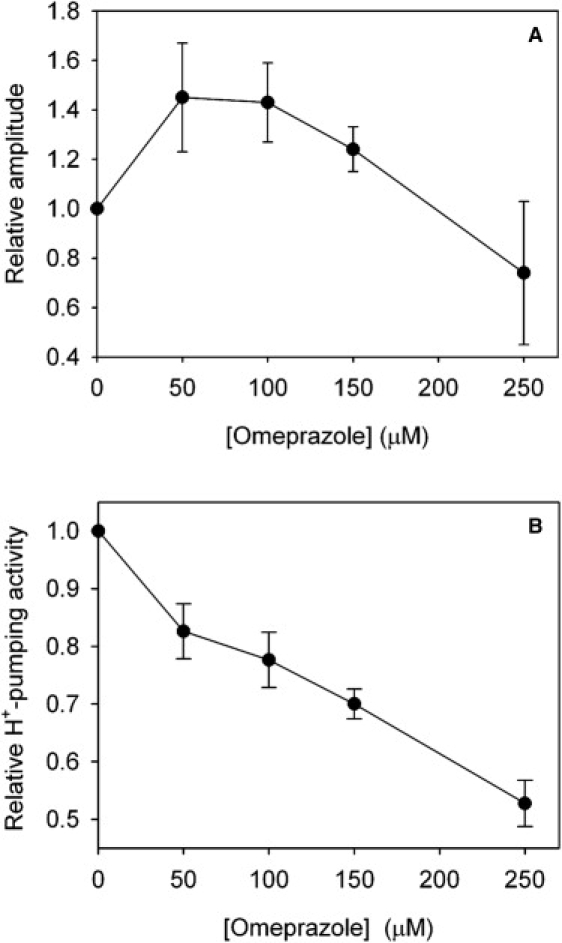
Plots of the relative amplitude of Δψm oscillations (A) and the relative plasma membrane H+-ATPase activity (B) against the omeprazole concentration. Plasma membrane H+-ATPase activity was measured as described in the “Materials and Methods” section. The error bars indicate the standard error (n = 4–5).
Mass-spectrometric measurements of glycolytic flux
The increase in Δψm could be associated with an increase in ATP concentration caused by the decrease in plasma membrane H+-ATPase activity. Such an increase in ATP concentration could again lead to an overall decrease in glycolytic flux (42) because of limitations in ADP in the lower part of glycolysis. We tested whether omeprazole could induce such a decrease in glycolytic flux by measuring the rate of production of CO2 and ethanol in cells incubated with omeprazole for 10 min. The results obtained with ethanol are shown in Fig. 7. We found that treatment with 100 μM and 250 μM omeprazole resulted in identical decreases in the rates of CO2 and ethanol production of 17 and 29%, respectively, consistent with the hypothesis that, if inhibition of plasma membrane H+-ATPase activity leads to an increase in intracellular ATP, then the flux through glycolysis decreases accordingly. However, the inhibition of glycolytic flux was somewhat less than the inhibition of plasma membrane H+-ATPase activity shown in Fig. 6 B. To test if the inhibition of the plasma membrane H+-ATPase did lead to an increase in intracellular ATP, we determined the intracellular ATP concentration. 30 mM glucose and 5 mM KCN were added to a suspension of yeast cells treated with 0, 100, or 250 μM omeprazole. After 5–6 min the suspension was transferred to boiling buffered ethanol, and the intracellular metabolites were extracted as described by Gonzales et al. (32). The protein content of the cells was measured and the average intracellular concentration of ATP was determined, assuming an intracellular volume of 3.75 μL per mg protein (43). The intracellular concentrations of ATP were determined to 1.9 ± 0.3 mM, 2.3 ± 0.2 mM, and 2.6 ± 0.3 mM for cells treated with 0, 100, and 250 μM omeprazole, respectively.
Figure 7.

Effect of omeprazole on the rate of glycolysis measured as the production of ethanol. Yeast cells were treated with omeprazole for 10 min, as described in the “Materials and Methods” section. After centrifugation the cells were suspended in 100 mM phosphate buffer to a density of 2% wet weight and transferred to the mass spectrometer measuring cell. At time ∼200 s, 5 mM KCN and 30 mM glucose were added to the suspension. Ethanol was measured as the relative abundance at m/z = 31.
However, the decrease in glycolytic flux might also be due to a decrease in intracellular pH caused by the inhibition of the plasma membrane H+-ATPase. We therefore tested the effect of pH and also the effect of various other inhibitors on the glycolytic flux. The glycolytic flux was unaffected by the extracellular pH in the range 4.0–8.0. As expected, iodoacetate completely blocked the glycolytic flux, whereas 5 mM 2-dexoyglucose inhibited the flux by 50%. FCCP increased the rate of glycolysis by 10%, whereas amphotericin B, surprisingly, had no effect on the glycolytic flux. The glycolytic flux was also unaffected by treatment with antimycin A and SHAM. Addition of azide induced a slight increase in the glycolytic flux.
Measurements of intracellular pH
We investigated, finally, whether the changes in oscillation amplitude and glycolytic flux caused by the various inhibitors of glycolysis, electron transport, and H+-ATPases could be associated with changes in pHi. After incubating the yeast cells with the pH-sensitive dye 5- (and -6-) CFSE and measuring the ratio of exctitations at 490 nm and 435 nm (30,31), we determined pHi by employing the calibration curve shown in Fig. S1. An example is shown in Fig. 8. We noted that, immediately after addition of glucose and cyanide, pHi rose quickly from ∼7.3 to 7.9 and then slowly reverted toward the initial pHi again. Furthermore, the oscillations in NADH were accompanied by oscillations in pHi. It was only the emission from the 490 nm excitation that oscillated. We observed no oscillations in the emission from the 490 nm excitation in the absence of the pH-sensitive dye. The phase relationship between oscillations in NADH and pHi revealed that the oscillations were in phase (data not shown). When we performed the same experiment in phosphate buffer at pH 5.5, we obtained a similar result, namely that, after addition of glucose and cyanide, pHi quickly rose from ∼6.2 to ∼6.7 and then slowly declined toward the initial pHi value (see Fig. S2). Again, we observed oscillations in pHi accompanying the oscillations in NADH.
Figure 8.

Time series of NADH fluorescence and pHi. Yeast cells stained with 5- (and -6-) CFSE were suspended in 100 mM phosphate buffer, pH 6.8, to a cell density of 10% wet weight. At times 180 s and 240 s, 30 mM glucose and 5 mM KCN were added to the suspension, respectively; pHi was determined from measurements of the ratio of excitations at 435 nm and 490 nm (emission 520 nm) and the calibration curve in Fig. S1. Temperature was 25°C.
The initial fast rise in pHi could be ascribed to the action of the plasma membrane H+-ATPase (see below). The subsequent decline in pHi may be due partly to the formation of bicarbonate in glycolysis and partly to the action of the mitochondrial F0F1-ATPase pumping protons from the mitochondrial matrix to the cytoplasm while hydrolyzing ATP. The latter can be inferred from the action of FCCP, which induces a rapid increase in pHi (see Fig. S3). This rise in pHi has the same half time as that of the decay of Δψm observed by Andersen et al. (12). Furthermore, addition of iodoacetate resulted in a slowing down of the decline in pHi (see Fig. S4). The oscillations in pHi could be associated either with the formation of bicarbonate or with the activity of the plasma membrane H+-ATPase. They cannot be due to the activity of the F0F1-ATPase, because pHi continues to oscillate after Δψm and the mitochondrial pH gradient had been dissipated by FCCP (Fig. S3). We also measured pHi after treatment of the cells with different concentrations of omeprazole. Fig. S5 shows pHi before and after addition of 30 mM glucose and 5 mM potassium cyanide to untreated cells and cells treated with 250 μM omeprazole. We determined a 57% decrease in the ratio of the initial slope of pHi rise after addition of KCN in the cells treated with omeprazole, as compared with results with the control untreated cells. The experiments with omeprazole therefore suggest that the initial rise in pHi is because of the activity of the plasma membrane H+-ATPase, and the experiments with FCCP and iodoacetate suggest that the subsequent slow decay in pHi is due to a combination of the pumping of protons out of the mitochondrial matrix and the formation of HCO3-.
Finally, we tested the effects of amphotericin B and azide on pHi. Addition of amphotericin B to the oscillating yeast suspension resulted in a rapid decline in pHi to ∼7 (see Fig. S3). Incubation of yeast cells with 5 mM azide resulted in an increase in the peak of pHi after addition of cyanide. Addition of azide to yeast cells with an oscillating glycolysis resulted in a complete halt of the oscillations and a slowing down in the decline of pHi (data not shown).
Discussion
Our experiments show that, in intact yeast cells, NADH autofluorescence and DiOC2(3) fluorescence oscillate in phase. At present, it is uncertain how much of the NADH fluorescence stems from cytoplasmic or mitochondrial pools. However, it is unlikely that mitochondrial NADH contributes to the oscillations in NADH fluorescence, because, as shown here, no inhibitors of mitochondrial electron transport except for cyanide and azide were found to affect the oscillations. To look for a coupling between the NADH and Δψm oscillations, one should look for species that either oscillate in phase or 180° out of phase with NADH. Richard et al. (43) performed experiments in which yeast cells were lysed at different phases of the NADH oscillations and the glycolytic intermediates were extracted and their phase relationship to NADH was determined. It was found that ADP oscillates in phase with NADH, whereas ATP oscillates 180° out of phase with NADH. Thus, ADP and ATP meet the criteria as species that could mediate the coupling between oscillations in NADH and Δψm. The results of our presented experiments are therefore consistent with our previous suggestion (12,13) that the oscillations in Δψm involve the ADP/ATP antiporter. The failure to observe any effect on the oscillations of inhibitors of mitochondrial electron transport such as antimycin A and inhibitors of nonrespiratory oxygen consumption (SHAM) strongly suggest that electron transport and the associated proton pumping by complex I-IV, as well as other types of electron transport, do not contribute to the generation of a membrane potential. Also, because other inhibitors of respiratory and nonrespiratory oxygen consumption do not have an effect on oscillations, the effect of azide cannot be due to an inhibition of these processes. Therefore, the blockade of both NADH and Δψm oscillations by azide must be ascribed to its inhibition of ATP hydrolysis by F0F1-ATPase (39). This theory is supported by the observation that the acidification of pHi is slowed down after addition of azide, indicating that the pumping of protons from the mitochondrial matrix to the cytoplasm is inhibited. Hence, our presented results also suggest that, in addition to the ADP/ATP antiporter, F0F1-ATPase is involved in the oscillations of Δψm. This is further corroborated by the observation that addition of high (20 μM) concentrations of FCCP induces an increase in pHi, most likely because of the dissipation of the proton-motive force across the mitochondrial membrane. This increase in pHi occurs with the same half time as that of the decay in Δψm after addition of FCCP (12). The rapid decay in pHi after addition of amphotericin B should be accompanied by an increase in the activity of the plasma membrane H+-ATPase. Thus, the slow decay in Δψm after addition of amphotericin B may be explained by a lack of ATP caused by this increase in the activity of the H+-ATPase (44). The decrease in cytoplasmic ATP should also decrease the influx of ATP into the mitochondria and, hence, the activity of the F0F1-ATPase, leading to an overall depolarization of Δψm. A decrease in cytoplasmic ATP might result in an increase in the glycolytic flux, but the loss of K+ might again compensate for this, because of inhibition of K+-dependent enzymes in glycolysis, leaving the overall glycolytic flux relatively unaffected by amphotericin B.
The effect of low concentrations of FCCP shows that the oscillations in Δψm can be uncoupled gradually from the oscillations in NADH, suggesting that Δψm oscillations are driven by glycolytic oscillations and not vice versa. Our experiments support the suggestion by Aon et al. (45) that mitochondrial functions are involved in controlling glycolytic oscillations in S. cerevisiae. However, whereas these authors proposed that parts of the electron transport chain contribute to the generation of Δψm, our results suggest that the sole source of the observed potential is the concerted action of the ADP/ATP antiporter and the F0F1-ATPase.
The effects of the plasma membrane H+-ATPase inhibitor omeprazole are somewhat surprising. Our measurements of the proton pumping activity and the changes in pHi seem to confirm that omeprazole does indeed inhibit the plasma membrane H+-ATPase. Thus, at low concentrations of omeprazole, we observed an increase in the size of Δψm, a decrease in plasma membrane H+-ATPase activity, and a decrease in overall glycolytic flux. Omeprazole was the only inhibitor used here, apart from the inhibitors of glycolysis, to induce a decrease in glycolytic flux. As shown by Larsson et al. (42), a decrease in glycolytic flux may be associated with an increase in ATP concentration. This observation is further supported by our measurements of intracellular ATP in cells treated with omeprazole. Therefore, when the plasma membrane H+-ATPase is inhibited, the intracellular ATP concentration increases and this again induces an increase in F0F1-ATPase activity. Thus, the activity of the F0F1-ATPase somewhat compensates for the decrease in plasma membrane H+-ATPase activity. Hence, the net ATPase activity shows relatively less inhibition compared with that resulting from the plasma membrane H+-ATPase activity. This suggestion is supported by the fact that, whereas omeprazole also inhibits the overall glycolytic rate as determined by the CO2 and ethanol production, the degree of inhibition of glycolysis is smaller than the degree of inhibition of the plasma membrane H+-ATPase activity. It could be speculated that the decrease in glycolytic flux might also be due to a decrease in pHi caused by the decrease in the activity of the plasma membrane H+-ATPase. However, we can rule out this possibility, because glycolytic flux is essentially unaffected by the pHi in the range 6–8. At concentrations of omeprazole > 100 μM, there is no additional increase in the size of Δψm, suggesting that the F0F1-ATPase has reached its maximum velocity. An additional interesting observation is that, when the plasma membrane H+-ATPase was only slightly inhibited by omeprazole, we observed an increase in the amplitude of the Δψm oscillations. This could also be explained by an increase in the activity of the F0F1-ATPase, hence supporting the suggestion that a modest inhibition of the plasma membrane H+-ATPase induces an increase in F0F1-ATPase activity.
We have also observed oscillations in pHi. However, it is not clear if the oscillations in pHi are due to oscillations in the concentration of bicarbonate or to oscillations in activity of the plasma membrane H+-ATPase. We have previously observed oscillations in the external concentration of CO2 in suspensions of yeast cells exhibiting glycolytic oscillations (21). These oscillations were ∼115–130° out of phase with NADH. However, the time delay between the formation of CO2 in the cytoplasm and its release into the external solution is not known. Therefore, we do not know which time delay, if any, to expect between NADH and the intracellular concentration of HCO3-.
Overall, our results suggest that glycolysis drives the oscillations in Δψm. This is not surprising, because glycolytic oscillations were also observed in cell-free extracts (46) only a few years after their discovery in intact cells (18). However, the presented work suggests that, in intact cells, the ATPase activity of the various proton pumps in the cell are highly important in maintaining the ability to show oscillations. If the ATPase activity is significantly reduced, as demonstrated by the effects of the inhibitors sodium azide and omeprazole, or increased, as demonstrated by the effects of FCCP and amphotericin B, the oscillations disappear. On the other hand, the ATPase activity seems to have no effect on the frequency of the oscillations, such as those shown by changes in the sugar transport activity (47). It is worth mentioning that the coupling between glycolysis and mitochondrial functions might work both ways. In yeast cells under semianaerobic conditions, oscillations in glycolysis seem to drive oscillations in Δψm. However, it is very likely that, under aerobic conditions, an autonomous mitochondrial oscillator could drive oscillations in glycolysis and in other metabolic pathways (2,14–17,24,25).
The presented results demonstrate a close coupling between glycolysis and mitochondrial and plasma membrane ion pumps. In our nongrowing yeast cells, many metabolic pathways were downregulated, compared with glycolysis. Therefore, the glycolytic system is relatively simple compared with glycolysis in other eukaryotic cells, including mammalian cells, and may be considered a good model system of similar processes in other eukaryotic cells. Sugar metabolism in S. cerevisiae has much in common with sugar metabolism in pancreatic β cells. In these cells, glucose stimulates insulin production as a consequence of being metabolized. Metabolism of glucose leads to an increase in the cytosolic ATP/ADP ratio, which, again, through closure of ATP-dependent K+ channels in the plasma membrane, leads to a depolarization of the β cell (48–51). The depolarization increases Ca2+ influx through voltage-gated Ca2+-channels, and the increase in cytoplasmic Ca2+ induces release of insulin. In normal subjects β cells secrete insulin in a pulsatory fashion, whereas patients with non-insulin-dependent diabetes lack this oscillatory insulin secretion (52,53). All cells in an islet of Langerhans are electrically coupled (54), and the metabolisms of individual cells are therefore synchronized (55), similar to activity of individual yeast cells in a suspension (22,23,56). As we have found in our study, for yeast cells, glycolytic oscillations in β cells are also regulated by mitochondrial functions (55).
Acknowledgments
We thank an anonymous referee for many helpful comments and suggestions.
This research was supported by the Danish Natural Science Research Council (Grant Nos. 21-04-0542, 272-05-0110 and 272-06-345).
Supporting Material
References
- 1.Goldbeter A. Cambridge University Press; Cambridge, UK: 1996. Biochemical Oscillations and Cellular Rhythms: The Molecular Basis of Periodic and Chaotic Behaviour. [Google Scholar]
- 2.Aon M.A., Cortassa S., Marbán E., O'Rourke B. Synchronized whole cell oscillations in mitochondrial metabolism triggered by a local release of reactive oxygen species in cardiac myocytes. J. Biol. Chem. 2003;278:44735–44744. doi: 10.1074/jbc.M302673200. [DOI] [PubMed] [Google Scholar]
- 3.Chou H.F., Berman N., Ipp E. Oscillations of lactate released from islets of Langerhans—evidence for oscillatory glycolysis in β-cells. Am. J. Physiol. 1992;262:E800–E805. doi: 10.1152/ajpendo.1992.262.6.E800. [DOI] [PubMed] [Google Scholar]
- 4.Lloyd D.D.B.M. The temporal architecture of eukaryotic growth. FEBS Lett. 2006;580:2830–2835. doi: 10.1016/j.febslet.2006.02.066. [DOI] [PubMed] [Google Scholar]
- 5.Weiss J.N., Yang L., Qu Z. Systems biology approaches to metabolic and cardiovascular disorders: network perspectives of cardiovascular metabolism. J. Lipid Res. 2006;47:2355–2366. doi: 10.1194/jlr.R600023-JLR200. [DOI] [PubMed] [Google Scholar]
- 6.Richard P. The rhythm of yeast. FEMS Microbiol. Rev. 2003;27:547–557. doi: 10.1016/S0168-6445(03)00065-2. [DOI] [PubMed] [Google Scholar]
- 7.Wymann M.P., Kernen P., Deranleau D.A., Baggiolini M. Respiratory burst oscillations in human neutrophils and their correlation with fluctuations in apparent cell shape. J. Biol. Chem. 1989;264:15829–15834. [PubMed] [Google Scholar]
- 8.Fossati G., Moulding D.A., Spiller D.G., Moots R.J., White M.R.H. The mitochondrial network of human neutrophils: role in chemotaxis, phagocytosis, respiratory burst activation, and commitment to apoptosis. J. Immunol. 2003;170:1964–1972. doi: 10.4049/jimmunol.170.4.1964. [DOI] [PubMed] [Google Scholar]
- 9.Maianski N.A., Geissler J., Srinivasula S.M., Alnemri E.S., Roos D. Functional characterization of mitochondria in neutrophils: a role restricted to apoptosis. Cell Death Differ. 2004;11:143–153. doi: 10.1038/sj.cdd.4401320. [DOI] [PubMed] [Google Scholar]
- 10.Tintinger G., Steel H.C., Anderson R. Taming the neutrophil: calcium clearance and influx mechanisms as novel targets for pharmacological control. Clin. Exp. Immunol. 2005;141:191–200. doi: 10.1111/j.1365-2249.2005.02800.x. [DOI] [PMC free article] [PubMed] [Google Scholar]
- 11.Heart E., Yaney G.C., Corkey R.F., Schultz V., Luc E. Ca2+, NAD(P)H and membrane potential changes in pancreatic β-cells by methyl succinate: comparison with glucose. Biochem. J. 2007;403:197–205. doi: 10.1042/BJ20061209. [DOI] [PMC free article] [PubMed] [Google Scholar]
- 12.Andersen A.Z., Poulsen A.K., Brasen J.C., Olsen L.F. On-line measurements of oscillating mitochondrial membrane potential in glucose-fermenting Saccharomyces cerevisiae. Yeast. 2007;24:731–739. doi: 10.1002/yea.1508. [DOI] [PubMed] [Google Scholar]
- 13.Poulsen A.K., Andersen A.Z., Brasen J.C., Scharff-Poulsen A.M., Olsen L.F. Probing glycolytic and membrane potential oscillations in Saccharomyces cerevisiae. Biochemistry. 2008;47:7477–7484. doi: 10.1021/bi800396e. [DOI] [PubMed] [Google Scholar]
- 14.Satroutdinov A.D., Kuriyama H., Kobayashi H. Oscillatory metabolism of Saccharomyces cerevisiae in continuous culture. FEMS Microbiol. Lett. 1992;98:261–267. doi: 10.1016/0378-1097(92)90167-m. [DOI] [PubMed] [Google Scholar]
- 15.Murray D.B., Roller S., Kuriyama H., Lloyd D. Clock control of ultradian respiratory oscillation found during yeast continuous culture. J. Bacteriol. 2001;183:7253–7259. doi: 10.1128/JB.183.24.7253-7259.2001. [DOI] [PMC free article] [PubMed] [Google Scholar]
- 16.Lloyd D. Respiratory oscillations in yeast. In: Maroto M., Monk N.A.M., editors. Cellular Oscillatory Mechanisms. Advances in Experimental Medicine and Biology, Vol. 641. Springer; Berlin: 2008. pp. 118–140. [Google Scholar]
- 17.Murray D.B., Beckmann M., Kitano H. Regulation of yeast oscillatory dynamics. Proc. Natl. Acad. Sci. USA. 2007;104:2241–2246. doi: 10.1073/pnas.0606677104. [DOI] [PMC free article] [PubMed] [Google Scholar]
- 18.Duysens L.N.M., Amesz J. Fluorescence spectrophotometry of reduced phosphopyridine nucleotide in intact cells in the near-ultravioloet and visible region. Biochim. Biophys. Acta. 1957;24:19–26. doi: 10.1016/0006-3002(57)90141-5. [DOI] [PubMed] [Google Scholar]
- 19.Chance B., Estabrook R.W., Ghosh A. Damped sinusoidal oscillations of cytoplasmic reduced pyridine nucleotide in yeast cells. Proc. Natl. Acad. Sci. USA. 1964;51:1244–1251. doi: 10.1073/pnas.51.6.1244. [DOI] [PMC free article] [PubMed] [Google Scholar]
- 20.Betz A., Chance B. Influence of inhibitors and temperature on oscillation of reduced pyridine nucleotides in yeast cells. Arch. Biochem. Biophys. 1965;109:579–584. doi: 10.1016/0003-9861(65)90403-0. [DOI] [PubMed] [Google Scholar]
- 21.Poulsen A.K., Lauritsen F.R., Olsen L.F. Sustained glycolytic oscillations—no need for cyanide. FEMS Microbiol. Lett. 2004;236:261–266. doi: 10.1016/j.femsle.2004.05.044. [DOI] [PubMed] [Google Scholar]
- 22.Poulsen A.K., Petersen M.Ø., Olsen L.F. Single cell studies and simulation of cell–cell interactions using oscillating glycolysis in yeast cells. Biophys. Chem. 2007;125:275–280. doi: 10.1016/j.bpc.2006.08.009. [DOI] [PubMed] [Google Scholar]
- 23.De Monte S., d'Ovidio F., Danø S., Sørensen P.G. Dynamical quorum sensing: population density encoded in cellular dynamics. Proc. Natl. Acad. Sci. USA. 2007;104:18377–18381. doi: 10.1073/pnas.0706089104. [DOI] [PMC free article] [PubMed] [Google Scholar]
- 24.Aon M.A., Cortassa S., Lemar K.M., Hayes A.J., Lloyd D. Single and cell population respiratory oscillations in yeast: a 2-photon scanning laser microscopy study. FEBS Lett. 2007;581:8–14. doi: 10.1016/j.febslet.2006.11.068. [DOI] [PubMed] [Google Scholar]
- 25.Aon M.A., Cortassa S., O'Rourke B. Mitochondrial oscillations in physiology and pathophysiology. In: Maroto M., Monk N.A.M., editors. Cellular Oscillatory Mechanisms. Advances in Experimental Medicine and Biology, Vol. 641. Springer; Berlin: 2008. pp. 98–117. [DOI] [PMC free article] [PubMed] [Google Scholar]
- 26.Winkler H.H., Bygrave F.L., Lehninger A.L. Characterization of the atractyloside-sensitive adenine nucleotide transport system in rat liver mitochondria. J. Biol. Chem. 1968;243:20–28. [PubMed] [Google Scholar]
- 27.Kovac L., Galeotti T., Hess B. Oligomycin-like inhibition of yeast respiration by N,N'-dicyclohexylcarbodiimide and nature of energy coupling in intact yeast cells. Biochim. Biophys. Acta. 1968;153:715–717. doi: 10.1016/0005-2728(68)90199-0. [DOI] [PubMed] [Google Scholar]
- 28.Beattie D.S., Villalobo A. Energy transduction by the reconstituted b-c1 complex from yeast mitochondria. Inhibitory effects of dicyclohexylcarbodiimide. J. Biol. Chem. 1982;257:14745–14752. [PubMed] [Google Scholar]
- 29.Velázquez I., Martínez F., Pardo J.P. Inactivation of the Klyveromyces lactis H+-ATPase by dicyclohexylcarbodiimide: binding stoichiometry and effect of nucleophiles. Arch. Biochem. Biophys. 1997;346:294–302. doi: 10.1006/abbi.1997.0304. [DOI] [PubMed] [Google Scholar]
- 30.Halm M., Hornbæk T., Arneborg N., Sefa-Dedeh S., Jespersen L. Lactic acid tolerance determined by measurement of intracellular pH of single cells of Candida kruesei and Sachharomyces cerevisiae isolated from fermented maize dough. Int. J. Food Microbiol. 2004;94:97–103. doi: 10.1016/j.ijfoodmicro.2003.12.019. [DOI] [PubMed] [Google Scholar]
- 31.Bracey D., Holyoak C.D., Nebe-von Caron G., Coote P.J. Determination of the intracellular pH (pHi) of growing cells of Saccharomyces cerevisiae: the effect of reduced expression of the membrane H+-ATPase. J. Microbiol. Methods. 1998;31:113–125. [Google Scholar]
- 32.Gonzales B., Francios J., Reneaud M. A rapid and reliable method for metabolite extraction in yeast using boiling buffered ethanol. Yeast. 1997;13:1347–1356. doi: 10.1002/(SICI)1097-0061(199711)13:14<1347::AID-YEA176>3.0.CO;2-O. [DOI] [PubMed] [Google Scholar]
- 33.Lowry O.H., Rosebrough N.J., Farr A.L., Randall R.J. Protein measurement with the folin phenol reagent. J. Biol. Chem. 1951;193:265–275. [PubMed] [Google Scholar]
- 34.Herve M., Wietzerbin J., Tran-Dinh S. Non-cooperative effects of glucose and 2-deoxyglucose on their metabolism in Saccharomyces cerevisiae studied by 1H-NMR and 13C-NMR spectroscopy. Eur. J. Biochem. 1993;218:221–228. doi: 10.1111/j.1432-1033.1993.tb18368.x. [DOI] [PubMed] [Google Scholar]
- 35.Webb J. Vol. 3. Academic Press; New York: 1966. Enzyme and. (Metabolic Inhibitors). [Google Scholar]
- 36.Tran-Dinh S., Hervé M., Lebourguais O., Jerome M., Wietzerbin J. Effects of amphotericin B on the glucose metabolism in Saccharomyces cevevisiae cells: Studies by 13C-, 1H-NMR and biochemical methods. Eur. J. Biochem. 1991;197:271–279. doi: 10.1111/j.1432-1033.1991.tb15908.x. [DOI] [PubMed] [Google Scholar]
- 37.Keilin D., Hartree E.F. Cytochrome and cytochrome oxidase. Proc. R. Soc. Lond. B. Biol. Sci. 1939;127:167–191. [Google Scholar]
- 38.Rosenfeld E., Beauvoit B., Rigoulet M., Salmon J.M. Non-respiratory oxygen consumption pathways in anaerobically-grown Saccharomyces cerevisiae: evidence and partial characterization. Yeast. 2002;19:1299–1321. doi: 10.1002/yea.918. [DOI] [PubMed] [Google Scholar]
- 39.Harris D.A. Azide as a probe of co-operative interactions in the mitochondrial F1-ATPase. Biochim. Biophys. Acta. 1989;974:156–162. doi: 10.1016/s0005-2728(89)80368-8. [DOI] [PubMed] [Google Scholar]
- 40.Vanderhoff B.T., Tahboub R.M. Proton pump inhibitors: an update. Am. Fam. Physician. 2002;66:273–280. [PubMed] [Google Scholar]
- 41.Monk B.C., Mason A.B., Abramochkin G., Haber J.E., Seto-Young D. The yeast plasma membrane proton pumping ATPase is a viable antifungal target. I. Effects of the cysteine-modifying reagent omeprazole. Biochim. Biophys. Acta. 1995;1239:81–90. doi: 10.1016/0005-2736(95)00133-n. [DOI] [PubMed] [Google Scholar]
- 42.Larsson C., Nielsson A., Blomberg A., Gustafsson L. Glycolytic flux is conditionally correlated with ATP concentration in Saccharomyces cerevisiae: a chemostat study under carbon- or nitrogen-limiting conditions. J. Bacteriol. 1997;179:7243–7250. doi: 10.1128/jb.179.23.7243-7250.1997. [DOI] [PMC free article] [PubMed] [Google Scholar]
- 43.Richard P., Teusink B., Hemker M.B., Van Dam K., Westerhoff H.V. Sustained oscillations in free-energy state and hexose phosphates in yeast. Yeast. 1996;12:731–740. doi: 10.1002/(SICI)1097-0061(19960630)12:8%3C731::AID-YEA961%3E3.0.CO;2-Z. [DOI] [PubMed] [Google Scholar]
- 44.Bracey D., Holyoak C.D., Coote P.J. Comparison of the inhibitory effect of sorbic acid and amphotericin B on Saccharomyces cerevisiae: is growth inhibition dependent on the intracellular pH? J. Appl. Microbiol. 1998;85:1056–1066. doi: 10.1111/j.1365-2672.1998.tb05271.x. [DOI] [PubMed] [Google Scholar]
- 45.Aon M.A., Cortassa S., Westerhoff H.V., Berden J.A., Van Spronsen E. Dynamic regulation of yeast glycolytic oscillations by mitochondrial functions. J. Cell Sci. 1991;99:325–334. doi: 10.1242/jcs.99.2.325. [DOI] [PubMed] [Google Scholar]
- 46.Chance B., Hess B., Betz A. DNPH oscillations in a cell-free extract of. S. carlsbergensis. Biochem. Biophys. Res. Commun. 1964;16:182–187. doi: 10.1016/0006-291x(64)90358-4. [DOI] [PubMed] [Google Scholar]
- 47.Reijenga K.A., Snoep J.L., Diderich J.A., van Verseveld H.W., Westerhoff H.V. Control of glycolytic dynamics by hexose transport in Saccharomyces cerevisiae. Biophys. J. 2001;80:626–634. doi: 10.1016/S0006-3495(01)76043-2. [DOI] [PMC free article] [PubMed] [Google Scholar]
- 48.Ashcroft F.M., Harrison D.E., Ashcroft S.J. Glucose induces closure of single potassium channels in isolated rat pancreatic β-cells. Nature. 1984;312:446–448. doi: 10.1038/312446a0. [DOI] [PubMed] [Google Scholar]
- 49.Cook D.L., Hales C.N. Intracellular ATP directly blocks K+ channels in pancreatic β-cells. Nature. 1984;311:271–273. doi: 10.1038/311271a0. [DOI] [PubMed] [Google Scholar]
- 50.Hopkins W.F., Fatherazi S., Peter-Riesch B., Corkey B.E., Cook D.L. Two sites for adenine-nucleotide regulation of ATP-sensitive potassium channels in mouse pancreatic β-cells and HIT cells. J. Membr. Biol. 1992;129:287–295. doi: 10.1007/BF00232910. [DOI] [PubMed] [Google Scholar]
- 51.Misler S., Falke L.C., Gillis K., McDaniel M.L. A metabolite-regulated potassium channel in rat pancreatic β-cells. Proc. Natl. Acad. Sci. USA. 1986;83:7119–7123. doi: 10.1073/pnas.83.18.7119. [DOI] [PMC free article] [PubMed] [Google Scholar]
- 52.O'Rahilly S., Turner R.C., Matthews D.R. Impaired pulsatile secretion of insulin in relatives of patients with non-insulin-dependent diabetes. N. Engl. J. Med. 1988;318:1225–1230. doi: 10.1056/NEJM198805123181902. [DOI] [PubMed] [Google Scholar]
- 53.Polonsky K.S., Given B.D., Hirsch L.J., Tillil H., Shapiro E.T. Abnormal patterns of insulin secretion in non-insulin-dependent diabetes mellitus. N. Engl. J. Med. 1988;318:1231–1239. doi: 10.1056/NEJM198805123181903. [DOI] [PubMed] [Google Scholar]
- 54.Ashcroft F.M., Rorsman P. Electrophysiology of the pancreatic β-cell. Prog. Biophys. Mol. Biol. 1989;54:87–143. doi: 10.1016/0079-6107(89)90013-8. [DOI] [PubMed] [Google Scholar]
- 55.Jung S.K., Kauri L.M., Qian W.J., Kennedy R.T. Correlated oscillations in glucose consumption, oxygen consumption and intracellular free Ca2+ in single islets of Langerhans. J. Biol. Chem. 2000;275:6642–6650. doi: 10.1074/jbc.275.9.6642. [DOI] [PubMed] [Google Scholar]
- 56.Danø S., Sørensen P.G., Hynne F. Sustained oscillations in living cells. Nature. 1999;402:320–322. doi: 10.1038/46329. [DOI] [PubMed] [Google Scholar]
Associated Data
This section collects any data citations, data availability statements, or supplementary materials included in this article.