Abstract
Ureteral obstruction leads to increased pressure and inducible nitric oxide synthase (iNOS) expression. This study examined the involvement of epidermal growth factor (EGF) receptor (EGFR), nuclear factor-κB (NFκB), and signal transducers and activators of transcription 3 (STAT3) in iNOS induction in human proximal tubule (HKC-8) cells in response to pressure or EGF. HKC-8 cells were subjected to 60 mmHg pressure or treated with EGF for 0–36 h. iNOS was more rapidly induced in response to EGF than pressure. The addition of EGFR, NFκB, and STAT3 inhibitors significantly suppressed pressure- or EGF-stimulated iNOS mRNA and protein expression. Analysis of the activated states of EGFR, NFκB p65, and STAT3 after exposure to both stimuli demonstrated phosphorylation within 2.5 min. Anti-EGF antibody inhibited iNOS induction in pressurized HKC-8 cells, providing evidence that endogenous EGF mediates the response to pressure. In ureteral obstruction, when pressure is elevated, phosphorylated EGFR was detected in the apical surface of the renal tubules, validating the in vitro findings. These data indicate that EGFR, NFκB, and STAT3 are required for human iNOS gene induction in response to pressure or EGF, indicating a similar mechanism of activation.
Keywords: cytokine mix, cycloheximide
pressure is an important component of the mechanical environment that regulates gene expression (15, 21, 26, 36, 59), with a significant impact on the function and remodeling of tissue (8, 41, 51, 55). Overexpression of the inducible nitric oxide (NO) synthase (iNOS) gene has been shown to coincide with increased pressure in many chronic and acute diseases, including glaucoma (35, 36), osteoarthritis and rheumatoid arthritis (15, 26), bladder outlet obstruction (7), and ureteral obstruction (24, 28, 56). In obstruction, pressure may also affect the expression of other genes; for example, Woolf (59) demonstrated increased Pax-2 overexpression after in utero ureteral obstruction. Increased expression of other genes associated with proliferation, fibrosis, and epithelial-mesenchymal transition has also been demonstrated after obstruction (10, 30, 40).
Ureteral obstruction results in distension of the kidney, caused by the increased pressure due to the obstructed flow of urine (10). Pressures of 48–60 mmHg have been documented in the obstructed ureter (6, 14). NO produced by iNOS has been shown to have beneficial effects in the obstructed kidney (16, 23, 24, 27). The signal transduction pathways that govern iNOS gene expression as a result of pressure in proximal tubule epithelial cells have not been characterized. Hence, elucidation of these pathways would provide insight into novel therapeutic strategies to modulate iNOS expression in renal disease, with broader implications in other organ systems affected by pressure.
Activation and/or inhibition of nuclear factor-κB (NFκB) and Janus kinase and signal transducers and activators of transcription (JAK/STAT) pathways are thought to be the central mechanism behind iNOS expression (31, 32, 38, 49, 53). Increased NFκB and STAT3 activation has been demonstrated after experimental ureteral obstruction (33, 39, 42). Although a prominent role for NFκB-mediated signaling in the transcriptional control of iNOS expression has been suggested (30), STAT3 activation may also affect iNOS induction in obstructed nephropathy.
Pressurization of the human optic nerve head astrocytes (ONHA) and human bronchial epithelial (NHBE) cells leads to the phosphorylation of epidermal growth factor (EGF) receptor (EGFR) (36, 54), with subsequent iNOS induction (36). EGFR has been shown to activate NFκB (20, 22) and STATs (11, 13, 37, 46, 50). EGF stimulation of EGFR induces NFκB activation in human cancer and proximal tubule cells (20, 22), whereas EGFR-STAT3 interaction in the nucleus leads to transcriptional activation of iNOS (37). We and others recently reported that pressurization of human kidney epithelial cells (HKC-8) and ONHA leads to the increased expression of iNOS via an NFκB-dependent mechanism (4, 43).
Studies were performed to examine the signaling pathways activated by pressure compared with those activated by EGF in HKC-8 cells. We examined the role of EGFR, NFκB, and STAT3 in the transcriptional activation of the human iNOS gene. HKC-8 cells were pressurized or exposed to EGF, and iNOS expression was examined. To investigate the pathways involved in pressure- or EGF-induced iNOS expression in HKC-8 cells, we utilized pharmacological modulations of EGFR, NFκB, and STAT3. In addition, in vivo unilateral ureteral obstruction (UUO) studies were performed, and iNOS and EGFR expression were investigated. The observations suggest that pressure and EGF contribute directly to the activation of EGFR and subsequent iNOS expression in the proximal tubule epithelial cells via a similar mechanism of action.
METHODS
BSA, human recombinant IL-1β, TNFα, IFNγ, and EGF were purchased from Sigma (St. Louis, MO). The NFκB inhibitors MG-132 (Z-Leu-Leu-Leu-H; MG), a proteasome inhibitor that prevents degradation of IκB, and BAY 11-7058 [(E)-3-(4-t-butylphenylsulfonyl)-2-propenenitrile; BAY], which prevents phosphorylation of IκBα, were purchased from Biomol (Plymouth Meeting, PA). The EGFR inhibitors AG-1478 [4-(3-chloroanilino)-6,7-dimethoxyquinazoline] and AG-183 [2-amino-4-(3′,4′,5′-trihydroxyphenyl)-1,1,3-tricyanobuta-1,3-diene; tyrphostin A51], the STAT3 inhibitor AG-490 (N-benzyl-3,4-dihydroxybenzylidenecyanoacetamide), and the p38 MAPK inhibitor SB-202190 [4-(4-fluorophenyl)-2-(4-hydroxyphenyl)-5-(4-pyridyl)1H-imidazole] were purchased from Calbiochem (Darmstadt, Germany). The translation inhibitor cycloheximide (CHX) was purchased from Sigma. β-Actin, EGFR, NFκB p65, STAT1, and STAT3 rabbit polyclonal antibodies were purchased from Santa Cruz Biotechnology (Santa Cruz, CA). The phosphorylated form of NFκB p65 was purchased from Santa Cruz Biotechnology. Phosphorylated EGFR (Tyr1068), STAT1 (Tyr701), and STAT3 (Tyr705) rabbit polyclonal antibodies were purchased from Cell Signaling Technology (Danvers, MA). EGFR mouse monoclonal antibody was purchased from Abcam (Cambridge, MA). An antibody blocking EGF function was purchased from R & D Systems (Minneapolis, MN). DMEM with or without phenol red was obtained from Invitrogen (Carlsbad, CA) and FBS from Gemini-Bio Products (Woodland CA). A broad-spectrum inhibitor of matrix metalloproteinase (MMP) activity, GM-6001, was purchased from Calbiochem. All other chemicals were of reagent grade.
Pressure apparatus.
To study the effects of pressure on cells in vitro, we used a custom-designed motorized pressure apparatus. To maintain constant temperature, atmosphere, and humidity, we placed the entire system in a CO2 incubator. Continuous exchange of the incubator atmosphere is facilitated via inlet and outlet valves. This novel system can reproducibly apply pressures of 20–200 mmHg (1 mmHg = 1.3595 cmH2O).
Cultures.
HKC-8 cells were obtained from Lorraine Racusen (Department of Pathology, John Hopkins University). Cultures were grown in a humidified atmosphere of 5% CO2-95% air at 37°C in DMEM containing 1,000 mg/l d-glucose, l-glutamine, 25 mM HEPES buffer, and 110 mg/l sodium pyruvate and supplemented with 10% FBS, penicillin (100 U/ml), and streptomycin (100 mg/ml). Cells were trypsinized, suspended in complete medium, and cultured in 25- and 75-mm2 flasks. When cells reached 60–80% confluence, the medium was replaced with fresh serum-free medium. For cells requiring 12–36 h of stimulation, cultures were at 60% confluency; in all other experiments (5 min–4 h), cultures were at 80% confluency at the start of the experiment. Pressure was applied at 0 mmHg (control) or 60 mmHg. A known stimulus for iNOS induction, a cytokine mixture (CM) composed of human recombinant IL-1β (1 ng/ml), TNFα (25 ng/ml), and IFNγ (400 U/ml), was used as a positive control (48).
Cell death.
Cell viability was assessed using the trypan blue exclusion method. HKC-8 cells exposed to the various inhibitors (AG-1478, AG-183, AG-490, BAY, MG, and SB-202190 at 10 and 100 μM) for 120 min in the absence and presence of 60 mmHg pressure or EGF or CM were assessed. Cell death was measured at 24 h in the presence and absence of the inhibitors AG-1478, AG-490, BAY, SB-202190 (10 μM), and CHX (10 μg/ml) after exposure to 60 mmHg pressure or treatment with EGF or CM. Cell death was also measured at 36 h after exposure to 60 mmHg pressure or treatment with EGF or CM. Cells were detached in a solution of 0.25% trypsin-EDTA (GIBCO) in PBS, pH 7.4. Cells were counted using a hemocytometer with the addition of trypan blue. Cell death was <8% at 120 min and <15% at 24 and 36 h.
RT-PCR.
RT was used to measure the steady-state levels of mRNA using primers for human iNOS and GAPDH (Table 1). HKC-8 cells were exposed to an increasing concentration of EGF (0, 10, 50, 100, and 500 nM) for 60 min and EGF at 10 nM over time (0, 5, 30, 60, and 120 min). HKC-8 cells exposed to the inhibitors of EGFR, NFκB, STAT3, and p38 MAPK were allowed to incubate for 30 min before the application of 60 mmHg pressure or treatment with EGF or CM for 120 min. The inhibitors AG-1478, AG-183, AG-490, BAY, and MG were used at 10 and 100 μM. Rat kidneys were also examined for the expression of iNOS, endothelial NO synthase (eNOS), soluble guanylyl cyclase (sGC), EGFR, and GAPDH (see Table 1 for primer sequence).
Table 1.
Primer sequence used for RT-PCR and qPCR
| 5′-3′ Sequence | Size, bp | |
|---|---|---|
| Human | ||
| iNOS | 257 | |
| Forward | GACTTCTGTGACCTCCA | |
| Reverse | GGTGATGCTCCCAGACAT | |
| GAPDH | 311 | |
| Forward | ACGGGAAGCTTGTCATCAAT | |
| Reverse | AGTTGTCATGGATGACCTTGG | |
| Rat | ||
| iNOS | ||
| Forward | GACTTCTGTGACCTCCA | |
| Reverse | GGTGATGCTCCCAGACAT | |
| eNOS | 478 | |
| Forward | CGCTCCTGCAAAGAAAAACT | |
| Reverse | TTCTGGCAAGACCGATTACAC | |
| sGC | 401 | |
| Forward | TCCATTTTCCCTGGTGATGT | |
| Reverse | TTGCTTGCCAGAGTGACATT | |
| EGFR | 299 | |
| Forward | GTGCAAATAGCAACAGTTCCA | |
| Reverse | TGTTGAGATACTCAGGGTTGC | |
| GAPDH | 451 | |
| Forward | ACCACAGTCCATGCCATCAC | |
| Reverse | TCCACCACCCTGTTGCTGTA |
qPCR, quantitative PCR; iNOS, inducible nitric oxide synthase; eNOS, endothelial nitric oxide synthase; sGC, soluble guanylyl cyclase; EGFR, epidermal growth factor receptor.
Total RNA was extracted using the TRIzol-chloroform extraction procedure. mRNA was purified using the Oligotex mRNA extraction kit (Qiagen, Valencia, CA) according to the manufacturer's instructions. mRNA concentration and purity were determined by measurement of absorbance at 260 nm. RT-PCR was performed using the Qiagen One-Step PCR kit with equal amounts of transcript (20–100 ng): PCR was performed in an automated thermal cycler (ThermoHybrid PX2) with an initial activation step (for HotStart Taq DNA polymerase activation) of 15 min at 95°C followed by 35 cycles of denaturation for 45 s at 94°C, annealing for 30 s at 60°C, and extension for 60 s at 72°C. PCR products were separated by a 2% agarose gel electrophoresis. Bands on gels were visualized by ethidium bromide staining and analyzed using NIH Image J densitometric analysis software.
Real-time PCR.
Housekeeping gene GAPDH primer was designed as described elsewhere (44). iNOS primer was designed using the Primer 3 program. HKC-8 cells were subjected to 60 mmHg pressure or treated with EGF (10 nM) or CM over time (0, 5, 30, 60, and 120 min). Use of Invitrogen SuperScript III First-Strand Synthesis System for RT-PCR and Platinum SYBR Green Quantitative PCR SuperMix UDG allows RT and PCR to take place. The following RT was employed using 500 ng of RNA: denaturation for 5 min at 65°C, 10–20 min at 4°C, cDNA synthesis for 50 min at 50°C, termination of the reaction for 5 min at 85°C, and removal of RNA with addition of 1 μl of RNaseH for 20 min at 37°C. Quantitative PCR protocol was employed using 2 μl of the RT product: RT for 2 min at 50°C, initial activation step (for HotStart Taq DNA polymerase activation) for 2 min at 95°C, denaturation for 15 s at 95°C, annealing for 30 s at 60°C, and extension for 30 s at 72°C; 35 rounds of amplification were conducted. To ensure an accurate quantification of the desired product, we performed an optional data acquisition step in a fourth segment of the PCR run according to manufacturer's protocol. A melting step, by slow heating from 65°C to 95°C at 0.2°C/s, was performed at the end of reaction to eliminate nonspecific fluorescence signals. Threshold cycle (CT) values were acquired using the DNA Engine Opticon Continuous Fluorescence Detection System (Bio-Rad, Waltham, MA). The specificity of the desired products was determined using high-resolution gel electrophoresis. Quantification for real-time data was determined using the 2−ΔΔCT method (19).
iNOS ELISA.
iNOS ELISA was conducted on HKC-8 cells incubated with EGF and CM for 4, 12, 24, and 36 h, as well as on HKC-8 cells subjected to 60 mmHg pressure or treated with EGF or CM for 24 h in the absence and presence of inhibitors. The inhibitors AG-1478, AG-183, AG-490, BAY, MG, SB-202190, and GM-6001 at 10 μM and CHX and anti-EGF at 10 μg/ml were added to HKC-8 cells for 60 min before application of 60 mmHg pressure or treatment with EGF (10 nM) or CM for 24 h. Cells were washed twice with PBS. Cells were lysed, and iNOS protein expression was assessed using the human iNOS Quantikine kit (R & D Systems, Minneapolis, MN) according to the manufacturer's instruction. Data were normalized using BSA assay to determine total protein concentration.
EGF ELISA.
EGF ELISA was conducted on HKC-8 cells after application of 60 mmHg pressure for 5, 30, 60, and 120 min. Supernatants were collected and assayed according to the human EGF Quantikine kit (R & D Systems) according to the manufacturer's instruction. BSA assay was used to determine total protein concentration. Data were normalized to total protein concentration.
Immunoblotting.
Cells were subjected to 60 mmHg pressure or treated with EGF for 0, 2.5, 5, 10, 15, 20, and 30 min in the presence and absence of the EGFR inhibitor AG-1478 (10 μM) for 30 min. Cells were collected and lysed using RIPA buffer (Pierce Biotechnology). Cellular proteins were separated by SDS-polyacrylamide gel (7.5% and 12%) electrophoresis (50 and 25 μg of protein per lane) and then transferred onto a polyvinylidene difluoride membrane. The immobilized proteins were visualized by subsequent incubation with polyclonal rabbit antibody against human EGFR, phosphorylated EGFR (pEGFR), NFκB p65, phosphorylated NFκB (pNFκB) p65, STAT1, phosphorylated STAT1 (pSTAT1), STAT3, and phosphorylated STAT3 (pSTAT3). A polyclonal horseradish peroxidase-conjugated goat anti-rabbit IgG (Bio-Rad) was used as secondary antibody, and staining was performed with the BM Chemiluminescence Western Blotting Kit (Bio-Rad). Initial analysis for EGFR was also performed in resting HKC-8 cells.
Animals.
Sprague-Dawley rats underwent left ureteral ligation at the end of the lower ureter, just above the ureterovesical junction with 4-0 silk suture. A midline abdominal incision was made under sterile conditions. Animals were anesthetized with ketamine-xylazine cocktail. Obstructed and unobstructed kidneys were harvested after 30, 60, and 120 min. Kidneys were perfused with 1× PBS for 10 min then sectioned and stored for RT-PCR and immunohistochemistry. For immunohistochemistry, tissue was placed in formalin (36 h), embedded in paraffin, sectioned, and stained for EGFR, pEGFR, and iNOS. Animal treatment adhered to approved institutional guidelines. We also sectioned formalin-fixed, paraffin-embedded kidney tissue remaining from a previous study (28) and stained for EGFR and iNOS.
Immunohistochemistry: 120 min and 24 h of obstruction.
Paraffin-embedded kidney sections were cut at 5 μm. Slides were deparaffinized in CitriSolvent (Fisher Scientific) and alcohol, with endogenous peroxidase activity quenched with hydrogen peroxide for 10 min. Slides were incubated in primary antibody for iNOS, EGFR, and pEGFR (Santa Cruz Biotechnology and Cell Signaling Technology) at 1:200, 1:25, and 1:100 dilutions, respectively, overnight at 4°C; negative control slides were incubated in BSA antibody buffer without secondary antibody. Slides were washed in PBS (3 times, 5 min/wash) and incubated for 30 min at room temperature in anti-rabbit secondary antibodies (1:1,000 dilution; Vector Laboratories). Slides were washed in PBS (3 times, 5 min/wash) and incubated for a further 30 min at room temperature in tertiary antibodies (1:1,000 dilution; Vector Laboratories). Slides were developed in diaminobenzidine and counterstained with 10% hematoxylin. Immunofluorescence was also conducted using EGFR and Alexa Fluor antibody (Invitrogen) according to the manufacturer's instructions.
Statistics.
Values are means ± SE. For statistical significance, data were compared by t-test and paired t-test (2-tailed). Differences were considered statistically significant at P < 0.05.
RESULTS
EGFR is expressed in HKC-8 cells.
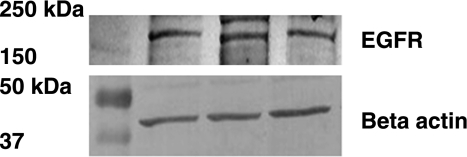
Using immunoblotting methods, we detected EGFR protein in quiescent HKC-8 cells (Fig. 1).
Fig. 1.
Protein expression of epidermal growth factor (EGF) receptor (EGFR) in human proximal tubule (HKC-8) cells. EGFR and β-actin proteins were detected by immunoblotting. Gels were loaded with 25 μg of protein. Anti-EGFR and -β-actin antibodies were used to detect the respective proteins.
Increase in iNOS mRNA expression elicited by EGF is earlier than that elicited by pressure.
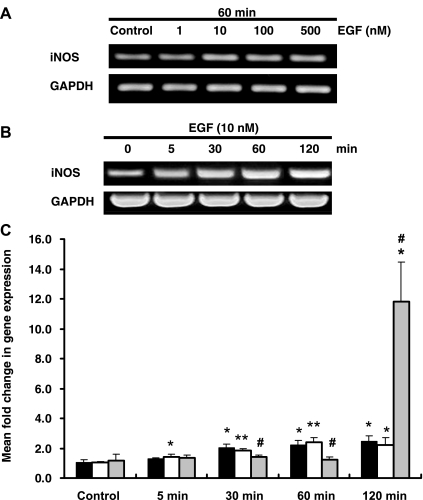
EGFR signals the induction of iNOS in human ONHA and carcinoma cells in response to pressure + EGF and EGF, respectively (36, 37, 43). To determine whether EGF/EGFR induces iNOS mRNA expression in HKC-8 cells, we treated cells with increasing concentrations (0–500 nM) of EGF. iNOS mRNA expression was increased with 1–10 nM EGF; however, at 100 and 500 nM, no further increase was detected (Fig. 2A).
Fig. 2.
Inducible nitric oxide synthase (iNOS) mRNA expression in response to 60 mmHg pressure, EGF, and cytokine mix (CM). A: representative gel of iNOS mRNA expression in response to 60 min of treatment with increasing EGF concentration (1, 10, 100, and 500 nM). B: representative gel of iNOS mRNA expression in response to EGF (10 nM) over time (0, 5, 30, 60, and 120 min). HKC-8 iNOS mRNA levels were detected using RT-PCR. C: iNOS expression in response to 60 mmHg pressure (solid bars), EGF (open bars), and CM (gray bars) over time (5, 30, 60, and 120 min). iNOS expression was detected using quantitative PCR. Values are means ± SE (n ≥ 4). *P < 0.05; **P < 0.01 vs. control. #P < 0.05 vs. 60 mmHg pressure or EGF.
To compare iNOS mRNA expression in response to EGF (10 nM) or 60 mmHg pressure, we stimulated HKC-8 cells over time (0–120 min). CM was used as a positive control. A time-dependent increase in iNOS mRNA expression was detected when cells were treated with 10 nM EGF (Fig. 2, B and C). HKC-8 cells treated with EGF demonstrated a significant early increase of iNOS mRNA at 5 min, with increasing expression up to 120 min (1.02 ± 0.09, 1.44 ± 0.13, and 2.22 ± 0.47 fold change for control, 5 min, and 120 min, respectively, P < 0.05 vs. control for 5 and 120 min; Fig. 2C). In HKC-8 cells exposed to 60 mmHg pressure, iNOS expression was significantly increased from 30 to 120 min (1.08 ± 0.16, 2.06 ± 0.21, and 2.44 ± 0.37 fold change for control, 30 min, and 120 min, respectively, P < 0.05 vs. control for 30 and 120 min; Fig. 2C). CM induced a significant increase in iNOS expression at 120 min (1.14 ± 0.43 and 11.82 ± 2.67 fold change for control and 120 min, respectively, P < 0.05; Fig. 2C). For the rest of the experiments, 10 nM EGF and 60 mmHg pressure were used.
iNOS protein expression is increased in response to EGF or CM.
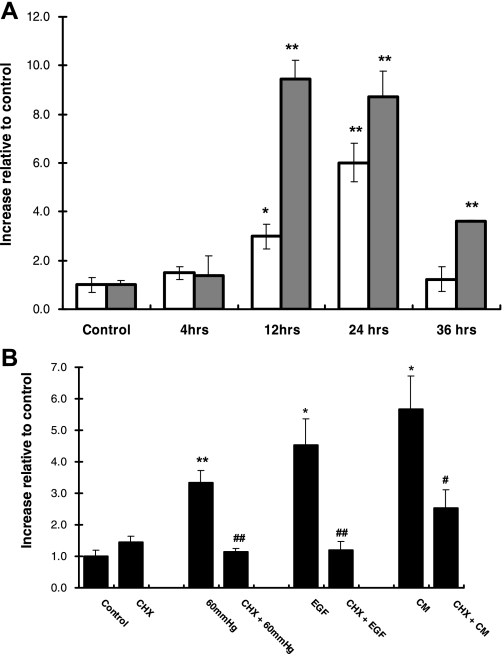
We next examined whether HKC-8 cells express iNOS protein in response to EGF. HKC-8 cells were treated with EGF for 4, 12, 24, and 36 h. As a positive control, cells were treated with CM. As shown in Fig. 3A, EGF significantly increased iNOS protein expression at 12 and 24 h. iNOS expression was three times greater at 12 h in CM- than in EGF-treated HKC-8 cells (Fig. 3A). The protein expression of iNOS was decreased by 36 h, whereas iNOS expression in CM-treated cells was still elevated compared with control (1.00 ± 0.19 and 3.60 ± 0.07 for control and 36 h, respectively, P < 0.005; Fig. 3A).
Fig. 3.
iNOS protein expression in response to 60 mmHg pressure, EGF, or CM and in the presence of the translational inhibitor cycloheximide (CHX). A: iNOS protein expression in response to EGF (open bars) and CM (gray bars) over time. Values are means ± SE (n ≥ 4). *P < 0.05; **P < 0.005 vs. control. B: iNOS protein expression in response to 60 mmHg pressure EGF, and CM in the absence and presence of CHX for 24 h. iNOS protein was detected using ELISA. Values are means ± SE (n ≥ 5). *P < 0.01; **P < 0.001 vs. control. #P < 0.05; ##P < 0.01 vs. individual treatment group.
To ensure that new protein synthesis was occurring as a result of these stimuli, we employed the translation inhibitor CHX. Cells were incubated for 60 min with CHX and then exposed to 24 h of 60 mmHg pressure or treated with EGF or CM. As shown in Fig. 3B, CHX inhibited the increase in iNOS resulting from 60 mmHg pressure or EGF to basal level (3.35 ± 0.39, 1.14 ± 0.12, 4.52 ± 0.83, and 1.18 ± 0.28 increase relative to control for pressure, CHX + pressure, EGF, and CHX + EGF, respectively, P < 0.01 vs. pressure for all; Fig. 3B). Similarly, CHX significantly inhibited CM-induced iNOS expression, but not to basal levels (1.00 ± 0.18 and 2.52 ± 0.60 for control and CHX+CM, respectively, P = 0.063; Fig. 3B). CHX did not affect the basal level of iNOS protein expression.
Inhibition of EGFR suppresses iNOS expression in response to pressure or EGF, but not CM.
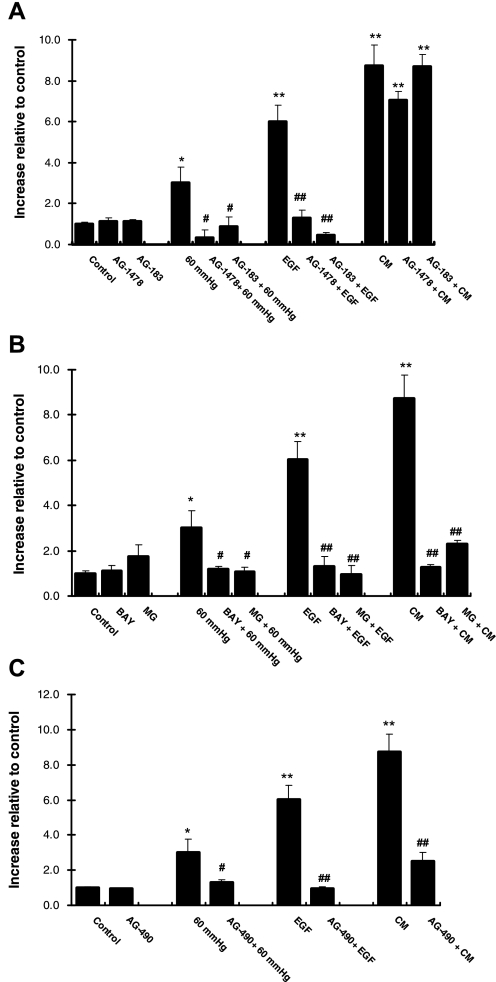
Inhibitors of EGFR suppressed iNOS expression after stimulation of ONHA with pressure or EGF, but not CM (36, 43). We therefore examined whether EGFR is involved in the induction of iNOS in HKC-8 cells in response to 60 mmHg pressure or EGF. CM was used as positive control. Using two different inhibitors of EGFR (AG-1478 and AG-183), we demonstrated that the increase in iNOS protein expression resulting from 24 h of 60 mmHg pressure or EGF was inhibited [3.02 ± 0.75 and 0.32 ± 0.39 increase relative to control for pressure and AG-1478 + pressure, respectively (P < 0.05) or 6.02 ± 0.80 and 1.32 ± 0.34 for EGF and AG-1478 + EGF, respectively (P < 0.0001); Fig. 4A]. CM induction of iNOS protein expression was not affected by either EGFR inhibitor (Fig. 4A). iNOS mRNA expression was suppressed to basal levels in response to 60 mmHg pressure or EGF in the presence of the EGFR inhibitors (see Supplemental Fig. 1A in the online version of this article). Only AG-1478 at the higher concentration effectively suppressed CM-induced iNOS mRNA expression to basal levels (see Supplemental Fig. 1A). EGFR inhibitors did not affect the basal level of iNOS (mRNA or protein) expression.
Fig. 4.
iNOS protein expression in the presence of EGFR, NFκB, and STAT3 inhibitors. A: iNOS protein expression in the absence and presence of the EGFR inhibitors AG-1478 and AG-183 (10 μM), followed by 60 mmHg pressure, EGF, or CM for 24 h. Values are means ± SE (n ≥ 4). *P < 0.05; **P < 0.001 vs. control. #P < 0.05; ##P < 0.0001 vs. individual treatment group. B: iNOS protein expression in the absence and presence of the NFκB inhibitors MG-132 (MG) and BAY 11-7058 (BAY, 10 μM), followed by 60 mmHg pressure, EGF, or CM for 24 h. Values are means ± SE (n ≥ 4). *P < 0.05; **P < 0.001 vs. control. #P < 0.05; ##P < 0.005 vs. individual treatment group. C: iNOS protein expression in the absence and presence of the STAT3 inhibitor AG-490 (10 μM), followed by 60 mmHg pressure, EGF, or CM for 24 h. iNOS protein was detected using ELISA. Values are means ± SE (n ≥ 4). *P < 0.05; ** P < 0.001 vs. control. #P < 0.05; ##P < 0.005 vs. individual treatment group.
Inhibition of NFκB suppresses iNOS expression in response to pressure, EGF, or CM.
EGF or stimulation of EGFR leads to the activation NFκB in a variety of cells (20, 22, 52), whereas inhibition of NFκB suppresses pressure- and CM-induced iNOS expression in ONHA (43). To determine whether a similar response occurs with pressure and EGF, we treated HKC-8 cells with the two NFκB inhibitors, MG and BAY (see methods). Both inhibitors suppressed iNOS protein expression in response to 60 mmHg pressure, EGF, or CM (Fig. 4B). iNOS mRNA expression was inhibited in the presence of the NFκB inhibitors after treatment with EGF or CM (see Supplemental Fig. 1B). NFκB inhibitors did not affect the basal level of iNOS (mRNA or protein) expression.
Inhibition of STAT3 suppresses iNOS expression in response to pressure, EGF, or CM.
EGFR-STAT3 interaction results in nuclear translocation and transcriptional activation of iNOS (37). We sought to examine the role of STAT3 in iNOS induction in HKC-8 cells. AG-490 was used to selectively inhibit STAT3 activation. Increased iNOS protein expression as a result of 24 h at 60 mmHg pressure or EGF or CM treatment was significantly inhibited in the presence of AG-490 (Fig. 4C). AG-490 inhibited iNOS mRNA expression to basal levels after 60 mmHg pressure, EGF, or CM (see Supplemental Fig. 1C). AG-490 did not affect the basal level of iNOS (mRNA or protein) expression.
Increased phosphorylation of EGFR, NFκB p65, and STAT3 in response to pressure or EGF.
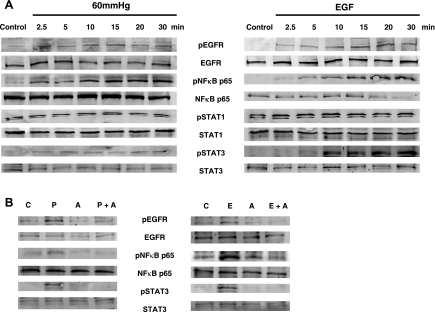
Activation and/or nuclear localization of EGFR, NFκB, STAT1, and STAT3 has been demonstrated after pressurization and/or EGF treatment (11, 20, 22, 36, 37, 50, 54). In addition, after obstruction, NFκB and STAT3 are activated (33, 39, 42). To further confirm the involvement of EGFR, NFκB, STAT1, and STAT3, we used immunoblot methods to assess the activation of these proteins after 60 mmHg pressure or EGF over time (2.5–30 min). As shown in Fig. 5A, 60 mmHg pressure or EGF activated EGFR, NFκB p65, and STAT3 within 2.5 min, with increased phosphorylation up to 30 min. STAT1 expression was not affected with either stimulus.
Fig. 5.
Activation of EGFR, NFκB, and STAT, as shown in representative immunoblots of phosphorylated EGFR (pEGFR), NFκB (pNFκB) p65, STAT1 (pSTAT1), and STAT3 (pSTAT3). A: in response to 60 mmHg pressure or EGF. B: in response to 60 mmHg pressure (P) or EGF (10 nM, E) in the presence of the EGFR inhibitor AG-1478 (10 μM, A). Anti-pEGFR, -pNFκB p65, -pSTAT1, and -pSTAT3 were used to detect proteins. C, control. Blots are representative of results from 2 experiments.
We next examined EGFR, NFκB p65, and STAT3 activation with or without EGFR inhibitor (AG-1478) pretreatment. In the presence of the EGFR inhibitor, the increased phosphorylation of EGFR, NFκB p65, and STAT3 as a result of 60 mmHg pressure or EGF was inhibited (Fig. 5B). Total EGFR, NFκB p65, and STAT1 and STAT3 expression were constant throughout all conditions in the experiments conducted (see the unphosphorylated forms in Fig. 5).
Inhibition of p38 MAPK suppresses iNOS expression in response to pressure, EGF, or CM.
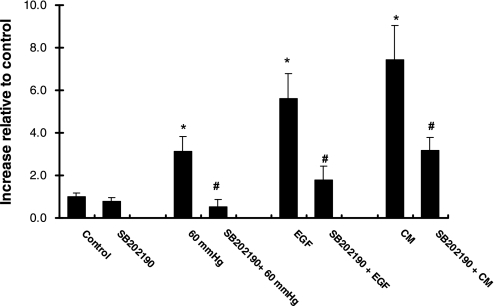
p38 MAPK has been shown to mediate transcriptional activation of iNOS (1, 43, 47) and internalization of EGFR (12, 57, 63). Endocytosis of the EGFR/STAT3 pathway has been shown to be essential for STAT3 nuclear translocation and gene expression (2). To further explore the mechanism involved in pressure-induced regulation of EGFR, we selectively inhibited p38 MAPK activity with SB-202190. As shown in Fig. 6, SB-202190 effectively inhibited pressure-induced iNOS protein expression (3.12 ± 0.72 and 0.53 ± 0.35 increase relative to control for pressure and SB-202190 + pressure, respectively, P < 0.05). Similar effects were seen in the presence of EGF or CM (Fig. 6). SB-202190 did not affect the basal level of iNOS protein expression.
Fig. 6.
iNOS protein expression in the presence of p38 MAPK inhibitor. iNOS protein expression in the absence and presence of the p38 MAPK inhibitor (10 μM), followed by 60 mmHg, EGF, or CM for 24 h was detected using ELISA. Values are means ± SE (n ≥ 4). *P < 0.05 vs. control. #P < 0.05 vs. individual treatment group.
Growth factor shedding into the extracellular space may be responsible for the induction of iNOS expression.
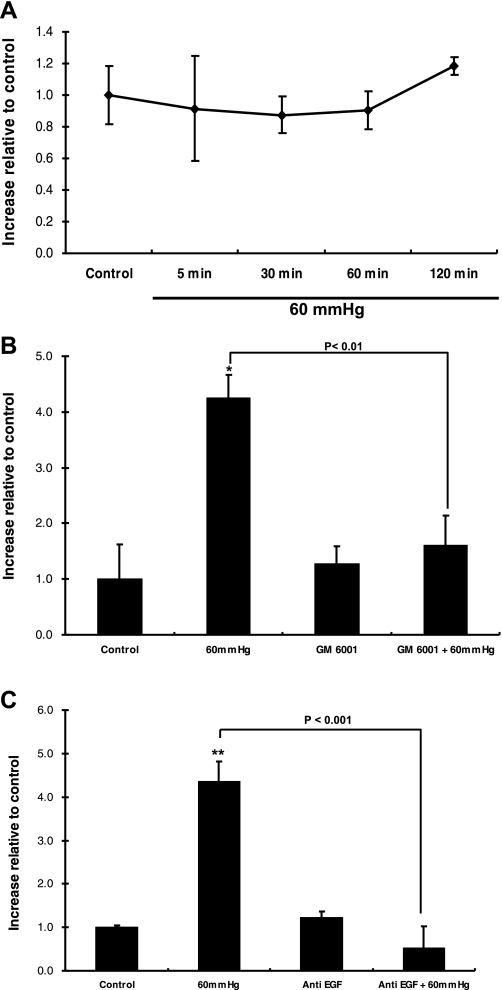
Pressure can lead to growth factor shedding into the extracellular space, triggering cellular signaling via autocrine/paracrine binding to EGFR (54). The kidney is a major site for EGF production (3, 62). Since physiological concentrations of EGF elicit an increase in iNOS expression, we first used ELISA to measure the EGF concentration in culture medium obtained after 60 mmHg pressure for 5, 30, 60, and 120 min. No change in EGF concentration was detected after application of pressure (Fig. 7A). Using a broad-spectrum inhibitor of MMP activity (GM-6001) to inhibit ectodomain shedding of transmembrane EGF family members (54), we obtained data showing that iNOS expression is governed by growth factor shedding in pressurized HKC-8 cells (Fig. 7B). GM-6001 did not affect the basal level of iNOS protein expression (Fig. 7B).
Fig. 7.
Identification of the growth factor responsible for iNOS induction. A: EGF protein expression in the absence and presence of 60 mmHg over time (5, 30, 60, and 120 min). EGF protein was detected using ELISA. Values are means ± SE (n ≥ 5). B: iNOS protein expression in the absence and presence of the matrix metalloproteinase inhibitor GM-6001. Values are means ± SE (n = 4). *P < 0.01 vs. control. C: iNOS protein expression in the absence and presence of anti-EGF inhibitor. iNOS protein was detected using ELISA. Values are means ± SE (n = 6). **P < 0.01 vs. control.
To identify whether EGF was responsible for this effect, we pressurized cells in the presence and absence of neutralizing antibody to EGF. As seen in Fig. 7C, anti-EGF inhibited the pressure-induced iNOS protein expression (4.35 ± 0.46 and 0.52 ± 0.5 for pressure and anti-EGF + pressure, respectively, P < 0.001). The basal level of iNOS protein expression was not affected by anti-EGF (Fig. 7C).
iNOS and sGC expression are increased after ureteral obstruction: pEGFR is present on the apical cell surface of renal tubules of obstructed kidney.
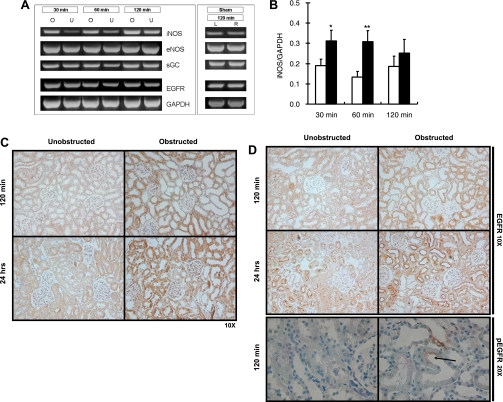
iNOS and EGFR expression are increased after UUO (3, 24, 28, 56). We examined iNOS, eNOS, and EGFR expression at 30, 60, and 120 min after UUO. In addition, we examined a downstream target of NO, sGC expression, which has been demonstrated in vitro to increase with pressure (4). Expression and localization of EGFR and iNOS were also examined at 120 min and 24 h after UUO. There was a significant increase in iNOS mRNA expression at 30 and 60 min [0.19 ± 0.03 and 0.31 ± 0.05 for unobstructed and obstructed, respectively, at 30 min (P < 0.05) and 0.13 ± 0.03 and 0.31 ± 0.05 for unobstructed and obstructed, respectively, at 60 min (P < 0.01); Fig. 8, A and B]. There was an increase in the expression of sGC and EGFR at 60 min after UUO (data not shown). eNOS expression did not change after UUO (data not shown). In the unobstructed kidneys, iNOS expression was minimal in the cortical tubular cells. iNOS staining was increased predominantly in the renal tubules of the obstructed kidney after 120 min and 24 h of UUO (Fig. 8C). No change in the intensity of EGFR expression was evident in the obstructed kidney compared with the unobstructed contralateral kidney. However, in the 24-h obstructed and contralateral kidneys, EGFR was predominantly localized apically in the tubular cells (Fig. 8D). In the sham-operated animals, mRNA expression of iNOS, eNOS, sGC, and EGFR was not different between left and right kidneys, confirming that the experimental trauma of the surgery was not affecting expression of these genes (Fig. 8A).
Fig. 8.
iNOS, endothelial nitric oxide synthase (eNOS), soluble guanylate cyclase (sGC), and EGFR expression and activation after unilateral ureteral obstruction (UUO). A: representative gels of iNOS, eNOS, sGC, and EGFR mRNA expression in response to 30, 60, and 120 min of UUO [obstructed (O) and unobstructed (U)] and 120 min sham operation [left kidney (L) and right kidney (R)]. B: iNOS mRNA expression after 30, 60, and 120 min of UUO. mRNA levels were detected using RT-PCR. Solid bars, obstructed; open bars, unobstructed. Densitometric analysis was performed using NIH Image J software. mRNA expression was normalized to GAPDH. Values are means ± SE (n ≥ 8). *P < 0.05; **P < 0.01 vs. control. C: immunohistochemistry of iNOS protein expression after 120 min and 24 h of UUO. Anti-iNOS antibody was used to identify iNOS-positive cells (brown stain). D: immunohistochemistry of EGFR and pEGFR protein expression after 120 min and 24 h of UUO. Anti-EGFR antibody was used to identify EGFR-positive cells (brown stain); anti-pEGFR antibody was used to identify pEGFR-positive cells. Arrow, labeling for pEGFR.
Immunohistochemistry was also used to investigate the presence of pEGFR at 120 min after UUO. pEGFR was not apparent in the contralateral kidney (Fig. 8D). In contrast, immunohistochemical labeling for pEGFR was detected in the obstructed kidney. The distribution of pEGFR in the obstructed kidney was apparent in the apical cell surface of the renal tubules (Fig. 8D).
DISCUSSION
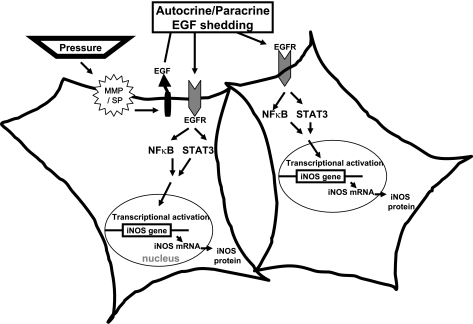
Sustained pressure is an important contributor to pathological insults in a number of organs (8, 41, 51, 55). Identification of the mechanisms by which signals are transduced by pressure is important in identifying the targets that may be manipulated to therapeutic advantage. This report presents data showing that pressure can lead to the activation of EGFR and downstream targets NFκB and STAT3, leading to an increase in iNOS expression in HKC-8 cells. This conclusion is consistent with the observation that cells exposed to inhibitors of EGF, EGFR, NFκB, or STAT3 in the presence of pressure or EGF prevented iNOS induction. Figure 9 depicts a model of pressure-induced EGF/EGFR activation that illustrates our findings. In addition, our results show an extremely rapid increase in iNOS mRNA expression in response to exogenous EGF compared with pressure. In vivo findings corroborated our in vitro data.
Fig. 9.
Model of iNOS induction: renal proximal tubular cell response to pressure. Our findings favor a model where pressure promotes early shedding of the EGFR ligand, EGF that is proteolytically cleaved by matrix metalloproteinase (MMP). Once released, ligand binding to the receptor occurs via an autocrine/paracrine event. EGFR signals to NFκB and STAT3 promote nuclear translocation and transcriptional activation of the iNOS gene and subsequent translation of the protein. In the disease state (i.e., UUO), where EGFR levels are elevated and apically located, NFκB and STAT3 are recruited to the receptor. On activation, NFκB and STAT3 translocate to the nucleus to activate iNOS transcription. In vivo, other EGFR ligand(s) may be involved in this process.
The mechanism underlying iNOS expression in response to pressure remains unknown. EGFR has been implicated in this signaling pathway (36, 43). pEGFR is detected as early as 5 min after pressurization in ONHA and NHBE cells (36, 54). Nuclear localization has been identified within 10 min of pressurization in ONHA (36), whereas EGF stimulation of human epithelial carcinoma cells (A431) resulted in phosphorylation and nuclear localization within 1 min (34). Inhibition of EGFR has been shown to suppress iNOS expression resulting from pressurization (43), and we have demonstrated similar findings. pEGFR was detected 2.5 min after pressure application or EGF treatment.
Previously, heparin-binding EGF shedding has been shown upstream of pressure-stimulated EGFR activation (54). In our system, data suggest that EGF is the growth factor upstream of EGFR. Exogenous EGF mimicked the effects of pressure on iNOS expression, with an earlier significant increase in iNOS mRNA expression at 5 min. Time taken for pro-EGF to be shed in response to pressure may be responsible for differences in initial iNOS induction. An assay of the medium of pressurized HKC-8 cells failed to detect an increase in EGF. Dilution of EGF in the conditioned medium may have occurred. However, in the presence of the broad specific inhibitor of MMP (GM-6001) or neutralizing antibody against EGF, the increase in iNOS protein expression resulting from pressure was inhibited. These data suggest that the pro-EGF can be cleaved under pressure and is accountable for the observed EGFR signaling and iNOS expression in HKC-8 cells. We did not identify the MMP that leads to the cleavage of pro-EGF as a result of pressure.
Activation of transcription factors STATs and NFκB downstream of EGFR has been demonstrated (11, 20, 22, 37, 52). STAT and NFκB are thought to be the major pathways involved in iNOS induction (20, 31, 37). The iNOS promoter of human, rat, and mouse contains multiple binding sites for NFκB and STAT (17, 31). Lo et al. (37) provided conclusive evidence that the EGF/EGFR/STAT3 growth factor pathway activates iNOS gene expression and subsequent NO synthesis in human tumor cells (37). Similarly, activation of NFκB has been shown to occur via the EGF/EGFR pathway (20, 22, 45). Inhibition of NFκB in pressure-stimulated OHNA and HKC-8 cells inhibited iNOS expression (4, 43). Using inhibitors specific for EGFR, STAT3, and NFκB, we demonstrated their effectiveness in blocking iNOS expression in HKC-8 cells in response to pressure, EGF, or CM. Immunoblotting confirmed the activation of EGFR, NFκB p65, and STAT3 within 2.5 min after pressure application or EGF treatment. Inhibition of EGFR suppressed this activation, suggesting that NFκB p65 and STAT3 are downstream of EGFR. STAT1 was not affected, but we cannot rule out the possibility that it could have been activated later, after 30 min. Studies by Yu et al. (60, 61) demonstrated that STAT3-NFκB p65 interaction decreases the transcription of iNOS, thus controlling the magnitude of iNOS induction, and possibly explain the finding that induction in pressure- or EGF-stimulated cells was less than that stimulated by CM. Involvement of the TNFα/NFκB and INFγ/JAK2/STAT1α pathways in iNOS induction has been demonstrated in murine and human cells (31). Also, in addition to activating IFNγ, IL-1, and TNF receptors, CM has been known to activate receptor tyrosine kinases (31). TNFα and IFNγ have been shown to activate EGFR (5, 25) and probably account for the portion of CM-induced iNOS that is blocked by EGFR inhibitors.
We observed an increase in iNOS expression as a result of p38 MAPK signaling. The consistent inhibition of iNOS protein production by a specific inhibitor of p38 MAPK (SB-202190) in response to pressure, EGF, or CM highlights the relevance of p38 MAPK in iNOS induction. Increase in iNOS expression via p38 MAPK activation has been demonstrated (1, 43, 47). MAPK inhibition has been shown to decrease the CM-stimulated increase in iNOS protein expression in human kidney epithelial cells and ONHA (43, 47) but to have no effect on iNOS expression in pressurized ONHA (43). Differences in cell types and amount of pressure may explain the discrepancies in the literature. Transient phosphorylation of EGFR by p38 MAPK has been shown to lead to internalization via a clathrin-mediated process (57, 63). Further studies are needed to clarify the role of p38 MAPK activation, EGFR internalization, and nuclear localization in the induction of iNOS after pressure.
Our in vivo study demonstrated a significant increase in iNOS expression in the obstructed kidneys and confirms data presented by other investigators (16, 24, 28). In HKC-8 cells, pressure induces a time-dependent increase in iNOS expression that is not observed in the obstructed kidney. Maximum increase of iNOS expression was documented at 60 min in vivo. An increase in transforming growth factor-β (TGFβ) may be affecting iNOS expression after UUO (40). TGFβ has been shown to be a negative regulator of iNOS expression; iNOS and NO were increased in the kidney of TGFβ-deficient mice (58). eNOS mRNA expression remained unchanged after obstruction and is consistent with our in vitro data (4). EGFR was apically localized in the 24-h obstructed and contralateral kidneys. Kiley et al. (29) demonstrated the change in EGFR localization resulting from changes in the polarization of tubular cells as a result of obstruction. In normal kidneys, EGFR is present in the basolateral membrane of tubular cells (9, 18, 29), whereas apical membrane localization is seen in the dilated tubules of obstructed kidneys (29). Phosphorylated EGFR was evident in the apical surface of the renal tubules of the obstructed kidney (120 min), and not in the contralateral unobstructed kidney, indicating activation of EGFR in vivo when pressure increases in response to obstruction.
The results clarify the mechanism whereby pressure mediates the activation of the EGF/EGFR cascade leading to iNOS induction. In addition, our data lead us to speculate that EGFR relocation might have a functional significance. Relocation and activation of EGFR may provide a mechanism for regulating the time course or spatial distribution of NO production, resulting in distinctly different consequences for the cell. Further experiments with this system should provide insight into the relevance of pressure-EGFR-mediated iNOS induction in a number of physiological and pathophysiological conditions.
GRANTS
This study is supported in part by National Institute of Diabetes and Digestive and Kidney Diseases Grant DK-58355 (D. Felsen). Other support was provided by the Frederick J. and Theresa Dow Wallace Fund of the New York Community Trust.
Supplementary Material
REFERENCES
- 1.Bhat NR, Feinstein DL, Shen Q, Bhat AN. p38 MAPK-mediated transcriptional activation of inducible nitric-oxide synthase in glial cells. Roles of nuclear factors, nuclear factor-κB, cAMP response element-binding protein, CCAAT/enhancer-binding protein-β, and activating transcription factor-2. J Biol Chem 277: 29584–29592, 2002. [DOI] [PubMed] [Google Scholar]
- 2.Bild AH, Turkson J, Jove R. Cytoplasmic transport of Stat3 by receptor-mediated endocytosis. EMBO J 21: 3255–3263, 2002. [DOI] [PMC free article] [PubMed] [Google Scholar]
- 3.Bor MV, Shi Y, Sorensen BS, Wen JG, Frokiaer J, Djurhuus JC, Nexo E. Increased TGF-α and EGF receptor mRNA expression in response to neonatal unilateral partial ureter obstruction in rats. Nephron Exp Nephrol 104: e76–e82, 2006. [DOI] [PubMed] [Google Scholar]
- 4.Broadbelt NV, Stahl PJ, Chen J, Mizrahi M, Lal A, Bozkurt A, Poppas DP, Felsen D. Early upregulation of iNOS mRNA expression and increase in NO metabolites in pressurized renal epithelial cells. Am J Physiol Renal Physiol 293: F1877–F1888, 2007. [DOI] [PubMed] [Google Scholar]
- 5.Burova E, Vassilenko K, Dorosh V, Gonchar I, Nikolsky N. Interferon-γ-dependent transactivation of epidermal growth factor receptor. FEBS Lett 581: 1475–1480, 2007. [DOI] [PubMed] [Google Scholar]
- 6.Chen CF, Yeh SU, Chien CT, Wu MS. Renal response during acute unilateral ureteral obstruction in rats. Neurourol Urodyn 20: 125–137, 2001. [DOI] [PubMed] [Google Scholar]
- 7.Chertin B, Rolle U, Solari V, Cascio S, Puri P. The role of nitric oxide in bladder urothelial injury after bladder outlet obstruction. BJU Int 94: 392–399, 2004. [DOI] [PubMed] [Google Scholar]
- 8.Chevalier RL Molecular and cellular pathophysiology of obstructive nephropathy. Pediatr Nephrol 13: 612–619, 1999. [DOI] [PubMed] [Google Scholar]
- 9.Chevalier RL Obstructive nephropathy: lessons from cystic kidney disease. Nephron 84: 6–12, 2000. [DOI] [PubMed] [Google Scholar]
- 10.Chevalier RL Pathogenesis of renal injury in obstructive uropathy. Curr Opin Pediatr 18: 153–160, 2006. [DOI] [PubMed] [Google Scholar]
- 11.Coffer PJ, Kruijer W. EGF receptor deletions define a region specifically mediating STAT transcription factor activation. Biochem Biophys Res Commun 210: 74–81, 1995. [DOI] [PubMed] [Google Scholar]
- 12.Cohen S, Fava RA. Internalization of functional epidermal growth factor:receptor/kinase complexes in A-431 cells. J Biol Chem 260: 12351–12358, 1985. [PubMed] [Google Scholar]
- 13.David M, Wong L, Flavell R, Thompson SA, Wells A, Larner AC, Johnson GR. STAT activation by epidermal growth factor (EGF) and amphiregulin. Requirement for the EGF receptor kinase but not for tyrosine phosphorylation sites or JAK1. J Biol Chem 271: 9185–9188, 1996. [DOI] [PubMed] [Google Scholar]
- 14.Felsen D, Schulsinger D, Gross SS, Kim FY, Marion D, Vaughan ED Jr. Renal hemodynamic and ureteral pressure changes in response to ureteral obstruction: the role of nitric oxide. J Urol 169: 373–376, 2003. [DOI] [PubMed] [Google Scholar]
- 15.Fermor B, Weinberg JB, Pisetsky DS, Misukonis MA, Banes AJ, Guilak F. The effects of static and intermittent compression on nitric oxide production in articular cartilage explants. J Orthop Res 19: 729–737, 2001. [DOI] [PubMed] [Google Scholar]
- 16.Fitzgerald J, Chou SY, Wahid A, Porush JG. Regional expression of inducible nitric oxide synthase in the kidney in dogs with unilateral ureteral obstruction. J Urol 166: 1524–1529, 2001. [PubMed] [Google Scholar]
- 17.Ganster RW, Guo Z, Shao L, Geller DA. Differential effects of TNF-α and IFN-γ on gene transcription mediated by NF-κB-Stat1 interactions. J Interferon Cytokine Res 25: 707–719, 2005. [DOI] [PubMed] [Google Scholar]
- 18.Gesualdo L, Di Paolo S, Calabro A, Milani S, Maiorano E, Ranieri E, Pannarale G, Schena FP. Expression of epidermal growth factor and its receptor in normal and diseased human kidney: an immunohistochemical and in situ hybridization study. Kidney Int 49: 656–665, 1996. [DOI] [PubMed] [Google Scholar]
- 19.Giulietti A, Overbergh L, Valckx D, Decallonne B, Bouillon R, Mathieu C. An overview of real-time quantitative PCR: applications to quantify cytokine gene expression. Methods 25: 386–401, 2001. [DOI] [PubMed] [Google Scholar]
- 20.Habib AA, Chatterjee S, Park SK, Ratan RR, Lefebvre S, Vartanian T. The epidermal growth factor receptor engages receptor interacting protein and nuclear factor-κB (NF-κB)-inducing kinase to activate NF-κB. Identification of a novel receptor-tyrosine kinase signalosome. J Biol Chem 276: 8865–8874, 2001. [DOI] [PubMed] [Google Scholar]
- 21.Harada S, Nakata T, Oguni A, Kido H, Hatta T, Fukuyama R, Fushiki S, Sasaki S, Takeda K. Contrasting effects of angiotensin type 1 and 2 receptors on nitric oxide release under pressure. Hypertens Res 25: 779–786, 2002. [DOI] [PubMed] [Google Scholar]
- 22.Haussler U, von Wichert G, Schmid RM, Keller F, Schneider G. Epidermal growth factor activates nuclear factor-κB in human proximal tubule cells. Am J Physiol Renal Physiol 289: F808–F815, 2005. [DOI] [PubMed] [Google Scholar]
- 23.Hegarty NJ, Watson RW, Young LS, O'Neill AJ, Brady HR, Fitzpatrick JM. Cytoprotective effects of nitrates in a cellular model of hydronephrosis. Kidney Int 62: 70–77, 2002. [DOI] [PubMed] [Google Scholar]
- 24.Hegarty NJ, Young LS, Kirwan CN, O'Neill AJ, Bouchier-Hayes DM, Sweeney P, Watson RW, Fitzpatrick JM. Nitric oxide in unilateral ureteral obstruction: effect on regional renal blood flow. Kidney Int 59: 1059–1065, 2001. [DOI] [PubMed] [Google Scholar]
- 25.Hirota K, Murata M, Itoh T, Yodoi J, Fukuda K. Redox-sensitive transactivation of epidermal growth factor receptor by tumor necrosis factor confers the NF-κB activation. J Biol Chem 276: 25953–25958, 2001. [DOI] [PubMed] [Google Scholar]
- 26.Islam N, Haqqi TM, Jepsen KJ, Kraay M, Welter JF, Goldberg VM, Malemud CJ. Hydrostatic pressure induces apoptosis in human chondrocytes from osteoarthritic cartilage through up-regulation of tumor necrosis factor-α, inducible nitric oxide synthase, p53, c-myc, and bax-α, and suppression of bcl-2. J Cell Biochem 87: 266–278, 2002. [DOI] [PubMed] [Google Scholar]
- 27.Ito K, Chen J, Khodadadian JJ, Seshan SV, Eaton C, Zhao X, Vaughan ED Jr, Lipkowitz M, Poppas DP, Felsen D. Liposome-mediated transfer of nitric oxide synthase gene improves renal function in ureteral obstruction in rats. Kidney Int 66: 1365–1375, 2004. [DOI] [PubMed] [Google Scholar]
- 28.Ito K, Chen J, Vaughan, ED Jr, Seshan SV, Poppas DP, Felsen D. Dietary l-arginine supplementation improves the glomerular filtration rate and renal blood flow after 24 h of unilateral ureteral obstruction in rats. J Urol 171: 926–930, 2004. [DOI] [PubMed] [Google Scholar]
- 29.Kiley SC, Thornhill BA, Belyea BC, Neale K, Forbes MS, Luetteke NC, Lee DC, Chevalier RL. Epidermal growth factor potentiates renal cell death in hydronephrotic neonatal mice, but cell survival in rats. Kidney Int 68: 504–514, 2005. [DOI] [PubMed] [Google Scholar]
- 30.Klahr S, Morrissey JJ. The role of growth factors, cytokines, and vasoactive compounds in obstructive nephropathy. Semin Nephrol 18: 622–632, 1998. [PubMed] [Google Scholar]
- 31.Kleinert H, Pautz A, Linker K, Schwarz PM. Regulation of the expression of inducible nitric oxide synthase. Eur J Pharmacol 500: 255–266, 2004. [DOI] [PubMed] [Google Scholar]
- 32.Kone BC, Schwobel J, Turner P, Mohaupt MG, Cangro CB. Role of NF-κB in the regulation of inducible nitric oxide synthase in an MTAL cell line. Am J Physiol Renal Fluid Electrolyte Physiol 269: F718–F729, 1995. [DOI] [PubMed] [Google Scholar]
- 33.Kuratsune M, Masaki T, Hirai T, Kiribayashi K, Yokoyama Y, Arakawa T, Yorioka N, Kohno N. Signal transducer and activator of transcription 3 involvement in the development of renal interstitial fibrosis after unilateral ureteral obstruction. Nephrology (Carlton) 12: 565–571, 2007. [DOI] [PubMed] [Google Scholar]
- 34.Lin SY, Makino K, Xia W, Matin A, Wen Y, Kwong KY, Bourguignon L, Hung MC. Nuclear localization of EGF receptor and its potential new role as a transcription factor. Nat Cell Biol 3: 802–808, 2001. [DOI] [PubMed] [Google Scholar]
- 35.Liu B, Neufeld AH. Nitric oxide synthase-2 in human optic nerve head astrocytes induced by elevated pressure in vitro. Arch Ophthalmol 119: 240–245, 2001. [PubMed] [Google Scholar]
- 36.Liu B, Neufeld AH. Activation of epidermal growth factor receptor signals induction of nitric oxide synthase-2 in human optic nerve head astrocytes in glaucomatous optic neuropathy. Neurobiol Dis 13: 109–123, 2003. [DOI] [PubMed] [Google Scholar]
- 37.Lo HW, Hsu SC, Ali-Seyed M, Gunduz M, Xia W, Wei Y, Bartholomeusz G, Shih JY, Hung MC. Nuclear interaction of EGFR and STAT3 in the activation of the iNOS/NO pathway. Cancer Cell 7: 575–589, 2005. [DOI] [PubMed] [Google Scholar]
- 38.Marks-Konczalik J, Chu SC, Moss J. Cytokine-mediated transcriptional induction of the human inducible nitric oxide synthase gene requires both activator protein 1 and nuclear factor-κB-binding sites. J Biol Chem 273: 22201–22208, 1998. [DOI] [PubMed] [Google Scholar]
- 39.Meldrum KK, Metcalfe P, Leslie JA, Misseri R, Hile KL, Meldrum DR. TNF-α neutralization decreases nuclear factor-κB activation and apoptosis during renal obstruction. J Surg Res 131: 182–188, 2006. [DOI] [PubMed] [Google Scholar]
- 40.Miyajima A, Chen J, Lawrence C, Ledbetter S, Soslow RA, Stern J, Jha S, Pigato J, Lemer ML, Poppas DP, et al. Antibody to transforming growth factor-β ameliorates tubular apoptosis in unilateral ureteral obstruction. Kidney Int 58: 2301–2313, 2000. [DOI] [PubMed] [Google Scholar]
- 41.Morrison JC, Moore CG, Deppmeier LM, Gold BG, Meshul CK, Johnson EC. A rat model of chronic pressure-induced optic nerve damage. Exp Eye Res 64: 85–96, 1997. [DOI] [PubMed] [Google Scholar]
- 42.Morrissey J, Klahr S. Transcription factor NF-κB regulation of renal fibrosis during ureteral obstruction. Semin Nephrol 18: 603–611, 1998. [PubMed] [Google Scholar]
- 43.Neufeld AH, Liu B. Comparison of the signal transduction pathways for the induction of gene expression of nitric oxide synthase-2 in response to two different stimuli. Nitric Oxide 8: 95–102, 2003. [DOI] [PubMed] [Google Scholar]
- 44.Neuvians TP, Gashaw I, Sauer CG, von Ostau C, Kliesch S, Bergmann M, Hacker A, Grobholz R. Standardization strategy for quantitative PCR in human seminoma and normal testis. J Biotechnol 117: 163–171, 2005. [DOI] [PubMed] [Google Scholar]
- 45.Obata H, Biro S, Arima N, Kaieda H, Kihara T, Eto H, Miyata M, Tanaka H. NF-κB is induced in the nuclei of cultured rat aortic smooth muscle cells by stimulation of various growth factors. Biochem Biophys Res Commun 224: 27–32, 1996. [DOI] [PubMed] [Google Scholar]
- 46.Park OK, Schaefer TS, Nathans D. In vitro activation of Stat3 by epidermal growth factor receptor kinase. Proc Natl Acad Sci USA 93: 13704–13708, 1996. [DOI] [PMC free article] [PubMed] [Google Scholar]
- 47.Poljakovic M, Nygren JM, Persson K. Signalling pathways regulating inducible nitric oxide synthase expression in human kidney epithelial cells. Eur J Pharmacol 469: 21–28, 2003. [DOI] [PubMed] [Google Scholar]
- 48.Poljakovic M, Svensson L, Persson K. The influence of uropathogenic Escherichia coli and proinflammatory cytokines on the inducible nitric oxide synthase response in human kidney epithelial cells. J Urol 173: 1000–1003, 2005. [DOI] [PubMed] [Google Scholar]
- 49.Rao KM Molecular mechanisms regulating iNOS expression in various cell types. J Toxicol Environ Health B Crit Rev 3: 27–58, 2000. [DOI] [PubMed] [Google Scholar]
- 50.Shao H, Cheng HY, Cook RG, Tweardy DJ. Identification and characterization of signal transducer and activator of transcription 3 recruitment sites within the epidermal growth factor receptor. Cancer Res 63: 3923–3930, 2003. [PubMed] [Google Scholar]
- 51.Shareef S, Sawada A, Neufeld AH. Isoforms of nitric oxide synthase in the optic nerves of rat eyes with chronic moderately elevated intraocular pressure. Invest Ophthalmol Vis Sci 40: 2884–2891, 1999. [PubMed] [Google Scholar]
- 52.Sun L, Carpenter G. Epidermal growth factor activation of NF-κB is mediated through IκBα degradation and intracellular free calcium. Oncogene 16: 2095–2102, 1998. [DOI] [PubMed] [Google Scholar]
- 53.Taylor BS, de Vera ME, Ganster RW, Wang Q, Shapiro RA, Morris, SM Jr, Billiar TR, Geller DA. Multiple NF-κB enhancer elements regulate cytokine induction of the human inducible nitric oxide synthase gene. J Biol Chem 273: 15148–15156, 1998. [DOI] [PubMed] [Google Scholar]
- 54.Tschumperlin DJ, Dai G, Maly IV, Kikuchi T, Laiho LH, McVittie AK, Haley KJ, Lilly CM, So PT, Lauffenburger DA, et al. Mechanotransduction through growth-factor shedding into the extracellular space. Nature 429: 83–86, 2004. [DOI] [PMC free article] [PubMed] [Google Scholar]
- 55.Unger T Blood pressure lowering and renin-angiotensin system blockade. J Hypertens Suppl 21: S3–S7, 2003. [DOI] [PubMed] [Google Scholar]
- 56.Valles PG, Pascual L, Manucha W, Carrizo L, Ruttler M. Role of endogenous nitric oxide in unilateral ureteropelvic junction obstruction in children. Kidney Int 63: 1104–1115, 2003. [DOI] [PubMed] [Google Scholar]
- 57.Vergarajauregui S, San Miguel A, Puertollano R. Activation of p38 mitogen-activated protein kinase promotes epidermal growth factor receptor internalization. Traffic 7: 686–698, 2006. [DOI] [PMC free article] [PubMed] [Google Scholar]
- 58.Vodovotz Y, Geiser AG, Chesler L, Letterio JJ, Campbell A, Lucia MS, Sporn MB, Roberts AB. Spontaneously increased production of nitric oxide and aberrant expression of the inducible nitric oxide synthase in vivo in the transforming growth factor-β1 null mouse. J Exp Med 183: 2337–2342, 1996. [DOI] [PMC free article] [PubMed] [Google Scholar]
- 59.Woolf AS A molecular and genetic view of human renal and urinary tract malformations. Kidney Int 58: 500–512, 2000. [DOI] [PubMed] [Google Scholar]
- 60.Yu Z, Kone BC. The STAT3 DNA-binding domain mediates interaction with NF-κB p65 and inducible nitric oxide synthase transrepression in mesangial cells. J Am Soc Nephrol 15: 585–591, 2004. [DOI] [PubMed] [Google Scholar]
- 61.Yu Z, Zhang W, Kone BC. Signal transducers and activators of transcription 3 (STAT3) inhibits transcription of the inducible nitric oxide synthase gene by interacting with nuclear factor-κB. Biochem J 367: 97–105, 2002. [DOI] [PMC free article] [PubMed] [Google Scholar]
- 62.Zhuang S, Dang Y, Schnellmann RG. Requirement of the epidermal growth factor receptor in renal epithelial cell proliferation and migration. Am J Physiol Renal Physiol 287: F365–F372, 2004. [DOI] [PubMed] [Google Scholar]
- 63.Zwang Y, Yarden Y. p38 MAP kinase mediates stress-induced internalization of EGFR: implications for cancer chemotherapy. EMBO J 25: 4195–4206, 2006. [DOI] [PMC free article] [PubMed] [Google Scholar]
Associated Data
This section collects any data citations, data availability statements, or supplementary materials included in this article.


