

Abstract
Neuronal growth cones are motile structures located at the end of axons that translate extracellular guidance information into directional movements. Despite the important role of growth cones in neuronal development and regeneration, relatively little is known about the topography and mechanical properties of distinct subcellular growth cone regions under live conditions. In this study, we used the AFM to study the P domain, T zone, and C domain of live Aplysia growth cones. The average height of these regions was calculated from contact mode AFM images to be 183 ± 33, 690 ± 274, and 1322 ± 164 nm, respectively. These findings are consistent with data derived from dynamic mode images of live and contact mode images of fixed growth cones. Nano-indentation measurements indicate that the elastic moduli of the C domain and T zone ruffling region ranged between 3–7 and 7–23 kPa, respectively. The range of the measured elastic modulus of the P domain was 10–40 kPa. High resolution images of the P domain suggest its relatively high elastic modulus results from a dense meshwork of actin filaments in lamellipodia and from actin bundles in the filopodia. The increased mechanical stiffness of the P and T domains is likely important to support and transduce tension that develops during growth cone steering.
Abbreviations used: AFM, atomic force microscope; ASW, artificial sea water; C, central; CM, contact mode; DIC, differential interference contrast; DM, dynamic mode; P, peripheral; T, transition
Introduction
During the development of the nervous system, neurons project axons over long distances to reach their synaptic partners. The neuronal growth cone, a highly motile sensory structure at the tip of the axon, receives multiple extracellular guidance cues through surface receptors and transduces this information into directional movements (1,2). Considerable progress has been made in uncovering the various guidance molecules and underlying signaling pathways (3,4) as well as the role of F-actin and microtubule cytoskeleton in growth cone movements (5). However, knowledge about the three-dimensional organization and mechanical properties of distinct growth cone regions and their dynamic cytoskeletal components under live conditions has remained sparse.
Although there are variations between neuronal cell types, growth cones have a similar basic structural organization as illustrated in Fig. 1. The P domain consists of lamellipodial veils that are separated by filopodial actin bundles. In these bundles, the actin filaments are oriented with their plus ends toward the tips (Fig. 1, green), whereas the intervening lamellipodial veils contain a branched F-actin network with more randomly oriented filaments (Fig. 1, gray) (6–9). Very dynamic F-actin structures called intrapodia or ruffles (Fig. 1, red) are found in the T zone between the P and C domain (10,11). Transverse actin arcs (Fig. 1, blue) are located in the T zone around the C domain and are regulated by Rho activity (12,13). Finally, although not indicated in Fig. 1, there are also stable actin bundles in the C domain that can be visualized either by EM or live cell actin imaging (12,13). Three main processes determine F-actin dynamics in the growth cone periphery and in motile cells in general: 1), F-actin assembly along the leading edge of lamellipodia and in the tips of filopodia; 2), retrograde flow of F-actin largely driven by myosin II activity; and 3), recycling of actin filaments in the T zone by a combination of severing and disassembly (10,14,15). Microtubules are localized mainly in the C domain of the growth cone and the axon (Fig. 1, yellow). They are relatively stable in the C domain and axon, whereas highly dynamic microtubules extend into the P domain and continuously explore the periphery (16). Although numerous reports have shown the key role of the actin and microtubule cytoskeleton in growth cone morphology, dynamics, and guidance functions (17–23), little is known about the mechanical properties of these cytoskeletal structures within live growth cones.
Figure 1.
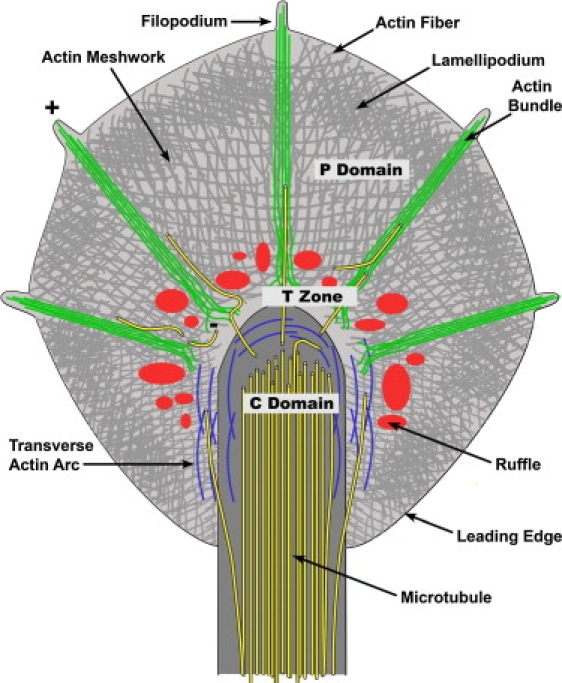
Schematic of growth cone cytoplasmic and cytoskeletal organization. The C and P domains are separated by the T zone. The C domain contains a high density of stable microtubules (yellow) serving as structural support for axon elongation and substrates for fast axonal transport of organelles into the growth cone. The tips of microtubules extending beyond the T zone into the P domain are highly dynamic and continuously explore the actin-rich periphery via stochastic assembly and disassembly, using the F-actin bundles as polymerization guides. The P domain consists of alternating lamellipodia and filopodia regions, with highly polarized actin bundles in the filopodia (green), and more randomly oriented actin networks in the lamellipodia (gray). F-actin assembly along the leading edge of lamellipodia and in the tips of filopodia is balanced by myosin-driven retrograde actin flow. Transverse actin arcs (blue) undergoing Rho-dependent contractility are located in the T zone around the C domain. Also, in the T zone de novo actin assembly occurs in ruffling structures (red), also named intrapodia. Adapted from Schaefer et al. (12).
The AFM has been applied to many different cell types to determine their topography and mechanical properties under fixed and live conditions (24–27), showing intracellular structures such as cytoskeleton and vesicles (28–31). In the case of neurons, the majority of AFM imaging has focused on the cell body, axon, and synaptic vesicles, whereas less attention has been paid to the growth cone and its underlying cytoskeletal structures (31–37). In a previous study (38), we have used the AFM to determine the topography of subcellular structures of fixed Aplysia growth cones, a model system for analysis of cytoskeletal dynamics and biomechanics. The high force sensitivity of the AFM cantilever has made it a useful tool for measuring the mechanical properties and probe-sample interaction forces with nanometer resolution (39). In vitro measurements of the elastic properties of cells have been accomplished in a number of different cell types, and local differences in their elastic modulus were related to the heterogeneity of the underlying cytoskeleton (29,40–43). Furthermore, AFM analysis of active and stable edges of spreading and migrating cells have revealed elasticity differences across the lamellipodia that may be important to cell motility (44–46). However, a detailed quantitative study of the topography and mechanical properties of distinct regions of live neuronal growth cones has not been carried out to our knowledge.
To address this problem, we have used AFM imaging and nanoindentation methods to study live Aplysia growth cones. The morphology of the distinct growth cone regions was measured with CM and DM imaging to determine the influence of the applied force on imaging before optimized DM imaging conditions were selected to measure the height of the different growth cone regions. The local mechanical properties of specific growth cone regions were determined by nanoindentation measurements made with the AFM. Significant variations in the elastic modulus were found between different regions of the growth cone and as a function of indentation frequency. The C domain exhibits stiffness typical of other nonneuronal cell types, whereas the P and T regions are significantly stiffer than the C domain. We interpreted the nanomechanical properties of these subcellular growth cone regions with their underlying cytoskeletal organizations and related them to the proposed function of these regions in growth cone motility and traction force generation.
Materials and Methods
Aplysia bag cell neuronal culture
Aplysia bag cell neurons were cultured on 22 × 22 mm glass coverslips coated with poly-L-lysine in L15 medium (Invitrogen/GIBCO, Carlsbad, CA) supplemented with ASW as described previously (47,48). Cells were used for AFM imaging and force measurements 1 day after plating.
AFM image acquisition and analysis
The growth cones were characterized with an MFP-3D AFM (Asylum Research, Santa Barbara, CA) that was integrated with an inverted optical microscope (Eclipse 300, Nikon, Melville, NY). Glass coverslips with Aplysia bag cell neurons were mounted in a fluid cell, which was filled with L15/ASW media, and the AFM probe was positioned near the leading edge of the growth cone with the aid of the optical microscope. AFM images were acquired in both CM and DM (49,50). CM imaging was carried out at an applied force of 200 pN using 100 μm long Biolever cantilevers (Olympus, Melville, NY), which have a nominal spring constant of 0.006 N/m. DM imaging was conducted in intermittent contact mode using 60 μm-long Biolever cantilevers, which typically had a resonance frequency of 37–44 kHz in air and a nominal spring constant of 0.027 N/m. The drive frequency used for imaging in liquid was set at the nominal resonance frequency of the cantilever, which was ∼8 kHz. The free-oscillation amplitude of the cantilever was set to 30 nm and stable DM imaging was achieved at a 10–30% reduction in amplitude. All images have been filtered using a line flattening algorithm to reduce the 1/f noise.
Force measurements
Force versus distance measurements were carried out at specific positions of the growth cones identified after DM imaging (51). At each location, a series of force curves was acquired in which the maximum applied load was increased from 100 pN to 1,000 pN, and the indentation frequency was varied systematically from 0.1 to 1 Hz. Forces and distances were calibrated by determining the spring constant of the cantilever and displacement sensitivity of the photodetector. Before each experiment the mechanical properties of the cantilever were determined by measuring its amplitude-frequency spectrum in air (52). The sensitivity of the photodetector was calibrated before imaging the cells using a noncontact calibration method to avoid possible contamination of the tip (53), and the calibration was confirmed after each series of measurements using the standard contact method (51). The radius of curvature of the probes was also measured after each experiment using a SrTiO3 crystal (54) and was found to be ∼50 nm.
The elastic modulus of specific growth cone regions was determined using Hertzian contact mechanics. Hertz's model (55) relates the force, F, applied by a spherical indenter of radius, R, to the indentation depth, δ, as
| (1) |
where E and v are Young's modulus and Poisson's ratio of the sample material, respectively. In this analysis we have assumed that the growth cone is much softer than the silicon nitride probe and its Poisson's ratio is 0.5. If this equation is reexpressed in terms of the piezo position, z, and cantilever deflection, d, it takes the form
| (2) |
where zo and do are the contact point and free cantilever deflection value, respectively. It is often difficult to apply Hertzian mechanics to characterize cells because they are soft and their mechanical properties are convoluted with those of the substrate. In this study, we have attempted to minimize error by using scaling analysis to characterize the force versus distance measurements, which has been described in Appendix A.
Results
Topography of live aplysia growth cones
Aplysia bag cell neurons were imaged with AFM after 1 day of culture on poly-L-lysine-coated glass coverslips. Fig. 2 shows the results of low resolution AFM images of two different growth cones acquired in contact (CM; Fig. 2, A–C) and dynamic (DM; Fig. 2, D–F) imaging modes. The large fan-shaped morphology is typical for Aplysia neuronal growth cones, which contain several distinct cytoplasmic regions. The C domain is located closest to the cell body and is significantly thicker than the flat P domain. The T zone is located between these two regions. It is thicker than the P domain, and often contains dynamic ruffling structures termed “intrapodia” (10,11) involving de novo actin assembly and membrane folding. In both imaging modes, distinct alternating filopodia and lamellipodia structures can be observed in the P domain (labeled in Fig. 2, A and D). The filopodial F-actin bundles, also identified in our previous study that correlated AFM with fluorescent images of fixed Aplysia growth cones (38), are distributed evenly in the P domain, emanating from the C domain and terminating at the leading edge. In these low-resolution images, the lamellipodia veils between the filopodia appear flat and uniform. Details of the C and T domain structures were more difficult to resolve in the live AFM images. This is due to the fact that these domains undergo rapid structural changes that are often faster than the image acquisition speed of large AFM scans. However, individual ruffling structures of various sizes that undergo similar rapid motion were resolved relatively well in the T zone of the DM images (Fig. 2 D, asterisk). Furthermore, transverse actin arcs (12,13) were observed in the CM images around the elevated C domain and perpendicular to the P domain F-actin bundles (Fig. 2 A, asterisk).
Figure 2.
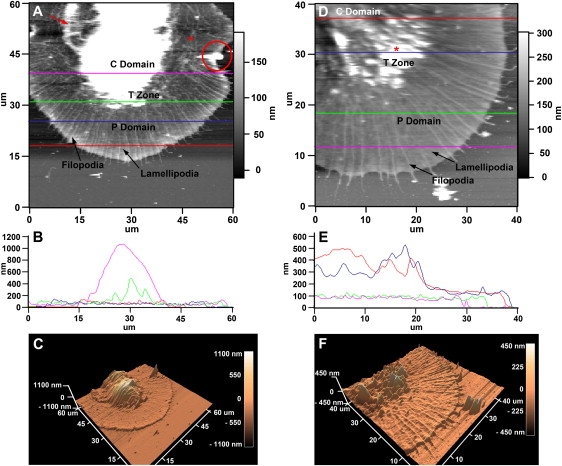
Low-resolution CM and DM measurements on Aplysia growth cones. (A) CM AFM image with labeled P domain, T zone, and C domain. (B) Color-coded cross sections from the fast scan lines identified in A. Average P domain heights are around 100 nm (red and blue line), whereas average T zone ruffling heights are between 200–400 nm in this example (green line). The highest region of this growth cone was detected in the C domain (magenta line). (C) Three-dimensional reconstruction of the grown cone shown in A. (D) DM AFM image of a different growth cone. The relative height differences between individual growth cone regions were consistent with data acquired from CM images. (E) Cross sections through different regions of the growth cone shown in D. (F) Three-dimensional reconstruction of the growth cone shown in D. Scales are indicated.
Cross-sectional analysis of AFM scans in both modes indicated that the C domain is the tallest region of the growth cone with its highest point ranging from 500 to >1000 nm (Fig. 2, B and E). The profile of C domain was fairly smooth, with only small height changes in the range of 20–100 nm. The thickness of the lamellipodia did not appear to significantly change from the leading edge to the T zone. Cross sections through the T zone indicated the height of the ruffles varied between 100 and 500 nm, but occasionally exceeded the height of the C domain, as seen by comparing the highest point of the blue and red scan lines in Fig. 2 E.
Table 1 summarizes the results of the height measurements obtained from 7 and 15 different live growth cones analyzed by CM and DM AFM, respectively, as well as previous CM AFM measurements obtained from fixed growth cones (38). The lamellipodia of the P domain was relatively flat with an average CM and DM height of 107 ± 33 nm and 142 ± 28 nm, respectively. The T zone exhibited an average CM and DM height of 589 ± 274 nm and 848 ± 235 nm, respectively. The average CM and DM heights of the C domain was 1137 ± 164 nm and 1310 ± 137 nm, respectively. Because cells generally experience deformation due to the AFM imaging forces, their true heights are usually larger than those measured by the cross sections obtained from raw AFM images. In the CM imaging mode the extent of this deformation can be determined if the mechanical properties of the cell and the imaging force are known (assuming the forces imposed by friction and the inherent feedback error are negligible). The average indentation of the P domain, T zone, and C domain of the live growth cones under a 200 pN CM imaging force was calculated to be 76 nm, 101 nm, and 185 nm, respectively, using the average measured elastic modulus of these regions (Table 2). The “corrected height” under zero load was therefore determined by adding the average indentation depth of each growth cone region to its average measured height (Table 1). These corrected heights follow the same general trend as observed in the uncorrected images, i.e., the C domain > T zone > P domain height.
Table 1.
Average heights of different growth cone domains
| Domain | CM AFM fixed neuron |
CM AFM live neuron |
DM AFM live neuron |
||||||||
|---|---|---|---|---|---|---|---|---|---|---|---|
| Average height (nm) | SD∗ (nm) | n† | Corrected height‡ (nm) | Average height (nm) | SD∗ (nm) | n† | Corrected height‡ (nm) | Average height (nm) | SD∗ (nm) | n† | |
| P lamellipodia | 53 | 24 | 82 | 122 | 107 | 33 | 41 | 183 | 142 | 28 | 77 |
| P filopodia | 73 | 11 | 24 | — | 149 | 25 | 76 | 217 | 175 | 16 | 85 |
| T zone ruffles | 577 | 175 | 12 | 623 | 589 | 274 | 21 | 690 | 848 | 235 | 23 |
| C domain | 1020 | 191 | 10 | 1113 | 1137 | 164 | 13 | 1322 | 1310 | 137 | 11 |
AFM, atomic force microscope; C, central; CM, contact mode; DM, dynamic mode; P, peripheral; SD, standard deviation; T, transition.
SD of the heights of individual growth cone domains as measured with AFM.
Number of measurements.
Corrected height was calculated by adding the average indentation of each growth cone domain to the average height. The variations in the corrected domain heights are equal to or greater than that of the average measured heights. Note that the corrected heights for fixed neurons are different from our previous report (38) due to a revised analysis of the indentation data.
Table 2.
Mechanical properties of different growth cones
| Domain | Fixed growth cones |
Live growth cones |
||||
|---|---|---|---|---|---|---|
| Young's modulus (kPa) |
Young's modulus (kPa) |
SEM (kPa) | n | |||
| Range | Average | Range | Average | |||
| P domain lamellipodia | 85–135 | 110 | 10–25 | 16.7 | 1.05 | 113 |
| P domain filopodia bundles | — | — | 20–40 | 29.8 | 1.35 | 71 |
| T zone ruffles | 176–225 | 200 | 7–23 | 15.7 | 3.5 | 194 |
| C domain | 45–95 | 70 | 3–7 | 5.7 | 0.5 | 42 |
C, central; P, peripheral; SEM, standard error of mean; T, transition.
Fig. 2, C and F, depict three-dimensional rendered images of the growth cones acquired in CM and DM, respectively. Several potential imaging artifacts associated with CM imaging are visible in Fig. 2 C: the probe appears to have caught and displaced the edge of the lamellipodia on the right side of the growth cone (Fig. 2 A, red circle); certain fluidic material in the C domain seems to have been displaced to the left side of the primary domain by the probe (Fig. 2 A, red arrow); and the height of the C domain appears to have changed abruptly during the scan. The first two artifacts could originate from the lateral force of CM imaging, i.e., the friction produced by the AFM probe tracing across the sample surface while in constant contact with the sample. The abrupt change in the height of the C domain may be a result of cell motion or probe-induced stimulation of the C domain, which has also been observed in force curve measurements and will be discussed later. Because of the potential artifacts induced by the lateral force, we have focused our additional imaging efforts on DM.
Subcellular structure of the P domain
To assess the ultra-structure of filopodia and lamellipodia, we acquired high resolution DM images in the P domain (Fig. 3). Cross section measurements through the P domain showed that filopodial F-actin bundles are 30–50 nm higher than adjacent lamellipodial veils and 200–400 nm wide. Compared to the scans obtained at lower resolutions, three additional features can be observed in these high resolution images. First, the filopodia are not completely straight but exhibit kinks along their entire length, particularly close to the T zone (Fig. 3, A and C, asterisk). The fact that the shape of these kinks was unaffected by the scanning direction (Fig. 3, A and B, are trace and retraces images of the same scan, respectively) indicates that these kinks are not imaging artifacts but an inherent property of the filopodia. Kinked filopodia have been previously observed in F-actin images of both fixed and live Aplysia growth cones after staining with fluorescently labeled phalloidin (10,12,15). These kinks have been attributed to compression in the T zone and may facilitate the severing of the actin filaments that is followed by their depolymerization.
Figure 3.
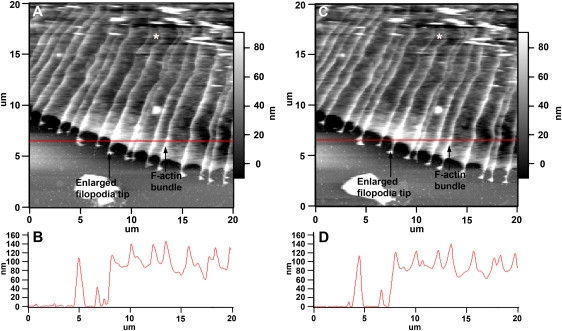
High resolution DM images of the P domain. (A) High resolution scan trace image (scanning direction from left to right) of the leading edge of a growth cone. Elevated F-actin bundles and enlarged filopodia tips are labeled. Dynamic ruffles in the T zone can be identified as small, elevated structures at the upper right corner of the image. (B) The cross section along the scan line in A shows a height difference of 30–50 nm between F-actin bundles and their surrounding lamellipodia. (C) The retrace image (scanning direction from right to left) of the same scan shows filopodial structures that are very similar to those shown in A, suggesting that the imaging force did not perturb filopodia integrity. (D) The height profile of the cross section in the retrace image (C) is very consistent with the profile (B) of the trace image (A).
The second new information gained from high resolution DM scans was the fact that the lamellipodial veils close to the leading edge are 10–20 nm thicker than in areas closer to the T zone. This increased thickness of the P domain close to the leading edge correlates well with the increased F-actin density in this region (7,12,56). This 2–3 μm wide band of short and branched actin filaments has been identified as the region in which barbed-end assembly of actin filaments occurs to drive lamellipodial protrusion. Actin filaments tend to be longer and less branched father away from the leading edge.
The third observation resulting from these high resolution images was that the tips of the filopodia are enlarged and quite sensitive to the imaging force (Fig. 3, A and C). These enlarged tips have initially been observed by DIC microscopy on short filopodia of young growth cones (57,58). Our previous CM AFM analysis of fixed Aplysia growth cones showed that these filopodia tips were 2.5 times taller and 1.5 times wider than their shafts (38). Although we observed a similar tip/shaft size relationship under live conditions (Fig. 3, B and D), exact measurements of these enlarged tips at similar resolution as carried out previously in fixed cells (38) was not possible due to the fact that these tips are very sensitive to the force needed to image at higher resolution (10 μm × 10 μm scans).
Fig. 4 shows high resolution images of the actin network in the lamellipodial veil of the P domain. The thinnest structures of the meshwork between filopodia are 10–35 nm higher than adjacent lamellipodia as determined by DM AFM imaging (Fig. 4, B and D). Thus, these thinnest linear structures could represent individual actin filaments. We made three observations in these high resolution images of the actin meshwork. First, the filaments of this actin meshwork sometimes appear to crossover the filopodial bundles, suggesting that they may be located above the actin bundles (Fig. 4, B and D, circles). Second, several filaments of the lamellipodial actin network appear to connect with the filopodial bundles, suggesting that they may be derived from these bundles and/or giving rise to bundle formation (Fig. 4 D, asterisk). These findings on actin filament connections between filopodial bundles and lamellipodial meshwork are consistent with observations from previous light and electron microscopy studies (8,9,12). Third, there seems to be a correlation between the positions where network filaments intersect with filopodial bundles and the positions of kinks in the bundles (Fig. 4, A and B, arrows). The distance between network filament crossings and bundle kinks generally appear to be within a range of 50–300 nm to each other. This close proximity could indicate that the kinks in the stiff actin bundles could be due to the physical coupling between these bundles and the meshwork filaments.
Figure 4.
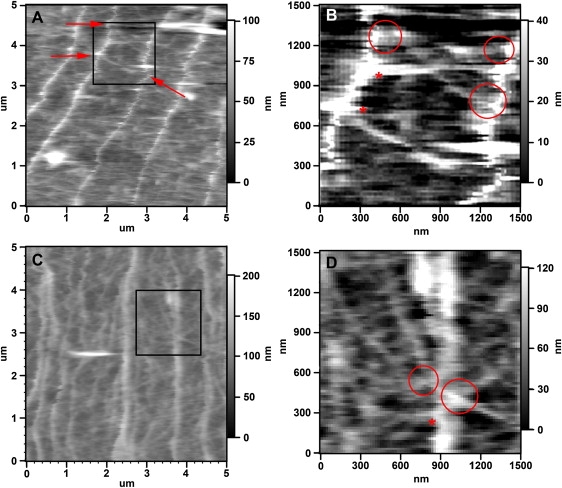
High resolution analysis of filopodial actin bundles and lamellipodial actin networks in the P domain. (A and C) High resolution DM images showing details of the filopodia actin bundles and actin meshwork structures in different growth cones. The filaments in the actin network are less interconnected in A when compared to C. In both images, the individual filaments of the meshwork are thinner and less oriented than the filopodial actin bundle running from top to bottom. (B and D) Magnifications of boxed areas in A and C, respectively. Asterisks indicate potential connections between lamellipodial actin meshwork and filopodial actin bundles. Arrows indicate locations where kinks in bundles correlate with connecting lamellipodial actin structures. Scales are indicated.
Subcellular mechanical properties
Force-distance curves were acquired at 0.1 Hz to determine the relative elastic moduli of the P domain, T zone, and C domain (Fig. 5). The forces in each region of the growth cones were purely repulsive and showed several distinct regions of power law behavior. Hertz's model was fit to portions of the force curve following the 1.5 power law behavior and the resulting Young's moduli are summarized in Table 2. The Young's modulus measured on the lamellipodia of the P domain of seven different growth cones varies between 10 and 25 kPa with an average value of 16.7 kPa. It was necessary to use indentation depths that exceeded 10% of the thickness of the P domain in this analysis thus it is likely that the measured elastic moduli are higher than the inherent values of the P domain. The Young's moduli in the T zone and C domain varied from 7 to 23 kPa and 3 to 7 kPa, respectively.
Figure 5.
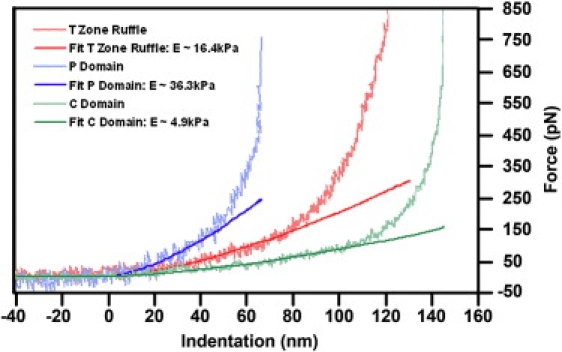
Force curves measured in different growth cone regions. Young's modulus of the P domain, T zone ruffling region, and C domain were determined from the low-load regions of the force curves to be 36.3 kPa, 16.4 kPa, and 4.9 kPa, respectively. Indentation of the P domain at forces of >400 pN becomes saturated. This load corresponds to an indentation of ∼65 nm, which is ∼1/3 of the thickness of the P domain. This is consistent with previous thin film mechanical indentation measurements (75,78). For the thicker C domain, this saturation behavior occurs at an indentation depth of ∼140 nm, which appears at a loading force >600 pN. From the force curve measured on top of the T zone ruffles, which is both thick and relatively stiff, this saturation is barely visible at a indentation of ∼120 nm with a loading force >800 pN, due to the restriction of the upper limit of the loading force applied in our experiments. Low loading force curves plotted on a linear scale from these three cytoplasmic regions (wavy lines) and their corresponding Hertzian contact model fits (solid lines) were consistent with each other in the 50 nm indentation range.
Analysis of the force measurements made at different positions of the P domain showed three trends (Fig. 6). First, the Young's modulus of filopodial actin bundles (Fig. 6 A, positions 1 and 2; Table 2) is significantly higher, i.e., 20–40 kPa, than those measured on the lamellipodia between these bundles (Fig. 6 A, position 3; Table 2), i.e., 10–25 kPa. Second, there is no apparent correlation between the measured thickness and elastic modulus of the lamellipodia regions on most growth cones. That is, all lamellipodia exhibiting an actin meshwork seem to have a similar Young's modulus regardless of their different heights. The only exception is that in actively advancing growth cones, the Young's modulus of the elevated leading edge has an average value of 35 kPa, which is much higher than the measured average for lamellipodia. Third, in growth cones with very few actin bundles in the P domain, the Young's modulus ranges between 10 and 15 kPa, which is much lower than the average value measured on the P domain of healthy growth cones that are rich in F-actin. Thus, it seems that variations in the Young's modulus measured on these different P domain structures (filopodia versus lamellipodia) are correlated closely with local differences of their underlying cytoskeletal structure.
Figure 6.
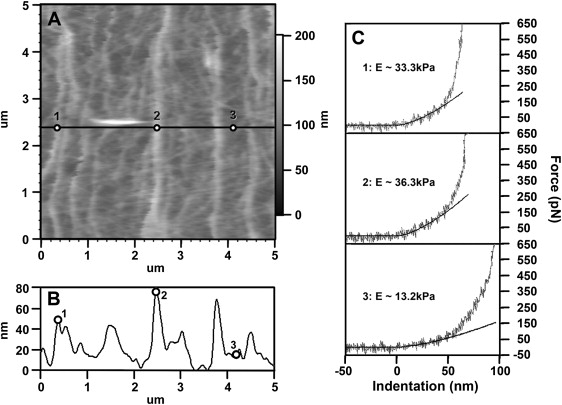
Force curve analysis shows that filopodial actin bundles are stiffer than lamellipodial actin meshwork structures. (A) High resolution DM image of P domain actin bundles and meshwork. Force curves were measured using the same AFM tip on three different positions indicated in A: position 1 and 2 on top of filopodial actin bundles with different heights, and position 3 on top of lamellipodial actin meshwork between bundles. (B) Height profile of the cross section made through these three points indicated by the black line in A. (C) Corresponding force curves taken at these three positions marked in A and their corresponding Hertzian contact model fits within 50 nm indentation range. The resulting Young's moduli have consistently higher values on top of actin bundles regardless of the height differences existing between these bundles (1 and 2, ∼33.3 kPa and 36.3 kPa, respectively), when compared to the meshwork filaments (3, ∼13.2 kPa).
Analysis of the mechanical measurements made at different positions of the T zone and C domain was complicated by the fact that DM AFM did not reveal the details of the cytoskeletal organization in either of these regions. No correlation was found between the measured Young's modulus and the thickness of the T zone and C domain. It was also clear that the C domain has a significantly smaller Young's modulus that varies less than that of the P domain or T zones. An interesting observation was made when the mechanical properties of specific portions of the growth cone were measured at different loading rates. Measurements made on the P domain at frequencies less than 1 Hz showed little hysteresis in the approaching and retracting force curves. However, ∼20% of the measurements made on the C domain and >90% of the measurements made on the T zone showed significant hysteresis at frequencies >1 Hz rate. Fig. 7 A shows a typical ”high” frequency force curve taken in the T zone in which a sudden decrease in the apparent stiffness was observed in the approach curve (top) and a slight decrease in the apparent stiffness in the retracting curve (bottom). When the force curve was measured at a lower rate, such as 0.1 Hz, no hysteresis was observed (Fig. 7 B). These results suggest that there may be a frequency-dependent mechano-chemical transduction process that affects cytoskeletal organization and dynamics in the T and C regions of the growth cone.
Figure 7.
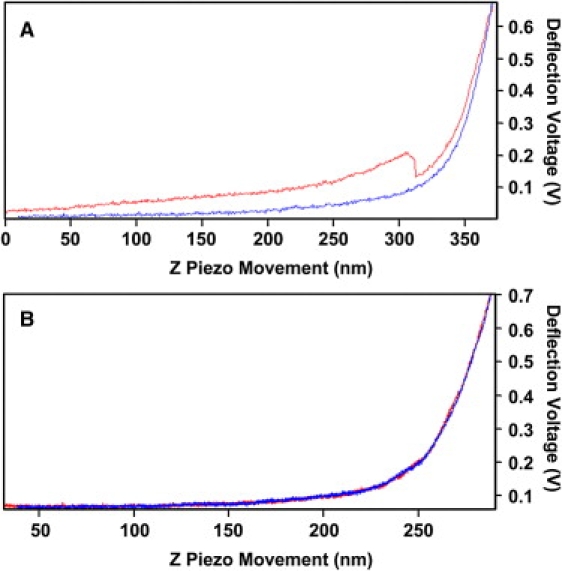
Frequency-dependent hysteresis in the T zone. (A) Force curve measured in the T zone at 1 Hz rate showing hysteresis behavior seen between the approaching (top) and retracting (bottom) parts of the force curve with a sudden decrease in apparent stiffness in the approaching part of the force curve. (B) Force curve measured at 0.1 Hz at the identical position with no apparent hysteresis behavior. The stiffness determined from B is also slightly lower than the one measured from (A).
Discussion
Growth cone topography
This AFM study represents what we believe is the first detailed topographical and mechanical analysis of well-defined subcellular structures in live neuronal growth cones. Although previous AFM studies have resolved live growth cones (32–34,36,37), the data in the current study provides much more detail about the structure of the subdomains and cytoskeleton, which we attribute to three factors. First, previous reports used vertebrate growth cones, which are 5–10 times smaller and often have less well-defined subcellular domains when compared to Aplysia growth cones. Second, vertebrate growth cones typically have more dynamic lamellipodia and filopodia than Aplysia growth cones. Because of the limited temporal resolution of the AFM, it is more difficult to acquire high resolution images of very dynamic growth cones. Third, the imaging force in this study was carefully controlled and DM imaging was used to minimize deformation of the subcellular growth cone structures.
Both CM and DM images were acquired from live growth cones to provide a more accurate measure of the thickness and structure of the individual subcellular regions. Although the CM images seem to show more details especially in the T and C regions, examination of the height profile suggests this is due to higher levels of probe indentation into the growth cone. This indentation does not seem to produce irreversible damage of the growth cones but clearly modifies the observed structures. We believe that the DM AFM technique applied in this study provides high resolution information with significantly less cellular deformation. The structural features observed in these images are in agreement with data from previous light and electron microscopy studies as well as with our former AFM analysis of chemically fixed Aplysia growth cones (38).
Ultrastructure of the P domain and T zone
The subcellular features resolved with DM AFM reported in this study, particularly the different subpopulations of the actin cytoskeleton, are consistent with previous studies using phalloidin-labeling of F-actin in both fixed and live growth cones (10–12,59) as well as using various EM techniques including negative staining, freeze edging, and platinum replica (6–9,12,56,60,61). In the P domain of Aplysia growth cones, filopodial F-actin bundles are aligned perpendicular to the leading edge with average distances of 2–3 μm between them (Fig. 3). The kinks observed in the filopodial bundles are independent of the scanning direction and have been reported in studies using live F-actin imaging as well (12,15). Therefore, we believe that these kinks are unlikely to be imaging artifacts and could possibly originate from the physical coupling between filopodial actin bundles and their surrounding lamellipodia actin network undergoing actomyosin contractions as proposed recently (12,15).
The high resolution AFM images in this study have shown ultrastructural details of the actin meshwork between the filopodia (Figs. 4 and 6). The apparent connections between actin filaments in the meshwork and the filopodia are consistent with EM data suggesting the filopodia and lamellipodia is interdependent (8,9). Our high resolution images show that filopodial kinks tend to occur in proximity of meshwork filaments connecting with and crossing actin bundles close to the T zone. These kinks may be a result of actomyosin contractions, particularly in the T zone.
In young and healthy growth cones, the 3 μm-wide band immediately behind the leading edge is higher and stiffer than lamellipodial regions closer to the T zone (Fig. 3), which is due likely to a dense array of many short and branched actin filaments in this region that are involved in veil protrusion, whereas longer and less-branched filaments are present more distal to the leading edge (8,9,12,56). The fact that these branched filaments could not be resolved with the AFM may be indicative of the stiffness or mobility of this region. Finally, using DM AFM imaging we also confirmed the presence of enlarged filopodia tips in young growth cones (Fig. 3) as observed previously by AFM imaging of fixed growth cones (38) as well as by light microscopy (57,58).
Height of growth cone regions
We have determined the heights of distinct growth cone regions with both DM and CM imaging methods (Table 1), and compared these measurements with CM data from fixed growth cones (38). All three methods produced in the same relative height distribution between the three growth cone domains, showing the P domain as the thinnest growth cone region. In addition, several trends can be observed in these results, giving us insight into the accuracy of the different types of AFM height measurements. First, the average DM height of each region of live growth cones was greater than average CM height of the corresponding live or fixed growth cone region. Second, the average DM height of each region of the live growth cone was larger than the corrected average CM height of the corresponding region in the fixed growth cones. Third, the average DM heights were statistically indistinguishable from the corrected average CM heights of the live growth cones in the T zone and C domain (based on a 99% level of confidence.) This last observation is somewhat surprising considering that DM imaging has been reported to impart significant force to hard surfaces. We attribute this result to the fact that the mechanical response of the cell is dominated by viscoelasticity at the high frequencies, i.e., when the interaction time between the AFM tip and the growth cone surface is much smaller than ∼1 ms (as in the case of DM imaging at 8 kHz frequency), the cytoplasmic material acts as a “hard” material to prevent the underlying structures of the growth cone from undergoing large deformations (62). Thus, the corrected CM and DM heights seem to be reasonably accurate measurements of the thickness of each specific region of the live growth cone.
An interesting observation can be made when comparing the corrected CM heights of the live and fixed growth cones: significant flattening occurred as a result of fixation in all regions of the growth cone except for the T zone ruffles/intrapodia. Chemical fixation results in cross-linking of free amines and the condensation of the proteins in the cytoplasm. Thus, if the proteins are homogeneously distributed throughout the cytoplasm, this would result in the shrinkage of all regions of the growth cone to similar extents. The fact that the T zone ruffling region does not shrink as much as the other regions may indicate that it contains a higher density of closely related proteins when compared to the other growth cone regions. This observation is supported by the fact that the elastic modulus of the fixed T zone ruffles is significantly higher than that of either the P or C domain. The organization and precise function of the T zone ruffles/intrapodia is not entirely clear at this time; however, this high protein density could result from the presence of both short and long actin filaments in this region, as well as actin-associated proteins that contribute to its high rate of de novo actin assembly and turnover (11).
Mechanical properties of different growth cone regions
In this study, we have used the AFM to make nanoindentation measurements in specific regions of the Aplysia growth cone. Each region of the growth cone was found to exhibit elastic behavior at low levels of strain at indentation speeds of <0.1 Hz; and Hertzian contact mechanics was used to calculate an elastic modulus from these stress-strain measurements. Contact mechanics studies of homogeneous materials indicate that the stress field produced by a probe rapidly decays into the sample with a characteristic length that is determined by the indentation depth and size of the probe (63). However, cells are not homogenous but are composed of a soft membrane enclosing a soft cytosol and stiff cytoskeleton. Fig. 8 shows the measured elastic modulus of several cell types and subcellular components that are present in the growth cone. The elastic modulus of whole cells is significantly higher than that of the cytoplasm, but significantly lower than that of a microtubule or actin fiber or filament. Thus, we anticipate that the AFM elastic modulus measurements will reflect the properties of the molecular components in proximity to the probe but may also reflect the longer-range structure of the cytoskeleton.
Figure 8.
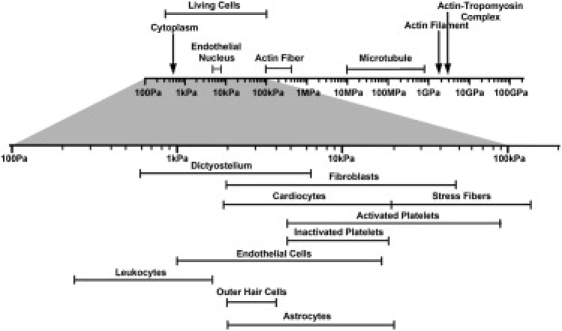
Young's moduli of different structural components in live cells. Previous studies on different cellular structural components have suggested that most of these structures have a much higher mechanical stiffness than the ones exhibited by the cells as a whole (in the range of 500 Pa–100 kPa). For example, AFM-based single-cell compression studies suggested the stretching elasticity of live cell membrane lies in the range of 10–35 MPa (81). Young's modulus of single actin filament deduced from thermal fluctuation studies of its flexural rigidity is ∼2.6 GPa (66), whereas studies indicated that single microtubule has a Young's modulus in the range of 10 MPa–1 GPa (82).
It seems that the elastic moduli of specific regions of the Aplysia growth cone fall within the range of behavior shown in Fig. 8, but that the elastic modulus of the T zone and P domain are relatively stiff when compared to other cell types. It was not expected that these regions would be stiff as neuronal tissues are quite soft. Recent studies of cell mechanics has shown that the stiffness of a cell is closely linked to the amount of stress it generates and the mechanical properties of the surface it is interacting with (64). The fact that leading edge of the Aplysia growth cone is stiff seems to be consistent with these observations: Aplysia growth cones grown on stiff glass substrates produce high levels of tension during neurite growth and guidance (47).
We observed a strong correlation between elastic modulus and F-actin content and organization in distinct growth cone regions. The highest mechanical stiffness was determined for the highly oriented filopodial actin bundles in the P domain (between 20 and 40 kPa), whereas the average stiffness in the intervening lamellipodial regions consisting of an isotropic meshwork of single actin filaments is between 10 and 25 kPa (Fig. 5; Table 2). These findings are consistent with previous in vitro studies demonstrating that isolated actin bundles exhibit higher stiffness than isotropic networks of single actin filaments and that actin filament gels have a elastic modulus of 10 kPa at a concentration of 10 mg/mL (65). The C domain also seems to be the softest of all the identified growth cone regions. The major cytoskeletal component of the C domain are microtubules, which are known to have nonisotropic mechanical properties (66); however, many vesicles are also located in the C domain, which have a stiffness two to three orders of magnitudes lower than microtubules (67). This result seems to be consistent with an AFM study on fibroblast cells that showed that F-actin depolymerization but not microtubule disruption resulted in a significant decrease of cell rigidity (43).
The fact that the C and T domains were sensitive to the rate at which force measurements were made was unexpected. The frequency-dependent response in this study does not seem to be the result of a viscoelastic effect, which would simply cause the stiffening of these zones under high-frequency forces without the observed abrupt change in the apparent Young's modulus. Instead, the force behavior seems to be associated with a frequency-dependent stimulation of a mechanical/chemical process that affects cytoskeletal structure and/or dynamics. Such transducers have been hypothesized to regulate the stress-strain behavior of a number of types of cells (68). The sensitivity of involved cytoskeletal or signaling components to the rate of indentation may simply be due to the fact that force is transduced more effectively to these elements at higher frequencies. However, single-molecule force measurements have revealed that specific molecular interactions have a time-energy-lifetime behavior that is interrelated through
where E is the activation energy of an interaction, F is the force applied to the process, d is a scaling length representative of the interaction, kT is thermal energy, and v is frequency (69). Thus, a mechanically triggered event in a molecule or assembly of molecules would be more likely to take place at higher forces and/or application frequencies. Recent studies of Src activation using FRET-based cytosolic Src reporters have shown that it is activated by rapid application of stress (<0.3 s) (70).
Conclusions
For what we believe is the first time, we have analyzed the topography and nanomechanical properties of distinct cytoplasmic regions in live growth cones. Measurement of the height of the specific regions of the Aplysia growth cone make it possible to determine the absolute volume of these regions, which is an essential parameter for understanding how energy and mass are transferred in the process of neurite growth. The mechanical properties of the subcellular growth cone regions correlate well with the amount, organization, and dynamics of their underlying cytoskeletal structures, particularly with respect the various F-actin structures in the P domain. Among the different F-actin subpopulations presented in this study, the highest stiffness was determined for the filopodial actin bundles, which are actin structures with the highest level of cross-linking and polarity. However, the P domain lamellipodia and T zone are also significantly stiffer than the C domain.
Is there a correlation between stiffness of individual growth cone regions and their role in growth cone motility and guidance? An increased rigidity of actin bundles clearly allows the filopodia and lamellipodia to transmit tension between adhesion sites at the leading edge of the growth cone and C domain that is required for adhesion-mediated growth cone advance and steering (47). When adhesion-molecule-coated beads are placed onto the P domain of Aplysia growth cones and restrained against retrograde translocation driven by actin flow, significant attenuation of such actin flow, tension build up between the P and C domain and growth cone leading edge advancement can be observed (47). The high mechanical rigidity of organized actin structures in the P domain is well suited to its role in transmission of tension between extracellular substrates and the central domain of growth cones via the coupling between adhesion molecules and actin cytoskeleton (47). The stiffness of these actin structures provides the capability to withstand the application of extensive traction forces during growth cone advancement. Considering the size of the beads (5 μm) used in these experiments, the relative contribution to traction force generation by filopodial bundles compared to intervening lamellipodial veils are difficult to estimate. Earlier studies showed clearly that a not only lamellipodia but also single filopodia can produce a traction force (71,72) and induce growth cone turning (73). Microneedle and flexible substrate approaches determined retraction forces of 90 μdyne for single filopodia (71,72). Recent optical tweezers measurements, on the other hand, showed lower protrusive forces for filopodia (3 pN) and lamellipodia (20 pN) (74).
A number of guidance cues, receptors, mediators, and cytoskeleton associate proteins have been identified that control growth cone guidance (3). An outstanding question in growth cone guidance is how signals are transmitted over microns from the leading edge of the P domain to the C domain on the short timescales that have been measured in vitro studies. It is becoming increasingly clear that force plays an important role in the way cells interact with materials and is widely postulated that this take place through conformational changes in proteins (68). The adhesion-mediated growth cone guidance assay (47) has shown that tension is an important factor for growth cone turning. The fact that the P domain of a growth cone is quite stiff means that it can efficiently transmit stress via the filopodia to the T zone and C domain where microtubule remodeling results in growth cone turning. Force measurements made in this study also suggest there may be a mechanically sensitive transducer in the T and C domains. These observations lead us to propose that the stiff filopodia and actin meshwork in the P domain play an integral role in the control of growth cone guidance and that growth cone guidance is controlled by at least one force sensitive protein that is located in the T zone or C domain.
Appendix A: Determination of the Nanomechanical Properties of Cells Using Scaling Analysis of AFM Force Measurements
AFM nanoindentation measurements have been used widely to analyze the mechanical properties of inorganic and organic materials (39). Fewer quantitative measurements have been made on specific regions of live cells due to three technical limitations. First, the point of contact of the AFM probe with the cell is very difficult to determine accurately, due to the size of the probe and softness of the cell. Second, the geometry of interaction of the AFM probe with a cell is complicated by the structure of the probe. Third, indentation stresses penetrate deep into a material and thus measurements on cells will be influence by the substrate if the depth of indentation exceeds 10% of the thickness of the cell (75). To overcome these limitations, force measurements on cells have been made with 5 to 10 micron-sized spherical probes resulting in measurements that are averaged over many microns (75,78).
In this study, the Young's modulus of various subcellular regions of the Aplysia growth cone was determined by analyzing force measurements made with a normal AFM probe using scaling analysis (77). This approach is based on the fact that Hertzian contact mechanics predicts force induced by a spherical indenter is proportional to the deformation raised to its 1.5 power, whereas cylindrical and conical indenters follow 1.0 and 2.0 power laws, respectively. Thus, scaling analysis comparing the indentation behavior of large spherical probes with the smaller Biolever probes used in this study can be used to identify the region of the force curve in which spherical Hertzian contact mechanics are applicable (Fig. 9).
Figure 9.
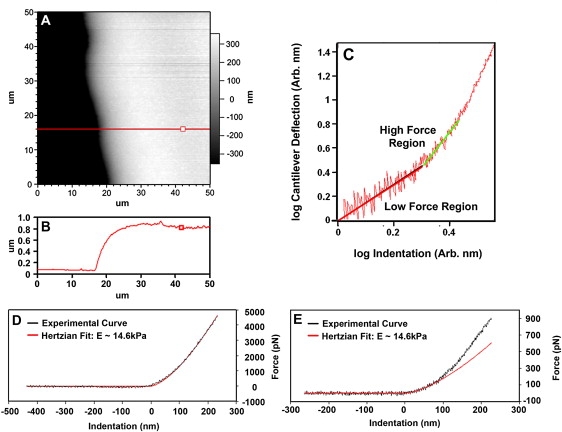
Force-indentation curves measured on agarose and demonstration of scaling analysis. (A) AFM image of an area near the edge of a thin agarose gel film (0.5% bacterial agar) scanned in 50% isopropanol. (B) The thickness of this film can be identified in the cross section. (C) A log (cantilever deflection) versus log (indentation) representation of a force curve measured with a 50-nm radius Biolever probe on a ∼700 nm agarose film. The log-log plot clearly indicated a change in the slope from 1 to 1.5 and 1.5 to 2. (D) Force curve measured with a Mikromasch CSC12/No Al tipless cantilever modified with 5-μm diameter silica microsphere. This force curve followed a 1.5 order power law consistent with a spherical Hertzian indentor throughout the range of the measurement. (E) Linear representation of the Biolever force-indentation curve that was only consistent with a spherical Hertzian fit for the first 50 nm of indentation. The Young's modulus measured with the Biolever and 5-μm diameter silica microsphere were consistent with each other as well as with previous measurements made on similar gel films (75,78).
Fig. 9, A and B, show an AFM image of a 0.5% bacterial agar gel film, on which force versus distance measurements have been made 700 nm from the leading edge of the film in a 1:1 isopropanol/water solution. Fig. 9 C presents this force curve in terms of log (deflection of the cantilever) versus log (indentation). This log-log plot identifies clearly the region of the force curve that follows a 1.5 power law and the region that follows a higher-order power law. The 1.5 power law behavior dominates until indentation exceeds the nominal radius of curvature of the AFM tip used for this measurement (∼50 nm), which is consistent with observations from previous studies (78). At high loads, the force versus displacement behavior follows a power law of order 2 or higher, which is attributed to the interaction of the pyramidal portion of the probe with the cell.
The accuracy of this scaling-analysis approach was determined by carrying out force measurements on various regions of the above mentioned gelatin film using both a 50 nm radius AFM cantilever and 5-μm diameter spherical indenter. The spherical indenter was assembled by placing a 5.0-μm diameter silica particle on a tipless cantilever (CSC12/No Al, Mikromasch, Wilsonville, OR) using a two-part ultraviolet-activated epoxy adhesive. The exact spring constant of each cantilever was determined in air before and after attaching the microspheres (described in Materials and Methods). AFM images and force measurements were then made 100–800 nm from the edge of the gel in the 1:1 isopropanol/water solution. The Hertzian contact mechanics model (Eq. 2) was fit to the entire spherical indenter force curve (Fig. 9 D), whereas fitting of the 50 nm radius cantilever data were only carried out on the portion of the force curve that exhibited a 1.5 power law behavior in the log-log plot (Fig. 9 E). The resulting elastic moduli for each measured regions of the gel were found to vary by no more than 5% between these two types of indenters. These results confirmed that the scaling analysis for force curves produced accurate measurements of the local elastic modulus of relatively thick films. However, this analysis will over estimate the true modulus in regions of the growth cone that are thinner than 300–500 nm (79,80).
Acknowledgments
The authors thank Mrs. Virginia Livingstone for editing the manuscript.
This work was supported by the National Institutes of Health (R01 NS049233 to D.M.S.), National Aeronautics and Space Administration Institute for Nanoelectronics and Computing (NASA NCC 2-1363 to G.U.L.), Birck Nanotechnology Center (G.U.L.), and Bindley Bioscience Center (D.M.S.).
Footnotes
Gil U. Lee's present address is School of Chemistry and Chemical Biology, University College, Dublin 4, Ireland.
References
- 1.Charron F., Tessier-Lavigne M. Novel brain wiring functions for classical morphogens: a role as graded positional cues in axon guidance. Development. 2005;132:2251–2262. doi: 10.1242/dev.01830. [DOI] [PubMed] [Google Scholar]
- 2.Dickson B.J. Molecular mechanisms of axon guidance. Science. 2002;298:1959–1964. doi: 10.1126/science.1072165. [DOI] [PubMed] [Google Scholar]
- 3.Song H., Poo M. The cell biology of neuronal navigation. Nat. Cell Biol. 2001;3:E81–E88. doi: 10.1038/35060164. [DOI] [PubMed] [Google Scholar]
- 4.Huber A.B., Kolodkin A.L., Ginty D.D., Cloutier J.F. Signaling at the growth cone: ligand-receptor complexes and the control of axon growth and guidance. Annu. Rev. Neurosci. 2003;26:509–563. doi: 10.1146/annurev.neuro.26.010302.081139. [DOI] [PubMed] [Google Scholar]
- 5.Dent E.W., Gertler F.B. Cytoskeletal dynamics and transport in growth cone motility and axon guidance. Neuron. 2003;40:209–227. doi: 10.1016/s0896-6273(03)00633-0. [DOI] [PubMed] [Google Scholar]
- 6.Bridgman P.C., Dailey M.E. The organization of myosin and actin in rapid frozen nerve growth cones. J. Cell Biol. 1989;108:95–109. doi: 10.1083/jcb.108.1.95. [DOI] [PMC free article] [PubMed] [Google Scholar]
- 7.Lewis A.K., Bridgman P.C. Nerve growth cone lamellipodia contain two populations of actin filaments that differ in organization and polarity. J. Cell Biol. 1992;119:1219–1243. doi: 10.1083/jcb.119.5.1219. [DOI] [PMC free article] [PubMed] [Google Scholar]
- 8.Korobova F., Svitkina T. Arp2/3 complex is important for filopodia formation, growth cone motility, and neuritogenesis in neuronal cells. Mol. Biol. Cell. 2008;19:1561–1574. doi: 10.1091/mbc.E07-09-0964. [DOI] [PMC free article] [PubMed] [Google Scholar]
- 9.Mongiu A.K., Weitzke E.L., Chaga O.Y., Borisy G.G. Kinetic-structural analysis of neuronal growth cone veil motility. J. Cell Sci. 2007;120:1113–1125. doi: 10.1242/jcs.03384. [DOI] [PubMed] [Google Scholar]
- 10.Forscher P., Smith S.J. Actions of cytochalasins on the organization of actin filaments and microtubules in a neuronal growth cone. J. Cell Biol. 1988;107:1505–1516. doi: 10.1083/jcb.107.4.1505. [DOI] [PMC free article] [PubMed] [Google Scholar]
- 11.Rochlin M.W., Dailey M.E., Bridgman P.C. Polymerizing microtubules activate site-directed F-actin assembly in nerve growth cones. Mol. Biol. Cell. 1999;10:2309–2327. doi: 10.1091/mbc.10.7.2309. [DOI] [PMC free article] [PubMed] [Google Scholar]
- 12.Schaefer A.W., Kabir N., Forscher P. Filopodia and actin arcs guide the assembly and transport of two populations of microtubules with unique dynamic parameters in neuronal growth cones. J. Cell Biol. 2002;158:139–152. doi: 10.1083/jcb.200203038. [DOI] [PMC free article] [PubMed] [Google Scholar]
- 13.Zhang X.F., Schaefer A.W., Burnette D.T., Schoonderwoert V.T., Forscher P. Rho-dependent contractile responses in the neuronal growth cone are independent of classical peripheral retrograde actin flow. Neuron. 2003;40:931–944. doi: 10.1016/s0896-6273(03)00754-2. [DOI] [PubMed] [Google Scholar]
- 14.Lin C.H., Espreafico E.M., Mooseker M.S., Forscher P. Myosin drives retrograde F-actin flow in neuronal growth cones. Neuron. 1996;16:769–782. doi: 10.1016/s0896-6273(00)80097-5. [DOI] [PubMed] [Google Scholar]
- 15.Medeiros N.A., Burnette D.T., Forscher P. Myosin II functions in actin-bundle turnover in neuronal growth cones. Nat. Cell Biol. 2006;8:215–226. doi: 10.1038/ncb1367. [DOI] [PubMed] [Google Scholar]
- 16.Tanaka E.M., Kirschner M.W. Microtubule behavior in the growth cones of living neurons during axon elongation. J. Cell Biol. 1991;115:345–363. doi: 10.1083/jcb.115.2.345. [DOI] [PMC free article] [PubMed] [Google Scholar]
- 17.Buck K.B., Zheng J.Q. Growth cone turning induced by direct local modification of microtubule dynamics. J. Neurosci. 2002;22:9358–9367. doi: 10.1523/JNEUROSCI.22-21-09358.2002. [DOI] [PMC free article] [PubMed] [Google Scholar]
- 18.Challacombe J.F., Snow D.M., Letourneau P.C. Dynamic microtubule ends are required for growth cone turning to avoid an inhibitory guidance cue. J. Neurosci. 1997;17:3085–3095. doi: 10.1523/JNEUROSCI.17-09-03085.1997. [DOI] [PMC free article] [PubMed] [Google Scholar]
- 19.Marsh L., Letourneau P.C. Growth of neurites without filopodial or lamellipodial activity in the presence of cytochalasin B. J. Cell Biol. 1984;99:2041–2047. doi: 10.1083/jcb.99.6.2041. [DOI] [PMC free article] [PubMed] [Google Scholar]
- 20.O'Connor T.P., Bentley D. Accumulation of actin in subsets of pioneer growth cone filopodia in response to neural and epithelial guidance cues in situ. J. Cell Biol. 1993;123:935–948. doi: 10.1083/jcb.123.4.935. [DOI] [PMC free article] [PubMed] [Google Scholar]
- 21.Suter D.M., Schaefer A.W., Forscher P. Microtubule dynamics are necessary for SRC family kinase-dependent growth cone steering. Curr. Biol. 2004;14:1194–1199. doi: 10.1016/j.cub.2004.06.049. [DOI] [PubMed] [Google Scholar]
- 22.Tanaka E., Kirschner M.W. The role of microtubules in growth cone turning at substrate boundaries. J. Cell Biol. 1995;128:127–137. doi: 10.1083/jcb.128.1.127. [DOI] [PMC free article] [PubMed] [Google Scholar]
- 23.Williamson T., Gordon-Weeks P.R., Schachner M., Taylor J. Microtubule reorganization is obligatory for growth cone turning. Proc. Natl. Acad. Sci. USA. 1996;93:15221–15226. doi: 10.1073/pnas.93.26.15221. [DOI] [PMC free article] [PubMed] [Google Scholar]
- 24.Henderson E., Haydon P.G., Sakaguchi D.S. Actin filament dynamics in living glial cells imaged by atomic force microscopy. Science. 1992;257:1944–1946. doi: 10.1126/science.1411511. [DOI] [PubMed] [Google Scholar]
- 25.Rotsch C., Braet F., Wisse E., Radmacher M. AFM imaging and elasticity measurements on living rat liver macrophages. Cell Biol. Int. 1997;21:685–696. doi: 10.1006/cbir.1997.0213. [DOI] [PubMed] [Google Scholar]
- 26.Mathur A.B., Truskey G.A., Reichert W.M. Atomic force and total internal reflection fluorescence microscopy for the study of force transmission in endothelial cells. Biophys. J. 2000;78:1725–1735. doi: 10.1016/s0006-3495(00)76724-5. [DOI] [PMC free article] [PubMed] [Google Scholar]
- 27.Braet F., Rotsch C., Wisse E., Radmacher M. Comparison of fixed and living liver endothelial cells by atomic force microscopy. Appl. Phys. A Mat. Sci. Processing. 1998;66:S575–S578. [Google Scholar]
- 28.Chang L., Kious T., Yorgancioglu M., Keller D., Pfeiffer J. Cytoskeleton of living, unstained cells imaged by scanning force microscopy. Biophys. J. 1993;64:1282–1286. doi: 10.1016/S0006-3495(93)81493-0. [DOI] [PMC free article] [PubMed] [Google Scholar]
- 29.Pesen D., Hoh J.H. Micromechanical architecture of the endothelial cell cortex. Biophys. J. 2005;88:670–679. doi: 10.1529/biophysj.104.049965. [DOI] [PMC free article] [PubMed] [Google Scholar]
- 30.Schneider S.W., Sritharan K.C., Geibel J.P., Oberleithner H., Jena B.P. Surface dynamics in living acinar cells imaged by atomic force microscopy: identification of plasma membrane structures involved in exocytosis. Proc. Natl. Acad. Sci. USA. 1997;94:316–321. doi: 10.1073/pnas.94.1.316. [DOI] [PMC free article] [PubMed] [Google Scholar]
- 31.Tojima T., Yamane Y., Takagi H., Takeshita T., Sugiyama T. Three-dimensional characterization of interior structures of exocytotic apertures of nerve cells using atomic force microscopy. Neuroscience. 2000;101:471–481. doi: 10.1016/s0306-4522(00)00320-1. [DOI] [PubMed] [Google Scholar]
- 32.Lal R., Drake B., Blumberg D., Saner D.R., Hansma P.K. Imaging real-time neurite outgrowth and cytoskeletal reorganization with an atomic force microscope. Am. J. Physiol. 1995;269:C275–C285. doi: 10.1152/ajpcell.1995.269.1.C275. [DOI] [PubMed] [Google Scholar]
- 33.McNally H.A., Borgens R.B. Three-dimensional imaging of living and dying neurons with atomic force microscopy. J. Neurocytol. 2004;33:251–258. doi: 10.1023/b:neur.0000030700.48612.0b. [DOI] [PubMed] [Google Scholar]
- 34.McNally H.A., Rajwa B., Sturgis J., Robinson J.P. Comparative three-dimensional imaging of living neurons with confocal and atomic force microscopy. J. Neurosci. Methods. 2005;142:177–184. doi: 10.1016/j.jneumeth.2004.08.018. [DOI] [PubMed] [Google Scholar]
- 35.Parpura V., Haydon P.G., Henderson E. Three-dimensional imaging of living neurons and glia with the atomic force microscope. J. Cell Sci. 1993;104:427–432. doi: 10.1242/jcs.104.2.427. [DOI] [PubMed] [Google Scholar]
- 36.Ricci D., Grattarola M., Tedesco M. Growth cones of living neurons probed by atomic force microscopy. Methods Mol. Biol. 2004;242:125–140. doi: 10.1385/1-59259-647-9:125. [DOI] [PubMed] [Google Scholar]
- 37.Yunxu S., Danying L., Yanfang R., Dong H., Wanyun M. Three-dimensional structural changes in living hippocampal neurons imaged using magnetic AC mode atomic force microscopy. J. Electron Microsc. (Tokyo) 2006;55:165–172. doi: 10.1093/jmicro/dfl013. [DOI] [PubMed] [Google Scholar]
- 38.Grzywa E.L., Lee A.C., Lee G.U., Suter D.M. High resolution analysis of neuronal growth cone morphology by comparative atomic force and optical microscopy. J. Neurobiol. 2006;66:1529–1543. doi: 10.1002/neu.20318. [DOI] [PubMed] [Google Scholar]
- 39.Meyer E. World Scientific Publishing Company; Hackensack, NJ: 2002. Nanoscience: Friction and Rheology at the Nanometer Scale. [Google Scholar]
- 40.Weisenhorn A.L., Khorsandi M., Kasas S., Gotzos V., Butt H.J. Deformation and height anomaly of soft surfaces studied with an AFM. Nanotechnology. 1993;4:106–113. [Google Scholar]
- 41.Radmacher M., Fritz M., Kacher C.M., Cleveland J.P., Hansma P.K. Measuring the viscoelastic properties of human platelets with the atomic force microscope. Biophys. J. 1996;70:556–567. doi: 10.1016/S0006-3495(96)79602-9. [DOI] [PMC free article] [PubMed] [Google Scholar]
- 42.Radmacher M. Measuring the elastic properties of living cells by the atomic force microscope. Methods Cell Biol. 2002;68:67–90. doi: 10.1016/s0091-679x(02)68005-7. [DOI] [PubMed] [Google Scholar]
- 43.Rotsch C., Radmacher M. Drug-induced changes in cytoskeletal structure and mechanics in fibroblasts: an atomic force microscopy study. Biophys. J. 2000;78:520–535. doi: 10.1016/S0006-3495(00)76614-8. [DOI] [PMC free article] [PubMed] [Google Scholar]
- 44.Laurent V.M., Kasas S., Yersin A., Schaffer T.E., Catsicas S. Gradient of rigidity in the lamellipodia of migrating cells revealed by atomic force microscopy. Biophys. J. 2005;89:667–675. doi: 10.1529/biophysj.104.052316. [DOI] [PMC free article] [PubMed] [Google Scholar]
- 45.Rotsch C., Jacobson K., Condeelis J., Radmacher M. EGF-stimulated lamellipod extension in adenocarcinoma cells. Ultramicroscopy. 2001;86:97–106. doi: 10.1016/s0304-3991(00)00102-9. [DOI] [PubMed] [Google Scholar]
- 46.Rotsch C., Jacobson K., Radmacher M. Dimensional and mechanical dynamics of active and stable edges in motile fibroblasts investigated by using atomic force microscopy. Proc. Natl. Acad. Sci. USA. 1999;96:921–926. doi: 10.1073/pnas.96.3.921. [DOI] [PMC free article] [PubMed] [Google Scholar]
- 47.Suter D.M., Errante L.D., Belotserkovsky V., Forscher P. The Ig superfamily cell adhesion molecule, apCAM, mediates growth cone steering by substrate-cytoskeletal coupling. J. Cell Biol. 1998;141:227–240. doi: 10.1083/jcb.141.1.227. [DOI] [PMC free article] [PubMed] [Google Scholar]
- 48.Lee A.C., Decourt B., Suter D.M. Neuronal cell cultures from aplysia for high resolution imaging of growth cones. J. Vis. Exp. 2008;20 doi: 10.3791/662. doi: 10.3791/662. [DOI] [PMC free article] [PubMed] [Google Scholar]
- 49.Martin Y., Williams C.C., Wickramasinghe H.K. Atomic force microscope-force mapping and profiling on a sub 100-Å scale. J. Appl. Phys. 1987;61:4723–4729. [Google Scholar]
- 50.Zhong Q., Innis D., Kjoller K., Elings V.B. Fractured polymer silica fiber surface studied by tapping mode atomic-force microscopy. Surf. Sci. 1993;290:L688–L692. [Google Scholar]
- 51.Schneider J., Dufrene Y.F., Barger W.R., Lee G.U. Atomic force microscope image contrast mechanisms on supported lipid bilayers. Biophys. J. 2000;79:1107–1118. doi: 10.1016/S0006-3495(00)76364-8. [DOI] [PMC free article] [PubMed] [Google Scholar]
- 52.Sader J.E., Chon J.W.M., Mulvaney P. Calibration of rectangular atomic force microscope cantilevers. Rev. Sci. Instrum. 1999;70:3967–3969. [Google Scholar]
- 53.Higgins M.J., Proksch R., Sader J.E., Polcik M., Mc Endoo S. Noninvasive determination of optical lever sensitivity in atomic force microscopy. Rev. Sci. Instrum. 2006;77 013701–013701–5. [Google Scholar]
- 54.Sheiko S.S., Moller M., Reuvekamp E.M., Zandbergen H.W. Calibration and evaluation of scanning-force-microscopy probes. Phys. Rev. B Condens. Matter. 1993;48:5675–5678. doi: 10.1103/physrevb.48.5675. [DOI] [PubMed] [Google Scholar]
- 55.Hertz H. Ueber die Beruehrung fester elastischer Koerper. J. Reine Angew. Math. 1881;92:156–171. [Google Scholar]
- 56.Burnette D.T., Schaefer A.W., Ji L., Danuser G., Forscher P. Filopodial actin bundles are not necessary for microtubule advance into the peripheral domain of Aplysia neuronal growth cones. Nat. Cell Biol. 2007;9:1360–1369. doi: 10.1038/ncb1655. [DOI] [PubMed] [Google Scholar]
- 57.Wu D.Y., Goldberg D.J. Regulated tyrosine phosphorylation at the tips of growth cone filopodia. J. Cell Biol. 1993;123:653–664. doi: 10.1083/jcb.123.3.653. [DOI] [PMC free article] [PubMed] [Google Scholar]
- 58.Suter D.M., Forscher P. Transmission of growth cone traction force through apCAM-cytoskeletal linkages is regulated by Src family tyrosine kinase activity. J. Cell Biol. 2001;155:427–438. doi: 10.1083/jcb.200107063. [DOI] [PMC free article] [PubMed] [Google Scholar]
- 59.Welnhofer E.A., Zhao L., Cohan C.S. Actin dynamics and organization during growth cone morphogenesis in Helisoma neurons. Cell Motil. Cytoskeleton. 1997;37:54–71. doi: 10.1002/(SICI)1097-0169(1997)37:1<54::AID-CM6>3.0.CO;2-H. [DOI] [PubMed] [Google Scholar]
- 60.Letourneau P.C. Differences in the organization of actin in the growth cones compared with the neurites of cultured neurons from chick embryos. J. Cell Biol. 1983;97:963–973. doi: 10.1083/jcb.97.4.963. [DOI] [PMC free article] [PubMed] [Google Scholar]
- 61.Strasser G.A., Rahim N.A., VanderWaal K.E., Gertler F.B., Lanier L.M. Arp2/3 is a negative regulator of growth cone translocation. Neuron. 2004;43:81–94. doi: 10.1016/j.neuron.2004.05.015. [DOI] [PubMed] [Google Scholar]
- 62.Putman C.A.J., Vanderwerf K.O., Degrooth B.G., Vanhulst N.F., Greve J. Viscoelasticity of living cells allows high resolution imaging by tapping mode atomic-force microscopy. Biophys. J. 1994;67:1749–1753. doi: 10.1016/S0006-3495(94)80649-6. [DOI] [PMC free article] [PubMed] [Google Scholar]
- 63.Johnson K.L. Cambridge University Press; Cambridge, MA: 1985. Contact Mechanics. [Google Scholar]
- 64.Janmey P.A., McCulloch C.A. Cell mechanics: integrating cell responses to mechanical stimuli. Annu. Rev. Biomed. Eng. 2007;9:1–34. doi: 10.1146/annurev.bioeng.9.060906.151927. [DOI] [PubMed] [Google Scholar]
- 65.Wagner B., Tharmann R., Haase I., Fischer M., Bausch A.R. Cytoskeletal polymer networks: the molecular structure of cross-linkers determines macroscopic properties. Proc. Natl. Acad. Sci. USA. 2006;103:13974–13978. doi: 10.1073/pnas.0510190103. [DOI] [PMC free article] [PubMed] [Google Scholar]
- 66.Gittes F., Mickey B., Nettleton J., Howard J. Flexural rigidity of microtubules and actin filaments measured from thermal fluctuations in shape. J. Cell Biol. 1993;120:923–934. doi: 10.1083/jcb.120.4.923. [DOI] [PMC free article] [PubMed] [Google Scholar]
- 67.Laney D.E., Garcia R.A., Parsons S.M., Hansma H.G. Changes in the elastic properties of cholinergic synaptic vesicles as measured by atomic force microscopy. Biophys. J. 1997;72:806–813. doi: 10.1016/s0006-3495(97)78714-9. [DOI] [PMC free article] [PubMed] [Google Scholar]
- 68.Discher D.E., Janmey P., Wang Y.L. Tissue cells feel and respond to the stiffness of their substrate. Science. 2005;310:1139–1143. doi: 10.1126/science.1116995. [DOI] [PubMed] [Google Scholar]
- 69.Lee G.U., Chrisey L.A., Colton R.J. Direct measurement of the interaction forces between complementary strands of DNA with atomic force microscopy. Science. 1994;266:771–775. doi: 10.1126/science.7973628. [DOI] [PubMed] [Google Scholar]
- 70.Na S., Collin O., Chowdhury F., Tay B., Ouyang M. Rapid signal transduction in living cells is a unique feature of mechanotransduction. Proc. Natl. Acad. Sci. USA. 2008;105:6626–6631. doi: 10.1073/pnas.0711704105. [DOI] [PMC free article] [PubMed] [Google Scholar]
- 71.Bridgman P.C., Dave S., Asnes C.F., Tullio A.N., Adelstein R.S. Myosin IIB is required for growth cone motility. J. Neurosci. 2001;21:6159–6169. doi: 10.1523/JNEUROSCI.21-16-06159.2001. [DOI] [PMC free article] [PubMed] [Google Scholar]
- 72.Heidemann S.R., Lamoureux P., Buxbaum R.E. Growth cone behavior and production of traction force. J. Cell Biol. 1990;111:1949–1957. doi: 10.1083/jcb.111.5.1949. [DOI] [PMC free article] [PubMed] [Google Scholar]
- 73.O'Connor T.P., Duerr J.S., Bentley D. Pioneer growth cone steering decisions mediated by single filopodial contacts in situ. J. Neurosci. 1990;10:3935–3946. doi: 10.1523/JNEUROSCI.10-12-03935.1990. [DOI] [PMC free article] [PubMed] [Google Scholar]
- 74.Cojoc D., Difato F., Ferrari E., Shahapure R.B., Laishram J. Properties of the force exerted by filopodia and lamellipodia and the involvement of cytoskeletal components. PLoS ONE. 2007;2:e1072. doi: 10.1371/journal.pone.0001072. [DOI] [PMC free article] [PubMed] [Google Scholar]
- 75.Domke J., Radmacher M. Measuring the elastic properties of thin polymer films with the atomic force microscope. Langmuir. 1998;14:3320–3325. [Google Scholar]
- 76.Reference deleted in proof.
- 77.Costa K.D., Sim A.J., Yin F.C. Non-Hertzian approach to analyzing mechanical properties of endothelial cells probed by atomic force microscopy. J. Biomech. Eng. 2006;128:176–184. doi: 10.1115/1.2165690. [DOI] [PubMed] [Google Scholar]
- 78.Radmacher M., Fritz M., Hansma P.K. Imaging soft samples with the atomic-force microscope—gelatin in water and propanol. Biophys. J. 1995;69:264–270. doi: 10.1016/S0006-3495(95)79897-6. [DOI] [PMC free article] [PubMed] [Google Scholar]
- 79.Schwarzer N. Arbitrary load distribution on a layered half space. ASME. J. Tribol. 2000;122:672–681. [Google Scholar]
- 80.Stone D.S. Elastic rebound between an indenter and a layered specimen. Part I. Model. J. Mat. Res. 1998;13:3207–3213. [Google Scholar]
- 81.Lulevich V., Zink T., Chen H.Y., Liu F.T., Liu G.Y. Cell mechanics using atomic force microscopy-based single-cell compression. Langmuir. 2006;22:8151–8155. doi: 10.1021/la060561p. [DOI] [PubMed] [Google Scholar]
- 82.Pampaloni F., Lattanzi G., Jonas A., Surrey T., Frey E. Thermal fluctuations of grafted microtubules provide evidence of length-dependent persistence length. Proc. Natl. Acad. Sci. USA. 2006;103:10248–10253. doi: 10.1073/pnas.0603931103. [DOI] [PMC free article] [PubMed] [Google Scholar]