Abstract
Asymmetric division of adult stem cells generates one self-renewing stem cell and one differentiating cell, thereby maintaining tissue homeostasis. A decline in stem cell function has been proposed to contribute to tissue aging, although the underlying mechanism is poorly understood. Here, we show that changes in the stem cell orientation with respect to the niche during aging contribute to the decline in spermatogenesis in Drosophila male germ line. Throughout the cell cycle, centrosomes in germ line stem cells (GSCs) are oriented within their niche and ensures asymmetric division. We found that GSCs containing misoriented centrosomes accumulate with age and that these GSCs are arrested or delayed in the cell cycle. The cell cycle arrest is transient, and GSCs appear to re-enter cell cycle upon correction of centrosome orientation. Based on these findings, we propose that cell cycle arrest associated with centrosome misorientation functions as a mechanism to ensure asymmetric stem cell division, and that the inability of stem cells to maintain correct orientation during aging contributes to the decline in spermatogenesis. We further show that some of misoriented GSCs likely originate from dedifferentiation of spermatogonia.
Adult stem cell populations maintain highly differentiated but short-lived cells such as blood, intestinal epithelium cells and sperm throughout life. Upon division of stem cells, daughter cells must either self-renew to preserve stem cell identity or commit to differentiation. The balance between stem cell self-renewal and differentiation is critical to tissue homeostasis, with disruption of this balance leading to tumorigenesis (caused by stem cell overproliferation) or tissue degeneration (caused by stem cell depletion). To maintain this critical balance, many stem cells have the potential to divide asymmetrically, producing one daughter stem cell and one differentiating cell1. Many stem cells reside in a special microenvironment, or stem cell niche, that regulates stem cell maintenance2. Asymmetric stem cell division within the niche essentially relies on the correct placement of daughters cells inside and outside of the niche: daughter cells that remain within the niche retain a stem cell identity whereas daughter cells displaced from the niche are fated to differentiate3. Thus, it is critical to establish stem cell polarity within the context of the niche.
A decline in the function of adult stem cells has been proposed to contribute to tissue aging, although the underlying mechanisms remain enigmatic4. Tissue aging has been proposed to have arisen as a tumor suppressor mechanism5, in which tumor suppressor activity reduces stem cell function in later stages of life, preventing tumorigenesis but reducing tissue regenerative capacity6. However, the cellular and molecular basis of such phenomena is poorly understood. Although cell cycle inhibitors such as Ink4a are known to accumulate in stem cells with age and to contribute to an age-related decline in tissue regenerative capacity 7, the mechanisms regulating increased expression of cell cycle inhibitors and their relationship to normal stem cell function are unknown.
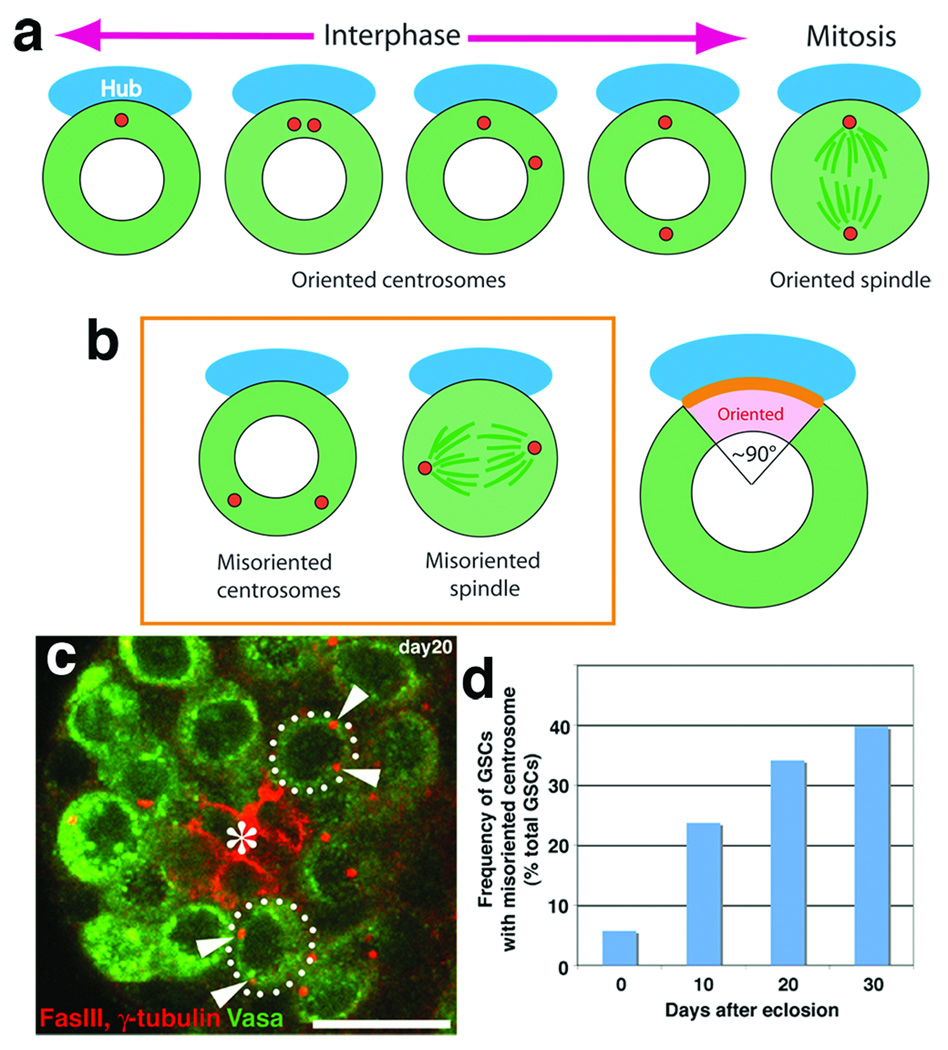
Male germline stem cells (GSCs) in Drosophila melanogaster always undergo asymmetric division. The divisions are regulated by a combination of signal(s) from the niche and spindle orientation. The hub cells, which constitute the stem cell niche, secrete the signaling ligand, Unpaired (Upd), which activates the JAK-STAT (Janus kinase-signal transducer and activator of transcription) pathway in the neighboring germ cells to promote stem cell maintenance8. The spindle lies perpendicular to the hub, so that one daughter cell inherits the attachment to the hub, while the other is displaced away from it9. This stereotypical orientation of the mitotic spindle is precisely set by the positioning of the centrosomes during interphase. The mother centrosome is always anchored to the hub-GSC interface, while the daughter centrosome migrates toward the opposite side of the GSC10 (see Figure 2a). In this way, GSCs are oriented with respect to the niche throughout the cell cycle. Recently, similar centrosome behavior and stem cell polarity have been reported in the Drosophila neuroblast, suggesting that centrosome orientation within stem cells plays a general role in asymmetric division 11,12. However, the relative importance of this orientation to physiological stem cell function is unclear.
Figure 2. Misoriented GSCs increase with age.
a. Schematic diagram of centrosome positioning during the cell cycle.
b. Left panel; the definition of misoriented centrosomes and spindle. Right panel; scoring criterion. Centrosomes were scored to be oriented when one of two centrosomes is in the pink area close to the hub-GSC junction (orange line).
c. An example of testis (20-day old) containing GSCs with misoriented centrosomes. Red, Fas III and γ-tubulin (centrosome); Green, Vasa. Hub(*). Bar, 10 µm.
d. Frequency of GSCs with misoriented centrosomes increases with age (n > 275 GSCs for each time point). The same trend was observed in more than three separate experiments, including conditions with different culture media and temperature (22°C–25°C).
Drosophila testis undergoes an age-related decline in spermatogenesis
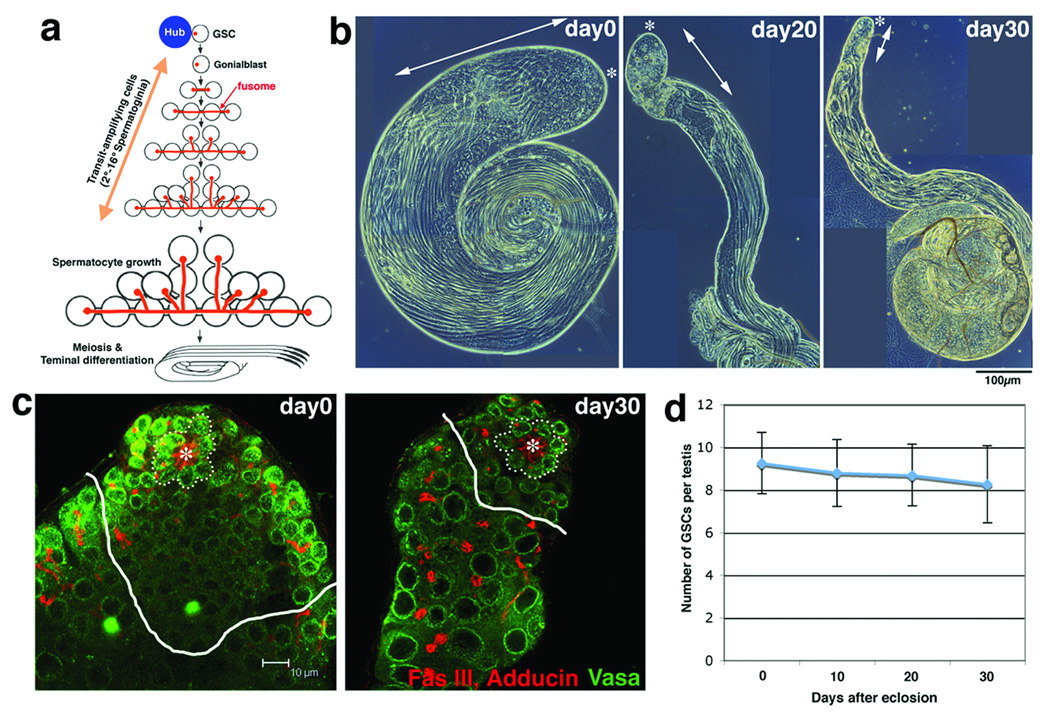
Testes from newly eclosed males contain cells in all stages of spermatogenesis. These include transit-amplifying cells (gonialblast and 2–16 cell spermatogonia), spermatocytes, meiotic cells, and elongated spermatids (Figure 1a, b), the collective presence of which indicates ongoing spermatogenesis. In contrast, as flies age, testes undergo dramatic involution and the number of early germ cells in the apical region of the testis (spermatogonia, spermatocytes, and meiotic cells) progressively decreases (Figure 1b, arrow). A decrease in spermatogenesis could be attributable to decreased function of GSCs. However, the number of GSCs (defined as germ cells attached to the hub) did not significantly decrease after 30 days of age (Figure 1c and d), when testes had already undergone significant involution. This suggests that decreased stem cell number does not fully explain the reduced spermatogenesis that is observed at this stage of the aging, though stem cell numbers ultimately decline in older flies (50 days) and may account for decreased spermatogenesis in later stages of the aging13 (Supplemental Table S1).
Figure 1. Drosophila testis undergoes an age-related decline in spermatogenesis.
a. Spermatogenesis of Drosophila melanogaster (adopted from Fuller 18). GSCs are supported by the hub cells. Each spermatogonial division is incomplete, and the resultant spermatogonia and spermatocytes are connected by a cytoplasmic bridge, or a ring canal, through which a branched fusome runs.
b. Phase microscopy of aging testes. The apical (*) area containing round, relatively early germ cells (arrow) decreases over time.
c. Number of GSCs (surrounded by dotted line) remains constant with age. White lines separate spermatogonia and spermatocytes. Red, Fasciclin III (Fas III; hub) and Adducin (fusome); Green, Vasa (germ cells). Hub (*).
d. The number of GSCs (± SD). n > 50 testes were counted for each time point.
The aging testis accumulates misoriented GSCs
In Drosophila male GSCs, the stereotypical orientation of the mitotic spindle is set up by the positioning of centrosomes during interphase (Figure 2a) 9,10. In young males (0‐2 days after eclosion), GSCs remain oriented toward the niche throughout the cell cycle as previously reported9,10, setting up the stereotypically oriented mitotic spindle. However, we found that, in aged flies, GSCs in which neither centrosome was situated next to the hub became more numerous (hereafter refereed to as “misoriented centrosomes”, Figure 2b). GSCs with misoriented centrosomes increased to approximately 40% of total GSCs at 30 days after eclosion (Figure 2c and d). It should be noted that due to the scoring criteria (Figure 2b), the maximum misorientation would be ~50% (as each randomly-positioned centrosome would end up adjacent to the hub ~25% of time). Consistent with this, the frequency of misoriented GSCs reached plateau at ~40%, with a similar misorientation frequency in very old flies (day 42–50, Supplemental Table S1).
Misoriented GSCs divide less frequently
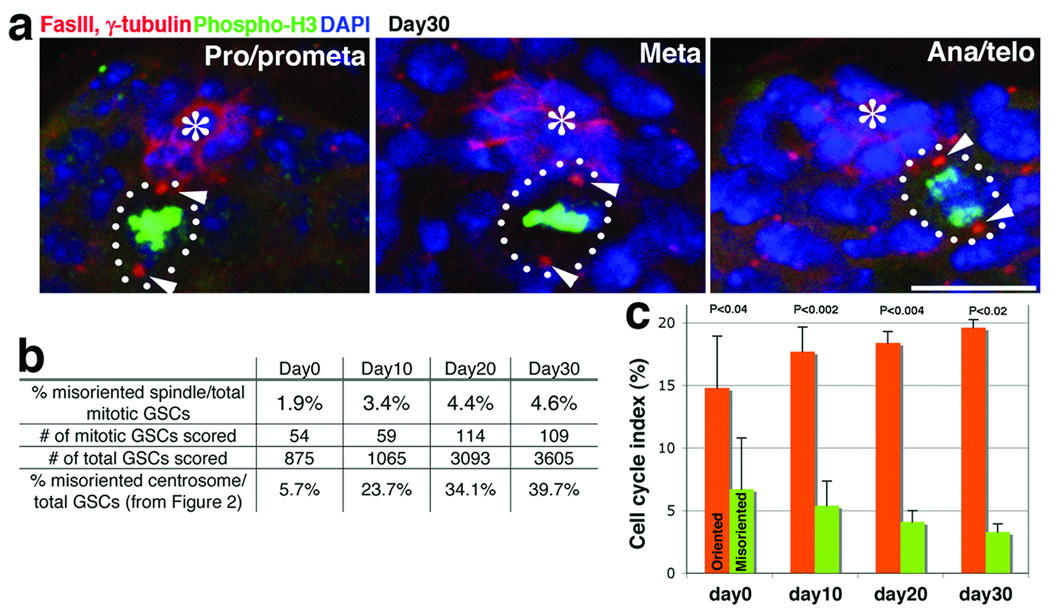
In spite of the fact that ~ 40% of GSCs had misoriented centrosomes in aged testes, we rarely observed “misoriented spindles”, in which neither spindle pole is associated with the hub (Figure 2b), suggesting that GSCs with misoriented centrosomes do not enter mitosis. Overall, 95–100% of mitotic spindles were oriented perpendicular to the hub throughout mitosis, regardless of age (Figure 3a, b). Not only did misoriented GSCs fail to undergo mitosis, but GFP-PACT labeling of centrosomes revealed that significantly fewer cells with misoriented GSCs underwent G1/S transition relative to those with oriented GSCs (Figure 3c, Full Methods). Importantly, the percentage of oriented GSCs from aged flies (day 10 to 30) that entered S phase remained as high as that of oriented GSCs from young flies, demonstrating that aged GSCs do not divide less frequently if their centrosomes are appropriately oriented. In contrast, misoriented GSCs entered S phase with a significantly lower frequency compared to oriented GSCs at all stages of life. These results suggest that the reduced division of aging GSCs is determined by centrosome misorientation.
Figure 3. Misoriented GSCs divide less frequently compared to oriented GSCs.
a. Spindles remain oriented throughout mitosis even at day 30. Red, Fas III and γ-tubulin; Green, Thr3-phosphorylated histone H3 (phospho-H3; mitotic chromatin); Blue, DAPI. Hub(*). Bar, 10 µm.
b. Frequency of misoriented spindle remained low for up to 30 days of age. The percentage of misoriented interphase cells was taken from Figure 2C for comparison.
c. Pulse-labeling of centrosomes by heatshock-induced GFP-PACT expression confirmed the low cell cycle activity of misoriented GSCs. The percentage of GSCs committed to the G1/S transition during the labeling period is shown (mean ± SD; n > 110 labeled GSCs for each point, equivalent to n > 750 total GSCs per data point). P values of t-test (two-tail) are shown.
Misoriented GSCs maintain a capability of cell division
The rare division of misoriented GSCs raises the question of whether misorientation precedes cell cycle arrest/delay or whether it occurs as a consequence of general disintegration of stem cell activity, such as from cellular senescence. To test whether misoriented GSCs retain the ability to re-enter the cell cycle, GSCs were labeled by feeding flies with BrdU-containing food from day 5 to 10, during which time misorientation increased from approximately 10% to 20%. This labeled 96% of all GSCs, including almost all of the misoriented GSCs (which accounted for ~20% of all GSCs; Supplemental Figure S1a). This demonstrates that GSCs that are misoriented by day 10 had replicated their DNA in the preceding several days. Furthermore, when BrdU was discontinued, BrdU labeling quickly disappeared during the BrdU chase period, and was completely absent after 5 days (Supplemental Figure S1b), suggesting misoriented BrdU positive GSCs had divided. The ability of misoriented GSCs to dilute their BrdU label indicates that misoriented GSCs are not permanently arrested in the cell cycle.
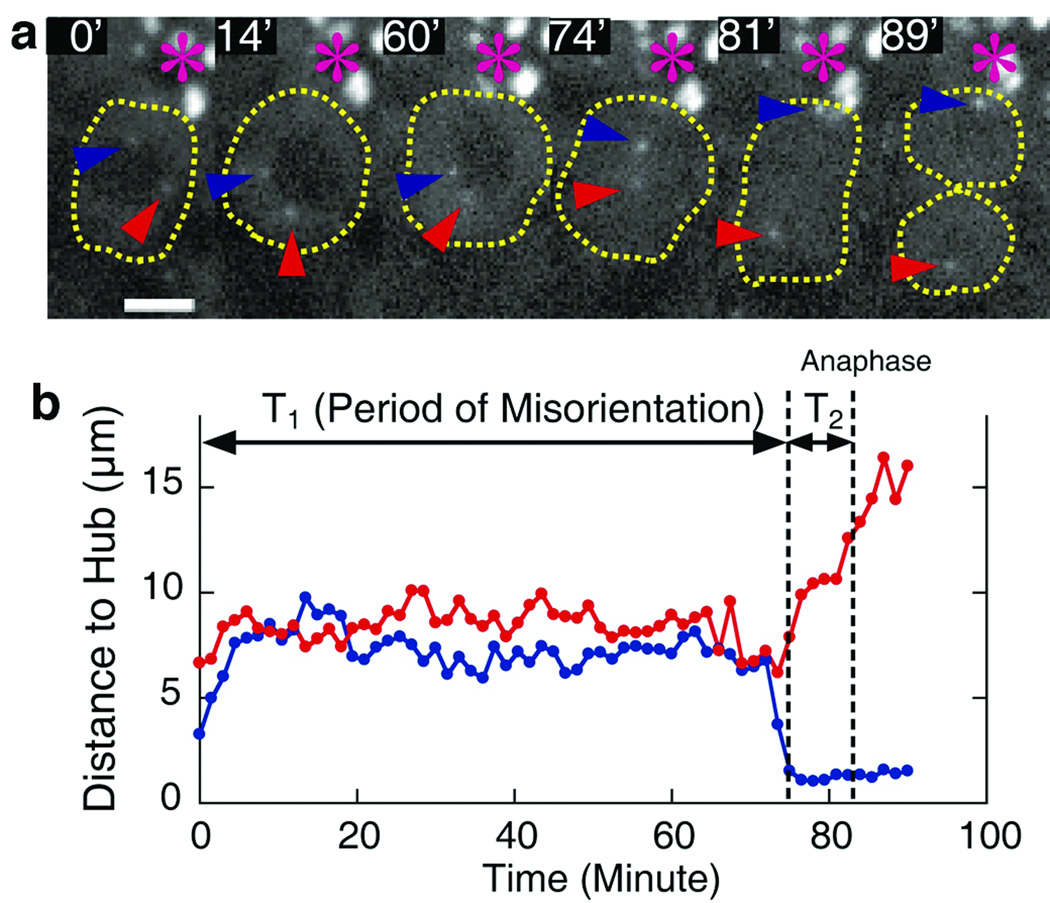
Time-lapse imaging of centrosomes in GSCs confirmed that misoriented GSCs did not divide, but were able to resume dividing as soon as centrosomes restored their correct orientation (Figure 4). We tracked centrosome behavior within GSCs by using mCherry-Sas612, and confirmed that most GSCs exhibit stereotypical movement of centrosomes during the cell cycle as shown in Figure 2a. In addition, we recorded 18 misoriented GSCs that underwent mitosis during the recording time. In each case, misoriented centrosomes moved around within GSCs for a long time (on average, 137±47 min from starting point of the recording), but as long as no centrosome aligned adjacent to the hub the cells never divided. However, when one centrosome became very close to the hub-GSC interface (or “re-oriented”), the GSCs quickly divided (in 18 ± 12 min after re-orientation). The ability of GSCs to re-enter the cell cycle almost immediately upon reorientation of the centrosomes suggests that centrosome misorientation is the proximal cause of the reduced GSC division and the testis involution observed during fly aging.
Figure 4. Misoriented GSCs correct centrosome orientation prior to mitosis.
a. Frames from time-lapse imaging of GSC cell division with misoriented centrosome (Movie is available on line, Supplemental Movie 1). Centrosome movement in a GSC was tracked by mCherry-Sas6. Numbers represent minutes from the start point of recording. Re-orientation occurred around 74 min, and anaphase around 81 min. Hub (*), and two centrosomes (red and blue arrowheads).
b. Tracking of the centrosome movement from the same time-lapse imaging. Red and blue lines represent the movement of centrosomes with red and blue arrowheads shown in (a), respectively.
Some misoriented GSCs originate from dedifferentiation of spermatogonia
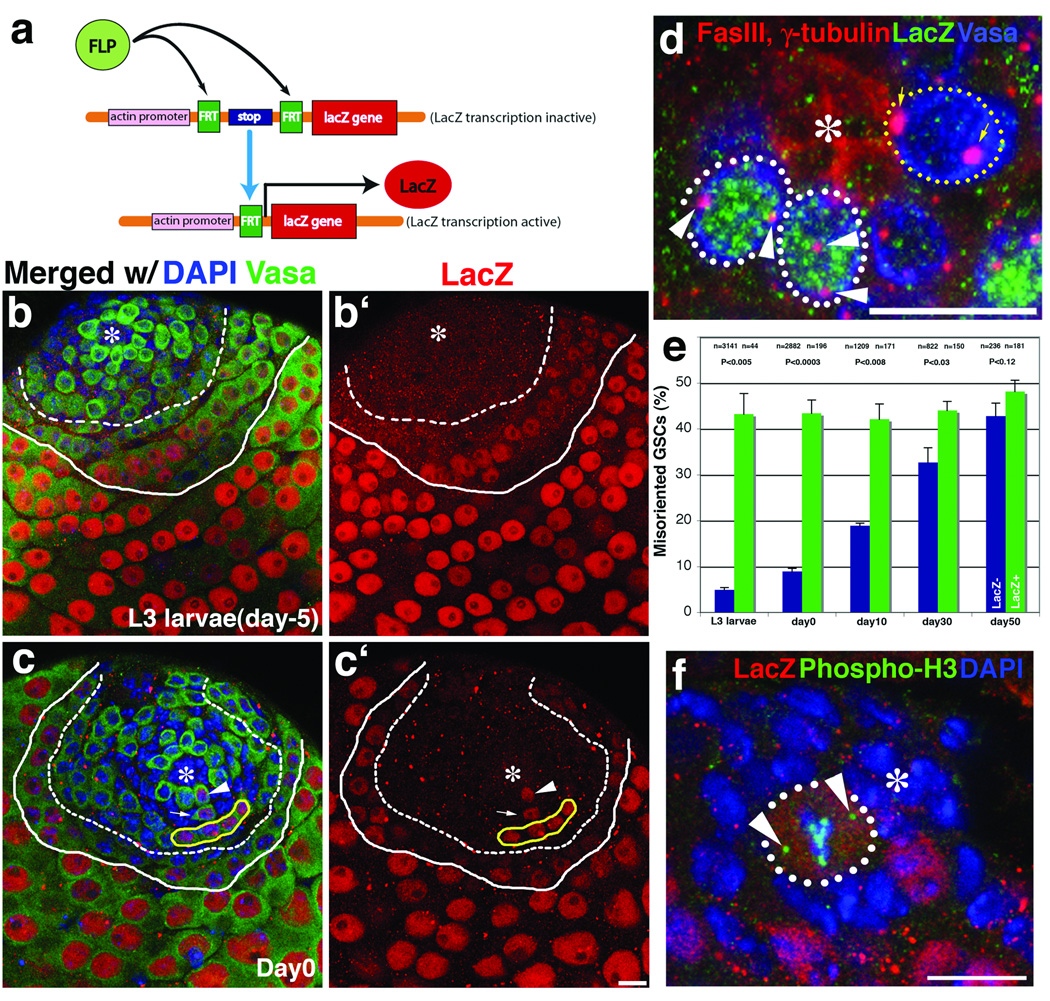
Dedifferentiation has been proposed to be one mechanism by which the stem cell pool can be replenished15, though it is not clear how physiologically important this mechanism is in unperturbed tissues or how it is affected by aging. We hypothesized that if spermatogonia dedifferentiate to stem cells, such cells might not be able to initially orient toward the hub. To test the hypothesis that misoriented GSCs may originate from dedifferentiated spermatogonia, we used FLP-based mitotic recombination to permanently mark germ cells committed to differentiation (Figure 5a). FLP recombinase was expressed under the control of Bam-Gal4, which is selectively expressed in differentiating cells at the 4 cell spematogonia stage and later16. FLP activity in these cells recombined Actin promoter>FRT-stop-FRT>LacZ-NLS to generate a β-galactosidase expression in the differentiating cells (Actin-LacZ-NLS). In testes from 3rd instar larvae, weak LacZ expression was apparent in 4–8 cell spermatogonia and early spermatocytes (Figure 5b, between dashed and solid lines), while LacZ expression became much stronger in later spermatocytes (Figure 5b, after solid line). This pattern of LacZ expression persisted for 30 days. Interestingly, we also sometimes observed LacZ expression in GSCs, as seen by LacZ staining next to the hub (Figure 5c, arrowhead). The frequency of LacZ-positive (LacZ+) stem cells increased with age, with 0.7% GSCs being positive in 3rd instar larvae, 6.1% in newly eclosed males, and 40% in 50 day-old males (Supplemental Figure S2). These LacZ+ GSCs appear to result from dedifferentiation of spermatogonia.
Figure 5. Dedifferentiated GSCs have higher frequency of centrosome misorientation.
a. Strategy to label germ cells that committed to differentiation program through FLP-based recombination.
b and c. LacZ staining of testes from an L3 larva (b) and a day 0 adult (c). Week LacZ expression starts around 4–8 cell spermatogonia (dashed line), and become stronger in spermatocytes (solid line). Arrowhead in (c) shows LacZ+ GSC, with its progeny (gonialblast shown by arrow and 4 cell spermatogonia surrounded by yellow line). Red, LacZ; Green, Vasa; Blue, DAPI. Hub (*). Bar, 10 µm.
d. An example of testis with two misoriented LacZ+ GSCs (white dotted line, with arrowheads indicating misoriented centrosomes) and a correctly oriented LacZ− GSC (yellow dotted line, with arrows indicating properly oriented centrosomes). Red, Fas III and γ-tubulin; Green, LacZ; Blue, Vasa.
e. LacZ+ GSCs have a high frequency of misorientation (mean ± SD). P values of t-test (two-tail) are shown.
f. LacZ+ GSCs are correctly oriented during mitosis. 4th chromosomes that segregate before anaphase mark spindle poles (arrowheads). Red, LacZ; Green, phospho-H3; Blue, DAPI.
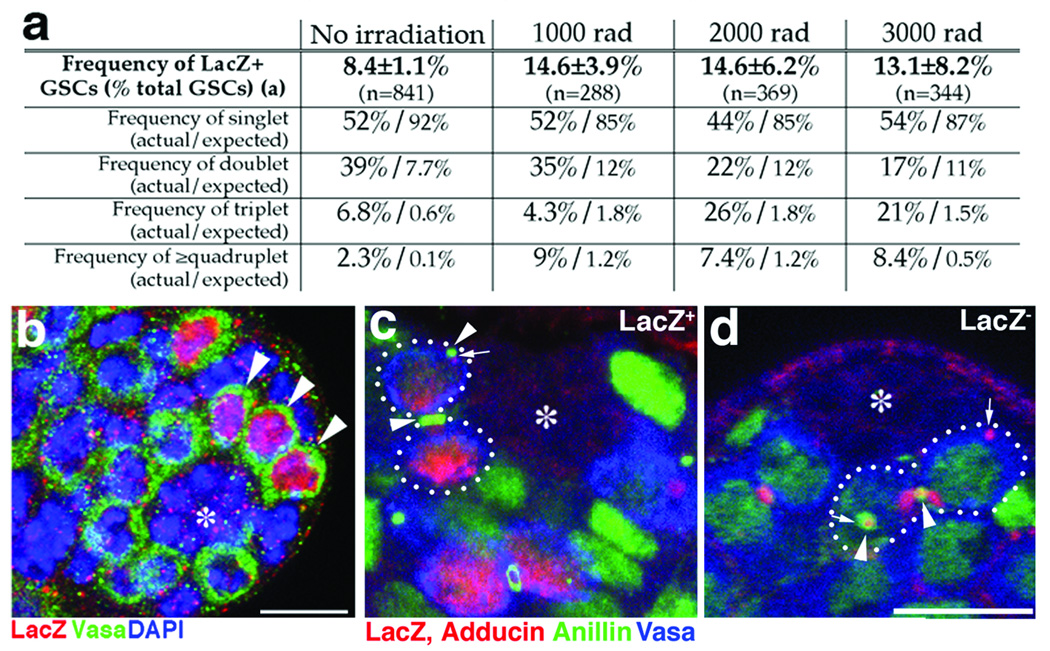
To test whether the LacZ expression in GSCs might be attributable to random, spurious activation of the Bam promoter in GSCs, we tested whether X-irradiation affected LacZ expression in GSCs. Since irradiation kills GSCs (as well as other types of cells), this should increase the rate of dedifferentiation, whereas if LacZ expression is attributable to random Bam activation in GSCs it should not be affected by irradiation. The frequency of LacZ+ GSCs increased after X-irradiation, suggesting that LacZ expression in GSCs reflects the replenishment of GSCs by dedifferentiation of spermatogonia (Figure 6a). In further support of this conclusion, the frequency of multiplets (multiple LacZ+ GSCs next each other, Figure 6b) was significantly higher than what would be expected based on the random, sporadic expression of FLP in GSCs (Figure 6a), indicating simultaneous dedifferentiation of interconnected spermatogonia. Furthermore, we observed LacZ+ spermatogonia next to the hub with disintegrating fusomes and ring canals (Figure 6c, Supplemental Figure S3), hallmarks of dedifferentiation 15 (0.11 dedifferentiating events/testis after 2000 or 3000 rad of irradiation, n=388). Importantly, we also observed many LacZ− dedifferentiating spermatogonia (Figure 6d, and Supplemental Figure S3, 0.47 dedifferentiating events/testis, n=388), suggesting that not all dedifferentiation events are marked by LacZ expression (on average, only ~18% of total dedifferentiation events were marked by LacZ expression). This is presumably due to the dedifferentiation from 2‐4 cell spermatogonia that have not activated Bam promoter. Taken together, these results suggest that LacZ expression successfully marks dedifferentiation.
Figure 6. Evidence that LacZ+ GSCs are generated by dedifferentiation.
a. Summary of LacZ+ GSC frequencies with or without X-ray irradiation. Flies were irradiated at day 0 of age, and analyzed at day 5. The actual and expected frequencies of singlet, doublet, triplet, and quadruplet (or more) are shown. N; number of GSCs scored. The expected frequencies were calculated as described in Full Methods.
b. An example of testis apical tip (irradiated with 2000 rad) containing a triplet (arrowheads: 3 LacZ+ GSCs are locating next each other). Red; LacZ, Green; Vasa, Blue; DAPI. Bar; 10µm. Hub(*).
c. and d. Examples of LacZ+ (c) and LacZ− (d) dedifferentiating spermatogonia (surrounded by dotted lines), with multiple ring canals (arrowheads) and disintegrating fusomes (arrows), observed 24 hours after irradiation. Red, LacZ and adducin; Green, Anillin (ring canal and nucleus); Blue, Vasa. Bar; 10µm.
Remarkably, we found that LacZ+ GSCs had a significantly higher frequency of centrosome misorientation compared to LacZ-negative (LacZ−) GSCs (Figure 5d, e). From L3 larvae to day 30, >40% of LacZ+ GSCs showed centrosome misorientation, suggesting that dedifferentiated GSCs cannot correctly orient centrosomes toward the hub. It should be noted that not all misoriented GSCs were LacZ+. The frequency of misoriented LacZ− GSCs increased with age, reaching ~30% after 30 days and ~40% after 50 days. These GSCs might result from dedifferentiation of gonialblasts and 2–4 cell spermatogonia, which have not yet expressed Bam-induced FLP recombinase, as suggested above. Alternatively, there might be other reasons that cause centrosome misorientation in GSCs that remain to be determined. In either case, these results demonstrate that misoriented GSCs originate, at least in part, from the dedifferentiation of spermatogonia.
Importantly, the mitotic spindles of dedifferentiated GSCs were oriented similarly to constitutive (LacZ−) GSCs (Figure 5f. 97% oriented (n=202) for LacZ− GSCs, 95% oriented (n=20) for LacZ+ GSCs). This demonstrates that, while centrosome orientation is defective in dedifferentiated GSCs, those that resume division exhibit normal mitotic spindle orientation. These data indicate that the dedifferentiated GSCs that enter mitosis do so only when their centrosomes are oriented. Considering that we rarely observed misoriented spindles, even in very early prophase (Figure 3a), it is unlikely that the misoriented spindle (not the centrosome) undergoes re-orientation after entering mitosis, as observed in Drosophila embryonic neuroblast17. This also demonstrates that dedifferentiated GSCs can function as stem cells by dividing and producing progeny, which was also evidenced by the presence of LacZ+ differentiating progenies produced by LacZ+ GSCs (Figure 5c; arrow, gonialblast; yellow solid line, 4 cell spermatogonia).
Discussion
Here we demonstrate that GSCs with misoriented centrosomes accumulate as flies age. Since such misoriented GSCs divide less frequently as compared to oriented GSCs, accumulation of misoriented GSCs contributes to the decline in spermatogenesis that occurs with age. Although misoriented GSCs rarely divide, they are not permanently arrested (or senescent) and are correctly oriented when they divide. Whether correction of GSC orientation is an active process that is part of the acquisition of stem cell identity remains to be determined. The low cell cycle activity of misoriented GSCs may also suggest that mechanisms are in place to detect misorientation and induce cell cycle arrest in response to this change, although the underlying mechanisms remain to be identified.
We have also demonstrated that misoriented GSCs originate, at least in part, from dedifferentiation of spermatogonia. Although dedifferentiated GSCs have high frequency (>40%) of centrosome misorientation, they can function as stem cells by resuming the cell cycle, with correctly oriented mitotic spindles just like as constitutive GSCs. GSC numbers do not decrease as quickly as expected from the calculated GSC half-life, suggesting that a mechanism to compensate for the loss of GSCs exists 14. Since we rarely observed misoriented spindles, or symmetric stem cell division, we speculate that dedifferentiation is the major mechanism to replace stem cells over time in the Drosophila male germ line.
A decline in GSC number in older males (day 50) was reported recently 13. This decrease in stem cell number is likely due to failure of the niche function (via decreased signal from the niche as well as decreased E-cadherin-based attachment between the niche and GSCs)13. However, the decrease in the production of spermatogonia and testis involution precede the loss of GSCs such that decreasing GSC numbers cannot explain the testis involution that is observed at younger ages.
The present results provide a novel mechanistic link between the control of stem cell polarity and the age-related decline in tissue regenerative capacity. Mechanisms responsible for monitoring stem cell orientation with respect to the niche not only prevent overproliferation of stem cells by ensuring the asymmetric outcome of the stem cell division, but they contribute to the decline in tissue regenerative capacity during aging. Many of the misoriented GSCs originate from the dedifferentiation of spermatogonia, a mechanism thought to be responsible for maintaining the stem cell population over extended periods of time. Therefore, although GSCs produce less progeny over time, the system appears to maximize the number of progeny produced throughout life, while maintaining asymmetric stem cell division.
In summary, we propose that the GSCs with misoriented centrosome divide less frequently and that a combination of such a decreased stem cell division and a higher frequency of the GSC misorientation in aged testes leads to a decline in spermatogenesis with age.
Methods Summary
Immunofluorescent staining
Immunofluorescent staining was performed as described elsewhere9. For γ-tubulin and LacZ dual staining, testes were fixed in 90% ethanol 3.8% formaldehyde solution (chilled to −20°C). Fixed testes were then permeabilized by washing in 1× PBS with 0.1% triton X-100 (30 min) prior to immunofluorescent staining. The following primary antibodies were used in combination with appropriate Alexafluor-conjugated secondary antibodies (1:200, Molecular Probes): Mouse anti-Fasciclin III (1:10, developed by C. Goodman 19 and obtained from the Developmental Studies Hybridoma Bank), mouse anti-Adducin (1:20, develpmed by Lipshitz, H.D20. and obtained from the Developmental Studies Hybridoma Bank), rabbit anti-Vasa (1:2000, a kind gift from Ruth Lehmann), goat anti-Vasa (1:20, Santa Cruz), mouse anti-γ-tubulin (1:100, GTU-88, Sigma), rabbit anti-phosphorylated histone H3 (Thr3) (1:200, Upstate), mouse anti-β-galactosidase (1: 200, G4644, Sigma), rabbit anti-β-galactosidase (1: 500, Abcam), rabbit anti-anillin (1:1300; a kind gift from Christine Field) and mouse anti-BrdU (1: 200, BU-33, Sigma). BrdU staining was performed as detailed by Gonczy and DiNardo 21. Image was taken by using Leica SP5 confocal microscope and processed using Adobe Photoshop CS 8.0.
Time-lapse live-imaging of GSCs inside testes
Newly enclosed Sas-6-mCherry flies12 were dissected inside Drosophila culture medium (DCM) containing Schneider’s Drosophila medium and 10% Fetal Bovine Serum. The testis tips were placed inside a sterile glass-bottom chamber, and was mounted on a three-axis computer-controlled piezoelectric stage and imaged using an inverted microscope equipped with an electron multiplier cooled CCD camera. Four-dimensional image sequences (x, y, z, and time) were acquired every 90 seconds. A semi-automatic tracking software was used to track locations of centrosomes and hubs, and the tracking algorithm was based on the pattern matching routine inside National Instrument IMAQ Vision software. The supplemental movie was generated using Sony Vegas software.
Methods
Fly strains
Heatshock (hs)-gal4 (Flybase), actin<FRT-stop-FRT<LacZ, and UAS-FLP were obtained from the Bloomington Drosophila Stock Center. UAS-GFP-PACT was described previously10. Bam-Gal4 is a kind gift from Dennis McKearin. mCherry-Sas6 is a kind gift from Nasser Rusan and Mark Peifer12. All Drosophila stocks were maintained under standard culture conditions using Bloomington Standard media or yeast-glucose media.
Cell cycle index assessed by GFP-PACT incorporation into centrosome
Heatshock (hs)-Gal4/UAS-GFP-PACT flies (0, 10, 20, 30 days of age) were subjected to 2.5 hrs of heatshock at 37°C degree. Cells that passed through G1/S during the period of GFP-PACT expression incorporated GFP-PACT into their centrosomes. At 10hrs after the heatshock, when most of GSCs are still in the first cell cycle, flies were dissected and testes were subjected to immunofluorescent staining. Cell cycle index were calculated as GFP-positive GSCs/total GSCs (%).
Pulse-chase of BrdU labeling
yw or Asl-YFP flies (a kind gift from Dr. Gonzalez) were fed from day 6 to 10 of age with BrdU in the mixture of 1ml 100% apple juice, 0.8g of instant fly food (Sigma), 40µl of 100mg/ml BrdU solution (in 1:1 of acetone and DMSO). Flies were transferred to fresh BrdU-containing food every 24 hours. After the feeding period, flies were transferred to regular fly food and subjected to immunofluorescent staining at appropriate time points (day10 (0-day chase), day 12 (2-day chase) and day 15 (5-day chase)). Some flies did not incorporate BrdU into gonad, thus such testes without any BrdU incorporation were not scored.
Detection of germ cells that have committed to differentiation program
Male UAS-FLP; Bam-Gal4 flies were crossed to female Act<FRT-stop-FRT<LacZ-NLS flies. Progenies were aged appropriately and subjected to immunofluorescent staining for LacZ and other appropriate markers. For X-ray irradiation, flies were irradiated with Cesium 137 GammaCell40 Exactor Irradiator (MDS Nordia, Kanata, ON, Canada), delivering approximately 100 rad/min.
It should be noted that we occasionally observed LacZ+ signal in testicular somatic cells (i.e. cyst progenitor cells, cyst cells and hub cells), though much less frequently than LacZ+ GSCs. In contrast to LacZ+ GSCs, of which frequency increase with age, the frequency of the LacZ+ somatic cells did not increase over time (L3 larvae to day 30 of age), suggesting that somatic cells from late larval stage to day 30 of age do not newly create active LacZ gene. Although we do not know the reason why LacZ gene activation occurs in somatic cells, such events appear to occur only during early stages of development but not after L3 larval stage.
Statistical Analysis of LacZ+ GSC frequency
With or without X-irradiation, the frequency of LacZ+ (x) comes from actual observation and is calculated as the number of counted LacZ+ GSCs divided by the total number of observed GSCs. Then, the frequency of LacZ− is 1−x. A general statistical analysis is discussed below, excluding unrealistic cases of x=0 or 1 (ie., all GSCs are LacZ− or LacZ+).
The singlet is defined as a single LacZ+ GSC with adjacent LacZ− GSCs on both sides, and the doublet is defined as two LacZ+ next to each other with adjacent LacZ− GSCs on both sides, etc. In Figure 6, the expected frequency was calculated as the “conditional probability” with the assumption of random LacZ expression in GSCs. Because x ≠ 0 or 1, the probability of locating an alignment of LacZ+ next to LacZ− GSC (ie. [LacZ−, LacZ+] is unity. Under this condition, if the next GSC is LacZ− (with the probability (1−x)), it is counted as a singlet (ie. [LacZ−, LacZ+, LacZ−]). Thus the probability of singlet is 1−x. If an alignment of [LacZ−, LacZ+] is followed by a LacZ+ GSC (with the probability x) and then a LacZ− GSC (with the probability (1−x)), it is counted as a doublet (ie., [LacZ−, LacZ+, LacZ+, LacZ−]), resulting in the probability of doublet as (1−x)x. Similarly, the probability of triplet (ie., [LacZ−, LacZ+, LacZ+, LacZ+, LacZ−]) is (1−x)x2, and the probability of quadruplet or more is (1−x)x3+(1−x)x4 + ……= x3.. Here, we did not consider the fact that GSCs are aligned in a circle around the hub, because the probability of all GSCs surrounding the hub (~ 9 GSCs per testis) being LacZ+ is negligible for either actual observations or calculated expected values (<10−7). Obviously, the normalization of the total probability is also conserved by summing all probability together as (1−x)+(1−x)x+(1−x)x2+ x3=1.
Supplementary Material
Acknowledgements
We thank Drs. C. Gonzalez, D. McKearin, N. Rusan, M. Peifer and the Bloomington Stock Center for fly stocks, Drs. R. Lehmann and C. Field and the Developmental Studies Hybridoma Bank for antibodies, Drs. Mark Kiel and Daisuke Nakada for help with X-ray irradiation, and Drs. Sean Morrison and Tony Mahowald for comments on the manuscript. This research was supported by a University of Michigan start-up fund, March of Dimes Basil O’Conner Starter Scholar Research Award and the Searle Scholar Program (to YMY), NIH Grants P01 DK53074 (to MTF) and R01GM072006 (to AJH)
References
- 1.Morrison SJ, Kimble J. Nature. 2006;441(7097):1068. doi: 10.1038/nature04956. [DOI] [PubMed] [Google Scholar]
- 2.Spradling A, Drummond-Barbosa D, Kai T. Nature. 2001;414(6859):98. doi: 10.1038/35102160. [DOI] [PubMed] [Google Scholar]; Fuchs E, Tumbar T, Guasch G. Cell. 2004;116(6):769. doi: 10.1016/s0092-8674(04)00255-7. [DOI] [PubMed] [Google Scholar]
- 3.Yamashita YM, Fuller MT, Jones DL. J Cell Sci. 2005;118(Pt 4):665. doi: 10.1242/jcs.01680. [DOI] [PubMed] [Google Scholar]
- 4.Rando TA. Nature. 2006;441(7097):1080. doi: 10.1038/nature04958. [DOI] [PubMed] [Google Scholar]
- 5.Serrano M, Blasco MA. Nat Rev Mol Cell Biol. 2007;8(9):715. doi: 10.1038/nrm2242. [DOI] [PubMed] [Google Scholar]; Sharpless NE, Depinho RA. Nat Rev Mol Cell Biol. 2007;8(9):703. doi: 10.1038/nrm2241. [DOI] [PubMed] [Google Scholar]
- 6.Kirkwood TB. Cell. 2005;120(4):437. doi: 10.1016/j.cell.2005.01.027. [DOI] [PubMed] [Google Scholar]
- 7.Janzen V, Forkert R, Fleming HE, et al. Nature. 2006;443(7110):421. doi: 10.1038/nature05159. [DOI] [PubMed] [Google Scholar]; Molofsky AV, Slutsky SG, Joseph NM, et al. Nature. 2006;443(7110):448. doi: 10.1038/nature05091. [DOI] [PMC free article] [PubMed] [Google Scholar]; Krishnamurthy J, Ramsey MR, Ligon KL, et al. Nature. 2006;443(7110):453. doi: 10.1038/nature05092. [DOI] [PubMed] [Google Scholar]
- 8.Kiger AA, Jones DL, Schulz C, et al. Science. 2001;294(5551):2542. doi: 10.1126/science.1066707. [DOI] [PubMed] [Google Scholar]; Tulina N, Matunis E. Science. 2001;294(5551):2546. doi: 10.1126/science.1066700. [DOI] [PubMed] [Google Scholar]
- 9.Yamashita YM, Jones DL, Fuller MT. Science. 2003;301(5639):1547. doi: 10.1126/science.1087795. [DOI] [PubMed] [Google Scholar]
- 10.Yamashita YM, Mahowald AP, Perlin JR, et al. Science. 2007;315(5811):518. doi: 10.1126/science.1134910. [DOI] [PMC free article] [PubMed] [Google Scholar]
- 11.Rebollo E, Sampaio P, Januschke J, et al. Dev Cell. 2007;12(3):467. doi: 10.1016/j.devcel.2007.01.021. [DOI] [PubMed] [Google Scholar]
- 12.Rusan NM, Peifer M. J Cell Biol. 2007;177(1):13. doi: 10.1083/jcb.200612140. [DOI] [PMC free article] [PubMed] [Google Scholar]
- 13.Boyle M, Wong C, Rocha M, et al. Cell Stem Cell. 2007;1(4):470. doi: 10.1016/j.stem.2007.08.002. [DOI] [PubMed] [Google Scholar]
- 14.Wallenfang MR, Nayak R, DiNardo S. Aging Cell. 2006;5(4):297. doi: 10.1111/j.1474-9726.2006.00221.x. [DOI] [PubMed] [Google Scholar]
- 15.Brawley C, Matunis E. Science. 2004;304(5675):1331. doi: 10.1126/science.1097676. [DOI] [PubMed] [Google Scholar]; Kai T, Spradling A. Nature. 2004;428(6982):564. doi: 10.1038/nature02436. [DOI] [PubMed] [Google Scholar]
- 16.Schulz C, Kiger AA, Tazuke SI, et al. Genetics. 2004;167(2):707. doi: 10.1534/genetics.103.023184. [DOI] [PMC free article] [PubMed] [Google Scholar]
- 17.Kaltschmidt JA, Davidson CM, Brown NH, et al. Nat Cell Biol. 2000;2(1):7. doi: 10.1038/71323. [DOI] [PubMed] [Google Scholar]
- 18.Fuller MT. New York: Cold Spring Harbor Laboratory Press; 1993. p. 71. [Google Scholar]
- 19.Patel NH, Snow PM, Goodman CS. Cell. 1987;48(6):975. doi: 10.1016/0092-8674(87)90706-9. [DOI] [PubMed] [Google Scholar]
- 20.Ding D, Parkhurst SM, Lipshitz HD. Proc Natl Acad Sci U S A. 1993;90(6):2512. doi: 10.1073/pnas.90.6.2512. [DOI] [PMC free article] [PubMed] [Google Scholar]
- 21.Gonczy P, DiNardo S. Development. 1996;122(8):2437. doi: 10.1242/dev.122.8.2437. [DOI] [PubMed] [Google Scholar]
Associated Data
This section collects any data citations, data availability statements, or supplementary materials included in this article.


