

Abstract
Neural circuit development requires concurrent morphological and functional changes. Here we identify coordinated and inversely correlated changes in dendritic morphology and mEPSC amplitude following increased neural activity. We show that over-expression of β-catenin, a molecule that increases total dendritic length, mimics the effects of increased neuronal activity by scaling down mEPSC amplitudes, while postsynaptic expression of a protein that sequesters β-catenin reverses the effects of activity on reducing mEPSC amplitudes. These results were confirmed immunocytochemically as changes in the size and density of surface synaptic AMPA receptor clusters. In individual neurons there was an inverse linear relationship between total dendritic length and average mEPSC amplitude. Importantly, β-catenin over-expression in vivo promoted dendritic growth and reduced mEPSC amplitudes. Together, these results demonstrate that coordinated changes in dendritic morphology and unitary excitatory synaptic strength may serve as an important intrinsic mechanism that helps prevent neurons from over-excitation during neural circuit development.
Introduction
A critical mechanism by which activity influences the early postnatal development of neural circuits is via effects on dendritic aborization (Parrish et al., 2007; Van Aelst and Cline, 2004; Wong and Ghosh, 2002). Specifically, it has been demonstrated in a variety of in vitro and in vivo preparations that increased neural activity accelerates the growth of dendrites and the complexity of their arbor. For example, light stimulation of Xenopus tectal neurons in vivo accelerates the rate of dendritic arbor growth (Sin et al., 2002). Similarly, in cultured mammalian neurons, pharmacological manipulations that mimic elevated neural network activity increase total dendritic branch length and tip number (Redmond et al., 2002; Yu and Malenka, 2003). Both in vivo and in vitro, the effects of neural activity on dendritic growth appear to be mediated, at least in part, through activation of NMDA receptors and small Rho GTPases (Van Aelst and Cline, 2004). Work in vitro also suggests that signaling through L type calcium channels, calcium/calmodulin-dependent kinases and the transcription factor CREB play an important role in activity-dependent increases in dendritic arborization (Redmond et al., 2002; Wayman et al., 2006).
Manipulations that mimic increases in neural activity in cultured mammalian neurons not only affect dendritic growth but also activate mechanisms that scale synaptic strength (Burrone and Murthy, 2003; Davis, 2006; Turrigiano, 2007; Turrigiano and Nelson, 2004). For example, increasing network activity via the application of GABA receptor antagonists or chronically depolarizing neurons with elevated extracellular potassium results in uniform scaling down of strength at all excitatory synapses (Leslie et al., 2001; O’Brien et al., 1998; Turrigiano et al., 1998). These observations raise the question of whether the activity-dependent changes in dendritic aborization and synaptic strength are correlated. And if so, are these events regulated independently or coordinated?
A molecular tool set that can be used to address this question is the cadherin/catenin cell adhesion complex, which has been shown to play an important role in regulating dendritic arborization during early postnatal development (Yu and Malenka, 2003). Over-expression of N-cadherin, αN-catenin or β-catenin increase dendritic arborization while expression of the intracellular domain of N-cadherin [N(intra)], which binds to β-catenin and sequesters it from functional cadherin/catenin complexes, reduces total dendritic branch length (TDBL). Importantly, N(intra) also blocks the increase in dendritic aborization elicited by mimicking increased neural activity (Yu and Malenka, 2003). Thus molecular manipulations of the cadherin/catenin complex can both mimic and block the effects of neural activity on TDBL. Furthermore, although cadherins and catenins have been proposed to play roles in synapse development (Dalva et al., 2007; Salinas and Price, 2005), loss-of-function studies suggest roles for these molecules in promoting synaptic transmission (Abe et al., 2004; Bamji et al., 2003; Jungling et al., 2006; Okuda et al., 2007), an effect opposite to the scaling down of excitatory synaptic transmission in response to increased neural activity.
Here we address whether increased dendritic growth results in coordinated changes in the scaling of excitatory synaptic strength, and furthermore, if a causal relationship exists between these factors. We find that over-expression of β-catenin decreases miniature excitatory post-synaptic current (mEPSC) amplitude and surface AMPA receptor cluster size and density similar to the effects of increased neural activity. Furthermore, the effects of increased neural activity on the scaling down of synaptic strength are blocked by expression of N(intra). Importantly, we identify a strong inverse correlation between TDBL and mEPSC amplitude and show that neurons with increased TDBL have higher NMDAR/AMPAR ratios and can still respond to subsequent activity blockade by scaling up their mEPSC amplitudes. These results suggest that during later stages of postnatal development, activity-dependent increases in dendritic aborization, mediated by the cadherin/catenin complex, are sufficient to activate mechanisms that limit total synaptic input while leaving intact the ability to respond to further changes in neural activity. This phenomenon complements and adds to the armamentarium of mechanisms, such as Hebbian and homeostatic synaptic plasticity, which are believed to sculpt neural circuits during development.
Results
Regulation of activity-dependent dendritic arborization by the cadherin/catenin complex
To investigate whether a correlation exists between changes in TDBL and synaptic strength, we selected a time point (12 days in vitro) at which both mEPSCs and dendritic length are measurable and subject to change. Neurons were filled with the fluorescent dye Alexa 568 hydrazide during whole cell patch clamp recording and fixed immediately upon electrode removal, ensuring that the exact same neurons were used for both electrophysiological and morphological assays. Post-fixation, dendritic morphology of these neurons was imaged using confocal microscopy and 3D reconstructed using Neurolucida software. Consistent with previous findings, over-expression of a stabilized form of β-catenin (β-catenin*; see methods) increased TDBL (β-cat*, 3492.6 ± 251.5 μm, n = 17, p < 0.005 compared to GFP alone, 2515.0 ± 140.4 μm, n = 26) (Figure 1A, D). This effect on TDBL was similar to the effects of mimicking increased neural activity with elevated extracellular potassium (K+, 3122.9 ± 159.5 μm, n = 22, p< 0.01) (Figure 1A). In contract, expression of N(intra), a truncated form of N-cadherin that sequesters endogenous β-catenin and prevents it from participating in functional cadherin/catenin complexes, reduced TDBL [N(intra), 1875.1 ± 116.2 μm, n = 13, p = 0.005] and completely blocked the effects of depolarization on dendritic arborization [K+ + N(intra), 1754.2 ± 96.5 μm, n = 23, p < 0.001 compared to GFP alone, p < 0.001 compared to K+ alone] (Figure 1A). Concurrent with changes in TDBL, changes in total dendritic branch tip number (TDBTN) (Figure 1B) and total dendritic surface area (Figure 1C) were detected in all experimental conditions. Furthermore, changes in TDBL and TDBTN, as well as TDBL and total dendritic surface area were tightly correlated both for neurons transfected with GFP alone (Figure 1E, n = 26, r2 = 0.52, p < 0.001; Figure 1F, r2 = 0.72, p < 0.001) and for all experimentally manipulated neurons (Figure 1G, n = 101, r2 = 0.63, p < 0.0001; Figure 1H, r2 = 0.88, p < 0.001).
Figure 1. The effects of activity and changes in the cadherin/catenin complex on dendritic morphology.
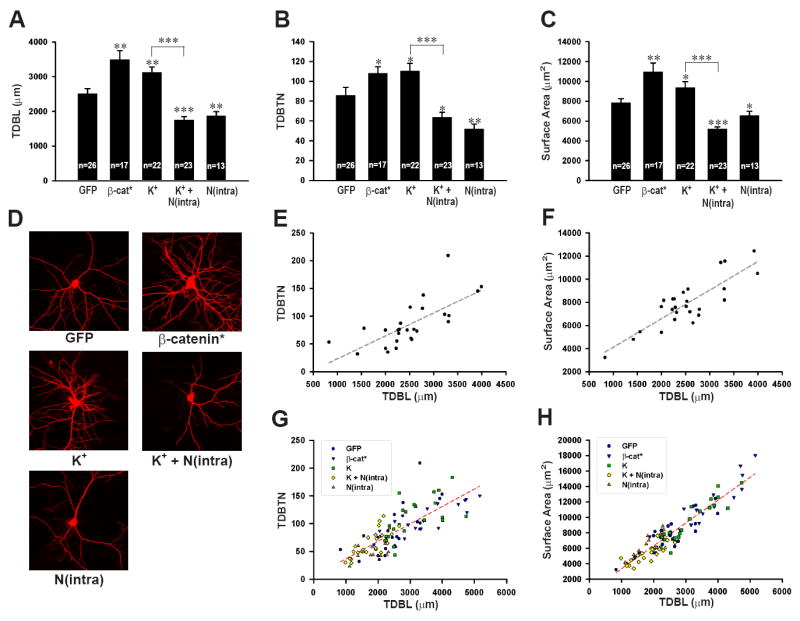
(A) Graph of TDBL in neurons expressing GFP (2515.0 ± 140.4 μm), GFP-β-catenin* (β-cat*, 3492.6 ± 251.5 μm, p < 0.005), treated with K+ (K+, 3122.9 ± 159.5 μm, p < 0.01), treated with K+ and expressing N(intra) [K+ + N(intra), 1754.2 ± 96.5 μm, p < 0.001 compared to GFP, p < 0.001 compared to K+] or expressing N(intra) [N(intra), 1875.1 ± 116.2 μm, p = 0.005]. (B) Graph of TDBTN for GFP (85.8 ± 8.0), β-cat* (108.0 ± 6.6, p < 0.05), K+ (110.5 ± 7.6, p< 0.05), K+ + N(intra) (63.7 ± 5.0, p < 0.05 compared to GFP, p < 0.001 compared to K+), and N(intra) (52.2 ± 4.7, p = 0.005). (C) Graph of total surface area for GFP (7859.6 ± 410.0 μm2), β-cat* (10976.0 ± 870.0μm2, p < 0.005), K+ (9405.9 ± 559.6μm2, p< 0.05), K+ + N(intra) [5191.4 ± 235.6μm2, p < 0.001 compared to GFP, p < 0.001 compared to K+] and N(intra) (6579.9 ± 404.7, p < 0.05). (D) Representative images of neurons filled with Alexa 568 hydrazide from GFP, β-cat*, K+, K+ + N(intra), and N(intra) groups. (E) Plot of TDBL vs TDBTN for neurons expressing GFP, linear regression represented by dotted line, n = 26, r2 = 0.52, p < 0.001. (F) Plot of TDBL vs total surface area for neurons expressing GFP, linear regression represented by dotted line, n = 26, r2 = 0.72, p < 0.001. (G) Plot of TDBL vs TDBTN for all neurons analyzed, linear regression represented by dotted line, n = 101, r2 = 0.63, p < 0.0001. (H) Plot of TDBL vs total surface area for all neurons analyzed, linear regression represented by dotted line, n = 101, r2 = 0.88, p < 0.001. *p < 0.05, **p < 0.01, ***p < 0.001; error bars represent SEM.
Effects of manipulations of the cadherin/catenin complex on mEPSC amplitude
Having confirmed that molecular manipulations of the cadherin/catenin complex can either mimic (β-catenin*) or block [N(intra)] the effects of increased neural activity on dendritic arborization, we measured the basal synaptic properties of these neurons, recording mEPSCs using whole cell patch clamp recordings. The effects of molecularly manipulating the cadherin/catenin complex on the amplitude of mEPSCs were essentially inversely correlated with their effects on dendritic morphology. Specifically, over-expression of β-catenin decreased mEPSC amplitude (β-cat*, 12.60 ± 0.99 pA, n = 18, p < 0.05 compared to GFP alone, 16.09 ± 1.09 pA, n = 27) (Figure 2A, B), without significantly affecting mEPSC frequency (Supplemental Figure 1). This effect was similar to that of mimicking increased neural activity by chronic depolarization with high K+ (K+, 11.41 ± 0.82 pA, n = 22, p < 0.005) (Leslie et al., 2001). An important procedural difference between our experiments using high K+ treatment and previous reports on the effects of chronic depolarization on mEPSCs (Leslie et al., 2001) is that the extracellular K+ concentration was elevated only from 7 to 9 days in vitro and recordings were made 3 days later. Thus, the effects of mimicking increased neural activity on promoting dendritic growth and reducing mEPSC amplitudes were long lasting. Importantly, the effect of chronic depolarization with high K+ on mEPSC amplitude was completely reversed by expression of N(intra) in the recorded postsynaptic neuron, under conditions of low transfection effeciency [K+ + N(intra), 17.51 ± 1.46pA, n = 25, p = 0.43 vs GFP, p = 0.001 vs K+] (Figure 2B). Expression of N(intra) alone did not affect mEPSC amplitude (17.11 ± 1.33 pA, n = 15, p = 0.56), indicating that the ability of N(intra) to prevent the decrease in mEPSC amplitude normally caused by high K+ treatment was not because its expression alone increased mEPSC amplitude.
Figure 2. Expression of β-catenin* reduces mEPSC amplitude while expression of N(intra) reverses the effects of K+.
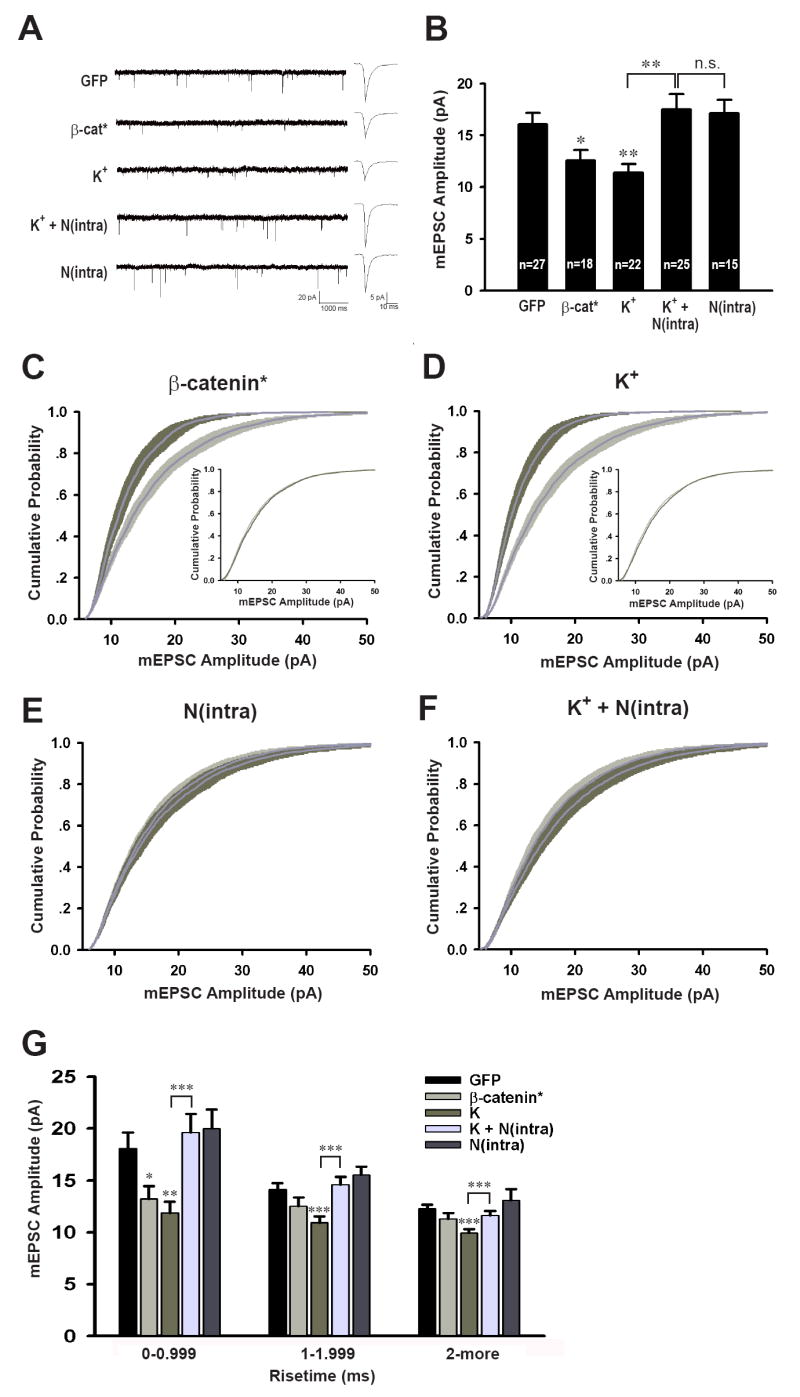
(A) Representative mEPSC recordings and averaged mEPSC waveforms for each condition. The scale bars are 20 pA and 1000 ms for the sweeps, and 5 pA and 10 ms for the averaged traces. (B) Average mEPSC amplitudes from neurons transfected or treated with GFP (16.09 ± 1.09 pA), β-cat* (12.60 ± 0.99 pA, p < 0.05), K+ (11.41 ± 0.82 pA, p < 0.005), K+ + N(intra) [17.51 ± 1.46 pA, p = 0.43 vs GFP, p = 0.001 vs K+, p = 0.85 vs N(intra)], and N(intra) (17.11 ± 1.33 pA, p = 0.56). (C – F) Cumulative distributions of mEPSC amplitudes, each manipulation (dark gray) plotted against GFP (light gray). (C) β-cat* vs GFP, p < 0.005; inset, scaled β-cat* mEPSC distribution transformed according to best fit: β-cat* = control × 0.5954 + 2.915, r2 = 0.9995, p = 1.0. (D) K+ vs GFP, p < 0.0001; inset, scaled K+ mEPSC distribution transformed according to best fit: K+ = control × 0.5407 + 2.912, r2 = 0.9986, p = 1.0. (E) N(intra) vs GFP, p = 1.00. (F) K+ + N(intra) vs GFP, p = 0.85. (G) mEPSC amplitudes grouped according to risetime. For those with risetime < 1ms, the amplitudes are GFP (18.09 ± 1.54 pA), β-cat* (13.22 ± 1.24 pA, p < 0.05), K+ (11.88 ± 1.05 pA, p < 0.005), K+ +N(intra) (19.62 ± 1.78 pA, p = 0.52 vs GFP, p < 0.001 vs K+), N(intra) (20.03 ± 1.84 pA, p = 0.44). *p < 0.05, **p < 0.01, ***p < 0.001; error bars represent SEM.
These results suggest that in response to the growth of dendritic arbors, mechanisms are activated that limit the strength of individual synapses. To address whether the changes in mean mESPC amplitude as dendritic arbor length increases represent a form of synaptic scaling (Turrigiano et al., 1998; Turrigiano and Nelson, 2004), we constructed cumulative probability graphs of mEPSC amplitudes. As predicted by the changes in mEPSC amplitudes, the graphs from neurons over-expressing β-catenin (Figure 2C, p < 0.005) or depolarized with high K+ (Figure 2D, p < 0.0001) are shifted to the left compared to data from cells expressing GFP alone. Multiplying each point in the experimental graphs by a fixed “scaling” factor (Turrigiano et al., 1998) (0.5954 for β-catenin* and 0.5407 for high K+; see methods for details) shifts the graphs back to the right such that they are essentially super-imposable on the control graphs (Figure 2C, D, insets, p = 1.0 and 1.0 respectively). In contrast, the cumulative probability graphs from neurons expressing N(intra) (Figure 2E, p = 1.00) or neurons expressing N(intra) and treated with high K+ [K+ + N(intra), Figure 2F, p = 0.85 vs GFP] were not significantly different than the control graphs. Thus, these experimental manipulations of TDBL did in fact elicit a form of synaptic scaling. None of these manipulations significantly affected the cellular input resistance, the soma surface area or the diameter of primary dendrites (Supplemental Figure 2), variables that might influence our measurements. The effects of the cadherin/catenin complex are specific to mEPSCs as expression of β-catenin* or N(intra) does not affect mIPSC amplitude or frequency (Supplemental Figure 3).
A potential caveat to the interpretation of our results is that the whole cell patch clamp recordings were made from the soma, and thus dendritic filtering of the recorded mEPSCs may have occurred. Assuming the dendrites have passive cable properties, mEPSCs generated from distal synapses would be more extensively filtered than those generated from proximal synapses. Since we observed a decrease in mEPSC amplitude in neurons with larger dendritic arbors, we wanted to minimize the possibility that this result was due to a higher proportion of synapses on the larger neurons being located more distal from the soma compared to control cells with smaller dendritic arbors. To examine this possibility, we grouped the mEPSCs analyzed in Figures 2C-F by risetime. This analysis revealed that the population of mEPSCs with the fastest risetimes (risetime < 1ms) exhibited the same changes in mEPSC amplitude as observed for the total population of mEPSCs (Figure 2G). Specifically, neurons transfected with β-catenin* (Figure 2G, 13.22 ±1.24 pA, p < 0.05 vs GFP) or treated with high K+ (11.88 ± 1.05 pA, p < 0.005 vs GFP) have smaller mEPSC amplitudes compared to GFP controls (18.09 ± 1.54 pA) and the effects of K+ are completely rescued by expression of N(intra) in the postsynaptic neurons [K+ + N(intra), 19.62 ± 1.78 pA, p = 0.52 vs GFP, p < 0.001 vs K+]. Since mEPSCs with fast risetimes most likely arise from synapses close to the soma (Stuart et al., 1999; Williams and Mitchell, 2008) and thus are much less susceptible to space clamping artifacts, these results demonstrate that the effects of β-catenin* expression and K+ treatment on mEPSC amplitudes likely reflect real changes in quantal amplitudes and are unlikely to be due to spatial re-distribution of synapses on cells with larger dendritic arbors.
An inverse correlation between mEPSC amplitude and TDBL
Having shown that β-catenin over-expression and mimicking increased neural activity both promote dendritic arborization and reduce mEPSC amplitudes, we predicted that an inverse correlation exists between these parameters. Indeed, we observe a statistically significant inverse linear correlation between the parameters of TDBL and mEPSC amplitude, both for the GFP control group alone (Figure 3A, n = 26, r2 = 0.18, p < 0.05) and for neurons from all experimental conditions combined (Figure 3B, n = 101, r2 = 0.13, p < 0.001). Dividing neurons according to TDBL yielded four groups with descending average mEPSC amplitudes (Figure 3C), further demonstrating the inverse relationship between TDBL and mEPSC amplitude.
Figure 3. An inverse correlation between TDBL and mEPSC amplitude.

(A) Plot of TDBL vs mEPSC amplitude for neurons expressing GFP, linear regression represented by dotted line, n = 26, r2 = 0.18, p < 0.05. (B) Plot of TDBL vs mEPSC amplitude for neurons from all experimental conditions, linear regression represented by dotted line, n = 101, r2 = 0.13, p < 0.001. (C) Bar graphs of average mEPSC amplitudes from all data presented in (B), grouped according to TBDL, (0 - 1499 μm) 18.66 ± 2.12 pA, (1500 – 2499 μm) 15.67 ± 0.93 pA, (2500 - 3499 μm) 14.07 ± 0.99 pA, (3500-5500 μm) 11.33 ± 0.68 pA. Compared to the (0 – 1499 μm) group, p = 0.2, p < 0.05, p = 0.01 for the latter groups; compared to the (1500 - 2499 μm) group, p = 0.27, p = 0.005; compared to the (2500 – 3499 μm) group, p = 0.09. *p<0.05, **p<0.01, error bars represent SEM.
In vivo expression of β-catenin* reduces mEPSC amplitudes and increases dendritic complexity
A critical question for any results obtained using dissociated neuronal cultures is whether the experimental manipulations have the same effects in vivo. To test whether β-catenin over-expression in vivo promotes dendritic growth and reduces mEPSC amplitudes two different approaches were used. First, we electroporated a plasmid expressing β-catenin* together with YFP in utero into the ventricles of mice embryos and recorded spontanenous EPSCs from acute brain slices prepared from post-natal mice. β-catenin* expressing neurons had lower sEPSC amplitudes (6.96 ± 0.41 pA, n = 5, p < 0.05) compared to neighboring controls (13.80 ± 1.83 pA, n = 11; Figure 4A). Furthermore, neurons expression β-catenin* together with YFP had higher TBDL (control, 319.89 ± 15.98 μm, n = 58; β-cat*, 387.59 ± 18.02 μm, n = 61, p = 0.01; Figure 4B) and TDBTN (control, 10.78 ± 0.65, n = 58; β-cat*, 12.93 ± 0.61, n = 61, p < 0.005; Figure 4C) compared to controls expressing YFP alone. These results demonstrate that in vivo expression of β-catenin from late embryonic development has qualitatively the same effects as its expression in dissociated neuronal cultures. To examine whether expression of β-catenin in vivo during postnatal development has effects similar to those when expressed embryonically, we injected Sindbis viruses expressing β-catenin* directly into the hippocampus of juvenile rats (P21-P28) and recorded from infected neurons in acute brain slices prepared 24 hours later. Again, neurons expressing β-catenin* had reduced mEPSC amplitudes (9.60 ± 0.43 pA, n = 9, p <0.01) compared to neighboring control cells (12.33 ± 0.57 pA, n = 7; Figure 4D). Similar to the results obtained from dissociated neuronal cultures, the cumulative probability distributions of mEPSC amplitudes were also significantly different (Figure 4E, p < 0.0005) and could be superimposed when the distribution from the β-catenin* expressing cells was multiplied by a “scaling” factor (0.6461; p = 0.89, Figure 4E, inset).
Figure 4. The effects of acute in vivo β-catenin* expression on mEPSC amplitudes and dendritic morphology in hippocampal slices.

(A) Average sEPSC amplitudes of neurons in utero electroporated with β-catenin* (6.94 ± 0.41 pA, p < 0.05) compared to non-electroporated neighbors (control, 13.80 ± 1.83 pA). (B) TDBL of neurons electroporated with YFP alone (319.89 ± 15.98 μm) or β-catenin* and YFP (387.59 ± 18.02μm, p = 0.01). (C) TDBTN of neurons electroporated with YFP alone (10.78 ± 0.65) or β-catenin* and YFP (12.93 ± 0.61, p < 0.005). (D) Average mEPSC amplitudes of neurons infected with a virus expressing β-catenin* (9.60 ± 0.43 pA, p < 0.01) compared to uninfected neighbors (control, 12.33 ± 0.57pA). (E) Cumulative distributions of mEPSC amplitudes of neurons infected with β-catenin* (dark gray) plotted against uninfected neighbors (light gray), p < 0.005; inset, scaled β-cat* mEPSC distribution transformed according to best fit: β-cat* = control × 0.6461 + 1.7239, r2 = 0.99, p = 0.89. *p < 0.05, **p < 0.01; error bars represent SEM.
Manipulations of the cadherin/catenin complex change AMPA receptor clustering
The amplitudes of mEPSCs most likely reflect the number and state of surface AMPA receptors at individual synapses, although changes in transmitter concentration can influence this parameter (Lisman et al., 2007). Therefore we used immunocytochemistry as an alternative method for assaying the level of synaptic surface AMPA receptors. This standard method also provides an independent test of the electrophysiological results and circumvents any issues related to potential space clamping artifacts. Consistent with the electrophysiological results, expression of β-catenin* reduced the area of both total surface AMPA receptors and surface AMPA receptors at synapses, defined by colocalization with the active zone marker protein Bassoon (Figure 5A, B, β-cat*, 92.97 ± 1.40, n = 56, p < 0.01 compared to GFP alone, 100 ± 2.06, n = 57; Figure 5C, 89.58 ± 1.97, p = 0.001; Supplemental Figure 4A). Consistent with previous work (O’Brien et al., 1998), treating cultures with high K+ to mimic a chronic increase in activity also decreased total surface (Figure 5B, K+, 90.12 ± 2.15, n = 59, p = 0.001) and synaptic surface AMPA receptors (Figure 5C, 87.01 ± 3.97, p = 0.001). These decreases were reversed by expression of N(intra) [Figure 5B, K+ + N(intra), 96.74 ± 2.01, n = 57, p = 0.26 vs GFP, p < 0.05 vs K+; Figure 5C, 96.31 ± 2.54, p = 0.30 vs GFP, p < 0.05 vs K+), while expression of N(intra) alone had no effect (Figures 5B, C). No changes were detected in the average puncta intensity or percentage of surface synaptic AMPA receptors (Supplemental Figure 4B - D), further confirming the observed changes in AMPA receptor cluster size represent bona fide changes in surface AMPA receptor levels.
Figure 5. Expression of β-catenin* reduces surface AMPA receptor puncta size and density while expression of N(intra) reverses the effects of K+.
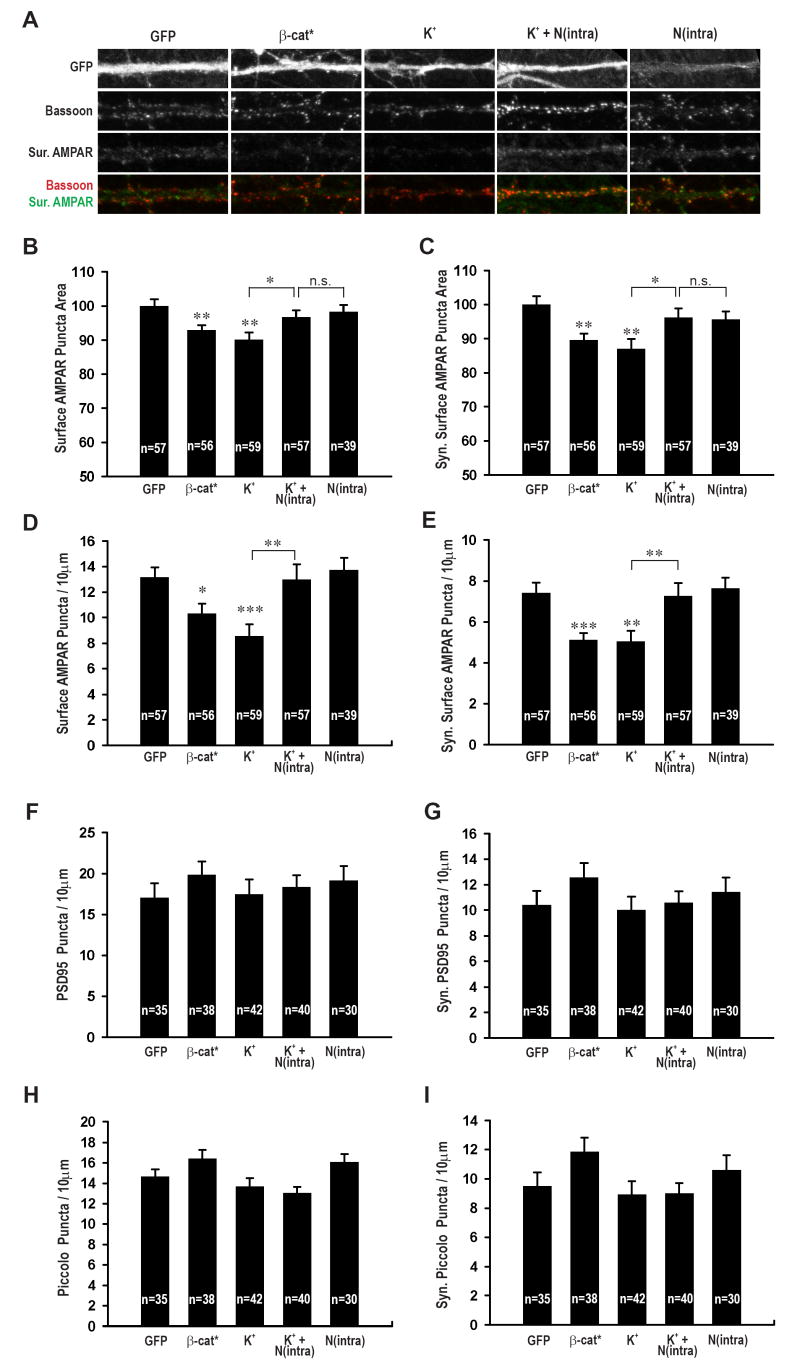
(A) Representative images of neurons transfected or treated with β-cat*, K+, K+ + N(intra) or N(intra). GFP, surface AMPA receptors, bassoon channels shown individually and the colocalization of bassoon (red) and surface AMPA receptors (green) shown as merge. (B) Normalized surface AMPA receptor puncta area for GFP (100 ± 2.06 arbitrary units), β-cat* (92.97 ± 1.40, p < 0.01), K+ (90.12 ± 2.15, p = 0.001), K+ + N(intra) (96.74 ± 2.01, p = 0.26 vs GFP, p < 0.05 vs K+) and N(intra) (98.26 ± 2.06, p = 0.56). (C) Normalized synaptic surface AMPA receptor puncta area for GFP (100 ± 2.45), β-cat* (89.58 ± 1.97, p = 0.001), K+ (87.01 ± 3.97, p = 0.001), K+ + N(intra) (96.31 ± 2.54, p = 0.30 vs GFP, p < 0.05 vs K), N(intra) (95.67 ± 2.31, p = 0.22). (D) Average number of total surface AMPA receptor puncta per 10 μm of dendrite for GFP alone (13.15± 0.80), β-cat* (10.33 ± 0.77, p = 0.01), K+ (8.56 ± 0.91, p < 0.0005), K+ + N(intra) (12.98 ± 1.19, p = 0.91 vs GFP, p < 0.005 vs K+), N(intra) (13.71 ± 0.97, p = 0.66). (E) Average number of synaptic surface AMPA receptor puncta per 10 μm of dendrite for GFP alone (7.42 ± 0.50), β-cat* (5.10 ± 0.34, P < 0.0005), K+ (5.03 ± 0.53, p = 0.001), K+ + N(intra) (7.27 ± 0.63, p = 0.86 vs GFP, p < 0.01 vs K+), N(intra) (7.63 ± 0.53, p = 0.77). (F) Average number of PSD 95 puncta per 10 μm of dendrite for GFP (17.07 ± 1.71), β-cat* (19.86 ± 1.64, p = 0.24), K+ (17.49 ± 1.76, p = 0.87), K+ + N(intra) (18.39 ± 1.38, p = 0.55), N(intra) (19.10 ± 1.83, p = 0.42). (G) Average number of synaptic PSD 95 puncta colocalizing with active zone marker Piccolo per 10 μm of dendrite for GFP (10.40 ± 1.11), β-cat* (12.59 ± 1.10, p =0.17), K+ (10.02 ± 1.04, p = 0.81), K+ + N(intra) (10.59 ± 0.90, p =0.89), N(intra) (11.44 ± 1.13, p = 0.52). (H) Average number of Piccolo puncta per 10 μm of dendrite for GFP (14.64 ± 0.71), β-cat* (16.39 ± 0.87, p = 0.13), K+ (13.67 ± 0.80, p = 0.38), K+ + N(intra) (13.05 ± 0.59, p = 0.09), N(intra) (16.06 ± 0.80, p = 0.19). (I) Average number of synaptic Piccolo puncta (colocalizing with PSD 95) per 10 μm of dendrite for GFP (9.50 ± 0.96), β-cat* (11.86 ± 0.98, p = 0.09), K+ (8.93 ± 0.91, p = 0.67), K+ + N(intra) (8.99 ± 0.72, p = 0.67), N(intra) (10.62 ± 0.99, p = 0.42). *p < 0.05, **p < 0.01, ***p < 0.001; error bars represent SEM.
Over-expression of β-catenin reduces surface AMPA receptor density
Although the effects of β-catenin* expression or depolarization on surface AMPA receptor puncta size were statistically significant, they were small relative to the effects of these manipulations on mEPSC amplitudes. We therefore hypothesized that in addition to reducing the size of surface AMPA receptor clusters, these manipulations may bring a proportion of AMPA receptor clusters below immunocytochemical detection threshold. This would be reflected as a decrease in the number of total and synaptic surface AMPA receptor clusters per unit length of dendrite. Consistent with this prediction, neurons expressing β-catenin* or treated with K+ exhibited a clear decrease in surface AMPA receptor density (Figure 5D, β-cat*, 10.33 ± 0.77, p = 0.01, K+, 8.56 ± 0.91, p < 0.0005 vs GFP, 13.15 ± 0.80; Figure 5E, β-cat*, 5.10 ± 0.34, p < 0.0005, K+, 5.03 ± 0.53, p = 0.001 vs GFP, 7.42 ± 0.50). Again, expression of N(intra) reversed the effects of K+ on both total and synaptic surface AMPA receptor puncta density (Figure 5D, K+ + N(intra), 12.98 ± 1.19, p = 0.91 vs GFP, p < 0.005 vs K+; Figure 5E, 7.27 ± 0.63, p = 0.86 vs GFP, p < 0.01 vs K+) while N(intra) expression alone had no detectable effects (Figure 5D, E). Together, the decrease in the puncta size of the average surface AMPA receptor cluster (Figures 5B, C), combined with the decrease in receptor density (Figures 5D, E), results in a significant reduction in surface AMPA receptor levels per unit length of dendrite, in neurons expressing β-catenin* or treated with K+.
Manipulations of the cadherin/catenin complex do not affect PSD95 density
A body of work suggests important roles for the cadherin/catenin complex in synapse development (Dalva et al., 2007; Salinas and Price, 2005). Yet, we have observed that β-catenin over-expression reduces mEPSC amplitudes and frequency (Figure 2, Supplemental Figure 1; see discussion) as well as surface AMPA receptor puncta size and density (Figure 5A-E). These results raise the question of how β-catenin over-expression affects synapse density. To address this issue, we identified synapses by co-labeling for the postsynaptic density protein PSD95 and the presynaptic active zone protein Piccolo, two structural synaptic marker proteins (McAllister, 2007; Waites et al., 2005). Neither β-catenin over-expression nor any of the other manipulations affected the density of total or synaptic PSD95 and Piccolo puncta (Figure 5F-I), nor did they affect the percentage of PSD95 and Piccolo puncta (data not shown) that were synaptic, as defined by co-localization with respect to each other. These results demonstrate that although β-catenin over-expression decreased mEPSC amplitude and surface AMPA receptor cluster size and density, it does not affect the density of morphological synapses. Furthermore, these results suggest that as dendritic arbors grow, the density of morphological synapses, as defined by co-localization of active zone and postsynaptic density proteins, is kept roughly constant.
β-catenin expression increases NMDAR/AMPAR ratio
The decrease in AMPA receptor puncta density with no change in synapse density (as defined by PSD-95 and Piccolo staining) in cells expressing β-catenin* or following high K+ treatment are consistent with the hypothesis that these manipulations increase the proportion of silent synapses (Durand et al., 1996; Isaac et al., 1995; Kullmann, 1994; Liao et al., 1995; Malenka and Nicoll, 1997), that is, synapse containing NMDA receptors but lacking detectable AMPA receptors. We tested this possibility electrophysiologically by measuring NMDA and AMPA receptor-mediated EPSCs at holding potentials of +40 mV and -70 mV, respectively, in response to local extracellular stimulation via a bipolar electrode (Maximov et al., 2007). Consistent with this prediction, neurons expressing β-catenin* had larger NMDA receptor-mediated EPSCs (71.30 ± 9.88 pA, n = 33, p = 0.01) (Figure 6A, B) compared to controls (41.83 ± 6.51 pA, n = 33) and larger NMDAR/AMPAR ratios (β-cat* 0.32 ± 0.04, p = 0.005 compared to GFP 0.19 ± 0.02; Figure 6D). The effects of high K+ treatment on NMDA receptor-mediated EPSCs (56.75 ± 8.61 pA, p = 0.21; Figure 6A, B) and NMDAR/AMPAR ratios (0.27 ± 0.03, p < 0.05, Figure 6D) were slightly smaller compared to β-catenin* expression, but follow the same trend. No statistically significant differences were detected in the AMPA receptor-mediated responses with any of the conditions (GFP, 342.68 ± 62.19 pA; K+, 282.43 ± 54.20 pA, p = 0.14; β-cat*, 262.56 ± 42.01 pA, p = 0.47; Figure 6C), likely because the smaller average responses at individual synapses are compensated by the increase in total synapse number through increased TDBL, resulting in no net change in the total cellular AMPA receptor-mediated response. The increase in NMDAR/AMPAR ratio was also detected following in vivo injections of Sindbis viruses expressing β-catenin* (0.49 ± 0.07, n = 8, p < 0.05 vs uninfected controls, 0.30 ± 0.06, n = 11).
Figure 6. β-catenin* expression and high K+treatment increase NMDAR/AMPAR ratio.

(A) Example traces of average AMPAR EPSCs (-70mV) and NMDAR + AMPAR EPSCs (+40 mV) from neurons transfected or treated with GFP, high K+ or β-catenin*. Measurements for each type of current are taken at times as indicated and described in the methods section, scale bars are 100 pA and 20 msec. (B) Average NMDAR EPSC amplitudes for GFP (41.83 ± 6.51 pA), high K+ (56.75 ± 8.61 pA, p = 0.21), β-cat* (71.30 ± 9.88 pA, p = 0.01). (C) Average AMPAR EPSC amplitudes for GFP (342.68 ± 62.19 pA), high K+ (282.43 ± 54.20 pA, p = 0.14), β-cat* (262.56 ± 42.01 pA, p = 0.47). (D) Average NMDAR/AMPAR ratio for GFP (0.19 ± 0.02), high K+ (0.27 ± 0.03, p < 0.05), β-cat* (0.32 ± 0.04, p = 0.005). *p<0.05, **p<0.01; error bars represent SEM.
TTX treatment still increases mEPSC amplitude in neurons with larger TDBL
Thus far, we have shown that β-catenin* expression or high K+ treatment increases TDBL (Figure 1) and concurrently limits unitary synaptic AMPA receptor levels (Figures 2, 5). Several lines of evidence suggest that the scaling up of mEPSC amplitudes in response to chronic activity blockade (Goddard et al., 2007; Ibata et al., 2008; Rutherford et al., 1997; Shepherd et al., 2006; Stellwagen and Malenka, 2006; Thiagarajan et al., 2002) is mechanistically distinct from the scaling down of mEPSC amplitudes due to chronic increases in activity (Seeburg et al., 2008; Seeburg and Sheng, 2008). To test whether β-catenin* expression or high K+ treatment influences the uniform scaling up of synaptic strengths due to activity blockade, we performed these manipulations in cultures that were also treated with TTX (1 μM) for 48 hours prior to recordings. While TTX treatment does not alter the effects of β-catenin* expression on promoting dendritic growth (β-cat* + TTX, 2728.74 ± 195.81 μm, n = 18, p < 0.01 compared to GFP alone 2054.64 ± 133.21 μm, p = 0.55 vs β-cat* 2580.87 ± 141.98 μm; Figure 7A, B), it significantly increases mEPSC amplitudes in neurons expressing β-catenin* (14.79 ± 0.79 pA, n = 26), or treated with high K+ (14.41 ± 0.60 pA, n = 17) to the same level as cells treated with TTX alone (14.63 ± 0.60 pA, n = 26, p = 0.01 vs GFP, p = 0.79 vs TTX + K+, p = 1.00 vs TTX + β-cat*) and significantly higher than control, untreated cells (12.64 ± 0.47 pA, n = 26; Figure 7C, D; p<0.05 for all TTX conditions versus control). These results, also observed in cumulative probability plots of mEPSC amplitudes (Figure 7E-G; GFP vs TTX, p < 0.01; GFP vs TTX + K+, p = 0.01; GFP vs TTX + β-cat*, p < 0.005), demonstrate that neurons with larger dendritic arbors can still respond to subsequent activity blockade by scaling up their synaptic strength, while retaining their dendritic complexity (Figure 7A, B). These results provide additional evidence that the mechanisms regulating the scaling up and scaling down of synaptic strengths are likely to be distinct, as the scaling down of mEPSC amplitudes by depolarization or β-catenin* expression (Figure 2) does not affect the ability of these neurons to respond to subsequent activity blockade (Figure 7). None of the manipulations affect mEPSC frequency (Supplemental Figure 5).
Figure 7. Treatment with TTX significantly increases mEPSC amplitudes in neurons transfected with β-catenin* without affecting their dendritic morphology.

(A) Representative images of neurons transfected with GFP alone, with GFP + β-cat* and with GFP +β-cat* and treated with TTX. (B) Graph showing TDBL in neurons transfected with GFP (2054.64 ± 133.21 μm), β-cat* (2580.87 ± 141.98 μm, p = 0.01), β-cat* + TTX (2728.74 ± 195.81 μm, p < 0.01 vs GFP, p = 0.55 vs β-cat*). (C) Representative mEPSC recordings and average mEPSC waveforms for each condition; the scale bars are 20 pA and 500 msec and 5 pA and 10 ms respectively. (D) Average mEPSC amplitudes from neurons transfected or treated with GFP (12.64 ± 0.47 pA), TTX (14.63 ± 0.60 pA, p = 0.01), TTX + K+ (14.41 ± 0.60 pA, p < 0.05 vs GFP, p = 0.79 vs TTX), or TTX + β-cat* (14.79 ± 0.79 pA, p < 0.05 vs GFP, p = 0.88 vs TTX). (E – G) Cumulative distributions of mEPSC amplitudes, each manipulation (dark gray) plotted against GFP (light gray). (C) TTX vs GFP, p < 0.01. (D) TTX + K+ vs GFP, p = 0.01. (E) TTX + β-cat* vs GFP, p <0.005. *p < 0.05, **p<0.001, error bars represent SEM.
Discussion
Previous studies have independently investigated the effects of increasing neural activity on dendritic arborization and on synaptic scaling (Leslie et al., 2001; O’Brien et al., 1998; Redmond et al., 2002; Seeburg et al., 2008; Sin et al., 2002; Turrigiano, 2007). However, the possibility that these changes are coordinated and that activity-dependent increases in TDBL are necessary and sufficient for mediating synaptic scaling has not been addressed. Here, by measuring TDBL and mEPSC amplitudes from the same neurons, we show that: i) neurons with increased TDBL induced by high K+ treatment or over-expressing β-catenin have reduced mEPSC amplitudes, as well as decreased surface synaptic AMPA receptor puncta area and density; ii) the effects of mimicking increased neural activity with high K+ on mEPSC amplitudes and surface AMPA receptor area and density can be prevented by decreasing TDBL in individual postsynaptic neurons through expression of N(intra); iii) there is an inverse linear correlation between TBDL and mEPSC amplitudes; iv) neurons with increased TDBL due to over-expressing β-catenin or high K+ treatment have higher NMDAR/AMPAR ratios, indicative of more silent synapses; vi) the effects of β-catenin over-expression on TDBL, mEPSC amplitudes and NMDAR/AMPAR ratios were also observed in vivo suggesting that similar mechanisms to those elucidated here in cultured neurons apply during normal development. These coordinated changes in dendritic morphology and unitary excitatory synaptic strength may serve as an important intrinsic mechanism that helps prevent neurons from over-excitation during neural circuit development.
Several experiments were performed to dissociate the effects of activity-dependent increases in dendritic arborization from other potential effects of activity to demonstrate that changes in TDBL are necessary and sufficient for the scaling down of synaptic strength. First, expression of β-catenin* results in correlated increases in TDBL and reduced mEPSC amplitudes, without affecting the spontaneous firing rate or the resting membrane potential of neurons (Supplemental Figure 6), while increasing neural activity does significantly reduce firing rate (Turrigiano et al., 1998) (and Supplemental Figure 6). Consistent with the lack of effect of β-catenin on basic electrophysiological properties, it is not known to directly associate with voltage-dependent channels. Second and most importantly, the effects of depolarizing the entire culture dish with high K+ are reversed by expression of N(intra), a molecule that reduces TDBL in individual postsynaptic neurons (Figure 2). Finally, we show that TDBL is inversely correlated with mEPSC amplitude for all neurons analyzed, including those treated with high K+ and transfected with N(intra) (Figure 3). Thus, by specifically blocking the effects of neural activity on dendritic morphology, we show that increases in TDBL are required for mediating the effects of high K+ on the scaling down of mEPSC amplitudes.
In reporting a reduction in mEPSC amplitudes in neurons with larger dendritic arbors, we performed a combination of additional experiments and analyses to rule out potential artifacts due to space clamping problems associated with whole cell recordings. First, we show that none of our manipulations significantly affect cellular input resistance, somatic surface area or the average diameter of primary dendrites (Supplemental Figure 2) in the set of neurons 3D reconstructed with Neurolucida for dendritic morphology (Figure 1) and analyzed for mEPSC amplitudes (Figure 2). Since our estimation of cellular input resistance (see methods) likely reflects primarily the input resistance of the soma and proximal dendrites (Williams and Mitchell, 2008), the lack of observed change does not preclude a change in the electrotonic structure of neurons with increased TDBL, which could in turn affect the mEPSC amplitudes measured at the soma. Therefore, we selectively analyzed mEPSCs with the fastest risetimes (< 1ms), an analysis that selects events mostly from synapses on proximal dendrites, which are less susceptible to space clamping problems (Williams and Mitchell, 2008). The same changes in mEPSC amplitudes occurred in all experimental groups with this more selective analysis (Figure 2G). Additionally, we stained for surface synaptic AMPA receptors (Figure 5), an assay which is not susceptible to the problems of space clamping, and confirmed our results. Finally, we show that neurons expressing β-catenin* and treated with TTX maintain their larger dendritic arbors, and yet have significantly higher mEPSC amplitudes compared to controls (Figure 7), demonstrating that our electrophysiological recordings do detect larger mEPSCs when they are present.
Our results showing a normal scaling up of synaptic strengths in response to TTX treatment in cells with enhanced dendritic arbors following high K+ treatment or β-catenin over-expression (Figure 7) are consistent with the growing evidence that the scaling up of synaptic strengths due to activity blockade (Goddard et al., 2007; Ibata et al., 2008; Rutherford et al., 1997; Shepherd et al., 2006; Stellwagen and Malenka, 2006; Thiagarajan et al., 2002) involves different mechanisms than the scaling down due to increased activity (Seeburg et al., 2008; Seeburg and Sheng, 2008). The coordinated changes in dendritic growth and synaptic scaling are likely to be most relevant during development at times when there are concurrent increases in overall activity as neural circuits mature. During this process, mechanisms, such as the one we describe here, may be present to prevent neurons from over-excitation. During later stages of development or during epileptiform activity, other mechanisms for synaptic scaling, such as induced expression of Polo-like kinase 2, which depletes PSD95 and Bassoon clusters and causes loss of mature spines (Pak and Sheng, 2003) could be the predominant mechanism (Seeburg et al., 2008; Seeburg and Sheng, 2008).
Since changes in TBDL were mediated through molecular manipulations of the cadherin/catenin complex, it is important to attempt to distinguish the effects of changes in dendritic morphology from the direct effects of the cadherin/catenin complex on synaptic transmission. Cadherin and catenins are transynaptic cell adhesion molecules present at or adjacent to synaptic sites from the early steps of synaptogenesis (Benson and Tanaka, 1998; Togashi et al., 2002). Intracellularly, through α and β-catenin, they are linked to the actin cytoskeleton (Gumbiner, 1996). Loss-of-function mutations of N-cadherin, αN-or β-catenin lead to changes in spine shape, reduced mEPSC amplitudes or defects in short-term plasticity (Abe et al., 2004; Bamji et al., 2003; Jungling et al., 2006; Okuda et al., 2007; Togashi et al., 2002). These observations, together with the reported direct interaction between N-cadherin and GluR2 (Saglietti et al., 2007) and effects of activity on N-cadherin endocytosis or β-catenin phosphorylation (Murase et al., 2002; Tai et al., 2007), all suggest a role for the cadherin/catenin complex in promoting synapse growth, an effect opposite to that of the synaptic scaling reported in this study. Furthermore, β-catenin over-expression does not affect basic properties of neurons, including the resting membrane potential and the spontaneous firing rate (Supplemental Figure 6), parameters which reflect the intrinsic excitability of neurons. Thus, our results are best explained by the effects of the molecular and activity manipulations on TDBL and the inverse relationship that exists between TDBL and mEPSC amplitude. However, we cannot exclude the possibility that the cadherin/catenin complex could itself mediate effects of neural activity on synaptic scaling through unidentified mechanisms.
The manipulations we performed had no detectable effect on the density of morphological synapses as defined by the colocalization of active zone and postsynaptic density proteins (Figure 5F-I). Since neurons treated with high K+ or transfected with β-catenin* have more TDBL, they would consequentially have more total morphological synapses, consistent with the proposed role of the cadherin/catenin complex in synapse development (Dalva et al., 2007; Salinas and Price, 2005). However, some of these synapses are functionally silent in that they did not contain detectable AMPA receptors, as shown by the observed decrease in the density of total surface and synaptic surface AMPA receptors (Figure 5D, E) in neurons with increased TDBL (high K+ treatment or β-catenin* expression). This effect is mirrored electrophysiologically by strong trends towards reduced mEPSC frequencies (Supplemental Figure 1), despite the increase in the total number of morphological synapses brought on by increased TDBL. Consistent with these results, we observed an increase in the NMDAR/AMPAR ratio and in evoked NMDA receptor-mediated EPSC in neurons expressing β-catenin* or treated with K+ (Figure 6). Furthermore, these weaker synapses can be activated in response to subsequent changes in the environment, such as activity blockade (Figure 7), without affecting the dendritic arbor itself.
Previous work in a number of different model systems provides additional examples of inverse changes in electrophysiological or morphological parameters during neural circuit development. For example, during rodent visual cortical development, layer 4 neurons show inverse and correlated changes in mEPSC amplitude and frequency, an activity-dependent event blocked by dark rearing (Desai et al., 2002). Similarly, during Xenopus retinotectal circuit development, neurons adapt their intrinsic excitability to achieve a stable relationship between the total level of synaptic input and tectal neuronal spike output (Pratt and Aizenman, 2007). Morphologically, dark rearing of rodents results in changes in dendritic spine density and shape in layer 3 pyramidal neurons of the visual cortex, while conserving total synaptic area per unit length of dendrite (Wallace and Bear, 2004). Our results complement and add to these mechanisms by showing that TDBL and unitary excitatory synaptic function, as measured by mEPSC amplitudes, are inversely correlated. During the later stages of neural circuit formation as dendritic arbors grow and become more complex, if the number of excitatory post-synaptic AMPA receptors continually scale with the increased total surface area, neurons may become at risk for over-excitation and excitotoxicity. Instead, our results suggest that a mechanism has developed, where the total level of surface AMPA receptors remains constant, despite the increase in the total number of synapses per neuron. These additional synapses are then in a position to respond rapidly to future changes in their extracellular environment, by insertion of AMPA receptors into existing synapses. These changes could be global, as shown by our TTX treatments (Figure 7) or specifically occur in a subset of synapses in response to local stimuli. Combining the growth of the dendritic arbor with a correlated reduction in unitary excitatory synaptic strength, while maintaining the potential for future increases in synaptic strength, provides an elegant mechanism that is likely to play important roles during the activity-dependent growth and development of neural circuits.
Methods
Hippocampal neuronal culture preparation
High density mixed neuronal-glial cultures were prepared from postnatal day 0 (P0) Sprague-Dawley rat pups as previously described (Yu and Malenka, 2003) and according to procedures approved by the IACUC of Stanford University and the Institute of Neuroscience. Briefly, neurons were plated on matrigel coated glass coverslips (Assistant) at 50,000 neurons per cm2 in medium consisting of Neurobasal medium (Invitrogen), B-27 (Invitrogen) and 2 mM Glutamax-I (Invitrogen). On the third day in vitro (DIV 3), when astrocytes have proliferated sufficiently to form a monolayer over the entire coverslip, cells were treated with the mitotic inhibitor FUDR (5-fluoro-2’-deoxyuridine, Sigma). Calcium phosphate transfections were carried out at DIV 7 using 2 - 3 μg DNA per 24-well. The low transfection efficiency of this method ensures that the recorded neuron is surrounded by untransfected presynaptic contacts. In all experiments 0.5 - 2 μg of DNA encoding GFP was included in the transfection mixture to clearly visualize morphology of the recorded or imaged neuron. For high K+ treatment, 16 mM KCl was added at DIV 7 and washed out 48 hrs later with conditioned medium. For experiments in Figure 7, TTX (1 μM) was added 48 hours prior to recordings. All electrophysiological and immunocytochemical experiments were carried out at DIV 12.
DNA constructs
DNA constructs are as previously described (Yu and Malenka, 2003). Briefly, β-catenin* contains full-length β-catenin fused to GFP and with four serine/threonine (S33, S37, T41, S45) to alanine substitutions that prevent its phosphorylation by glycogen synthase kinase 3β and subsequent degradation. The main difference between this construct and wildtype β-catenin is that it is more stable and less sensitive to endogenous regulation via ubiquitin-mediated degradation. Thus it is possible to obtain higher levels of over-expression with this construct compared to the wildtype, which is completely degraded 48 hours following over-expression. For in utero electroporation experiments, full-length β-catenin* was subcloned into pCAG-EYFP-CAG (Saito and Nakatsuji, 2001) at the XhoI site. For Sindbis virus infection experiments, β-catenin* was subcloned into pSINRE5-IRES-GFP (Marie et al., 2005). N(intra), previously named Ncad(intra), contains the transmembrane and intracellular domains of Xenopus N-cadherin.
Electrophysiology in cultured neurons
Whole cell patch clamping recordings in dissociated neuronal cultures were carried out at room temperature on DIV 12 neurons with an Axopatch 1D or Multiclamp 700B amplifier (Axon Instruments) using low-resistance pipets (2-5MΩ). The intracellular solutions contained (in mM) 110 CsMeSO4, 40 HEPES, 10 NaCl, 5 MgCl2, 0.4 EGTA, 2 ATP, and 0.2 GTP (pH to 7.25, 295 mOsm). For visualization of dendritic morphology, Alexa 568 hydrazide (Invitrogen) was added to the internal solution at a final concentration of 0.1 mg/ml on the day of recording. For mIPSC recordings, CsMeSO4 was replaced with CsCl. For firing rates measurements, the intercellular solution contained (in mM) 110 Kgluconate, 20 KCl, 5 MgCl2, 20 HEPES, 0.6 EGTA, 2 MgATP, 0.2 Na3GTP (pH to 7.3, 300mOsm). The extracellular solution contained (in mM) 129 NaCl, 5 KCl, 30 Glucose, 25 HEPES, 2 CaCl2, 1 MgCl2 (pH 7.3, 315 mOsm); 0.5 μM tetrodotoxin was added for miniature PSC recordings, 50 μM picrotoxin for EPSC recordings or 5 μM NBQX for IPSC recordings. For mEPSCs, neurons were voltage-clamped at -70 mV, and data was filtered at 1-2 kHz and acquired at 2-5 kHz. Data analysis was performed blind using Synaptosoft software with an amplitude threshold of 5 pA. Cumulative distributions were generated using 200 consecutive mEPSCs from each cell (150 for Figure 7), averaged across all cells, and compared using a Kolmogorov-Smirnov two sample test. For the scaled mEPSC amplitude cumulative distributions, original data for each distribution was individually plotted again its control and a linear regression best fit generated using SigmaPlot (SyStat Software). The β-catenin* or high K+ results were then transformed according to the best fit equation and replotted against controls in the insets. Cellular input and series resistances were monitored by giving a hyperpolarizing pulse (4mV, 100 ms) through the whole cell patch clamp recording electrode every 10 sec. Experiments where either parameter changed by greater than 10% during the course of the recording were excluded from the analyses.
Evoked NMDAR/AMPAR ratios were performed as previously described (Maximov et al., 2007). AMPA receptor and NMDA receptor-mediated EPSCs were recorded at holding potentials of −70mV and +40mV respectively. AMPA receptor-dependent EPSCs were quantified by measuring the amplitude 2 msec after the onset of synaptic responses, while NMDA receptor-dependent EPSC amplitudes were measured 50 ms after EPSC onset.
In utero electroporation
ICR mice embryos (E15.5) were in utero electroporated with pCAG-EYFP-CAG-β-catenin* or pCAG-EYFP-CAG as previously described (Wang et al., 2007) according procedures approved by the IACUC of the Institute of Neuroscience. Five 50-msec pulses of 35–38 volts were delivered to the embryos at 100 msec intervals using the square pulse generator CUY21 (NEPA GENE, Japan). P3-P6 pups expressing YFP or YFP and β-catenin* were perfused for dendritic morphology analysis, as previously described (Wang et al., 2007). Coronal sections of 100 μm were cut on a Leica CM1900 cryostat, imaged and 3D reconstructed as described below. For spontaneous EPSC recordings, acute hippocampal slices were prepared from P4-5 mice and recording were carried out using an internal solution containing (in mM) 100 CsMeSO4, 25.5 CsCl, 10 HEPES, 8 NaCl, 10 glucose, 0.25 EGTA, 2 MgATP4, 0.3 Na3GTP, (pH 7.3, 280-290 mOsm) in ACSF containing (in mM) 125 NaCl, 2.5 KCl, 25 NaHCO3, 20 glucose, 1.3 NaH2PO4, 1.3 Mg Cl2, 2 CaCl2,with 10 μM bicuculline, as previously described (Marie et al., 2005; van Praag et al., 2002). sEPSCs from neurons expressing β-catenin* were compared to unlabelled neighbors.
Sindbis virus infections
Sindbis virus production, in vivo injections, slice electrophysiology and mEPSC recordings were carried out in P21-28 Sprague-Dawley rats as previously described (Marie et al., 2005).
Dendrite Morphology Analysis and Immunocytochemistry
Immunocytochemistry and confocal microscopy were essentially as previously described (Yu and Malenka, 2003). For surface labeling of AMPA receptors, neurons were incubated with the primary antibody in conditioned medium for 20 minutes. Primary antibodies were used at the following concentrations: Bassoon (VAM-PS003, Stressgen, 1:1000), GluR1 (rabbit polyclonal, gift of Dr. R. Huganir, 1:500), Piccolo (rabbit polyclonal, 1:1000, gift of Drs. V. Torres and C. Garner), PSD95 (MA1-045, Affinity Bioreagents, 1:500). For dendritic morphology analysis, images were acquired on a Zeiss LSM 510 laser scanning confocal microscope with a 40x oil immersion Plan-Neofluor objective (N.A. = 1.3) and 3D reconstructed with Neurolucida software (MicroBrightField) or as previously described (Yu and Malenka, 2003). For analysis of synaptic clusters, images were acquired with a 63x oil immersion Plan-Apochromat objective (N.A. = 1.4) using 3x digital zoom and analyzed blind with ImagopPro Plus (MediaCybernetics). Images for each channel were thresholded and clusters of 3-200 continuous pixels above threshold identified as puncta. For each image, a region immediately surrounding a stretch of secondary dendrite was drawn and the length of the dendrite measured. The area and intensity of puncta within the region for each of the two synaptic proteins was measured, with synaptic puncta defined as colocalization between an above-threshold punctum from one synaptic marker (e.g. GluR) having at least one pixel of overlap with an identified punctum of the co-labeling marker protein (e.g. Bassoon). For measurements of puncta area and intensity, all data were normalized to the GFP control of sister cultures processed in the same batch. Synapse density is presented as number of above-threshold puncta per 10 μm of dendrite. “n” represent number of neurons, and at least three independent culture preparations were analyzed for each group of proteins.
Statistical Analysis
Statistical analysis was carried out using SigmaStat (Systat Software), and either two-tailed Student t-tests or Mann-Whitney rank sum tests was performed depending on the normality of the distribution. Linear regressions were performed in SigmaPlot (Systat Software). Results are shown as mean ± SEM, and “n” represents number of neurons.
Supplementary Material
Acknowledgments
We thank Drs. R. Huganir, V. Torres and C. Garner for gifts of antibodies and Drs. J. Miyazaki and T. Saito for gifts of constructs. We thank Drs. Y.Q. Ding and C.L. Wang for help with in utero electroporation. We thank L. Saura, S. Wu, H.L. Song and Z.T. Geng for excellent technical assistance. We are grateful to Drs. M. Hausser, J.L. Du and members of the Malenka laboratory for suggestions and discussions. This work was supported by grants from N.I.M.H. (5 R37 MH063394 to R.C.M.), and from M.O.S.T. (2006CB806600, 2006CB943903), N.S.F.C. (30721004), C.A.S (Hundred Talent Program and KSCX2-YW-R-103) and Shanghai Municipal Government (06PJ14117) to X.Y.
Footnotes
Publisher's Disclaimer: This is a PDF file of an unedited manuscript that has been accepted for publication. As a service to our customers we are providing this early version of the manuscript. The manuscript will undergo copyediting, typesetting, and review of the resulting proof before it is published in its final citable form. Please note that during the production process errors may be discovered which could affect the content, and all legal disclaimers that apply to the journal pertain.
References
- Abe K, Chisaka O, Van Roy F, Takeichi M. Stability of dendritic spines and synaptic contacts is controlled by alpha N-catenin. Nat Neurosci. 2004;7:357–363. doi: 10.1038/nn1212. [DOI] [PubMed] [Google Scholar]
- Bamji SX, Shimazu K, Kimes N, Huelsken J, Birchmeier W, Lu B, Reichardt LF. Role of beta-catenin in synaptic vesicle localization and presynaptic assembly. Neuron. 2003;40:719–731. doi: 10.1016/s0896-6273(03)00718-9. [DOI] [PMC free article] [PubMed] [Google Scholar]
- Benson DL, Tanaka H. N-cadherin redistribution during synaptogenesis in hippocampal neurons. J Neurosci. 1998;18:6892–6904. doi: 10.1523/JNEUROSCI.18-17-06892.1998. [DOI] [PMC free article] [PubMed] [Google Scholar]
- Burrone J, Murthy VN. Synaptic gain control and homeostasis. Curr Opin Neurobiol. 2003;13:560–567. doi: 10.1016/j.conb.2003.09.007. [DOI] [PubMed] [Google Scholar]
- Dalva MB, McClelland AC, Kayser MS. Cell adhesion molecules: signalling functions at the synapse. Nat Rev Neurosci. 2007;8:206–220. doi: 10.1038/nrn2075. [DOI] [PMC free article] [PubMed] [Google Scholar]
- Davis GW. Homeostatic control of neural activity: from phenomenology to molecular design. Annu Rev Neurosci. 2006;29:307–323. doi: 10.1146/annurev.neuro.28.061604.135751. [DOI] [PubMed] [Google Scholar]
- Desai NS, Cudmore RH, Nelson SB, Turrigiano GG. Critical periods for experience-dependent synaptic scaling in visual cortex. Nat Neurosci. 2002;5:783–789. doi: 10.1038/nn878. [DOI] [PubMed] [Google Scholar]
- Durand GM, Kovalchuk Y, Konnerth A. Long-term potentiation and functional synapse induction in developing hippocampus. Nature. 1996;381:71–75. doi: 10.1038/381071a0. [DOI] [PubMed] [Google Scholar]
- Goddard CA, Butts DA, Shatz CJ. Regulation of CNS synapses by neuronal MHC class I. Proc Natl Acad Sci U S A. 2007;104:6828–6833. doi: 10.1073/pnas.0702023104. [DOI] [PMC free article] [PubMed] [Google Scholar]
- Gumbiner BM. Cell adhesion: the molecular basis of tissue architecture and morphogenesis. Cell. 1996;84:345–357. doi: 10.1016/s0092-8674(00)81279-9. [DOI] [PubMed] [Google Scholar]
- Ibata K, Sun Q, Turrigiano GG. Rapid synaptic scaling induced by changes in postsynaptic firing. Neuron. 2008;57:819–826. doi: 10.1016/j.neuron.2008.02.031. [DOI] [PubMed] [Google Scholar]
- Isaac JT, Nicoll RA, Malenka RC. Evidence for silent synapses: implications for the expression of LTP. Neuron. 1995;15:427–434. doi: 10.1016/0896-6273(95)90046-2. [DOI] [PubMed] [Google Scholar]
- Jungling K, Eulenburg V, Moore R, Kemler R, Lessmann V, Gottmann K. N-cadherin transsynaptically regulates short-term plasticity at glutamatergic synapses in embryonic stem cell-derived neurons. J Neurosci. 2006;26:6968–6978. doi: 10.1523/JNEUROSCI.1013-06.2006. [DOI] [PMC free article] [PubMed] [Google Scholar]
- Kullmann DM. Amplitude fluctuations of dual-component EPSCs in hippocampal pyramidal cells: implications for long-term potentiation. Neuron. 1994;12:1111–1120. doi: 10.1016/0896-6273(94)90318-2. [DOI] [PubMed] [Google Scholar]
- Leslie KR, Nelson SB, Turrigiano GG. Postsynaptic depolarization scales quantal amplitude in cortical pyramidal neurons. J Neurosci. 2001;21:RC170. doi: 10.1523/JNEUROSCI.21-19-j0005.2001. [DOI] [PMC free article] [PubMed] [Google Scholar]
- Liao D, Hessler NA, Malinow R. Activation of postsynaptically silent synapses during pairing-induced LTP in CA1 region of hippocampal slice. Nature. 1995;375:400–404. doi: 10.1038/375400a0. [DOI] [PubMed] [Google Scholar]
- Lisman JE, Raghavachari S, Tsien RW. The sequence of events that underlie quantal transmission at central glutamatergic synapses. Nat Rev Neurosci. 2007;8:597–609. doi: 10.1038/nrn2191. [DOI] [PubMed] [Google Scholar]
- Malenka RC, Nicoll RA. Silent synapses speak up. Neuron. 1997;19:473–476. doi: 10.1016/s0896-6273(00)80362-1. [DOI] [PubMed] [Google Scholar]
- Marie H, Morishita W, Yu X, Calakos N, Malenka RC. Generation of silent synapses by acute in vivo expression of CaMKIV and CREB. Neuron. 2005;45:741–752. doi: 10.1016/j.neuron.2005.01.039. [DOI] [PubMed] [Google Scholar]
- Maximov A, Pang ZP, Tervo DG, Sudhof TC. Monitoring synaptic transmission in primary neuronal cultures using local extracellular stimulation. J Neurosci Methods. 2007;161:75–87. doi: 10.1016/j.jneumeth.2006.10.009. [DOI] [PubMed] [Google Scholar]
- McAllister AK. Dynamic aspects of CNS synapse formation. Annu Rev Neurosci. 2007;30:425–450. doi: 10.1146/annurev.neuro.29.051605.112830. [DOI] [PMC free article] [PubMed] [Google Scholar]
- Murase S, Mosser E, Schuman EM. Depolarization drives beta-Catenin into neuronal spines promoting changes in synaptic structure and function. Neuron. 2002;35:91–105. doi: 10.1016/s0896-6273(02)00764-x. [DOI] [PubMed] [Google Scholar]
- O’Brien RJ, Kamboj S, Ehlers MD, Rosen KR, Fischbach GD, Huganir RL. Activity-dependent modulation of synaptic AMPA receptor accumulation. Neuron. 1998;21:1067–1078. doi: 10.1016/s0896-6273(00)80624-8. [DOI] [PubMed] [Google Scholar]
- Okuda T, Yu LM, Cingolani LA, Kemler R, Goda Y. beta-Catenin regulates excitatory postsynaptic strength at hippocampal synapses. Proc Natl Acad Sci U S A. 2007;104:13479–13484. doi: 10.1073/pnas.0702334104. [DOI] [PMC free article] [PubMed] [Google Scholar]
- Pak DT, Sheng M. Targeted protein degradation and synapse remodeling by an inducible protein kinase. Science. 2003;302:1368–1373. doi: 10.1126/science.1082475. [DOI] [PubMed] [Google Scholar]
- Parrish JZ, Emoto K, Kim MD, Jan YN. Mechanisms that regulate establishment, maintenance, and remodeling of dendritic fields. Annu Rev Neurosci. 2007;30:399–423. doi: 10.1146/annurev.neuro.29.051605.112907. [DOI] [PubMed] [Google Scholar]
- Pratt KG, Aizenman CD. Homeostatic regulation of intrinsic excitability and synaptic transmission in a developing visual circuit. J Neurosci. 2007;27:8268–8277. doi: 10.1523/JNEUROSCI.1738-07.2007. [DOI] [PMC free article] [PubMed] [Google Scholar]
- Redmond L, Kashani AH, Ghosh A. Calcium regulation of dendritic growth via CaM kinase IV and CREB-mediated transcription. Neuron. 2002;34:999–1010. doi: 10.1016/s0896-6273(02)00737-7. [DOI] [PubMed] [Google Scholar]
- Rutherford LC, DeWan A, Lauer HM, Turrigiano GG. Brain-derived neurotrophic factor mediates the activity-dependent regulation of inhibition in neocortical cultures. J Neurosci. 1997;17:4527–4535. doi: 10.1523/JNEUROSCI.17-12-04527.1997. [DOI] [PMC free article] [PubMed] [Google Scholar]
- Saglietti L, Dequidt C, Kamieniarz K, Rousset MC, Valnegri P, Thoumine O, Beretta F, Fagni L, Choquet D, Sala C, et al. Extracellular interactions between GluR2 and N-cadherin in spine regulation. Neuron. 2007;54:461–477. doi: 10.1016/j.neuron.2007.04.012. [DOI] [PubMed] [Google Scholar]
- Saito T, Nakatsuji N. Efficient gene transfer into the embryonic mouse brain using in vivo electroporation. Dev Biol. 2001;240:237–246. doi: 10.1006/dbio.2001.0439. [DOI] [PubMed] [Google Scholar]
- Salinas PC, Price SR. Cadherins and catenins in synapse development. Curr Opin Neurobiol. 2005;15:73–80. doi: 10.1016/j.conb.2005.01.001. [DOI] [PubMed] [Google Scholar]
- Seeburg DP, Feliu-Mojer M, Gaiottino J, Pak DT, Sheng M. Critical role of CDK5 and Polo-like kinase 2 in homeostatic synaptic plasticity during elevated activity. Neuron. 2008;58:571–583. doi: 10.1016/j.neuron.2008.03.021. [DOI] [PMC free article] [PubMed] [Google Scholar]
- Seeburg DP, Sheng M. Activity-induced Polo-like kinase 2 is required for homeostatic plasticity of hippocampal neurons during epileptiform activity. J Neurosci. 2008;28:6583–6591. doi: 10.1523/JNEUROSCI.1853-08.2008. [DOI] [PMC free article] [PubMed] [Google Scholar]
- Shepherd JD, Rumbaugh G, Wu J, Chowdhury S, Plath N, Kuhl D, Huganir RL, Worley PF. Arc/Arg3.1 mediates homeostatic synaptic scaling of AMPA receptors. Neuron. 2006;52:475–484. doi: 10.1016/j.neuron.2006.08.034. [DOI] [PMC free article] [PubMed] [Google Scholar]
- Sin WC, Haas K, Ruthazer ES, Cline HT. Dendrite growth increased by visual activity requires NMDA receptor and Rho GTPases. Nature. 2002;419:475–480. doi: 10.1038/nature00987. [DOI] [PubMed] [Google Scholar]
- Stellwagen D, Malenka RC. Synaptic scaling mediated by glial TNF-alpha. Nature. 2006;440:1054–1059. doi: 10.1038/nature04671. [DOI] [PubMed] [Google Scholar]
- Stuart G, Sprouston N, Hausser M. Dendrites. Oxford: Oxford Univ. Press; 1999. [Google Scholar]
- Tai CY, Mysore SP, Chiu C, Schuman EM. Activity-regulated N-cadherin endocytosis. Neuron. 2007;54:771–785. doi: 10.1016/j.neuron.2007.05.013. [DOI] [PubMed] [Google Scholar]
- Thiagarajan TC, Piedras-Renteria ES, Tsien RW. alpha-and betaCaMKII. Inverse regulation by neuronal activity and opposing effects on synaptic strength. Neuron. 2002;36:1103–1114. doi: 10.1016/s0896-6273(02)01049-8. [DOI] [PubMed] [Google Scholar]
- Togashi H, Abe K, Mizoguchi A, Takaoka K, Chisaka O, Takeichi M. Cadherin regulates dendritic spine morphogenesis. Neuron. 2002;35:77–89. doi: 10.1016/s0896-6273(02)00748-1. [DOI] [PubMed] [Google Scholar]
- Turrigiano G. Homeostatic signaling: the positive side of negative feedback. Curr Opin Neurobiol. 2007;17:318–324. doi: 10.1016/j.conb.2007.04.004. [DOI] [PubMed] [Google Scholar]
- Turrigiano GG, Leslie KR, Desai NS, Rutherford LC, Nelson SB. Activity-dependent scaling of quantal amplitude in neocortical neurons. Nature. 1998;391:892–896. doi: 10.1038/36103. [DOI] [PubMed] [Google Scholar]
- Turrigiano GG, Nelson SB. Homeostatic plasticity in the developing nervous system. Nat Rev Neurosci. 2004;5:97–107. doi: 10.1038/nrn1327. [DOI] [PubMed] [Google Scholar]
- Van Aelst L, Cline HT. Rho GTPases and activity-dependent dendrite development. Curr Opin Neurobiol. 2004;14:297–304. doi: 10.1016/j.conb.2004.05.012. [DOI] [PubMed] [Google Scholar]
- van Praag H, Schinder AF, Christie BR, Toni N, Palmer TD, Gage FH. Functional neurogenesis in the adult hippocampus. Nature. 2002;415:1030–1034. doi: 10.1038/4151030a. [DOI] [PMC free article] [PubMed] [Google Scholar]
- Waites CL, Craig AM, Garner CC. Mechanisms of vertebrate synaptogenesis. Annu Rev Neurosci. 2005;28:251–274. doi: 10.1146/annurev.neuro.27.070203.144336. [DOI] [PubMed] [Google Scholar]
- Wallace W, Bear MF. A morphological correlate of synaptic scaling in visual cortex. J Neurosci. 2004;24:6928–6938. doi: 10.1523/JNEUROSCI.1110-04.2004. [DOI] [PMC free article] [PubMed] [Google Scholar]
- Wang CL, Zhang L, Zhou Y, Zhou J, Yang XJ, Duan SM, Xiong ZQ, Ding YQ. Activity-dependent development of callosal projections in the somatosensory cortex. J Neurosci. 2007;27:11334–11342. doi: 10.1523/JNEUROSCI.3380-07.2007. [DOI] [PMC free article] [PubMed] [Google Scholar]
- Wayman GA, Impey S, Marks D, Saneyoshi T, Grant WF, Derkach V, Soderling TR. Activity-dependent dendritic arborization mediated by CaM-kinase I activation and enhanced CREB-dependent transcription of Wnt-2. Neuron. 2006;50:897–909. doi: 10.1016/j.neuron.2006.05.008. [DOI] [PubMed] [Google Scholar]
- Williams SR, Mitchell SJ. Direct measurement of somatic voltage clamp errors in central neurons. Nat Neurosci. 2008;11:790–798. doi: 10.1038/nn.2137. [DOI] [PubMed] [Google Scholar]
- Wong ROL, Ghosh A. Activity-dependent regulation of dendritic growth and patterning. Nature Reviews Neuroscience. 2002;3:803–812. doi: 10.1038/nrn941. [DOI] [PubMed] [Google Scholar]
- Yu X, Malenka RC. Beta-catenin is critical for dendritic morphogenesis. Nat Neurosci. 2003;6:1169–1177. doi: 10.1038/nn1132. [DOI] [PubMed] [Google Scholar]
Associated Data
This section collects any data citations, data availability statements, or supplementary materials included in this article.