Abstract
Many viruses, including picornaviruses, have the potential to infect the central nervous system (CNS) and stimulate a neuroinflammatory immune response, especially in infants and young children. Cognitive deficits associated with CNS picornavirus infection result from injury and death of neurons that may occur due to direct viral infection or during the immune responses to virus in the brain. Previous studies have concluded that apoptosis of hippocampal neurons during picornavirus infection is a cell-autonomous event triggered by direct neuronal infection. However, these studies assessed neuron death at time points late in infection and during infections that lead to either death of the host or persistent viral infection. In contrast, many neurovirulent picornavirus infections are acute and transient, with rapid clearance of virus from the host. We provide evidence of hippocampal pathology in mice acutely infected with the Theiler’s murine encephalomyelitis picornavirus. We found that CA1 pyramidal neurons exhibited several hallmarks of apoptotic death, including caspase-3 activation, DNA fragmentation, and chromatin condensation within 72 hours of infection. Critically, we also found that many of the CA1 pyramidal neurons undergoing apoptosis were not infected with virus, indicating that neuronal cell death during acute picornavirus infection of the CNS occurs in a non–cell-autonomous manner. These observations suggest that therapeutic strategies other than antiviral interventions may be useful for neuroprotection during acute CNS picornavirus infection.
Many viruses maintain neurovirulent potential, even when the vast majority of infections are silent or subclinical.1,2,3,4,5 For example, in the correct context, even the common cold virus is neurovirulent.6,7 Picornaviruses are of particular concern due to ubiquitous distribution, widespread exposure, ease of transmission, and a propensity for neurovirulence.8 Non-polio picornaviruses, and especially neurovirulent enteroviruses, are emerging or re-emerging pathogens with the potential for global socio-economic impact.1,2,9,10,11,12,13 For example, enterovirus 71(EV71), first isolated from a child with encephalitis in California in 1969, has caused large epidemics with neurological consequences in Eastern Europe and Southeast Asia.12 Of 130,000 people infected in Taiwan in 1998, 405 required hospitalization for severe central nervous system (CNS) disease.14 Because EV71 infection results in clinical manifestations predominantly in infants and young children,12 the potential for long-term cognitive consequences is significant. Indeed, subsequent follow-up of those hospitalized patients that survived acute infection in the 1998 Taiwan outbreak revealed that many suffered long-term neurological deficits,15 including attention-deficit/hyperactivity disorder.16 These cognitive deficits were most pronounced in young children.15
The indispensable and largely irreplaceable nature of neurons in the CNS requires that these cells maintain a flawless apoptotic balance. Viral infection of the CNS is known to alter this tightly regulated equilibrium, leading to neuron death.8 For example, acute CNS infection by members of the neurotropic picornavirus family, including Theiler’s murine encephalomyelitis virus (TMEV),17,18 the coxsackieviruses,19 and encephalomyocarditis virus,20,21 induces the death of hippocampal neurons in a range of hosts.8 Case reports indicate that infection with neurovirulent picornaviruses results in extensive hippocampal lesions and cognitive impairment in humans.15,22,23 Likewise, in mice acutely infected with TMEV, we have observed damage to the CA1 hippocampal subfield and a consequent inability to form spatial memories.17 A previous study concluded that hippocampal neuronal apoptosis during TMEV infection was a cell-autonomous event triggered by direct neuron infection, and that cell death was a protective response that limited viral replication before the development of a humoral or cellular immune response.24 However, this previous study only assessed neuron death at one time point (7 days postinfection [dpi]) and within a viral infection system that either killed the host by overwhelming viral encephalitis or led to persistent viral infection of the CNS. In contrast to fatal or chronic viral models, many common neurovirulent picornavirus infections are acute and transient, with clearance of virus from the host CNS and rapid disease resolution.25 Based on this discrepancy, we used the Daniel’s strain of TMEV and an infection paradigm in mice of the H-2b major histocompatibility complex haplotype that models an acute brain infection that is cleared from the host CNS within 14 to 21 dpi.26 We exploited this model to evaluate CNS pathology in mice infected with a neurovirulent picornavirus and to elucidate the canonical mechanisms underlying neuronal apoptosis in the hippocampus of infected hosts.
Materials and Methods
Animals and Treatments
Male C57BL/6J mice (Jackson Laboratories; Bar Harbor, ME) between 6 to 10 weeks of age were infected intracranially with 2 × 10⁵ plaque forming units of the DA strain of TMEV in a volume of 10 μl DMEM (Cellgro; Herndon, VA). Sham-infected animals were injected intracranially with 10 μl DMEM. All mice were group-housed in the Mayo Clinic research vivarium with ad libitum access to food and water. Handling of all animals conformed to the National Institutes of Health and Mayo Clinic Institutional Animal Care and Use Committee guidelines.
Magnetic Resonance Imaging and Spectroscopy
Magnetic resonance imaging (MRI) was performed in a Bruker Avance 300 MHz (7T) vertical bore NMR spectrometer (Bruker Biospin, Billercia, MA), equipped with mini- and micro-imaging accessories. Body temperature was maintained at 37°C via a thermocouple-based system with continuous flow of conditioned air. During imaging, mice were anesthetized with inhalational isoflurane (1.5% to 2.5% in oxygen) delivered and maintained via a nose cone. A T2-weighted spin-echo sequence was used to image the brain (TR 4000 ms, TE 45 ms, NA 8, FOV 1.4 cm × 1.4 cm, matrix: 128 × 128; acquisition time: 68 minutes). Image analysis and slice selection were done in the Bruker ParaVision software package (Bruker Biospin). Magnetic resonance spectroscopy (MRS) was also performed in the Bruker Avance 300 MHz (7T) vertical bore NMR spectrometer. MRS data were obtained from a 27 mm3 voxel placed around the hippocampal area in each animal. To maintain uniformity throughout the study, the same investigator placed the voxel based on anatomical landmarks. The Bruker VSEL sequence, an implementation of the standard PRESS sequence, was used for voxel-based spectroscopy, with built-in water suppression pulses (TR 2000 ms, TE 100 ms, 2048 averages). Following manual shimming, the spectra were processed and analyzed with X-win NMR. Images and spectra were postprocessed in Adobe Photoshop. All images were subjected to the same histogram normalization routine.
Histology
Mice were perfused via intracardiac puncture with 50 ml of 4% paraformaldehyde. The brain was postfixed in 4% paraformaldehyde for 24 hours and then cuts through the optic chiasm and the infundibulum were made using the Atlas of the Mouse Brain and Spinal Cord (sections 220 and 350) as a guide.17 The resulting three brain sections were embedded in one block of paraffin, sectioned at five micron thickness, mounted on charged slides, rehydrated, and stained with H&E, Nissl, or thionin.
NeuN Staining and Virus Staining
The neuron-specific nuclear protein, NeuN, was detected immunohistochemically by staining with an anti-NeuN antibody (Chemicon) with diaminobenzidine metal enhancement on paraffin-embedded brain sections. TMEV was detected with a rabbit anti-TMEV polyclonal antibody (gift of Moses Rodriguez, Mayo Clinic). Tissue sections were deparaffinized in xylene and hydrated through a series of ethanol washes followed by extensive PBS washing. For NeuN staining, antigen retrieval was performed by microwaving the sample on full power using citrate buffer (pH 6.0) for 15 minutes, followed by 10 minutes of microwaving at level 3 for two sessions. Slides were then washed in PBS and blocked with 10% normal donkey serum in PBS for 30 minutes. The sections were incubated with anti-NeuN antibody (1:100) or anti-TMEV (1:1000) in a humidified chamber at 4°C for 48 hours. To detect the antigen, the sections were washed in PBS and incubated with horseradish peroxidase-conjugated goat anti-mouse IgG or goat anti-rabbit IgG for 60 minutes at room temperature in a humidified chamber. After washing, the sections were incubated in PBS containing diaminobenzidine substrate with nickel chloride-based metal enhancement and 0.3% hydrogen peroxide. The reaction was monitored under a dissecting microscope and all sections were containing sodium azide stopped simultaneously by extensive washing in PBS.
Terminal Deoxynucleotidyl Transferase dUTP Nick-End Labeling Staining
Tissue sections were microwave-treated in 0.1 M citrate buffer, washed once with PBS, and blocked at room temperature with 3% bovine serum albumin and 20% fetal calf serum in Tris buffer for 1 hour. Slides were then rinsed three times with PBS, labeled with terminal deoxynucleotidyl transferase dUTP nick-end labeling (TUNEL) reaction mixture (Roche; Indianapolis, IN) at 37°C for one hour, rinsed again with PBS, and mounted in hard-set mounting media containing 4,6-diamidino-2-phenylindole (DAPI, Vector Laboratories, Burlingame, CA).
Immunohistochemistry
Tissue sections were microwave-treated in 0.1 M citrate buffer for 1 minute, washed until cool with distilled water, blocked with 3% bovine serum albumin for 30 minutes at room temperature, and washed three times with PBS. The anti-8-hydroxy-2′-deoxyguanosine (8-OHdG) antibody (Chemicon; Temecula, CA) was used at 1:200 dilution in 1% bovine serum albumin for 1 hour at room temperature. The activated caspase-3-specific antibody (Chemicon; Temecula, CA) was used at 1:100 dilution in PBS overnight at 4°C.
Quantitation of Apoptotic Cells
We developed a quantitation program using the Zeiss Vision KS 400 software (Carl Zeiss; Gottingen, Germany). Following manual tracing of the hippocampus at the same stereotactic level in all mice, the number of positive cells at least 10 μm in diameter were automatically counted. All quantitation was performed blindly on coded sections without knowledge of treatment groups.
Transmission Electron Microscopy
Briefly, tissue was fixed with Trump’s fixative for 48 hours, washed twice with PBS, treated with 1% osmium tetroxide (EMS; Fort Washington, PA) overnight, washed three times with water, and treated with 1% uranyl acetate (EMS), followed by a final wash with water. Dehydrated blocks were embedded in araldite, cut, and mounted on grids (EMS). Transmission electron microscopy was performed on a Jeol ExII TEM (Jeol-USA; Peabody, MA).
Caspase-3 and Calpain-1 Biochemistry
A cell-free cleavage assay was used to assess the activity of caspase-3 and calpain-1 in the hippocampus. Isolated hippocampi were lysed using CytoBuster lysis buffer (Calbiochem; San Diego, CA) and standardized protein concentrations were established. The lysate was then incubated with the fluorogenic Suc-LY-AMC calpain substrate for 45 minutes and fluorescence intensity was measured at 360 nm excitation and 460 nm emission using a SpectraMax plate reader. In parallel, the lysate was incubated with the colorimetric Ac-DEVD-pNA caspase-3 substrate for 45 minutes and absorbance was measured at 405 nm. Experimental values were normalized to background and standard curves were used to establish rates of cleavage for each substrate.
In Situ Hybridization
We performed in situ hybridization and colabeling with TUNEL as described.27,28
Morris Water Maze and Novel Object Recognition Test
We used our previously published protocol.17 We found no significant difference in latency, swim distance, or swim speed during cue training. We also established a scent-based novel object recognition test. In brief, a single mouse was placed into a 30 cm × 30 cm ethanol-cleaned, acrylic box containing fresh wood-chip bedding for 5 minutes to allow habituation to the testing environment. Following habituation, the mouse was returned to a separate holding box for a 1-minute rest period. Training consisted of a 10 minutes exposure to two identical control objects of the same scent (apple-, berry-, or cherry-scented tea candles) arranged in diametric quadrants of the activity box. The scented candles were of considerable salience to the mice but were not treated as food. Following training, the mouse was returned to a separate holding box for 5 minutes. The novel object recognition testing session consisted of a 10 minute exposure to one control object (same object and scent from the training session) and one novel scent object (randomly assigned scent not present in the training session; quadrant location for the novel object was also randomized between trials but diametric positioning was maintained). All trials were conducted in an isolated procedure room with a darkened environment during the afternoon; mice were housed on a normal light–dark schedule. The number of investigations of each object was manually assessed by a blinded observer viewing digital video footage of the trials. Counts were gathered during the first 5 minutes of training or testing sessions. The number of interrogations of the novel object was divided by the number of investigations of the control object to generate a discrimination index. Intact recognition memory produces a discrimination index of 1 for the training session and a discrimination index greater than 1 for the testing session, consistent with greater interrogation of the novel object. We routinely observed discrimination index values greater than 2 for the testing session in normal mice.
Data Analysis
The t-test was used for water maze analyses and MRS comparison. Novel object recognition findings were analyzed by Kruskal-Wallis one way analysis of variance with Dunn’s pairwise comparison. TUNEL-positive cell counts were analyzed by the Mann-Whitney rank sum non-parametric test. Biochemical assessment of caspase and calpain activity and novel object recognition performance were analyzed by one-way analysis of variance with post hoc Student-Newman-Keuls pairwise comparison. The SigmaStat advisor was used to determine the appropriate test for all analyses. In all cases, we used α = 0.05 for significance. All values are presented as mean ± 95% confidence interval.
Results
MRI and MRS Reveal Focal Hippocampal Lesions in Mice Acutely Infected with TMEV
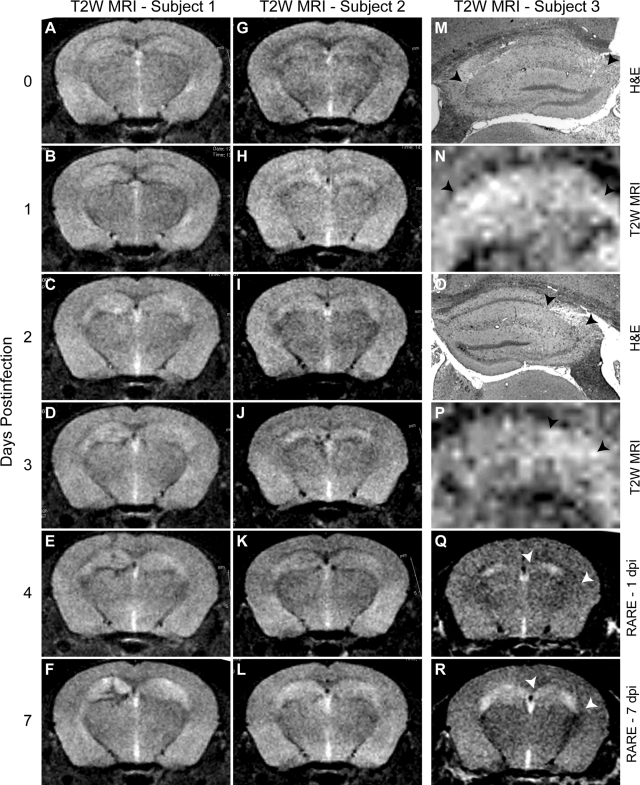
We have previously described hippocampal pathology in mice acutely infected with TMEV.17 To determine whether the hippocampus was the primary site of pathology in these mice, we used longitudinal MRI of acutely infected animals. A T2-weighted MRI time course in two separate TMEV-infected mice (Figure 1, A–F and 1, G–L) revealed the development of hyperintensities specifically over the hippocampus in both mice. Compared with the imaging acquired in the mice before infection (Figure 1, A and G), hippocampal hyperintensities were discernable by 1 dpi (Figure 1, B and H) and were fully developed by 7 dpi (Figure 1, F and L). We have confirmed these observations in more than 10 mice. Subsequent histopathological analysis at 7 dpi revealed a correlation between the spatial distribution of the T2-weighted hyperintensities and the loss of CA1 pyramidal neurons.17 In one animal, the entire extent of CA1 was damaged (Figure 1M) and the entire hippocampus exhibited T2 hyperintensity (Figure 1N). In another animal, only 25% of CA1 was injured (Figure 1O) and the hyperintensity by MRI was restricted to the lateral aspect of the hippocampus (Figure 1P). We further validated our observations of hippocampal damage by using a rapid acquisition with relaxation enhancement method to reduce T2 relaxation artifacts.29,30 Comparison of the rapid acquisition with relaxation enhancement signal at 1 dpi (Figure 1Q) to the signal at 7 dpi (Figure 1R) indicates considerable evolution of pathology that is spatially restricted to the hippocampus (arrowheads in 1, Q–R).
Figure 1.
Magnetic resonance imaging reveals time-dependent development of hippocampal damage during acute TMEV infection of the CNS. T2-weighted imaging in two separate mice (A–F and G–L) at 0 (A,G), 1 (B,H), 2 (C,I), 3 (D,J), 4 (E,K), and 7 (F,L) days postinfection (dpi) revealed a time-dependent increase in hyperintense abnormalities located predominantly in the hippocampus. M and O: Hippocampal pathology by H&E staining at 7 dpi associated with MRI hyperintensity in the same mice in (N) and (P), respectively. The arrowheads delineate the regions of pathology (M,O) and hyperintensity (N,P) that are restricted to the CA1 pyramidal neuron layer in the hippocampus. Note that the T2 hyperintensity distribution closely follows the extent of pathology. Q and R: Rapid acquisition with relaxation enhancement imaging protocol that confirms the presence of hippocampal injury that increases from 1 dpi (Q) to 7 dpi (R). Arrowheads in Q and R represent extent of CA1 region in the hippocampus.
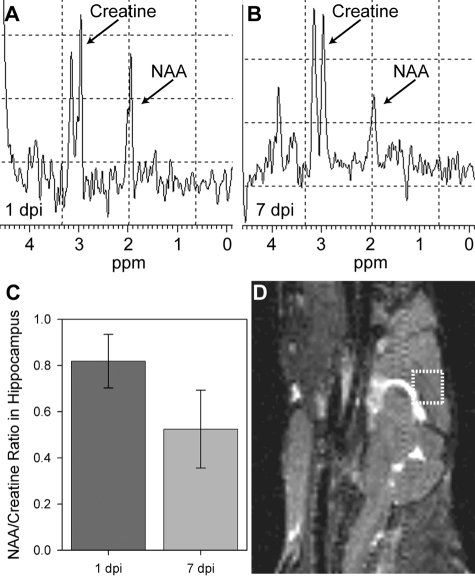
MRI lacks the spatial resolution necessary to discern whether the hippocampal pathology we observed was specifically due to neuron injury. To address this we used MRS of a 27 μl voxel placed around the hippocampus (Figure 2D). Longitudinal MRS revealed a reduction in the ratio of N-acetylaspartate (NAA; a neuronal marker31) to creatine from 1 dpi to 7 dpi (Figure 2A vs. 2B). Quantitation in 3 mice showed a 36% ± 9% reduction in the NAA:creatine ratio (mean ± 95% confidence interval [CI]; t(4) = 6.181, P = 0.003 by t-test) (Figure 2C). We conclude that acute infection with TMEV results in CNS pathology that is largely restricted to the hippocampus and involves substantial injury to hippocampal neurons.
Figure 2.
Magnetic resonance spectroscopy indicates hippocampal neuronal injury during acute TMEV infection of the CNS. Spectroscopic analysis of N-acetylaspartate (NAA) and creatine levels within a 27 μl voxel (D) containing the dorsomedial aspect of the hippocampus at 1 dpi (A) and 7 dpi (B) indicated a suppression of the NAA line relative to creatine. C: Quantitation of the ratio of NAA to creatine showed a 36% reduction consistent with neuronal injury in the hippocampus: t(4) = 6.181, P = 0.003 for 7 dpi vs 1 dpi by t-test.
Acute Infection with TMEV Results in Damage Isolated to the CA1 Hippocampal Subfield
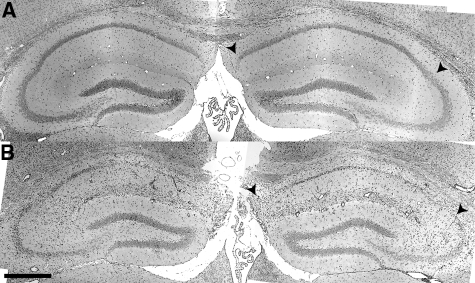
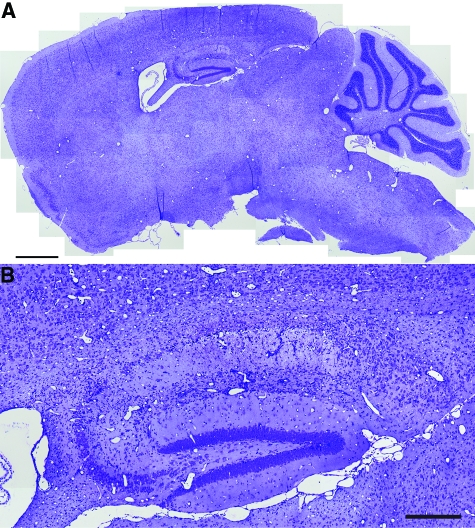
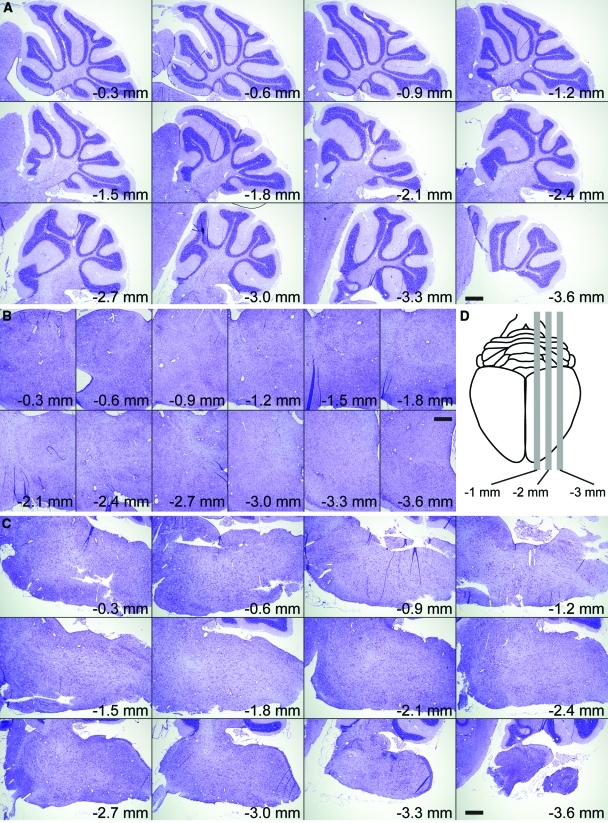
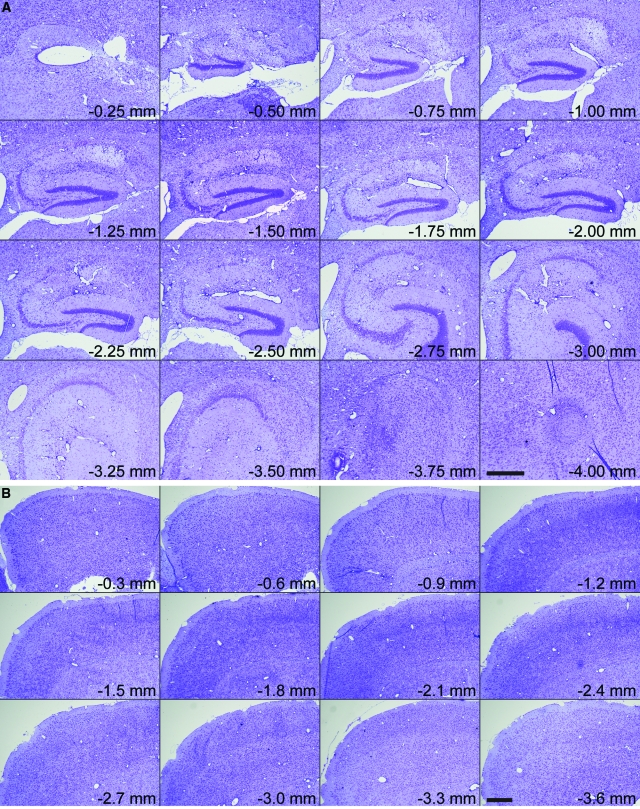
Histopathological analysis of the hippocampus at 7 dpi in sham-infected (Figure 3A) or TMEV-infected mice (Figure 3B) confirmed that the hippocampal pathology was restricted to the CA1 region (between the arrowheads in Figure 3). CA3 and the dentate gyrus were spared. Moreover, the predominant feature in sagittal brain sections from TMEV-infected mice was pathology in the hippocampus (Figure 4A) restricted to the CA1 layer (Figure 4B). Serial analysis of sagittal sections throughout the brain (Figure 5 and 6) revealed complete sparing of the cerebellum (Figure 5A), midbrain (Figure 5B), brainstem (Figure 5C), and cortex (Figure 6B). Serial analysis also verified that CA1 was the exclusive hippocampal target throughout the lateral extent of the hippocampus (from −0.25 mm relative to the midline to −4 mm relative to midline; Figure 6A). We have reproducibly observed this pattern of pathology in brain sections from hundreds of mice.
Figure 3.
Acute infection with TMEV results in damage localized to the hippocampus. Histological analysis by H&E staining indicated focal tissue damage isolated to the pyramidal neurons in the CA1 subfield of the hippocampus (B) at 7 dpi. Pathology was never observed in CA1 in sham-infected mice (A). Arrowheads delineate CA1 in (A) and (B). Scale bar = 500 μm in (B) (also refers to A).
Figure 4.
Acute infection with TMEV results in damage localized to the hippocampus. A high resolution montage of the whole brain stained with Nissl, collected in the sagittal plane at 1 mm lateral to the midline at 7 dpi (A). Overt pathology is only observed in the hippocampus. B: Higher magnification indicates that hippocampal pathology at 7 dpi was restricted to the CA1 layer. Scale bars: 1 mm (A); 250 μm (B).
Figure 5.
Acute infection with TMEV results in damage localized to the hippocampus. Serial, Nissl-stained sagittal sections collected from 0.3 mm lateral to the midline through to 3.6 mm lateral to midline (D). We observed no pathology at any level in the cerebellum (A), midbrain (B), or brainstem (C). Scale bars = 500 μm.
Figure 6.
Acute infection with TMEV results in damage localized to the hippocampus. Serial, Nissl-stained sagittal sections collected from 0.25 mm lateral to the midline through to 4 mm lateral to midline show extensive damage to the entire medial extent of CA1 in the hippocampus (A) but no injury to cortex (B). Scale bars = 500 μm.
The Majority of CA1 Neurons Are Lost by 7 dpi
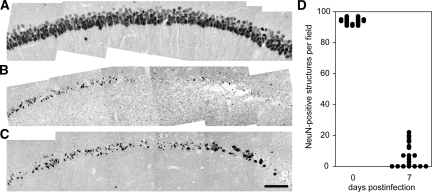
To quantify the extent of CA1 neuronal loss we stained 5 μm-thick paraffin-embedded hippocampal sections (coronal sections collected at −1.7 mm from Bregma) for the neuron-specific marker NeuN (Figure 7) and counted the number of individual neurons per mm2 of layer CA1. We found that the number of NeuN-positive neurons in CA1 in uninfected mice was highly reproducible, at 3768 ± 73 neurons per mm2 (n = 5 mice) (Figure 7A). In contrast, we counted 299 ± 138 neurons per mm2 (n = 5 mice) in CA1 in mice at 7 dpi (Figure 7, B and C). This difference was significant at P < 0.001 by the Mann-Whitney rank sum test, U(20,20) = 0.000, Figure 7D. We corroborated these numbers and the loss of neurons associated with acute TMEV infection by staining hippocampal sections with thionin (data not shown). We conclude that the damage to the hippocampus present at 7 dpi results in a >90% reduction in the number of pyramidal neurons in layer CA1.
Figure 7.
The majority of CA1 pyramidal neurons are lost by 7 dpi. Hippocampal sections at −1.7 mm from Bregma were collected from uninfected mice (A) and mice at 7 dpi (B and C) and stained for the neuron-specific marker NeuN. Montages of images collected at ×60 reveal that the high density of CA1 neurons present in uninfected controls (A) is attenuated following infection (B and C). D: Individual fields were subjected to an automated thresholding and counting routine to determine the number of NeuN-positive cells in CA1. While greater than 90 NeuN-positive cells were found per field in uninfected mice (n = 20 fields from 5 mice), fewer than 20 NeuN-positive cells were observed per field in mice at 7 dpi (n = 20 fields from 5 mice), and many animals had CA1 fields devoid of NeuN-positive structures. Scale bar in (C) = 100 μm; refers to A–C.
CA1 Pyramidal Neurons Are Injured Early during Acute TMEV Infection
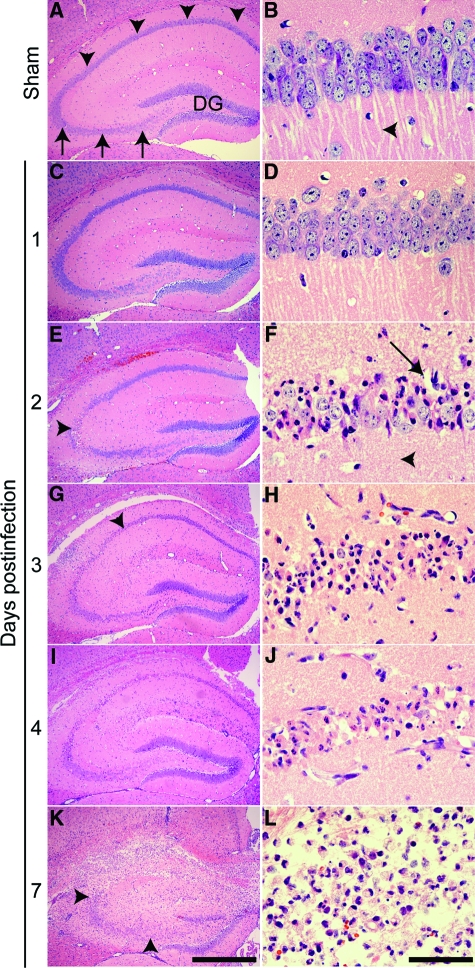
Acute infection with TMEV triggered a time-dependent loss of CA1 pyramidal neurons throughout the first 4 days of infection (Figure 8, A–J). Vacuolization of CA1 neurons in the pyramidal layer (arrow in Figure 8F) and loss of large apical dendrites was evident by 2 dpi (compare arrowhead in Figure 8B vs 8F). Neuronal injury was routinely observed at the CA1–CA3 border at early time points (arrowhead in Figure 8E), proceeding medially at later time points (arrowhead in Figure 8G). Vacuolization and nuclear condensation proceeded from 2 to 4 dpi (Figure 8, E–J) and occurred before gross disruption of the hippocampal architecture (Figure 8, K–L). As described above, the dentate gyrus showed no neuronal injury and the CA3 region was largely preserved even when the neighboring CA1 neurons were completely destroyed (Figure 8K). Sham-infected animals at 7 dpi exhibited none of these changes (Figure 8, A–B). The early appearance of injury (by 2 dpi) and the completion of CA1 neuronal loss by 4 dpi rules out a role for the adaptive immune response, which does not fully develop until 7 to 10 dpi.32 We conclude that the death of CA1 neurons is triggered very early during CNS infection and must depend on the innate immune response, circuit disruption, or direct virus-induced injury.
Figure 8.
TMEV infection triggers a time-dependent injury to the pyramidal layer (stratum pyramidale) of the CA1 region of the hippocampus. A, C, E, G, I, K: Low magnification H&E image of the hippocampus. B, D, F, H, J, L: Higher magnification image collected within a portion of CA1 chosen to highlight representative pathology. A and B: Sham-infected animals exhibit normal hippocampal morphology 7 days after infection. The CA1 pyramidal layer is indicated by arrowheads in (A). The CA3 pyramidal layer is indicated by arrows in (A). DG: dentate gyrus. Normal CA1 pyramidal neuron apical dendrites are marked by an arrowhead in (B). C and D: No damage was evident at 1 dpi. E and F: By 2 dpi, pyramidal neuron damage near the CA1 and CA3 junction was detectable (arrowhead in E). Higher magnification of the damaged area revealed condensed neurons, vacuolization in the pyramidal layer architecture (arrow in F), and complete loss of the large apical dendrites (arrowhead in F). G and H: This process continued at 3 dpi, with the injury spreading medially along CA1 (arrowhead in G). I and J: By 4 dpi the majority of neurons in CA1 were injured or absent. K and L: By 7 dpi there was frank destruction of the hippocampal architecture surrounding CA1 but remarkable preservation of CA3 (delineated by arrowheads in K) and the dentate gyrus. Scale bar in (K) = 500 μm; refers to A, C, E, G, I, and K. Scale bar in (L) = 50 μm; refers to B, D, F, H, J, and L. These results are representative of at least 10 mice in each of three separate experiments.
Virus Antigen Is Not Restricted to the Hippocampus and Only a Minority of CA1 Neurons Are Infected
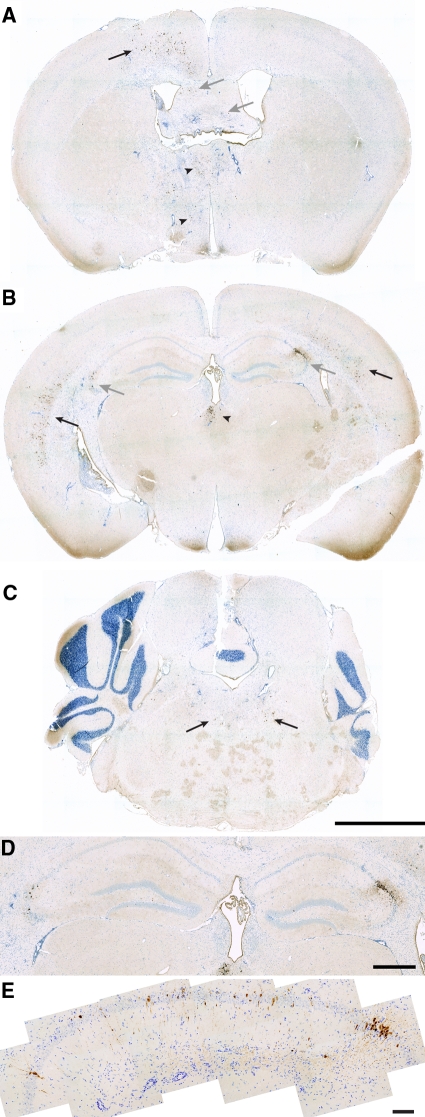
To determine whether direct virus infection was responsible for the extensive loss of CA1 neurons, we immunostained paraffin-embedded sections from mice at 2 dpi with a rabbit anti-TMEV antibody (Figure 9). We made two notable observations: First, TMEV antigen was widely distributed in the cortex (Figure 9, A and B), thalamus (Figure 9A), and brainstem (Figure 9C), in addition to the hippocampus (Figure 9B). Second, within the hippocampus, the distribution of TMEV antigen was variable (Figure 9D) and was observed in a minority of CA1 cells (Figure 9E). We counted 336 ± 97 TMEV-positive cells per mm2 in CA1 (n = 8 mice), corresponding to approximately 10% of the total number of CA1 neurons counted above. This suggests that CA1 neuron death is not caused directly by the virus.
Figure 9.
Virus antigen is not restricted to the hippocampus and only a minority of CA1 neurons are infected. The distribution of TMEV at 2 dpi was determined by immunohistochemistry using a rabbit anti-TMEV polyclonal antibody. Scattered populations of infected cells were detected in the cortex (black arrows in A and B), thalamus (arrowheads in A and B), fimbria-fornix (gray arrows in A), hippocampus (gray arrows in B), and brainstem (arrows in C). Within the hippocampus, the distribution was highly variable, with concentrations of cells at the CA1:CA3 border (D). Higher magnification analysis of the hippocampus from a different mouse revealed that the majority of CA1 neurons were uninfected (E). Images are representative of at least five animals. Scale bars: 2 mm (C; refers to A–C); 500 μm (D); 100 μm (E).
Hippocampal Neurons Die Apoptotically during Acute TMEV Infection
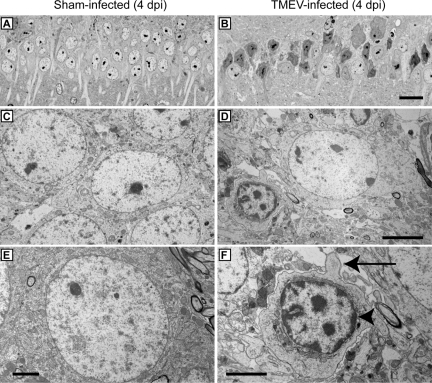
To further characterize the cell death within the CA1 pyramidal layer we performed electron microscopy. Healthy CA1 pyramidal neurons at 4 dpi in a sham-infected mouse are shown at several magnifications (Figure 10A, C, and E). In contrast to sham-infected animals, CA1 neurons in TMEV-infected mice at 4 dpi (Figure 10, B, D, and F) presented several morphological hallmarks of apoptosis, including cell shrinkage (Figure 10D), chromatin condensation (arrowhead in Figure 10F), and membrane blebbing (arrow in Figure 10F).
Figure 10.
EM evidence that hippocampal pyramidal neurons undergo apoptosis during acute TMEV infection. Electron microscopy was used to examine cellular morphology in the CA1 layer of the hippocampus. Hippocampal thick sections were collected at 4 dpi from sham-infected (A,C,E) and TMEV-infected (B,D,F) mice and stained with Toluidine Blue O to identify the CA1 region. Thin sections of CA1 were then prepared for EM analysis. Note the considerable difference in pyramidal cell layer architecture and the apoptotic morphology of pyramidal neurons between sham- (A) and TMEV-infected (B) animals at low magnification. Higher magnification showed the morphology of normal pyramidal neurons in sham-infected mice (C,E). In sections from TMEV-infected mice (D,F) the majority of CA1 neurons showed a shrunken morphology, cellular blebbing (arrow in F), and chromatin condensation along the nuclear membrane (arrowhead in F), consistent with apoptosis. In addition, vacuolization of the area surrounding the dying neuron (D,F) was consistent with the vacuolization seen by histological analysis and light microscopy. Scale bars: 20 μm (in B and applies to A); 5 μm (D and applies to C); 2.5 μm (E); 2.5 μm (F).
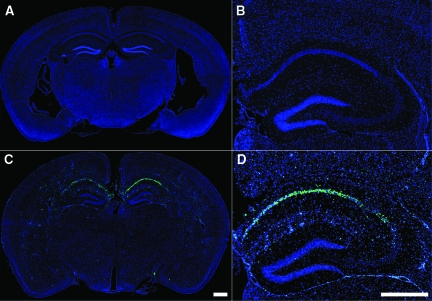
The vacuolization and nuclear condensation observed in CA1 neurons during acute TMEV infection suggested an apoptotic death mechanism. Apoptotic cells typically experience DNA fragmentation33 elicited by caspase-activated DNase.34 Therefore, we performed TUNEL staining at 4 dpi in sham-infected (Figure 11, A–B) and TMEV-infected mice (Figure 11, C–D). We found no or few TUNEL-positive cells anywhere in the brain in sham-infected mice (Figure 11, A–B). In contrast, we observed a robust concentration of TUNEL-positive cells localized to the hippocampus in TMEV-infected animals (Figure 11C). Higher magnification revealed that the majority of TUNEL-positive cells were located in the CA1 pyramidal layer (Figure 11D), consistent with our earlier observations. Analysis of additional time points showed that the number of TUNEL-positive cells within the hippocampus increased sharply between 1 and 3 dpi and that there were significantly more TUNEL-positive cells in TMEV-infected mice, as compared with sham-infected mice at 2, 3, and 4 dpi (Table 1).
Figure 11.
Acute TMEV infection induces DNA fragmentation specifically within the CA1 pyramidal layer of the hippocampus. TUNEL staining revealed considerable DNA fragmentation within cells localized almost exclusively to the CA1 region of the hippocampus at 4 dpi (blue = DAPI; green = TUNEL). Sham-infected animals exhibited essentially no TUNEL-positive cells anywhere in the brain (A and B), while mice infected with TMEV showed a large number of cells with DNA fragmentation localized to the CA1 region of the hippocampus at 4 dpi (C and D). Quantitation of the number of TUNEL-positive cells in the hippocampus revealed a significant difference (P = 0.002 by the Mann-Whitney rank sum test) between sham-infected (22 ± 8 TUNEL-positive cells per hippocampal section; n = 6) and TMEV-infected (530 ± 142 TUNEL-positive cells per hippocampal section; n = 6) animals. The size of the hippocampal area analyzed did not differ between the groups. Scale bars: 500 μm (C and applies to A); 500 μm (in D and also applies to B).
Table 1.
Quantitation of TUNEL(+) Cells in the Hippocampus of TMEV- or Sham-Infected Mice at 1, 2, 3, and 4 Days Postinfection
| Days* | Infection | TUNEL(+) Cells† | No. of Mice | Significance |
|---|---|---|---|---|
| 1 | TMEV | 46 ± 15 | 5 | P = 0.126‡ |
| Sham | 28 ± 7 | 6 | P = 0.537§ | |
| 2 | TMEV | 202 ± 62 | 6 | P = 0.015 |
| Sham | 32 ± 14 | 6 | P = 0.240 | |
| 3 | TMEV | 373 ± 103 | 6 | P = 0.002 |
| Sham | 19 ± 6 | 6 | P = 0.180 | |
| 4 | TMEV | 353 ± 95 | 6 | P = 0.002 |
| Sham | 14 ± 5 | 6 | P = 1.000 |
Days postinfection.
Per mm2 of whole hippocampal section.
TMEV versus Sham for TUNEL(+) cells.
TMEV versus sham for total hippocampal area analyzed.
Values are shown as mean ± 95% CI. Statistical significance assessed by Mann-Whitney rank sum test.
Pyramidal Neuron Death Does Not Depend on Direct Infection with the Virus
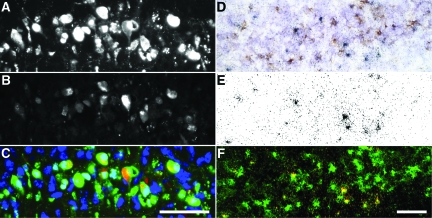
To further evaluate the relationship between virus infection and neuron apoptosis, and to determine whether the death of pyramidal neurons was non–cell-autonomous, as suggested above, we immunostained hippocampal sections at 4 dpi for the presence of TMEV antigen (Figure 12B) and TUNEL reactivity (Figure 12A). Colocalization of these markers revealed that a large number of CA1 pyramidal neurons were TUNEL-positive but TMEV antigen-negative (Figure 12C), implicating a non–cell-autonomous bystander mechanism of cell death. To refine this finding we used the more sensitive analysis of in situ hybridization for the presence of the TMEV genome within CA1 pyramidal neurons (Figure 12E). Immunohistochemical analysis of TUNEL on the same hippocampal sections (Figure 12D) indicated the presence of many CA1 neurons that were not infected with TMEV (Figure 12F), confirming our previous observations with anti-TMEV immunostaining (Figure 9). Quantitation showed that greater than 10 times more cells were TUNEL-positive but TMEV-negative than were double-positive (Table 2). On the basis of these findings we conclude that neurons in CA1 experience a lethal insult that does not depend on direct viral infection but which does depend on an apoptotic cascade. This non–cell-autonomous death suggests that CA1 neurons are dying as the result of bystander injury.
Figure 12.
Death of CA1 pyramidal neurons is independent of direct infection with the TMEV virus. Colocalization of TUNEL immunostaining (A; green in C) and TMEV antigen immunostaining (B; red in C) revealed the presence of many dying neurons that were not infected with the virus (green-only cells in C) at 4 dpi. This observation was confirmed by the extensive absence of colocalization between TUNEL immunohistochemistry (D; pseudocolored green in F) and in situ hybridization for viral RNA (grains in E; pseudocolored red in F) at 4 dpi. While several cells are both infected and dying (yellow in F), the majority of dying neurons are not infected (green-only in F). DAPI is shown in blue in (C). Scale bar: 50 μm (C and refers to A–C); 50 μm in (F and refers to D–F).
Table 2.
Quantitation of Uninfected but TUNEL-Positive Neurons in CA1 in the Hippocampus at 4 dpi
| TUNEL versus Infected | Number of Cells per Hippocampal Section | Significance |
|---|---|---|
| TMEV− TUNEL+ | 527 ± 44 | P < 0.001 vs. T+T+ |
| P < 0.001 vs. T+T− | ||
| TMEV+ TUNEL+ | 45 ± 7 | P = 0.169 vs. T+T− |
| TMEV+ TUNEL− | 18 ± 3 |
Values are shown as mean ± 95% CI for 10 mice. Statistical significance assessed by one-way analysis of variance with Student-Newman-Keuls pairwise comparison.
Hippocampal Neuron Apoptosis Involves Oxidative Injury and Calpain and Caspase-3 Activation
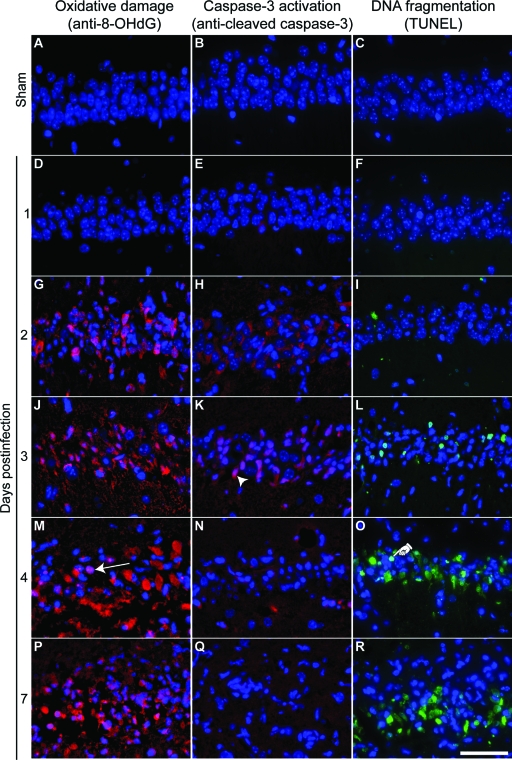
Apoptosis is typically associated with oxidative damage to cells in the form of DNA base lesions and oxidation of cellular RNA.35 Such damage results from the production of reactive oxygen species and can be detected by the presence of 8-OHdG within apoptotic cells.36 We found that CA1 pyramidal neurons were positive for 8-OHdG by 2 dpi (Figure 13G) and this damage persisted through 7 dpi (Figure 13, J, M, and P). 8-OHdG was not detected in sham-infected mice at 7 dpi (Figure 13, A and D).
Figure 13.
Hippocampal injury during acute TMEV infection is associated with apoptotic markers. Higher magnification images of the same areas of CA1 analyzed in Figure 8. A, D, G, J, M, P: Oxidative damage assessed by anti-8-OHdG immunostaining (red). B, E, H, K, N, Q: Activated caspase-3 immunoreactivity (red). C, F, I, L, O, R: TUNEL staining to show DNA cleavage (green). A–C: The CA1 region of sham-infected animals shows no evidence of oxidative damage (A), activated caspase-3 (B), or TUNEL positivity (C) at 7 dpi. D–R: In contrast, mice infected with TMEV show a time-dependent increase in oxidized nucleotides, activated caspase-3, and DNA cleavage. The arrow in (M) indicates a typical anti-8-OHdG-positive pyramidal neuron. The arrowhead in (K) indicates a typical activated caspase-3-positive pyramidal neuron. The hand in (O) indicates a typical TUNEL-positive pyramidal neuron. The day of maximum caspase-3 activation (H or K) precedes the onset of maximum DNA cleavage (O and R), while the onset of oxidative damage (G) is contiguous with caspase-3 activation. Scale bar = 50 μm (in R and applies to all panels). These results are representative of at least five mice in each of three separate experiments. DAPI-labeled nuclei are blue in all panels.
While apoptosis can occur through either caspase-dependent or caspase-independent mechanisms,37 caspase activation is generally considered a reliable marker of apoptosis. Since caspase-3 is the principal effector caspase, particularly in neurons,38 we examined sham- and TMEV-infected animals for the presence of activated caspase-3 in the pyramidal layer of the hippocampus (Figure 13, B, E, H, K, N, Q). Acute TMEV infection resulted in activated caspase-3 immunoreactivity within cells in the pyramidal layer at 2 and 3 dpi (Figure 13H). No activated caspase-3-positive cells were ever observed in the hippocampus of sham-infected mice (Figure 13B).
The peak in TUNEL-positivity in CA1 (Figure 13, C, F, I, L, O, R) occurred at 4 dpi (Figure 13O), after the peak of caspase-3 activation (3 dpi; Figure 13K) and the onset of oxidative injury (2 dpi; Figure 13G). These observations suggest that CA1 neurons undergo caspase-associated apoptosis triggered by oxidative damage and that this injury process starts as early as 1 to 2 dpi.
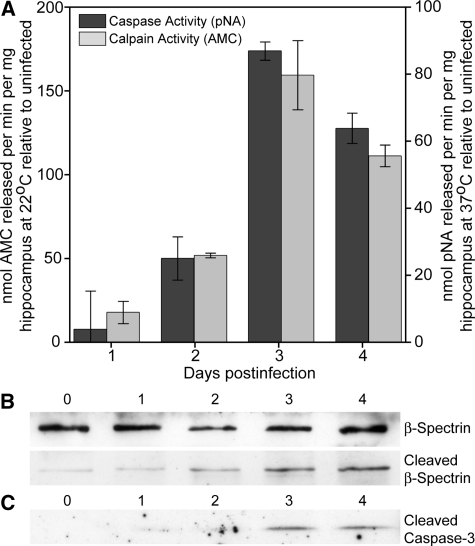
To further investigate the mechanism of apoptosis in hippocampal neurons during TMEV infection of the CNS, we measured the activity of apoptosis-related proteases in the isolated hippocampus (Figure 14). Quantitative biochemical analysis of hippocampal homogenates from 0 to 4 dpi indicated that peak caspase-3 activity occurred at 3 dpi (Figure 14A), F(4,10) = 42.750, P < 0.001 by one-way analysis of variance; P < 0.001 for 3 dpi vs 0 dpi by Student-Newman-Keuls pairwise analysis; P < 0.001 for 4 dpi vs 0 dpi; P = 0.03 for 2 dpi vs 0 dpi; P = 0.538 for 1 dpi vs 0 dpi. The presence of activated caspase-3 in the hippocampus was additionally confirmed by Western blot (Figure 14C).
Figure 14.
Cell death in the hippocampus involves activated caspase-3 and activated calpain. A: Hippocampi were freshly isolated from mice (n = 3 at each time point) at the indicated days postinfection and caspase-3 and calpain-1 activity was measured using a cell-free substrate cleavage assay (A). Both caspase-3 and calpain-1 exhibited a peak in activity at 3 dpi. B: Immunoblots of total (top band) and cleaved (lower band) β spectrin indicate an accumulation of this calpain-1 cleavage product during the course of infection, indicative of calpain-1 activation. C: Immunoblots of activated caspase-3 confirm the substrate cleavage data. The immunoblot analyses are representative of two separate experiments.
In addition to caspase-mediated effector mechanisms, hippocampal neurons are also sensitive to the activity of the calcium-dependent cysteine protease calpain-1.39 Biochemical analysis of calpain-1 activity in hippocampal lysates revealed a peak in the activity of this protease that coincided with the peak of caspase activity at 3 dpi (Figure 14A); F(4,10) = 43.600, P < 0.001 by one-way analysis of variance; P < 0.001 for 3 dpi vs 0 dpi by Student-Newman-Keuls pairwise analysis; P < 0.001 for 4 dpi vs 0 dpi; P = 0.011 for 2 dpi vs 0 dpi; P = 0.218 for 1 dpi vs 0 dpi. Calpain-1 activity was confirmed by Western blot analysis of the accumulation of β-spectrin cleavage products in the isolated hippocampus (Figure 14B).40 The increase in β-spectrin cleavage product observed at 2 dpi (before the onset of detectable cleaved caspase-3 by Western blot) suggests that calpain activity may precede or predict caspase-3 activation, consistent with an early calcium-dependent insult. Further work is necessary to test this hypothesis.
Cognitive Behavior Is Disrupted Following Acute Infection with TMEV
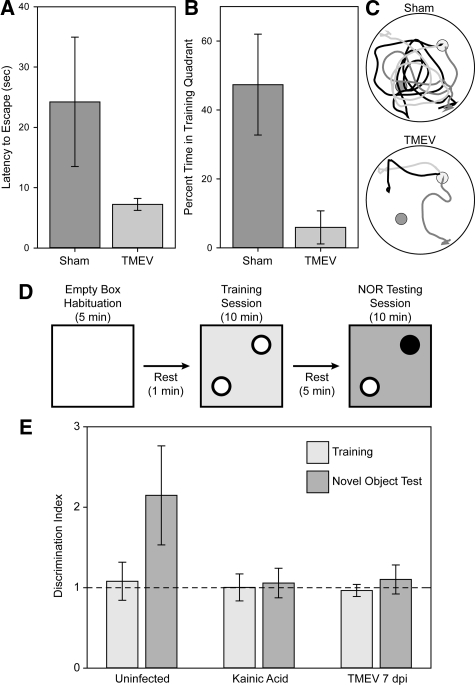
We have previously reported that acutely infected mice lack the ability to form a spatial memory in the Morris water maze.17 Assessment of cognitive strategy in the water maze is a sensitive measure of spatial memory disruption.41 We tested sham-infected and TMEV-infected mice 2 weeks after infection to determine the after-effects of hippocampal damage. Mice were trained to locate a hidden platform, as previously described,17 and then subjected to a competition test in which the hidden platform was removed from the training quadrant and a visible platform was placed in the diametric quadrant.41,42 Mice that employ a “cue” strategy swim directly to the visible platform, despite previous training. Mice that employ a “place” strategy ignore the visible platform and swim to the training quadrant. “Place” strategy mice will briefly perseverate in the training quadrant before escaping via the visible platform. Latency to escape and percent time spent in the training quadrant are therefore sensitive measures of cognitive strategy, with “place” strategists taking longer to escape and spending more time in the training quadrant than “cue” strategists. We found that sham-infected mice took 3.4 ± 1.3-fold longer to escape than TMEV-infected mice, mean ± 95% CI; t(16) = 3.640, P = 0.002 by t-test, consistent with more time spent searching the empty training quadrant (Figure 15, A and C). Likewise, sham-infected mice spent 47.4% ± 12.4% of the total swim time in the empty training quadrant, while TMEV-infected mice only spent 5.9% ± 4.1% of the total time in this quadrant, mean ± 95% CI; t(16) = 6.195, P < 0.001 by t-test (Figure 15, B and C). We conclude that neuronal apoptosis in the hippocampus disrupts spatial memory processing and switches the cognitive strategy from place response to cue response.
Figure 15.
Mice exhibit memory defects following acute infection with TMEV. Two weeks after infection, mice were tested in the Morris water maze using a competition test strategy to determine whether reference memory was disrupted. In this test, after 1 week of training and acquisition testing, the submerged training platform (small dark gray circles in C) is removed and a visible competition platform is placed in the tank in the opposite quadrant (light gray circles in C). If mice have developed a spatial map of the maze they ignore the visible platform and search in the training quadrant. In contrast, the absence of a spatial memory map results in direct escape to the visible platform. Sham-infected mice (n = 8) exhibited clear evidence of spatial memory formation, with significantly longer escape latency (A) and significantly more time spent in the empty training quadrant (B) than TMEV-infected mice (n = 8). As visual confirmation of this difference, swim paths are shown for three mice in each group (C). The sham-infected animals search the training quadrant before escaping via the visible platform. The TMEV-infected mice swim directly to the visible platform. Likewise, mice were tested at 7 dpi after infection in a scent-based novel object recognition test (D and E). In this test, mice are individually habituated to an environment consisting of a 30 cm × 30 cm acrylic box lined with wood shavings (changed between each mouse to eliminate spurious olfactory cues). After 5 minutes, the mice are briefly removed to a holding cage, and then reintroduced to the testing environment containing two identical scent objects. Testing of numerous objects revealed that apple-, berry-, and cherry-scented tea candles induced considerable interrogation but did not stimulate feeding behavior. During the 10-minute training session mice were exposed to 2 berry-, 2 apple-, or 2 cherry-scented candles (white circles in D), then removed to the holding cage for 5 minutes. The testing phase consisted of reintroducing the mice to the environment containing one candle from the training session and one new candle of a different scent (the black circle in D), randomly assigned. Mice were video taped and the number of interrogations of each object was determined manually during the training and testing sessions. The ratio of interrogations of the novel object to the number of interrogations of the familiar object was taken as a discrimination index. During training, all groups exhibited a discrimination index of 1 (dashed line in E). During testing, uninfected controls (n = 13 mice) exhibited an increase in the discrimination index consistent with interrogating the novel object two times more than the familiar object. In contrast, mice lesioned with kainic acid (n = 4 mice) or mice at 7 dpi (n = 12 mice) exhibited a discrimination index of 1, consistent with an inability to recall the familiar object.
Finally, we used a scent-based novel object recognition test to verify that the cognitive impairment was not restricted to one modality. In this test the mouse is habituated to the environment and then exposed for 10 minutes to two identical objects (Figure 15D). For our experiments we used apple-, cherry-, or berry-scented tea candles (we determined that these candles had considerable salience for the mice but were not treated as food). Thus, during training the mice were exposed to either two apple-scented candles, two cherry-scented candles, or two berry-scented candles. After the training session the mice were returned to a holding cage for 5 minutes and then reintroduced into the testing environment in which one of the candles (randomized) was replaced with the alternate scent. Thus, during testing the mice were exposed, for example, to one apple-scented and one berry-scented candle. The number of interrogations of each object was manually assessed by a blinded observer analyzing video recordings of the training and testing sessions. To normalize across experiments and between mice we calculated a discrimination index, taken as the ratio of interrogations of object #1 to the number of interrogations of object #2 (future novel object/future common object for the training session and novel object/common object for the testing session). A discrimination index of 1 shows equal time spent interrogating both objects. In normal, uninfected controls (n = 13 mice) we found that the discrimination index increased from 1.1 ± 0.2 during training (equal interrogations) to 2.1 ± 0.6 during testing with the novel object (twice as much time spent with the novel object as with the trained object) (Figure 15E). This difference was statistically significant: H(13,13,4,4,12,12) = 27.758, P < 0.001 by Kruskal-Wallis one way analysis of variance; Q(13,13) = 4.7, P < 0.05 by Dunn’s pairwise comparison for uninfected training versus testing. As a positive control for hippocampal lesioning we treated mice with kainic acid to induce seizures (n = 4 mice). One week later we tested these animals in the novel object recognition test. We found that there was no difference in discrimination index between training and testing, consistent with the inability of these mice to remember the training object. Finally, we tested TMEV-infected mice at 7 dpi (n = 12 mice). We found that these animals also had no difference in discrimination index between the training and testing trials. We conclude that hippocampal injury associated with acute picornavirus infection of the CNS renders mice unable to form spatial or object recognition memories.
Discussion
A number of picornaviruses are associated with encephalitis in humans, including EV71,14 Coxsackie A43,44 and B variants,22,45,46,47 hepatitis A,48,49,50 encephalomyocarditis virus,51,52 echovirus,53,54,55 and other enteroviruses.56,57,58,59 These findings suggest that encephalitis and subsequent CNS injury may be a low-frequency aspect of picornaviral infection that is common to many members of the family. The relatedness of picornaviruses,60 the similarity in neurovirulent potential across the family,1 and the recent identification of human TMEV-like cardioviruses,61 support our use of the TMEV model as an analog for studying the neuropathogenic consequences of acute CNS infection.8
Our findings in the CNS of acutely infected mice are in agreement with those of Fujinami and colleagues, who observed TUNEL-immunoreactive cells in the hippocampus of SJL/J mice infected for 1 week with TMEV24 and extensive hippocampal damage in C57BL/6 mice.18 These authors proposed that apoptosis of hippocampal neurons is a protective mechanism that serves to initiate viral clearance before the generation of an adaptive immune response.24 In support of this hypothesis, we found that hippocampal pyramidal neurons in C57BL/6J mice had already progressed to the end stage of the apoptotic cascade by 4 dpi, a time point that precedes both the appearance of virus-specific cytotoxic T cells in the CNS62,63 and the generation of virus-specific antibody titer.64 Moreover, the 4-day time point represents a stage in the infection when viral load has already started to wane in the brain,65,66 suggesting that a mechanism for limiting the spread of infection has already been engaged. Indeed, our observation that CA1 hippocampal neurons exhibit structural damage and signaling associated with apoptosis by 2 dpi suggests that the apoptotic trigger is a very early event in the host response to infection.
On the other hand, our observation that the majority of dying hippocampal neurons are not infected with TMEV indicates that the cause of neuron apoptosis is predominantly non–cell-autonomous. Rather than a suicide program sparked by direct infection with the virus,8 our results suggest that many CA1 pyramidal neurons die as bystanders. Such bystander pathology may result from disruption of hippocampal circuits caused by viral infection of a subset of neurons or may occur in response to an innate immune response. For example, hippocampal neurons are protected in mice infected with neuroadapted Sindbis virus by treatment with glutamate receptor antagonists, implicating circuit dysregulation in this model of viral encephalitis.67 Likewise, neutrophil or macrophage responses to CNS infection with mouse hepatitis virus,68,69,70 herpes simplex virus type 1,71 or Murray Valley encephalitis virus72 trigger neuronal immunopathology. Our preliminary findings indicate that apoptosis of CA1 pyramidal neurons during acute TMEV infection involves both an α-amino-3-hydroxyl-5-methyl-4-isoxazole-propionate (AMPA) receptor-dependent excitotoxicity and a neutrophil-mediated bystander immunopathology (E.J. Buenz and C.L. Howe, unpublished observations). Our ongoing experiments seek to determine whether the loss of memory function we observe is associated with circuit disruption, whether neuronal injury precedes or follows such disruption, and whether manipulation of electrical activity or the innate immune response modifies this disruption.
Therapeutically, a non–cell-autonomous model of hippocampal neuron death offers several potential avenues for neuroprotection distinct from antiviral treatment. Picornaviruses, in particular, present a considerable challenge for antiviral prevention and control strategies due to a profound genetic flexibility and rapid adaptability to environmental and host factors.8,73,74,75 With more than 1 billion picornavirus infections in humans each year,76 the potential for the development of neuropathogenic mutants is significant.77 Such adaptability may readily undermine the development and deployment of picornavirus-specific antiviral treatments. However, if a substantial fraction of neuronal apoptosis during acute picornavirus infection is induced by excitotoxicity or innate immune effectors, then treatment with anti-apoptotic drugs, glutamate receptor antagonists, anti-epileptics, or innate immunomodulators may allow substantial neuroprotection.
In conclusion, while TMEV is a mouse pathogen introduced into the CNS under artificial and constrained conditions, we think that this system is a reproducible and robust model that will permit the dissection of molecular and cellular events involved in the induction of neuropathology in humans acutely infected with neurotropic picornaviruses. Having characterized the non–cell-autonomous activation of caspase and calpain in hippocampal neurons in the acute TMEV model, we intend to exploit this system to identify novel therapeutic strategies for protecting neurons and cognitive function. Our ultimate goal is to translate such therapies into the clinic to protect children from the long-term consequences of neuron loss during acute picornavirus infections of the CNS.
Acknowledgments
We thank Dr. Joel Weaver, Jim Tarara, Louisa Papke, Laurie Zoecklein, and Nikilyn Kinzel for their expert technical assistance. We thank Dr. Moses Rodriguez for graciously providing guidance, resources, and space to perform these experiments.
Footnotes
Address reprint requests to Charles L. Howe, Ph.D., Department of Neurology, Mayo Clinic College of Medicine, Guggenheim 442-D, 200 First St SW, Rochester, MN 55905. E-mail: howe.charles@mayo.edu.
Supported by grant R01NS064571 (C.L.H.) from the NIH, by RG3636 (C.L.H.) from the National Multiple Sclerosis Society, by Donald and Frances Herdrich (C.L.H.) and by an early career development award from the Mayo Clinic (C.L.H.). E.J.B., B.M.S., A.D., and C.L.G. were supported by the Mayo Graduate School. C.L.G. was also supported by a gift from the Kern Family.
Current address of E.J.B.: BioSciential, LLC, 3936 Hwy 52 N, #228, Rochester, MN 55901.
References
- Muir P, van Loon AM. Enterovirus infections of the central nervous system. Intervirology. 1997;40:153–166. doi: 10.1159/000150542. [DOI] [PubMed] [Google Scholar]
- Johnson RT. Emerging viral infections of the nervous system. J Neurovirol. 2003;9:140–147. doi: 10.1080/13550280390194091. [DOI] [PubMed] [Google Scholar]
- Power C, Zhang K, van Marle G. Comparative neurovirulence in lentiviral infections: The roles of viral molecular diversity and select proteases. J Neurovirol. 2004;10 Suppl 1:113–117. doi: 10.1080/753312762. [DOI] [PubMed] [Google Scholar]
- Griffin DE. Neuronal cell death in alphavirus encephalomyelitis. Curr Top Microbiol Immunol. 2005;289:57–77. doi: 10.1007/3-540-27320-4_3. [DOI] [PubMed] [Google Scholar]
- Bonderoff JM, Lloyd RE. CVB translation: lessons from the polioviruses. Curr Top Microbiol Immunol. 2008;323:123–147. doi: 10.1007/978-3-540-75546-3_6. [DOI] [PubMed] [Google Scholar]
- Dufresne AT, Gromeier M. A nonpolio enterovirus with respiratory tropism causes poliomyelitis in intercellular adhesion molecule 1 transgenic mice. Proc Natl Acad Sci USA. 2004;101:13636–13641. doi: 10.1073/pnas.0403998101. [DOI] [PMC free article] [PubMed] [Google Scholar]
- MacLennan C, Solomon T. Potential neurovirulence of common cold virus. Lancet. 2004;364:1839–1840. doi: 10.1016/S0140-6736(04)17456-4. [DOI] [PubMed] [Google Scholar]
- Buenz EJ, Howe CL. Picornaviruses and cell death. Trends Microbiol. 2006;14:28–36. doi: 10.1016/j.tim.2005.11.003. [DOI] [PubMed] [Google Scholar]
- Abzug MJ. The enteroviruses: an emerging infectious disease? The real, the speculative and the really speculative. Adv Exp Med Biol. 2008;609:1–15. doi: 10.1007/978-0-387-73960-1_1. [DOI] [PubMed] [Google Scholar]
- Dolin R. Enterovirus 71–emerging infections and emerging questions. N Engl J Med. 1999;341:984–985. doi: 10.1056/NEJM199909233411309. [DOI] [PubMed] [Google Scholar]
- Hinson VK, Tyor WR. Update on viral encephalitis. Curr Opin Neurol. 2001;14:369–374. doi: 10.1097/00019052-200106000-00017. [DOI] [PubMed] [Google Scholar]
- Modlin JF. Enterovirus deja vu. N Engl J Med. 2007;356:1204–1205. doi: 10.1056/NEJMp078016. [DOI] [PubMed] [Google Scholar]
- Palacios G, Oberste MS. Enteroviruses as agents of emerging infectious diseases. J Neurovirol. 2005;11:424–433. doi: 10.1080/13550280591002531. [DOI] [PubMed] [Google Scholar]
- Hsiung GD, Wang JR. Enterovirus infections with special reference to enterovirus 71. J Microbiol Immunol Infect. 2000;33:1–8. [PubMed] [Google Scholar]
- Chang LY, Huang LM, Gau SS, Wu YY, Hsia SH, Fan TY, Lin KL, Huang YC, Lu CY, Lin TY. Neurodevelopment and cognition in children after enterovirus 71 infection. N Engl J Med. 2007;356:1226–1234. doi: 10.1056/NEJMoa065954. [DOI] [PubMed] [Google Scholar]
- Gau SS, Chang LY, Huang LM, Fan TY, Wu YY, Lin TY. Attention-deficit/hyperactivity-related symptoms among children with enterovirus 71 infection of the central nervous system. Pediatrics. 2008;122:e452–e458. doi: 10.1542/peds.2007-3799. [DOI] [PubMed] [Google Scholar]
- Buenz EJ, Rodriguez M, Howe CL. Disrupted spatial memory is a consequence of picornavirus infection. Neurobiol Dis. 2006;24:266–273. doi: 10.1016/j.nbd.2006.07.003. [DOI] [PubMed] [Google Scholar]
- Libbey JE, Kirkman NJ, Smith MC, Tanaka T, Wilcox KS, White HS, Fujinami RS. Seizures following picornavirus infection. Epilepsia. 2008;49:1066–1074. doi: 10.1111/j.1528-1167.2008.01535.x. [DOI] [PubMed] [Google Scholar]
- Feuer R, Mena I, Pagarigan RR, Harkins S, Hassett DE, Whitton JL. Coxsackievirus B3 and the neonatal CNS: the roles of stem cells, developing neurons, and apoptosis in infection, viral dissemination, and disease. Am J Pathol. 2003;163:1379–1393. doi: 10.1016/S0002-9440(10)63496-7. [DOI] [PMC free article] [PubMed] [Google Scholar]
- Shafi R, Cerutis DR, Giron DJ. Pathogenesis of the B variant of encephalomyocarditis virus. J Med Virol. 1993;40:193–199. doi: 10.1002/jmv.1890400305. [DOI] [PubMed] [Google Scholar]
- Yayou K, Takeda M, Tsubone H, Sugano S, Doi K. The disturbance of water-maze task performance in mice with EMC-D virus infection. J Vet Med Sci. 1993;55:341–342. doi: 10.1292/jvms.55.341. [DOI] [PubMed] [Google Scholar]
- Berger JR, Chumley W, Pittman T, Given C, Nuovo G. Persistent Coxsackie B encephalitis: report of a case and review of the literature. J Neurovirol. 2006;12:511–516. doi: 10.1080/13550280601090546. [DOI] [PubMed] [Google Scholar]
- Liow K, Spanaki MV, Boyer RS, Greenlee JE, Bale JF., Jr Bilateral hippocampal encephalitis caused by enteroviral infection. Pediatr Neurol. 1999;21:836–838. doi: 10.1016/s0887-8994(99)00083-1. [DOI] [PubMed] [Google Scholar]
- Tsunoda I, Kurtz CI, Fujinami RS. Apoptosis in acute and chronic central nervous system disease induced by Theiler’s murine encephalomyelitis virus. Virology. 1997;228:388–393. doi: 10.1006/viro.1996.8382. [DOI] [PubMed] [Google Scholar]
- Melnick JL. Poliovirus and other enteroviruses. Evans AS, Kaslow RA, editors. New York: Plenum Medical Book Co; 1997:pp 583–664. [Google Scholar]
- Brahic M, Bureau JF, Michiels T. The genetics of the persistent infection and demyelinating disease caused by Theiler’s virus. Annu Rev Microbiol. 2005;59:279–298. doi: 10.1146/annurev.micro.59.030804.121242. [DOI] [PubMed] [Google Scholar]
- Rodriguez M, Prayoonwiwat N, Howe C, Sanborn K. Proteolipid protein gene expression in demyelination and remyelination of the central nervous system: a model for multiple sclerosis. J Neuropathol Exp Neurol. 1994;53:136–143. doi: 10.1097/00005072-199403000-00004. [DOI] [PubMed] [Google Scholar]
- Schlitt BP, Felrice M, Jelachich ML, Lipton HL. Apoptotic cells, including macrophages, are prominent in Theiler’s virus-induced inflammatory, demyelinating lesions. J Virol. 2003;77:4383–4388. doi: 10.1128/JVI.77.7.4383-4388.2003. [DOI] [PMC free article] [PubMed] [Google Scholar]
- Hennig J, Nauerth A, Friedburg H. RARE imaging: a fast imaging method for clinical MR. Magn Reson Med. 1986;3:823–833. doi: 10.1002/mrm.1910030602. [DOI] [PubMed] [Google Scholar]
- Hennig J, Friedburg H. Clinical applications and methodological developments of the RARE technique. Magn Reson Imaging. 1988;6:391–395. doi: 10.1016/0730-725x(88)90475-4. [DOI] [PubMed] [Google Scholar]
- Moffett JR, Ross B, Arun P, Madhavarao CN, Namboodiri AM. N-Acetylaspartate in the CNS: from neurodiagnostics to neurobiology. Prog Neurobiol. 2007;81:89–131. doi: 10.1016/j.pneurobio.2006.12.003. [DOI] [PMC free article] [PubMed] [Google Scholar]
- Howe CL, Ure D, Adelson JD, Lafrance-Corey R, Johnson A, Rodriguez M. CD8+ T cells directed against a viral peptide contribute to loss of motor function by disrupting axonal transport in a viral model of fulminant demyelination. J Neuroimmunol. 2007;188:13–21. doi: 10.1016/j.jneuroim.2007.04.005. [DOI] [PMC free article] [PubMed] [Google Scholar]
- Rogalinska M. Alterations in cell nuclei during apoptosis. Cell Mol Biol Lett. 2002;7:995–1018. [PubMed] [Google Scholar]
- Nagata S, Nagase H, Kawane K, Mukae N, Fukuyama H. Degradation of chromosomal DNA during apoptosis. Cell Death Differ. 2003;10:108–116. doi: 10.1038/sj.cdd.4401161. [DOI] [PubMed] [Google Scholar]
- Al-Abdulla NA, Martin LJ. Apoptosis of retrogradely degenerating neurons occurs in association with the accumulation of perikaryal mitochondria and oxidative damage to the nucleus. Am J Pathol. 1998;153:447–456. doi: 10.1016/S0002-9440(10)65588-5. [DOI] [PMC free article] [PubMed] [Google Scholar]
- Kasai H, Nishimura S. Hydroxylation of deoxyguanosine at the C-8 position by ascorbic acid and other reducing agents. Nucleic Acids Res. 1984;12:2137–2145. doi: 10.1093/nar/12.4.2137. [DOI] [PMC free article] [PubMed] [Google Scholar]
- Stefanis L. Caspase-dependent and -independent neuronal death: two distinct pathways to neuronal injury. Neuroscientist. 2005;11:50–62. doi: 10.1177/1073858404271087. [DOI] [PubMed] [Google Scholar]
- Siegel RM. Caspases at the crossroads of immune-cell life and death. Nat Rev Immunol. 2006;6:308–317. doi: 10.1038/nri1809. [DOI] [PubMed] [Google Scholar]
- Yamashima T. Implication of cysteine proteases calpain, cathepsin and caspase in ischemic neuronal death of primates. Prog Neurobiol. 2000;62:273–295. doi: 10.1016/s0301-0082(00)00006-x. [DOI] [PubMed] [Google Scholar]
- Fettucciari K, Fetriconi I, Mannucci R, Nicoletti I, Bartoli A, Coaccioli S, Marconi P. Group B streptococcus induces macrophage apoptosis by calpain activation. J Immunol. 2006;176:7542–7556. doi: 10.4049/jimmunol.176.12.7542. [DOI] [PubMed] [Google Scholar]
- Sung J-Y, Goo J-S, Lee D-E, Jin D-Q, Bizon JL, Gallagher M, Han J-S. Learning strategy selection in the water maze and hippocampal CREB phosphorylation differ in two inbred strains of mice. Learn Mem. 2008;15:183–188. doi: 10.1101/lm.783108. [DOI] [PMC free article] [PubMed] [Google Scholar]
- Nicolle MM, Prescott S, Bizon JL. Emergence of a cue strategy preference on the water maze task in aged C57B6 × SJL F1 hybrid mice. Learn Mem. 2003;10:520–524. doi: 10.1101/lm.64803. [DOI] [PMC free article] [PubMed] [Google Scholar]
- Chalhub EG, Devivo DC, Siegel BA, Gado MH, Feigin RD. Coxsackie A9 focal encephalitis associated with acute infantile hemiplegia and porencephaly. Neurology. 1977;27:574–579. doi: 10.1212/wnl.27.6.574. [DOI] [PubMed] [Google Scholar]
- Wakamoto H, Ohta M, Nakano N, Kunisue K. SPECT in focal enterovirus encephalitis: evidence for local cerebral vasculitis. Pediatr Neurol. 2000;23:429–431. doi: 10.1016/s0887-8994(00)00206-x. [DOI] [PubMed] [Google Scholar]
- Anonymous Coxsackie-virus encephalitis. Lancet. 1968;291:516. [PubMed] [Google Scholar]
- Farmer K, MacArthur BA, Clay MM. A follow-up study of 15 cases of neonatal meningoencephalitis due to Coxsackie virus B5. J Pediatr. 1975;87:568–571. doi: 10.1016/s0022-3476(75)80823-7. [DOI] [PubMed] [Google Scholar]
- Brunner J, Litwicki A, Aliani S, Gartner B. Coxsackie virus B 4 encephalitis in a 7 year old boy. Klin Padiatr. 2004;216:297–299. doi: 10.1055/s-2004-822636. [DOI] [PubMed] [Google Scholar]
- Hammond GW, MacDougall BK, Plummer F, Sekla LH. Encephalitis during the prodromal stage of acute hepatitis A. Can Med Assoc J. 1982;126:269–270. [PMC free article] [PubMed] [Google Scholar]
- Davis LE, Brown JE, Robertson BH, Khanna B, Polish LB. Hepatitis A post-viral encephalitis. Acta Neurol Scand. 1993;87:67–69. doi: 10.1111/j.1600-0404.1993.tb04078.x. [DOI] [PubMed] [Google Scholar]
- Breningstall GN, Belani KK. Acute transverse myelitis and brainstem encephalitis associated with hepatitis A infection. Pediatr Neurol. 1995;12:169–171. doi: 10.1016/0887-8994(94)00153-s. [DOI] [PubMed] [Google Scholar]
- Modlin JF. Update on enterovirus infections in infants and children. Adv Pediatr Infect Dis. 1996;12:155–180. [PubMed] [Google Scholar]
- Lipton HL, Friedmann A, Sethi P, Crowther JR. Characterization of Vilyuisk virus as a picornavirus. J Med Virol. 1983;12:195–203. doi: 10.1002/jmv.1890120305. [DOI] [PubMed] [Google Scholar]
- Tong CY, Potter FA, Pang KA, Vora J. Severe encephalitis with rapid recovery. Lancet. 1997;349:470. doi: 10.1016/s0140-6736(96)09320-8. [DOI] [PubMed] [Google Scholar]
- Lum LC, Chua KB, McMinn PC, Goh AY, Muridan R, Sarji SA, Hooi PS, Chua BH, Lam SK. Echovirus 7 associated encephalomyelitis. J Clin Virol. 2002;23:153–160. doi: 10.1016/s1386-6532(01)00214-1. [DOI] [PubMed] [Google Scholar]
- Huang QS, Carr JM, Nix WA, Oberste MS, Kilpatrick DR, Pallansch MA, Croxson MC, Lindeman JA, Baker MG, Grimwood K. An echovirus type 33 winter outbreak in New Zealand. Clin Infect Dis. 2003;37:650–657. doi: 10.1086/376915. [DOI] [PubMed] [Google Scholar]
- Valcour V, Haman A, Cornes S, Lawall C, Parsa AT, Glaser C, Yagi S, Tihan T, Bhatnagar J, Geschwind M. A case of enteroviral meningoencephalitis presenting as rapidly progressive dementia. Nat Clin Pract Neurol. 2008;4:399–403. doi: 10.1038/ncpneuro0804. [DOI] [PMC free article] [PubMed] [Google Scholar]
- Acharya VZ, Talwar D, Elliott SP. Enteroviral encephalitis leading to a locked-in state. J Child Neurol. 2001;16:864–866. doi: 10.1177/08830738010160111403. [DOI] [PubMed] [Google Scholar]
- Joki-Korpela P, Hyypia T. Parechoviruses, a novel group of human picornaviruses. Ann Med. 2001;33:466–471. doi: 10.3109/07853890109002095. [DOI] [PubMed] [Google Scholar]
- Kupila L, Vuorinen T, Vainionpaa R, Hukkanen V, Marttila RJ, Kotilainen P. Etiology of aseptic meningitis and encephalitis in an adult population. Neurology. 2006;66:75–80. doi: 10.1212/01.wnl.0000191407.81333.00. [DOI] [PubMed] [Google Scholar]
- Hughes AL. Phylogeny of the Picornaviridae and differential evolutionary divergence of picornavirus proteins. Infect Genet Evol. 2004;4:143–152. doi: 10.1016/j.meegid.2004.03.001. [DOI] [PubMed] [Google Scholar]
- Chiu CY, Greninger AL, Kanada K, Kwok T, Fischer KF, Runckel C, Louie JK, Glaser CA, Yagi S, Schnurr DP, Haggerty TD, Parsonnet J, Ganem D, Derisi JL. Identification of cardioviruses related to Theiler’s murine encephalomyelitis virus in human infections. Proc Natl Acad Sci USA. 2008;105:14124–14129. doi: 10.1073/pnas.0805968105. [DOI] [PMC free article] [PubMed] [Google Scholar]
- Mendez-Fernandez YV, Hansen MJ, Rodriguez M, Pease LR. Anatomical and cellular requirements for the activation and migration of virus-specific CD8+ T cells to the brain during Theiler’s virus infection. J Virol. 2005;79:3063–3070. doi: 10.1128/JVI.79.5.3063-3070.2005. [DOI] [PMC free article] [PubMed] [Google Scholar]
- Mendez-Fernandez YV, Johnson AJ, Rodriguez M, Pease LR. Clearance of Theiler’s virus infection depends on the ability to generate a CD8+ T cell response against a single immunodominant viral peptide. Eur J Immunol. 2003;33:2501–2510. doi: 10.1002/eji.200324007. [DOI] [PubMed] [Google Scholar]
- Dethlefs S, Brahic M, Larsson-Sciard EL. An early, abundant cytotoxic T-lymphocyte response against Theiler’s virus is critical for preventing viral persistence. J Virol. 1997;71:8875–8878. doi: 10.1128/jvi.71.11.8875-8878.1997. [DOI] [PMC free article] [PubMed] [Google Scholar]
- Lindsley MD, Thiemann R, Rodriguez M. Cytotoxic T cells isolated from the central nervous systems of mice infected with Theiler’s virus. J Virol. 1991;65:6612–6620. doi: 10.1128/jvi.65.12.6612-6620.1991. [DOI] [PMC free article] [PubMed] [Google Scholar]
- Paya CV, Patick AK, Leibson PJ, Rodriguez M. Role of natural killer cells as immune effectors in encephalitis and demyelination induced by Theiler’s virus. J Immunol. 1989;143:95–102. [PubMed] [Google Scholar]
- Nargi-Aizenman JL, Havert MB, Zhang M, Irani DN, Rothstein JD, Griffin DE. Glutamate receptor antagonists protect from virus-induced neural degeneration. Ann Neurol. 2004;55:541–549. doi: 10.1002/ana.20033. [DOI] [PubMed] [Google Scholar]
- Rempel JD, Quina LA, Blakely-Gonzales PK, Buchmeier MJ, Gruol DL. Viral induction of central nervous system innate immune responses. J Virol. 2005;79:4369–4381. doi: 10.1128/JVI.79.7.4369-4381.2005. [DOI] [PMC free article] [PubMed] [Google Scholar]
- Zhou J, Stohlman SA, Hinton DR, Marten NW. Neutrophils promote mononuclear cell infiltration during viral-induced encephalitis. J Immunol. 2003;170:3331–3336. doi: 10.4049/jimmunol.170.6.3331. [DOI] [PubMed] [Google Scholar]
- Schaumburg CS, Held KS, Lane TE. Mouse hepatitis virus infection of the CNS: a model for defense, disease, and repair. Front Biosci. 2008;13:4393–4406. doi: 10.2741/3012. [DOI] [PMC free article] [PubMed] [Google Scholar]
- Lundberg P, Ramakrishna C, Brown J, Tyszka JM, Hamamura M, Hinton DR, Kovats S, Nalcioglu O, Weinberg K, Openshaw H, Cantin EM. The immune response to herpes simplex virus type 1 infection in susceptible mice is a major cause of central nervous system pathology resulting in fatal encephalitis. J Virol. 2008;82:7078–7088. doi: 10.1128/JVI.00619-08. [DOI] [PMC free article] [PubMed] [Google Scholar]
- Andrews DM, Matthews VB, Sammels LM, Carrello AC, McMinn PC. The severity of Murray valley encephalitis in mice is linked to neutrophil infiltration and inducible nitric oxide synthase activity in the central nervous system. J Virol. 1999;73:8781–8790. doi: 10.1128/jvi.73.10.8781-8790.1999. [DOI] [PMC free article] [PubMed] [Google Scholar]
- Holland JJ, Domingo E, de la Torre JC, Steinhauer DA. Mutation frequencies at defined single codon sites in vesicular stomatitis virus and poliovirus can be increased only slightly by chemical mutagenesis. J Virol. 1990;64:3960–3962. doi: 10.1128/jvi.64.8.3960-3962.1990. [DOI] [PMC free article] [PubMed] [Google Scholar]
- de la Torre JC, Giachetti C, Semler BL, Holland JJ. High frequency of single-base transitions and extreme frequency of precise multiple-base reversion mutations in poliovirus. Proc Natl Acad Sci USA. 1992;89:2531–2535. doi: 10.1073/pnas.89.7.2531. [DOI] [PMC free article] [PubMed] [Google Scholar]
- Pariente N, Airaksinen A, Domingo E. Mutagenesis versus inhibition in the efficiency of extinction of foot-and-mouth disease virus. J Virol. 2003;77:7131–7138. doi: 10.1128/JVI.77.12.7131-7138.2003. [DOI] [PMC free article] [PubMed] [Google Scholar]
- Dufresne AT, Gromeier M. Understanding polio: new insights from a cold virus. Microbe. 2006;1:13–18. [Google Scholar]
- Rieder E, Gorbalenya AE, Xiao C, He Y, Baker TS, Kuhn RJ, Rossmann MG, Wimmer E. Will the polio niche remain vacant? Dev Biol (Basel) 2001;105:111–122. discussion 149–150. [PubMed] [Google Scholar]


