

Abstract
Structures formed by single-strand DNA have become increasingly interesting because of their roles in a number of biological processes, particularly transcription and its regulation. Of particular importance is the fact that antitumor drugs such as Actinomycin D can selectively bind DNA hairpins over fully paired, double-strand DNA. A new fluorescent base analog, pyrrolo-deoxycytidine (PdC), can now be routinely incorporated into single-strand DNA. The fluorescence of PdC is particularly useful for studying the formation of single-strand DNA in regions of double-strand DNA. The fluorescence is quenched when PdC is paired with a complementary guanine residue, and thus is greatly enhanced upon formation of single-strand DNA. Hence, any process that results in melting or opening of DNA strands produces an increase in the fluorescence intensity of this base analog. In this study we measured the structural effects of incorporating PdC into DNA hairpins, and the effect of this incorporation on the binding of the hairpins by a fluorescent analog of the drug Actinomycin D. Two hairpin DNAs were used: one with PdC in the stem (basepaired) and one with PdC in the loop (unpaired). The thermal stability, 7-aminoactinomycin D binding, and three-dimensional structures of PdC incorporated into these DNA hairpins were all quite similar as compared to the hairpins containing an unmodified dC residue. Fluorescence lifetime measurements indicate that two lifetimes are present in PdC, and that the increase in fluorescence of the unpaired PdC residue compared to the basepaired PdC is due to an increase in the contribution of the longer lifetime to the average fluorescence lifetime. Our data indicate that PdC can be used effectively to differentiate paired and unpaired bases in DNA hairpin secondary structures, and should be similarly applicable for related structures such as cruciforms and quadruplexes. Further, our data indicate that PdC can act as a fluorescence resonance energy transfer donor for the fluorescent drug 7-aminoactinomycin D.
Introduction
It is now well established that certain sequences of DNA can adopt secondary structures quite distinct from typical Watson-Crick duplex DNA. These secondary structures include hairpins, cruciforms, and quadruplex structures (for review see Wadkins (1) and Kouzine and Levens (2)). Hairpins and cruciforms are known to form in regulatory regions of genes, such as promoters, enhancers, and terminators, and are also present during replication (3). Hairpins are known to form unusually high-affinity binding sites for small molecules, particularly the antitumor agent actinomycin D (4–8). Quadruplexes are found at the termini of chromosomes and are thought to play a role in the stabilization of telomeric DNA and its binding to the enzyme telomerase (9,10). Agents that target telomeric quadruplexes are thought to be potential antitumor agents (11,12). Quadruplexes have also been identified in promoters of specific genes, such as c-MYC (13–15), and agents that bind quadruplex DNA can affect transcription of genes regulated by these promoters. Hence, the structural properties of DNA secondary structures are important for our understanding of the biological role of these forms of DNA and their potential as drug targets.
The formation of secondary structures requires that the normally basepaired DNA strands come apart to let one or both individual strands fold back upon itself. This process is similar to what occurs when a RNA polymerase binds to DNA and induces melting of strands. In recent years, a tool for monitoring such melting of DNA has been developed. The cytidine analog pyrrolo-deoxycytidine (PdC; Fig. 1) has been incorporated into synthetic DNA strands via standard solid-state synthesis. PdC is useful because it can basepair with guanine and also possesses an intrinsic fluorophore (16). The fluorescence of PdC is partially quenched when basepaired to its complement, and this quenching is eliminated when the analog is unpaired. The change in fluorescence intensity of PdC has been used to examine the movement of T7 RNA polymerase along oligomeric DNA (17) and to measure the kinetics of DNA repair by O 6-alkylguanine-DNA alkyltransferase (18).
Figure 1.
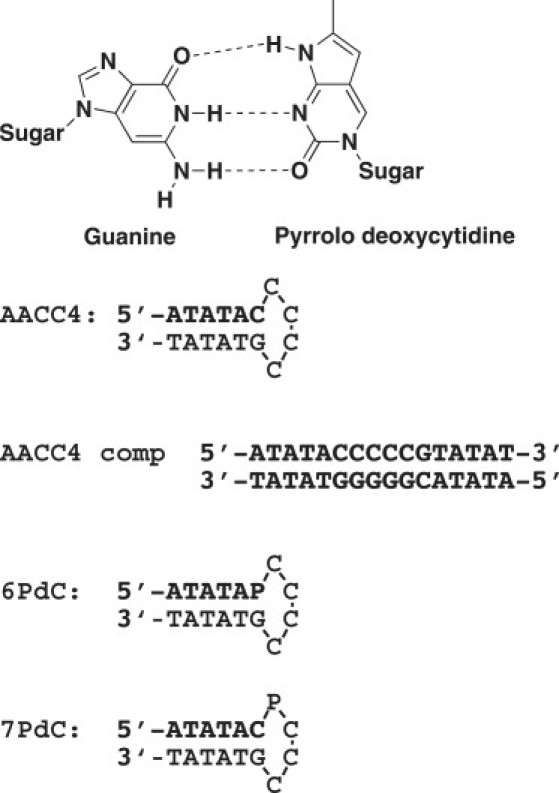
DNA hairpin sequences and the structure of the PdC used in the experiment. The PdC incorporated into the hairpins is indicated by “P”.
In our earlier studies of DNA hairpins as targets for drug binding, we created a series of oligonucleotides that folded into hairpins with a consistent stem and variable loop composition (6). Subsequently, we began to use similar hairpins containing PdC to probe for formation of hairpins in larger ranges of duplex DNA. To understand the structural effects, thermodynamics, and spectroscopic effects of PdC in various DNA loci, we examined two different hairpins, named 6PdC and 7PdC (Fig. 1), that contain a paired PdC in the stem and an unpaired PdC in the loop, respectively. We examined the fluorescence spectroscopic properties of PdC in both locations using both steady-state and lifetime measurements. We also demonstrate that PdC can act as a fluorescence resonance energy transfer (FRET) donor when the fluorescent 7-aminoactinomycin D (7AAMD) is bound to the hairpin loop and can act as an acceptor. We measured the thermodynamic effects of PdC incorporation by examining the melting of the hairpins in buffers of different ionic strengths. Finally, for 6PdC, we used nuclear magnetic resonance (NMR) data to derive the three-dimensional (3D) structure of the hairpin with a PdC paired with its complementary guanine residue. Our data indicate that PdC only trivially affects DNA structure, whether paired or unpaired, and provides a powerful tool for examining the process whereby duplex DNA is in equilibrium with DNA secondary structures.
Materials and Methods
Oligonucleotides and chemicals
The sequences of AACC4, 6PdC, and 7PdC are shown in Fig. 1. All DNA sequences, including those with PdC substitutions, were obtained from the Midland Certified Reagent Company (Midland, TX). They were synthesized by standard solid-phase methods and purified using gel filtration. DNAs were dissolved in Tris buffer (10 mM) containing 1 mM EDTA, pH 8.0 (TE buffer), and stored at 4°C when not in use. 7AAMD was purchased from Sigma Chemical Co. (St. Louis, MO) and used without further purification. It was dissolved in DMSO and stored at −20°C.
Melting curves
The 6PdC and 7PdC (hairpin DNA) containing the modified bases were heated in a Cary Bio-100 UV-visible spectrophotometer (Varian Medical Systems, Palo Alto, CA). The melting temperatures were the midpoint of the transition and were measured as a function of added NaCl. Unmodified DNA (AACC4, containing dC instead of PdC) was used for comparison. DNAs from this family of sequences were previously confirmed to be hairpins via concentration effects on melting (6,19). Further, the hairpin conformation (as opposed to self-complementary duplexes) was confirmed for all three DNA used here under our experimental conditions by nondenaturing polyacrylamide gel electrophoresis (data not shown). Results of these studies are shown in Fig. 2.
Figure 2.
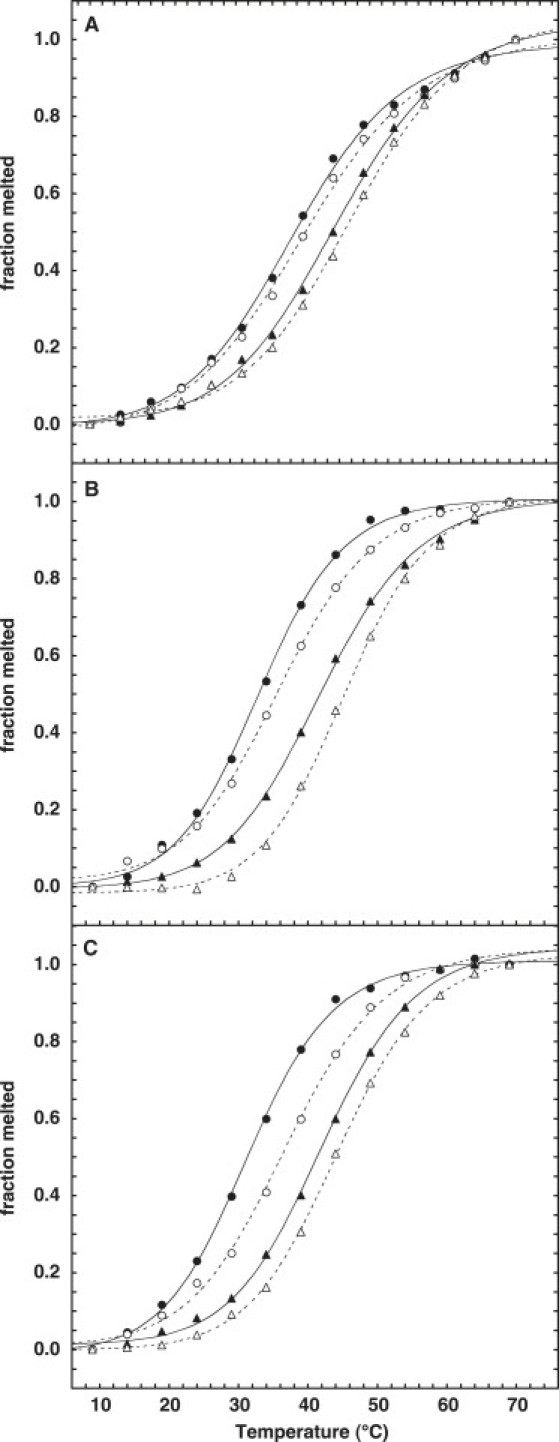
Melting of DNA hairpins (A) 6PdC, (B) 7PdC, and (C) AACC4 in (•) 5 mM, (○) 20 mM, (▴) 50 mM, and (▵) 100 mM NaCl.
Time-resolved fluorescence
The fluorescence lifetimes of PdC in various conformations were determined using an ISS K2 multifrequency cross-correlation phase and modulation fluorescence spectrometer equipped with excitation and emission monochromators. In the phase-modulation measurements, the sample is excited with sinusoidally modulated light. The emission is delayed in phase by an angle ϕ, but at the same frequency as the excitation. In this experiment, the phase angle ϕ and demodulation factor m were measured simultaneously and used to calculate the lifetime τ (20).
The lifetime measurements were made using a solution of dimethyl POPOP in absolute ethanol as a reference (lifetime of 1.45 ns) at 298 K (room temperature). Samples were excited at 350 nm and emissions were collected with a >400 nm long-pass filter. The modulation frequencies were between 10 and 160 MHz. The concentrations of hairpin or duplex DNA in the samples were 13 μM. The lifetime was determined by fits to the data using the ISS 187 Decay Analysis software and these are recorded in Table 2.
Table 2.
Fluorescence lifetimes (ns) of PdC as a function of Na+ concentration
| [Na+] | 6PdC | f | 6PdC_comp | f | 7PdC | f | 7PdC_comp | f | |
|---|---|---|---|---|---|---|---|---|---|
| 0.002 M | τ1 | 1.44 ± 0.09 | 0.37 | 1.34 ± 0.07 | 0.64 | 2.81 ± 0.08 | 0.60 | 1.25 ± 0.1 | 0.54 |
| τ2 | 6.61 ± 0.16 | 0.63 | 6.33 ± 0.39 | 0.36 | 9.24 ± 0.33 | 0.40 | 7.24 ± 0.4 | 0.44 | |
| 0.022 M | τ1 | 1.45 ± 0.14 | 0.44 | 1.31 ± 0.05 | 0.62 | 2.83 ± 0.12 | 0.48 | 1.22 ± 0.1 | 0.56 |
| τ2 | 6.76 ± 0.26 | 0.56 | 6.36 ± 0.29 | 0.38 | 9.35 ± 0.51 | 0.52 | 7.35 ± 0.45 | 0.43 | |
| 0.042 M | τ1 | 1.38 ± 0.15 | 0.41 | 1.35 ± 0.06 | 0.64 | 2.82 ± 0.1 | 0.49 | 1.20 ± 0.08 | 0.54 |
| τ2 | 6.59 ± 0.39 | 0.58 | 6.39 ± 0.29 | 0.35 | 9.27 ± 0.38 | 0.50 | 7.29 ± 0.29 | 0.43 | |
| 0.062 M | τ1 | 1.47 ± 0.07 | 0.47 | 1.28 ± 0.05 | 0.64 | 2.79 ± 0.1 | 0.51 | 1.20 ± 0.07 | 0.56 |
| τ2 | 6.88 ± 0.16 | 0.52 | 6.22 ± 0.22 | 0.35 | 9.24 ± 0.47 | 0.48 | 7.42 ± 0.37 | 0.42 | |
| 0.082 M | τ1 | 1.40 ± 0.05 | 0.48 | 1.32 ± 0.06 | 0.66 | 2.71 ± 0.18 | 0.52 | 1.20 ± 0.07 | 0.57 |
| τ2 | 6.90 ± 0.12 | 0.51 | 6.39 ± 0.27 | 0.34 | 9.25 ± 0.7 | 0.47 | 7.52 ± 0.4 | 0.41 | |
| 0.102 M | τ1 | 1.36 ± 0.06 | 0.47 | 1.30 ± 0.05 | 0.65 | 2.72 ± 0.12 | 0.53 | 1.23 ± 0.11 | 0.58 |
| τ2 | 6.78 ± 0.17 | 0.51 | 6.30 ± 0.24 | 0.34 | 9.26 ± 0.47 | 0.47 | 7.65 ± 0.4 | 0.39 | |
Averages and standard deviations are from 10 separate determinations.
Titration curves
Binding of 7AAMD to the native and modified hairpins was achieved by titrations of 7AAMD with DNA, and of DNA with 7AAMD. The binding was monitored by changes in 7AAMD emission upon binding, as we previously reported (4–8). The steady-state emission spectra were collected between 520 nm and 750 nm using an excitation wavelength of 450 nm on a Horiba FluorMax-3 spectrometer (Horiba, Kyoto, Japan). A typical plot of the titration of 7AAMD with DNA is shown in Fig. 3. The concentration of 7AAMD was fixed at 0.5 μM in a total volume of 3000 μL of 10 mM Tris-HCl, 1 mM EDTA, pH 8.0, 25°C. The stock concentration of hairpins 6PdC and 7PdC used for titration were 328.4 μM and 334.7 μM, respectively. The stock concentration of hairpin AACC4 and its complementary duplex AACC4_comp (double-stranded DNA; Fig. 1) were 215.4 μM and 107.7μM, respectively. The DNA was added into the cuvette in 10 μL increments and the emission spectra were recorded. The fluorescence intensity of free 7AAMD at 620 nm was defined as F 0, and changes at this wavelength after addition of DNA was defined as F. Titration data were recorded as ΔF/F 0, where ΔF is the difference in fluorescence at each DNA concentration from F 0, the initial fluorescence of the 7AAMD. We also used the intense change in fluorescence shown in Fig. 3 to calculate binding constants for 7AAMD and our DNAs by adding a stock solution of 1 μM 7AAMD under the same conditions above to a cuvette containing 1.0 μM DNA in 3000 μL of buffer (shown in Fig. 4). Both methods gave identical binding constants for the DNA-7AAMD complexes.
Figure 3.
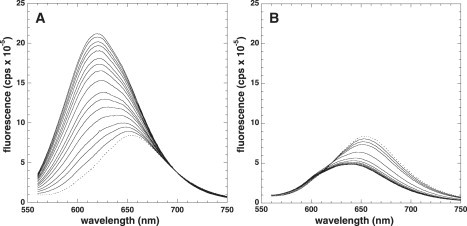
Change in fluorescence of 7AAMD upon addition of DNA. Dotted lines represent the initial fluorescence intensity of the 7AAMD alone. Subsequent solid lines indicate additions of (A) 6PdC hairpin DNA or (B) 6PdC in a double-strand complex with its complementary strand (6PdC_comp). Note that with double-strand DNA, the 7AAMD fluorescence is quenched upon binding.
Figure 4.
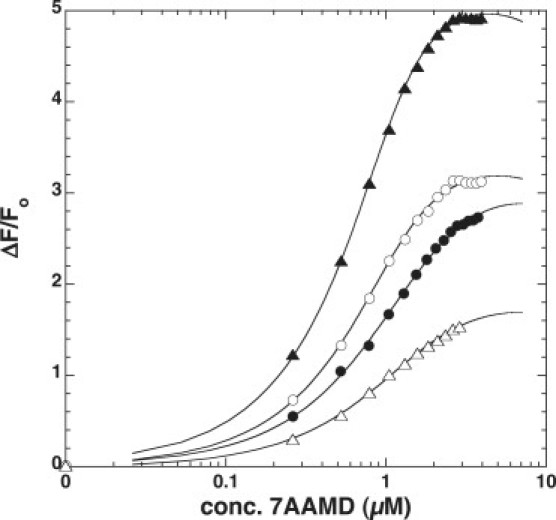
Binding of 7AAMD to DNA hairpins. Titration curves are shown for the addition of 7AAMD to (▴) AACC4, (○) 7PdC, (•) 6PdC, and (▵) the duplex DNA of AACC4 and its complementary strand AACC4_comp. The values of Kd determined from the fits are recorded in Table 2.
Fluorescence changes were fitted to the simple noninteracting site model of mass action. This model assumes that a ligand (L) binds to a DNA site (D) according to:
| (1) |
with a dissociation constant Kd = ([L][D])/[LD]. The values [L], [D], and [LD] are molar concentrations of the free ligand, free DNA sites, and ligand-bound DNA sites, respectively. The number of sites per DNA strand is given by:
| (2) |
where [D]o is the concentration of DNA in strands or duplex, and n is the number of sites per DNA. Fitting of data to the above model was done using the nonlinear least-squares function of Kaleidagraph (Synergy Software, Reading, PA) with Kd and ΔF max/Fo as adjustable parameters. The value of n was fixed at 1.0 because there is only one dG residue per hairpin and this dG is a requirement for 7AAMD binding (6). Titrations were performed in quadruplicate, and the computed values of Kd are reported in Table 1.
Table 1.
Dissociation constants for the binding of 7AAMD to the DNAs shown in Fig. 1
| DNA | Kd (μM) |
|---|---|
| AACC4 | 0.10 ± 0.09 |
| 7PdC | 0.31 ± 0.10 |
| 6PdC | 0.46 ± 0.15 |
| AACC4_comp | 0.57 ± 0.21 |
Data shown are for titration of a dilute solution of each DNA with a stock solution of 7AAMD. Averages and standard deviations given are for four separate determinations.
FRET
Measurements were performed to determine PdC's effectiveness as a FRET donor to the FRET-acceptor 7AAMD. The steady-state excitation and emission spectra for PdC and 7AAMD are shown in Fig. 5. There is good overlap between the emission band of PdC and the excitation band of 7AAMD. The emission spectra of PdC were therefore monitored from 400 to 550 nm as a function of added 7AAMD using an excitation wavelength of 350 nm (where 7AAMD absorbs little). FRET was determined by the decrease in PdC fluorescence. A 7AAMD (stock of 78.5 μM) was added to a fixed concentration of 1 μM 6PdC or 7PdC in 10 mM Tris-HCl, 1 mM EDTA, pH 8.0, 25°C. The background emission of PdC was subtracted from all fluorescence spectra. These data also allowed for the construction of titration curves based on quenching of the PdC fluorescence at 455 nm ( Fig. 6). These were calculated as described above and the resulting Kd values were equivalent to those in Table 1 determined by monitoring increases in 7AAMD fluorescence.
Figure 5.
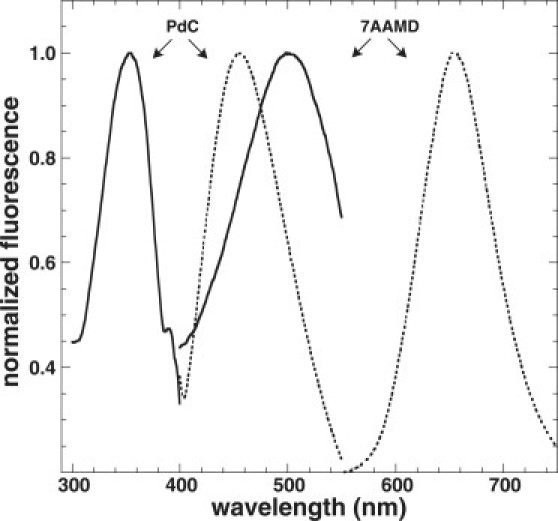
Steady-state spectra for the FRET donor (6PdC) and acceptor (7AAMD). The excitation spectra are indicated by solid lines, and the emission spectra are indicated by dashed lines. Note the overlap between PdC emission and 7AAMD excitation, which makes them candidates for FRET donor-acceptor pairs.
Figure 6.
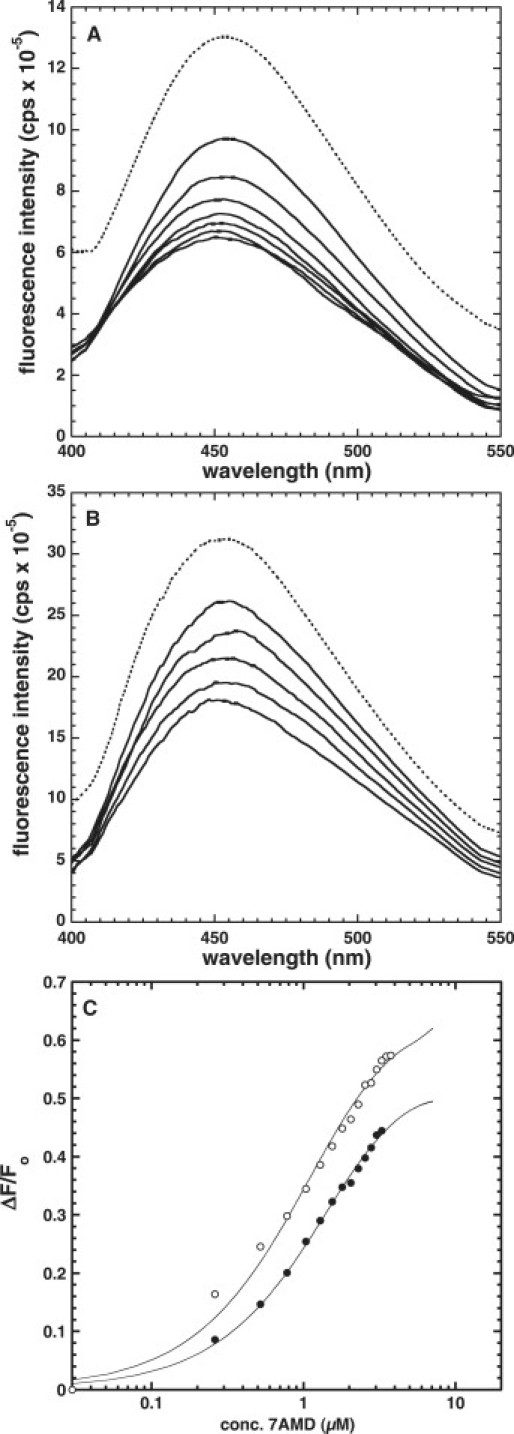
Quenching of PdC fluorescence upon addition of 7AAMD. The spectra were collected with excitation wavelength at 345 nm. The initial fluorescence of 6PdC (A) and 7PdC (B) is shown as dashed lines, whereas solid lines indicate a decrease in fluorescence. Titration curves derived from the data are shown in C for (•) 6PdC and (○) 7PdC. Fitting of these titration curves gives values for Kd identical to those recorded in Table 2.
Solution structure of 6PdC
A 3D structure of the 6PdC hairpin was determined using a combination of NMR data and molecular modeling. NMR spectroscopy was performed using a Bruker DRX-500 instrument (Bruker, Billerica, MA) equipped with a 5 mm QNP probe. The DNA sample was dissolved in a H2O/D2O (5:95, v:v) solution containing 10 mM Tris-HCl and 1 mM EDTA, pH 7.5. The concentration of 6PdC used was 0.25 mM. The 2D nuclear Overhauser enhancement spectroscopy (NOESY) spectra of nonexchangeable protons were collected at room temperature in phase-sensitive mode using 2048 complex points in t 2 and 256 in t 1. Four mixing times of 100 ms, 200 ms, 300 ms and 500 ms, with a relaxation delay between scans of 5 s, were used in the NOESY experiments. A water presuppression pulse sequence with a maximum excitation center at 4.71 ppm was used in all 2D NOESY experiments. All relevant nonexchangeable protons of 6PdC, except for 3′ and 4′ protons, were assigned by routine sequential assignment procedures. The NMR data were processed and analyzed using the SPARKY program (21). Nonexchangeable interproton distances were derived using the equation:
| (3) |
The volumes of NOE cross peaks were integrated using SPARKY. The volumes of H1′–H2′ cross peaks were used as the references volumes and the distance of H1′–H2′ was used as the reference distance because the H1′–H2′ distance of the deoxyribose ring is largely independent of the sugar conformation (2.1Å). Results are given in Tables 3 and 4.
Table 3.
Proton resonance assignments (chemical shift in ppm) for the 6PdC hairpin
| base | H2, 8/H6 | H5/H1′ | CH3 | H2′/H2″ | H4′/H5′, 5″ |
|---|---|---|---|---|---|
| A1 | 8.041 | 6.095 | NA | 2.558/2.717 | 3.676/3.98/4.148 |
| T2 | 7.289 | 5.593 | 1.320 | 2.083/2.386 | 4.017/4.120 |
| A3 | 8.218 | 6.163 | NA | 2.569/2.815 | 4.02/4.06/4.124 |
| T4 | 7.042 | 5.584 | 1.299 | 1.876/2.278 | 4.053/4.155 |
| A5 | 7.954 | 6.172 | NA | 2.293/2.426 | 4.125/4.267 |
| PdC6 | 7.953 | 5.446 | 1.823 | 1.936/2.625 | 4.028/4.109 |
| C7 | 7.686 | 6.016 | NA | 1.971/2.36 | 4.098/4.141 |
| C8 | 7.648 | 5.976 | NA | 1.887/2.266 | 3.934/4.395 |
| C9 | 7.372 | 5.642 | NA | 1.756/2.212 | 3.672/4.397 |
| C10 | 7.952 | 5.745 | NA | 2.548/2.629 | 4.011/4.046 |
| G11 | 7.908 | 5.960 | NA | 2.538/2.802 | 3.968 |
| T12 | 7.178 | 5.724 | 1.444 | 2.067/2.454 | 4.086/4.162 |
| A13 | 8.208 | 6.120 | NA | 2.544/2.765 | 4.081 |
| T14 | 7.039 | 5.576 | 1.348 | 1.846/2.257 | 4.053/4.155 |
| A15 | 8.109 | 6.140 | NA | 2.575/2.773 | 4.051/4.14/4.282 |
| T16 | 7.143 | 5.968 | 1.363 | 2.013/2.595 | 3.908/4.386 |
Table 4.
Interproton distances for the 6PdC hairpin derived from NOE data
| H2/H6/H8-H1′/H5 | H2/H6/H8-T(CH3) | H2/H6/H8-H2′/H2″ | H2/H6/H8- H2/H6/H8- | H2′/H2″-H1′/H5 | |
|---|---|---|---|---|---|
| T2-A1 | 3.18 | 4.01 | 3.70 | ||
| 3.40 | |||||
| A3-T2 | 3.75 | 2.85 | |||
| 2.66 | |||||
| T4-A3 | 3.92 | 3.72 | 3.29 | ||
| 3.24 | |||||
| A5-T4 | 4.33 | 2.32 | |||
| 2.87 | |||||
| C6-A5 | 3.86 | 2.87 | 4.92 | 2.92 | |
| 3.24 | 2.75 | ||||
| C7-C6 | 4.20 | 2.71 | 2.86 | ||
| 3.10 | 2.79 | ||||
| C8-C7 | 3.73 | 3.18 | 3.18 | ||
| 2.91 | 2.70 | ||||
| C9-C8 | 5.34 | 3.16 | 2.81 | ||
| 3.45 | 2.13 | ||||
| C10-C9 | 3.01 | 3.94 | |||
| 2.40 | |||||
| G11-C10 | 3.60 | 4.15 | |||
| 1.94 | |||||
| T12-G11 | 3.64 | 3.60 | 4.44 | ||
| 3.61 | |||||
| A13-T12 | 3.74 | 3.86 | 4.78 | ||
| 3.28 | |||||
| T14-A13 | 3.14 | 3.92 | 3.40 | ||
| 3.29 | |||||
| A15-T14 | 4.63 | 3.02 | 4.93 | ||
| 2.90 | |||||
| T16-A15 | 3.68 | 3.85 | 3.09 | 4.28 | |
| 1.74 |
To build a 3D model, the starting structure of 6PdC was built with INSIGHT II software followed by energy minimization using AMBER 8. The parameters and charges for each atom were assigned using the antechamber module of AMBER 8. The naming and numbering convention used for atoms was that given by Thompson and Miyake (22). After energy minimization, the structure was further refined by molecular dynamics (MD) with NMR-derived interproton distance constraints. A 100 ps MD calculation was performed. Snapshots were taken every 5 ps. The resulting structures ( Fig. 7 A) and the average structure over the time course (Fig. 7 B) are shown. The distance constraints used and the molecular modeling parameters needed to use the PdC residue within AMBER are available in the Supporting Material.
Figure 7.
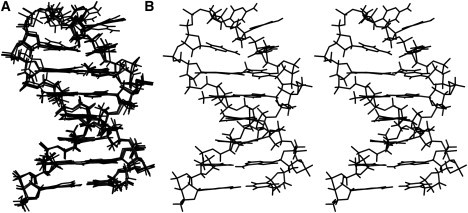
The NMR-restrained structure of 6PdC. The 20 snapshot structures taken during a 100 ps MD simulation are shown in panel A. The average structure from the simulation is shown as a stereo pair in B. This figure was generated using Molscript (26) and Raster3D (27).
Results and Discussion
Melting curves
The temperature dependence of DNA absorbance at 260 nm is shown in Fig. 2 at four different Na+ concentrations. Melting curves for 6PdC, 7PdC, and the unmodified hairpin AACC4 are shown in Fig. 2, A–C, respectively. Having the PdC in the loop of the hairpin (7PdC) results in behavior almost identical to that seen with the parent AACC4. We interpret this to mean that the PdC has essentially no interactions with adjacent bases in this structure. When PdC is present in the stem (6PdC), there is a slight change in the melting behavior of the hairpins, inasmuch as the melting range over the 4 Na+ concentrations is 9°C vs. 12–13°C for the other two hairpins. We interpret this as an effect of the methyl group of the PdC residue as that methyl group sticks into the effective major groove of the hairpin (Fig. 7), displacing water and ions needed for helix stability. Although Tris buffer was used for comparison with ligand binding assays, the pH range during melting remains close to physiological. Overall, the thermodynamic perturbation of PdC incorporation is rather mild, suggesting that the PdC does not distort the structure of the DNA to any large extent.
Time-resolved fluorescence
As noted above, PdC fluorescence intensity is highly dependent on its hydrogen bonding state. We examined the 6PdC and 7PdC fluorescence lifetimes to examine the origin of the quenching effect. We also measured the lifetime of both of these DNAs fully basepaired with their complementary strand of DNA (6PdC_comp and 7PdC_comp) to highlight differences in hairpin versus duplex structures. The measured apparent lifetime values at different salt concentrations are recorded in Table 2. The apparent lifetimes (τ 1, τ 2) change very little as the salt concentration increases. Two lifetimes were required to fit our phase delay and modulation data, which is in agreement with recently published data obtained using a pulsed laser source (23). Our two lifetimes are slightly different from those found by Marti et al. (23) probably because their excitation pulse width (10 ns) was too wide to accurately measure the short lifetime (0.8 ns in their study versus 1.4 ns in ours), leading to a slight discrepancy in the longer lifetime (8.6 ns in their study versus ∼6.5 ns in ours).
The lifetimes in Table 2 clearly indicate the full basepairing of the stem in 6PdC. The lifetimes of the hairpin alone or fully basepaired to its complementary strand (6PdC_comp) are nearly identical. The hairpin form does have slightly longer lifetimes, indicating somewhat less structure than the fully duplexed form. In contrast, the 7PdC hairpin loop is clearly unpaired. The values of τ 1 are a full 1 ns longer than those found in the basepaired DNAs, whereas the τ 2 values are a full 3 ns longer.
Titration curves
To investigate the effect of PdC on the ability of DNA hairpins to bind ligands, we compared a previously characterized hairpin, AACC4, with 7PdC and 6PdC. We used the fluorescent compound 7AAMD (an antitumor drug and inhibitor of transcription) because of our extensive experience with this compound binding to DNA secondary structures. For further comparison, we included AACC4_comp (duplex DNA). The steady-state fluorescence spectra were used to monitor the titrations (Fig. 3).
The fluorescence spectra during titrations for all the hairpins were very similar; thus, only the spectra for the added 6PdC are shown (Fig. 3 A) as representative. The initial fluorescence of 7AAMD is indicated by the dashed lines in Fig. 3, A and B. The increasing intensities of fluorescence upon addition of hairpin are clearly visible (Fig. 3 A) and are indicated by solid lines. The emission maximum of fully bound 7AAMD was at 620 nm for all hairpins, with or without a PdC residue. These data were used to determine binding affinities and were identical to those obtained by adding 7AAMD to a stock solution of DNA (Table 1).
The fluorescence spectra of titration for duplex DNA (6PdC_comp) are shown in Fig. 3 B. Note that the fluorescence of 7AAMD is quenched when it is bound to duplex DNA, in stark contrast to that seen with hairpins. This difference is due to the hairpin loop protecting the phenoxazone ring system of 7AAMD from quenching by polar solvents (8). The quenching of fluorescence upon binding to DNA was used to determine the binding affinities of 7AAMD to these DNAs. This quenching effect is unusual in that binding of 7AAMD to a number of duplex DNAs results in modest enhancement of fluorescence (5). However, we previously observed quenching when 7AAMD was bound to poly d(AGT) (4). In poly d(AGT), duplex DNA is formed containing a dG:dG mismatch. Clearly, more investigation is needed to understand the effect; however, it may be that the extended ring system of PdC interacts with 7AAMD in such a way that a PdC:dG basepair electronically resembles a dG:dG mismatch.
The changes in fluorescence spectra when 7AAMD was added to DNA were used to derive the titration curves shown in Fig. 4. It should be noted that for hairpins, the changes of fluorescence intensities (F − F 0) are positive, whereas for the duplex DNA the change of fluorescence intensity (F − F 0) is negative. For plotting convenience in Fig. 4, the change of fluorescence intensity of duplex DNA was −(F − F 0). The dissociation constants (Kd) are listed in Table 1. The dissociation constants for all DNAs used are not greatly different. However, the difference in Kd for each DNA follows the order AACC4 < 7PdC < 6PdC < duplex AACC4_comp. This suggests that there are steric and electronic interactions between 7AAMD and the PdC residues that reduce affinity of the drug for the hairpin, and that these unfavorable interactions are reduced considerably when the PdC is located in the loop of the hairpin rather than the stem-loop interface. Overall, as with the melting experiments, the perturbation is slight enough so as not to diminish binding of an intercalating ligand to sequences containing PdC. However, an important caution is that 7AAMD intercalates from the minor grove of DNA, with its cyclic polypeptide rings buried in the minor groove. The methyl group of PdC points into the major groove of DNA (see below; Fig. 7). It remains to be determined how this might affect a ligand that binds DNA from the major groove.
FRET
The transfer of the excited-state energy from an initially excited donor to an acceptor is known as FRET. The relative orientation of the donor and acceptor transition dipoles, and the distance between the donor and acceptor molecules play a role in the rate and efficiency of energy transfer. Fig. 5 shows the steady-state spectra for the FRET donor (6PdC) and acceptor (7AAMD). The emission spectrum of donor (DNA) and the excitation spectrum of acceptor (7AAMD) have good overlap, indicating the close spacing of energy levels of the excited state of PdC and the ground-state transition energy of the 7AAMD, making the two fluorophores candidates for acting as donor-acceptor pairs.
We were able to observe FRET by the gradual quenching of the donor (PdC) emission as a result of binding of the acceptor (7AAMD) to the hairpins (Fig. 6). We would expect to see a concomitant enhancement of 7AAMD fluorescence with the quenching of PdC, but this is precluded by the overwhelming increase in fluorescence of 7AAMD upon binding of hairpin in the absence of a PdC donor (Fig. 3). As with other fluorescence changes, the quenching of PdC allowed us to make measurements of the Kd values for binding, and these were in agreement with the data in Table 1. Our results indicate that quenching of PdC in the presence of an acceptor ligand does occur, and that this process may allow for identification of specific ligand binding sites when PdC is incorporated into DNA sequences other than those examined here.
Solution structure of 6PdC
As a final study of the effect of incorporating PdC into a DNA hairpin, we used NOESY and molecular modeling to determine the 3D structure of the 6PdC hairpin. NMR resonances were assigned by routine sequential assignment procedures. The base H8/H6/H2 and H1′/H5 region of the NOESY spectrum was used to assign these protons in a sequential manner. Cross-peaks in the thymidine H6 to methyl region of the NOSEY spectrum allowed unambiguous assignment of T2, T4, T12, T14, T16, and PdC 6-methyl protons. Compared with the chemical shift of thymidine methyl groups, the 6-methyl of PdC is located downfield by ∼0.4 ppm, most likely due to the extended conjugated aromatic ring of PdC. The spectrum was also used to assign all H2′ and H2″ resonances, and were further confirmed by analyzing the H1′/H5–H2′/H2″ region. Only partial H3′ and H4′ resonances were assigned and no exchangeable protons were assigned due to the limitation of the amount of the sample. However, these were not needed to arrive at a molecular model that was consistent with the assigned resonances (Fig. 7).
After a 100 ps MD simulation with distance constraints was performed, the family of structures that are consistent with the NOESY data were determined, as shown in Fig. 7. In agreement with melting and ligand-binding data, the PdC introduced at the 6 position is fully basepaired with the G11 and does not lead to any distortions of the helical structure of the hairpin. The two dC residues closest to the hairpin stem (C7 and C10) are partially stacked over the G11-PdC basepair, and this may be the source of the slight deviation of the melting curves for 6PdC vs. 7PdC and AACC4 (Fig. 2) and the slightly lower affinity of 7AAMD for this hairpin. This stacking may also contribute to the shorter fluorescence lifetimes of 6PdC vs. 7PdC as well, since stacking interactions have been suggested to be the mechanism that results in quenched fluorescence of PdC in duplex versus melted DNA (24). Overall, the determined structure maintains a B-like conformation in the stem with a fairly unstructured loop region.
Conclusions
In this study we examined the physical effects of the deoxycytidine analog PdC on the structure of DNA hairpins. PdC has been used to probe the melting of duplex DNA by T7 RNA polymerase (17) and to measure the kinetics of DNA repair by O 6-alkylguanine-DNA alkyltransferase (18). However, until now, the physical consequences of incorporating this modified base have not been fully explored. We demonstrated that there is very little perturbation of the DNA structure upon incorporation of PdC. Thermal stability, ligand binding, and 3D structures of PdC incorporated into both the stem and loop of DNA hairpins are all quite similar to the hairpins containing an unmodified dC residue.
Our results have important implications for studying DNA secondary structures. To date, PdC has most often been used with duplex DNA or DNA-RNA hybrids (25). We extend PdC's use to the probing of DNA secondary structures (in this case, DNA hairpins). Our data indicate that this modified base can be used effectively to differentiate paired and unpaired bases in such secondary structures, and should be similarly applicable for related secondary structures such as cruciforms and quadruplexes. Work is under way in our laboratory to characterize PdC incorporated into such structures.
Acknowledgments
The computational methods and NMR experiments used to derive hairpin structures were supported by National Science Foundation grants EPS-0556308 and MRI-0421319.
Supporting Material
References
- 1.Wadkins R.M. Targeting DNA secondary structures. Curr. Med. Chem. 2000;7:1–15. doi: 10.2174/0929867003375461. [DOI] [PubMed] [Google Scholar]
- 2.Kouzine F., Levens D. Supercoil-driven DNA structures regulate genetic transactions. Front. Biosci. 2007;12:4409–4423. doi: 10.2741/2398. [DOI] [PubMed] [Google Scholar]
- 3.Zannis-Hadjopoulos M., Yahyaoui W., Callejo M. 14–3-3 Cruciform-binding proteins as regulators of eukaryotic DNA replication. Trends Biochem. Sci. 2007;33:44–49. doi: 10.1016/j.tibs.2007.09.012. [DOI] [PubMed] [Google Scholar]
- 4.Wadkins R.M., Jares-Erijman E.A., Klement R., Rüdiger A., Jovin T.M. Actinomycin D binding to single-stranded DNA: sequence specificity and hemi-intercalation model from fluorescence and 1H NMR spectroscopy. J. Mol. Biol. 1996;262:53–68. doi: 10.1006/jmbi.1996.0498. [DOI] [PubMed] [Google Scholar]
- 5.Wadkins R.M., Jovin T.M. Actinomycin D and 7-aminoactinomycin D binding to single-stranded DNA. Biochemistry. 1991;30:9469–9478. doi: 10.1021/bi00103a012. [DOI] [PubMed] [Google Scholar]
- 6.Wadkins R.M., Tung C.S., Vallone P.M., Benight A.S. The role of the loop in binding of an actinomycin D analog to hairpins formed by single-stranded DNA. Arch. Biochem. Biophys. 2000;384:199–203. doi: 10.1006/abbi.2000.2113. [DOI] [PubMed] [Google Scholar]
- 7.Wadkins R.M., Vladu B., Tung C.-S. Actinomycin D binds to metastable hairpins in single-stranded DNA. Biochemistry. 1998;37:11915–11923. doi: 10.1021/bi9809730. [DOI] [PubMed] [Google Scholar]
- 8.Vekshin N., Savintsev I., Kovalev A., Yelemessov R., Wadkins R.M. Solvatochromism of the excitation and emission spectra of 7-aminoactinomycin D: implications for drug recognition of DNA secondary structures. J. Phys. Chem. B. 2001;105:8461–8467. [Google Scholar]
- 9.Kim N.W., Piatyszek M.A., Prowse K.R., Harley C.B., West M.D. Specific association of human telomerase activity with immortal cells and cancer. Science. 1994;266:2011–2015. doi: 10.1126/science.7605428. [DOI] [PubMed] [Google Scholar]
- 10.Sharma H.W., Maltese J.-Y., Zhu X., Kaiser H.E., Narayanan R. Telomeres, telomerase and cancer: is the magic bullet real? Anticancer Res. 1996;16:511–516. [PubMed] [Google Scholar]
- 11.Hurley L.H., Wheelhouse R.T., Sun D., Kerwin S.M., Salazar M. G-quadraplexes as targets for drug design. Pharmacol. Ther. 2000;85:141–158. doi: 10.1016/s0163-7258(99)00068-6. [DOI] [PubMed] [Google Scholar]
- 12.Hurley L.H. Secondary DNA structures as molecular targets for cancer therapeutics. Biochem. Soc. Trans. 2001;29:692–696. doi: 10.1042/0300-5127:0290692. [DOI] [PubMed] [Google Scholar]
- 13.Seenisamy J., Rezler E.M., Powell T.J., Tye D., Gokhale V. The dynamic character of the G-quadruplex element in the c-MYC promoter and modification by TMPyP4. J. Am. Chem. Soc. 2004;126:8702–8709. doi: 10.1021/ja040022b. [DOI] [PubMed] [Google Scholar]
- 14.Siddiqui-Jain A., Grand C.L., Bearss D.J., Hurley L.H. Direct evidence for a G-quadruplex in a promoter region and its targeting with a small molecule to repress c-MYC transcription. Proc. Natl. Acad. Sci. USA. 2002;99:11593–11598. doi: 10.1073/pnas.182256799. [DOI] [PMC free article] [PubMed] [Google Scholar]
- 15.Grand C.L., Han H., Munoz R.M., Weitman S., Von Hoff D.D. The cationic porphyrin TMPyP4 down-regulates c-MYC and human telomerase reverse transcriptase expression and inhibits tumor growth in vivo. Mol. Cancer Ther. 2002;1:565–573. [PubMed] [Google Scholar]
- 16.Berry D.A., Jung K.-Y., Wise D.S., Sercel A.D., Pearson W.H. Pyrrolo-dC and pyrrolo-C: fluorescent analogs of cytidine and 2′-deoxycytidine fo the study of oligonucleotides. Tetrahedron Lett. 2004;45:2457–2461. [Google Scholar]
- 17.Liu C., Martin C.T. Promoter clearance by T7 RNA polymerase. Initial bubble collapse and transcript dissociation monitored by base analog fluorescence. J. Biol. Chem. 2002;277:2725–2731. doi: 10.1074/jbc.M108856200. [DOI] [PubMed] [Google Scholar]
- 18.Zang H., Fang Q., Pegg A.E., Guengerich F.P. Kinetic analysis of steps in the repair of damaged DNA by human O6-alkylguanine-DNA alkyltransferase. J. Biol. Chem. 2005;280:30873–30881. doi: 10.1074/jbc.M505283200. [DOI] [PubMed] [Google Scholar]
- 19.Vallone P.M., Paner T.M., Hilario J., Lane M.J., Faldasz B.D. Melting studies of short DNA hairpins: influence of loop sequence and adjoining base pair identity on hairpin thermodynamic stability. Biopolymers. 1999;50:425–442. doi: 10.1002/(SICI)1097-0282(19991005)50:4<425::AID-BIP8>3.0.CO;2-B. [DOI] [PubMed] [Google Scholar]
- 20.Jameson D.M., Hazlett T.L. Time-resolved fluorescence in biology and biochemistry. In: Dewey T.G., editor. Biophysical and Biochemical Aspects of Fluorescence Spectroscopy. Plenum; New York: 1991. pp. 105–133. [Google Scholar]
- 21.Goddard, T.D. and D.G. Kneller. SPARKY 3. San Francisco: University of California.
- 22.Thompson K.C., Miyake N. Properties of a new fluorescent cytosine analogue, pyrrolocytosine. J. Phys. Chem. B. 2005;109:6012–6019. doi: 10.1021/jp046177n. [DOI] [PubMed] [Google Scholar]
- 23.Marti A.A., Jockusch S., Li Z., Ju J., Turro N.J. Molecular beacons with intrinsically fluorescent nucleotides. Nucleic Acids Res. 2006;34:e50. doi: 10.1093/nar/gkl134. [DOI] [PMC free article] [PubMed] [Google Scholar]
- 24.Hardman S.J.O., Thompson K.C. Influence of base stacking and hydrogen bonding on the fluorescence of 2-aminopurine and pyrrolocytosine in nucleic acids. Biochemistry. 2006;45:9145–9155. doi: 10.1021/bi060479t. [DOI] [PubMed] [Google Scholar]
- 25.Dash C., Rausch J.W., Le Grice S.F. Using pyrrolo-deoxycytidine to probe RNA/DNA hybrids containing the human immunodeficiency virus type-1 3′ polypurine tract. Nucleic Acids Res. 2004;32:1539–1547. doi: 10.1093/nar/gkh307. [DOI] [PMC free article] [PubMed] [Google Scholar]
- 26.Kraulis P. MOLSCRIPT: a program to produce both detailed and schematic plots of protein structures. J. Appl. Cryst. 1991;24:946–950. [Google Scholar]
- 27.Meritt E.A., Bacon D.J. Raster3D: photorealistic molecular graphics. Methods Enzymol. 1997;277:505–524. doi: 10.1016/s0076-6879(97)77028-9. [DOI] [PubMed] [Google Scholar]
Associated Data
This section collects any data citations, data availability statements, or supplementary materials included in this article.