

Abstract
Objective
The evolutionarily conserved Kit receptor is vital for function of hematopoietic stem cells (HSC). KitW-41 (W-41) and KitW-42 (W-42) are single residue changes in the KIT intracellular phosphotransferase domain, while KitW-v (W-v) is a single residue change in the ATP binding domain. This study tests how each mutation affects HSC function.
Methods
Cells in mutant and C57BL/6J +/+ blood and marrow were compared. Overall HSC function was measured by competitive repopulation. Functions of specific progenitor populations were tested with stage-specific competitive repopulation and standard colony forming unit assays.
Results
Bone marrow cells from these Kit mutants are severely defective at reconstituting peripheral blood lineages and bone marrow of irradiated recipients, when compared to +/+ control marrow. These defects increased with time. Marrow from W-41/+ and W-v/+ functions similarly but better than marrow from W-41/W-41 and W-42/+, to repopulate the erythroid and lymphoid lineages. Long term (LT) - and short term (ST)-HSC from W-v/+, W-41/W-41 and W-42/+ are more defective at reconstituting bone marrow than LT- and ST-HSC from W-41/+ and +/+. Common myeloid progenitor (CMP) cells from W-42/+ and W-41/W-41 are more defective at producing spleen colonies than CMP from W-v/+ and W-41/+.
Conclusion
Heterozygous Kit mutants with little or no apparent anemia exhibit surprisingly large defects in overall HSC function. Multiplying the fractional defects in LT-HSC, ST-HSC and CMP can account for overall effects of W-v/+, but does not completely account for the defects observed with W-41/+, W-42/+ and W-41/W-41.
Introduction
Hematopoietic stem cells (HSC) self-renew and differentiate to maintain the hematolymphoid systems [1]. The development of HSC is hierarchical (Figure 1), whereby the most primitive long term (LT-) HSC give rise to short term (ST-) HSC, which then produce the multi-potent progenitors (MPP). These give rise to lymphoid and myeloid progenitors, which differentiate into the specific cell types of the lymphatic system, bone marrow and peripheral blood [2, 3]. The cell surface markers used to distinguish these populations are listed in Figure 1.
Figure 1. HSC differentiation pathway.

The LT-HSC (curved arrow) self-renew and produce differentiated lineages (straight arrow) for > 6 months, while the ST-HSC have limited self-renewal (dotted curved arrow). KIT is expressed on LT- and ST-HSC, as well as the multipotent progenitor (MPP), the common myeloid progenitor (CMP), the megakaryocyte/erythrocyte progenitor (MEP), and the granulocyte/macrophage progenitor (GMP). KIT expression is low on the common lymphoid progenitor (CLP). The black arrows between MEP and erythrocytes indicate the stages tested with the BFU-E and CFU-E assays. Studies conducted by several groups determined the cell surface markers used to define each population (2, 38–40, 45). Image modified from Mader ’04 (48).
Kit oncogene (Kit), formerly c-Kit or W, is an essential regulator of HSC and myeloid progenitor cells [4–6], and is also involved in melanoblastic and gonadal stem cell functions [7]. Cells at every stage of early HSC differentiation (Figure 1) are Kit+, except common lymphoid progenitors (CLP), which are Kitlo [8]. Kit mutants are generally dominant for white spotting, and recessive for severe anemia [5, 6]. The current report is the first to show severe defects in HSC repopulating abilities of heterozygous Kit mutants.
Kit, a proto-oncogene, encodes a type III transmembrane protein tyrosine kinase receptor (Figure 2); it is located on mouse Chromosome 5 [9–11]. The human homolog is located on Chromosome 4, at band position 4q11–q12 [12], and has a very similar genomic structure [13–16]. Stem cell factor (SCF), also called KIT ligand or mast cell growth factor, encoded by the Steel locus (Sl), is the ligand specific to Kit [17–19]. Kit has a large number of mutant alleles [5–6, 9–10, 20–23], causing phenotypes that vary in severity; in most cases, the molecular lesions have been identified [20–25]. Kit has also been linked to a wide variety of cancers [4, 26–30]. Thus understanding Kit function may suggest clinical applications for conditions ranging from anemia to leukemia.
Figure 2. KIT receptor.
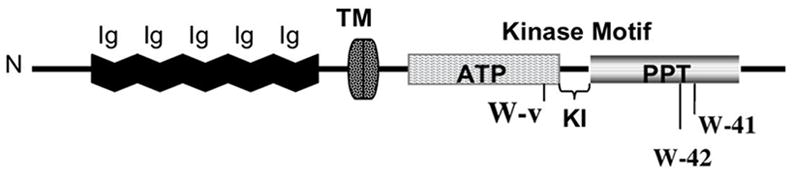
Five Ig domains are located in the extracellular domain (residues 23–518). Residues 1–22 define the signal peptide. SCF binding occurs at the third Ig motif [18]. The cytoplasmic region (residues 543–975) contains 2 kinase domains, separated by the kinase insert (KI): one is involved in ATP binding (residues 543–975) while the other is a phosphotransferase (PPT) domain (residues 763–925). TM refers to the transmembrane spanning region (residues 519–542). The affected residues for this study are indicated as follows: W-v (residue 660), W-42 (residue 790) and W-41 (residue 831). This drawing was modified from published material [14, 20].
The stages of HSC differentiation affected by the Kit mutations and the molecular mechanism by which Kit regulates hematopoiesis are not well understood. In this study we define 3 Kit heterozygous alleles — W-42/+, W-41/+ and W-v/+ — and one homozygote — W-41/W-41. Each mutation results from a different single residue change in the intracellular domain (Figure 2), and each differs in its effect on hematopoiesis, pigmentation and fertility (Table 1) [20–23]. The residues altered by the W-v and W-41 alleles are highly conserved among several receptor tyrosine kinases, while that of the W-42 allele is conserved in all tyrosine and serine-threonine kinases [20, 23]. Our results demonstrate large HSC functional defects in heterozygous Kit mutants with little or no apparent anemia and variations, among the mutants, in effects specific to the CMP, LT-and ST- stages of HSC differentiation.
Table 1.
Background data for Kit mutant alleles in this study
| Kit alleles | Degree of anemia | Coat color | Fertility | Affected domain | Kinase activity |
|---|---|---|---|---|---|
| W-v/-W-v | Severe | Pure white | Sterile | ATP: T660M | Greatly reduced |
| W-v/+ | Mild | White spot | Normal | Reduced | |
| W-41/W-41 | Moderate | Mottled | Reduced | PPT: V831M | Reduced |
| W-41/+ | Mild | White spot | Normal | Reduced | |
| W-42/W-42 | Fetal death | NA | NA | PPT: D790N | NA |
| W-42/+ | Moderate | Pure white | Normal | None |
Materials and methods
Strains of mice
All experiments were performed using age-matched mice of the C57BL/6J (B6) background reared in specific pathogen free colonies at The Jackson Laboratory [31]. The Kit mutations are maintained on the B6 background. Gender- and age-matched B6 +/+ siblings served as controls. The mice were reared on a 4% fat diet of NIH-31 food (breeders were reared on a 6% fat diet) and acidified water ad libitum.
Peripheral blood analysis
Peripheral blood was collected via orbital sinus bleeding from 3 to 5-month-old males and females into BD Microtainer® EDTA coated tubes (BD, Franklin Lakes, NJ). Hematopoietic parameters were measured, and analysis was conducted with the Advia 120 Hematology System (Bayer) in the Diagnostic Division of The Jackson Laboratory [32].
Competitive repopulation
Bone marrow cells (BMC) were extracted [33] from 2- to 6-month-old adult males: Kit mutants and B6 controls provided donor BMC, while B6.Cg-Gpi1a mice provided competitor BMC. Five million donor and 1 million competitor cells were injected into the tail veins of 3-month-old, lethally irradiated (11 Gy) male B6 recipients (Shepard Mark 1 137Cesium gamma source, J.L. Shepherd & Associates, Glendale, CA). The cell numbers were determined with a model ZBI Coulter Counter (Coulter Electronic, Inc., Hialeah, FL). After 2, 6 and 10 months, peripheral blood was collected via orbital sinus bleeding and analyzed to compare the repopulating abilities of donor vs. competitor HSC. Each RU is equivalent to the function of 100,000 standard competitor cells, where the number of donor RU in the mixture is equal to (% of donor cells /[100 -% of donor cells]) x 10, as previously described [33, 34].
HSC and progenitor numbers
Flow cytometry (FACS Calibur, BD Biosciences, San Jose, CA) was used to characterize bone marrow populations at different stages of hematopoietic differentiation [32]. We used lineage low (lin−):Sca-1+:Kit+ and CD34 markers to define the multipotent progenitor and precursor populations, staining 2.5 x 10⁶ cells/ml with cell marker antibodies. All antibodies were purchased from BD Biosciences/PharMingen (San Diego, CA). Anti-CD117 labeled with allophycocyanin (APC) detected KIT expression (clone 2B8), anti-Ly6A/E labeled with phycoerythrin (PE) identified Sca-1, and anti-CD34 labeled with fluorescein-isothiocyanate (FITC) identified the CD34 positive cells. The lineage marker cocktail (lin) consisted of several hematopoietic cell lineage markers, labeled with phycoerythrin-cyanine 7 (PE-Cy7); it included markers for granulocytes (Gr-1), macrophages (Mac-1), B cells (B220), T cells (CD4), and red blood cells (Ter119).
Colony assays (CFU-E, BFU-E, CFU-S)
Bone marrow was extracted from un-manipulated B6 and Kit mutant males and females, 8–12 weeks of age. For BFU-E (burst forming units-erythroid) and CFU-E (colony-forming unit-erythroid) assays, whole bone marrow was cultured in MethoCult Media (StemCell Technologies, BC, Canada) at a concentration of 1.0 x 10⁶ cells/ml. The cultures were incubated at 37° C with 5% CO2. CFU-E were indicated by clusters of 8– 20 cells, manifested 2 days after incubation. Seven days of incubation produced BFU-E in clusters of > 30 cells. The StemCell Technologies manual, “Mouse colony-forming cell assays using MethoCult,” suggested the guidelines for CFU-E and BFU-E sizes. For spleen colony forming unit (CFU-S) assays, 1.0 x 10⁵ cells from each donor were injected into tail veins of irradiated B6 recipients (9 Gy). Donors and recipients were 10- to 15-week-old males. After 9 days, recipient spleens were removed and fixed in Bouin’s, and numbers of macroscopic colonies counted [35]. Media samples containing no donor cells were used for the negative control; no colonies developed on the spleens of these recipients.
Stage-specific competitive repopulation (SSCR)
We developed a modified competitive repopulation assay, in which the relative functional abilities of donor and competitor cells were compared at specific stages of HSC differentiation. Donor and competitor cells were distinguished using two alleles of Ly5 [36] — Ly5.1 and Ly5.2— that do not affect cell functions, but that are readily distinguished by flow cytometry [37]. From 3 donors of each genotype, 6 million BMC were intravenously transplanted with 6 million competitor BMC into each of 4 irradiated recipients per donor. All donors, +/+ and Kit mutants, were Ly5.2, as were the irradiated recipients, while the competitors were Ly5.1. Some irradiated recipients received only competitor cells (Ly5.1) to assure that recipient contributions were minimal. All mice were 2- to 3-month-old males. We used cell surface markers (Figure 1) to define stages of HSC differentiation [2, 38–40]. After 1 and 4 months, LT-HSC and ST-HSC were identified in recipient marrow cell populations by their cell surface markers (Figure 1). Propidium iodide exclusion focused on viable stem cells, which were further identified by expression of Kit and Sca-1, and by the absence of the lineage markers (lin), also referred to as KSL [39]. The fluorochrome used for CD117 was APC-Cy7; APC was used for Sca-1, FITC for Ly5.1 and Pacific blue for the lineage cocktail. Long term and short term HSC were distinguished with Flk2, CD135 labeled with phycoerythrin [40]. LT-HSC are KSL Flk2− while ST-HSC are KSL Fllk2+. Within the KSL or KSL Flk population, percentages of donor and competitor cells were determined by Ly5 type, and RU values were calculated for each of the 4 mutants and the +/+ control donors. Because the competitor RU was set at 60 values of donor RU in the 6 million donor marrow cells equal (% of donor cells/[100 - % of donor cells]) x 60.
Statistical analysis
Effects of genotype on all assays conducted were analyzed through ANOVA using JMP software. Data are presented as means ± SEM; P < 0.05 is statistically significant.
Results
Peripheral blood lineages
In peripheral blood, the red blood cell (RBC) mean corpuscular volume in all 4 mutant groups was significantly increased compared to +/+, reflecting the expected macrocytic anemias of Kit mutants. RBC numbers were significantly reduced in W-v/+, W-41/W-41 and W-42/+ mice, while hematocrit percentages were significantly lower only for W-41/W-41 and W-42/+ mice. Details are shown online in supplemental Table 1. Importantly, no hemoglobin values differed significantly from normal, indicating that the mutants are, at most, only mildly anemic.
Competitive repopulation
In competitive repopulation studies, HSC from +/+ mice repopulated significantly better than HSC from the Kit heterozygous mutants (Table 2). Peripheral blood was sampled after 2, 6 and 10 months. Effects of Kit mutants tended to become more severe with time. At 2 months, relative repopulating abilities for W-42/+ BMC were < 1% of normal in erythrocytes; they were 6% in lymphocytes. Repopulating ability for W-42/+ lymphocytes declined to < 1% after 6 and 10 months. Functions of W-41/W-41 BMC were similar or slightly worse when compared to W-42/+. BMC from W-41/+ and W-v/+ donors functioned better than W-42/+ and W-41/W-41, but still showed severe defects compared to normal controls. Kit mutants consistently produced lymphocytes more effectively than erythrocytes (Table 2). These data emphasize the surprisingly severe degree of HSC dysfunction in these Kit mutants, despite only small effects on steady state peripheral blood lineages and normal values for circulating hemoglobin.
Table 2.
Relative repopulating ability to reconstitute peripheral blood lineages
| Relative repopulating abilities: Percentages for erythrocytes | Relative repopulating abilities: Percentages for lymphocytes | |||||
|---|---|---|---|---|---|---|
| Donor genotype | 2 months | 6 months | 10 months | 2 months | 6 months | 10 months |
| B6 +/+ | 100 | 100 | 100 | 100 | 100 | 100 |
| W-v/+ | 8.0 | 5.4 | 4.1 | 21 | 9.1 | 5.2 |
| W-41/+ | 12 | 6.0 | 3.2 | 25 | 8.0 | 4.6 |
| W-41/W-41 | < 0.1 | 0.22 | < 0.1 | 6.0 | 0.55 | 0.22 |
| W-42/+ | < 0.1 | 0.70 | 0.18 | 6.1 | 1.6 | 0.44 |
On the B6 strain background, Kit mutant and +/+ donors were Gpi1b, and competitors were B6.Cg-Gpi1a; all were 2–6 month old males. Mixtures of 5x10⁶ donor and 1x10⁶ competitor BMCs were iv injected into each lethally irradiated B6 recipient, whose peripheral blood was analyzed at 2, 6 and 10 months post-transplantation. Relative repopulating abilities of the Kit mutants and the normal control were calculated from mean percentages of donor erythrocytes or lymphocytes as RU values; values are presented as percentages of normal repopulating ability (RU donor x 100/RU normal control). All mutant values are significantly different from normal control values (P < 0.0001), with 6–8 donors analyzed for each group at each time point.
HSC and progenitor numbers
Similar numbers of stem cells were observed for bone marrow isolated from controls and the 4 Kit mutants; there were no significant differences (P > 0.05) in these or any of the progenitor populations, as defined in Figure 1 (Supplemental Table 2). These data indicate that the Kit mutations do not interfere with the quantitative expression of KIT on the cell surface of the cell, which is consistent with prior studies using mast cells from W-41 and W-42 [20–23], and with the molecular nature of these mutations. The CD117 antibody recognizes the extracellular domain, and the molecular lesions for these mutants are in the intracellular region. CD34 [41–42] was used along with the KSL markers, and no differences were observed between mutants and controls. These data support the hypothesis that KIT defects are caused by decreased function of KIT positive cells in the HSC differentiation pathway, and not by decreased HSC or progenitor numbers.
Measures of precursor cell function: colony assays
Numbers of BFU-E and CFU-E were not significantly different between Kit mutants and controls (mean numbers of BFU-E ranged from 300–500 and CFU-E ranged from 100–180), which is consistent with previous results on some of the same mutants [43]. Once the Kit mutant cells achieve these stages of differentiation (Figure 1), they function normally. CFU-S assays measure ability of the common myeloid precursor (CMP) to produce macroscopic colonies on spleens of irradiated hosts [35]. Concentrations of CMP from the BMC of each mutant, except W-41/+, were significantly less than in controls, and significantly higher in W-41/+ and W-v/+ than in W-42/+ or W-41/W-41 (P < 0.05; Figure 3). Weights of spleens from each group were not significantly different. The colonies produced by the Kit mutants, including some from W-41/+, were smaller than those of the B6 controls, suggesting that CMP numbers may underestimate the Kit mutant defects. The numbers of CMP for W-41/W-41 and W-42/+ are consistent with previous reports [43, 44].
Figure 3. Spleen colony forming unit (CFU-S) assay.
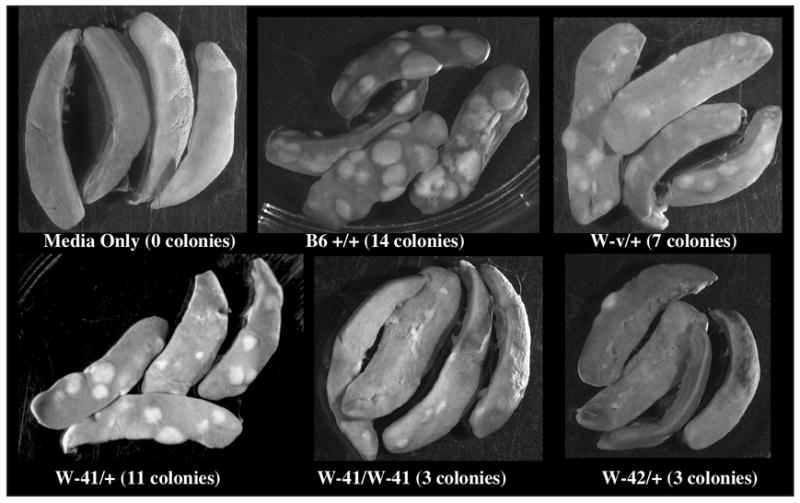
Mean numbers of colonies per 105 donor cells are shown, with representative spleens for each genotype, for which 12 spleens were tested. Values for all mutants, except W-41/+, are significantly lower than values for +/+ (P < 0.05). Values for W-41/+ and W-v/+ are significantly higher than for W-42/+ or W-41/W-41 (P < 0.05).
Measures of precursor cell function: SSCR
The stage-specific competitive repopulation (SSCR) was designed to measure the function of donor LT- and ST-HSC. ST-HSC are those stem cells that self-renew and produce the differentiated cells of the bone marrow and peripheral blood for 4 to 6 weeks while LT-HSC self-renew and produce the ST-HSC, progenitors and differentiated cells for the life of the mouse (45). At 1 and 4 months post transplantation bone marrow was extracted from the recipients and percentages of donor and competitor stem cells –LT-HSC (Flk2−) and ST-HSC (Flk2+) –were quantified.
When recipients received +/+ donor marrow, the percentages of donor type stem cells at 1 and 4 months post transplantation were close to the expected 50%, however percentages of donor-derived stem cells were significantly reduced for each Kit mutant, at both time points (Supplemental Figure 1A). The LT-HSC from each Kit mutant showed greater defects because the percentages of donor derived stem cells decreased between 1 and 4 months post-transplantation. We calculated the repopulating unit (RU) values for each donor (Supplemental Figure 1B) from percentages of donor-derived cells. RU values for control donors at 1 month (ST-HSC) and 4 months (LT-HSC) were standardized at 100% and used to calculate the relative repopulating ability of the STand LT-HSC from each donor (Table 3).
Table 3.
Relative repopulating ability to reconstitute bone marrow
| Relative repopulating abilities of donor ST-HSC | Relative repopulating abilities of donor LT-HSC | |
|---|---|---|
| Donor genotype | ||
| B6 +/+ | 100 | 100 |
| W-v/+ | 48 | 19 |
| W-41/+ | 60 | 40 |
| W-41/W-41 | 34 | 18 |
| W-42/+ | 41 | 26 |
On the B6 strain background, Kit mutant and +/+ donors were Ly5.2, and competitors were B6.Ly5.1; all were 2–3 month old males. Mixtures of 6x10⁶ donor and 6x10⁶ competitor BMCs were iv injected into each lethally irradiated B6 recipient, whose bone marrow was analyzed at 1 and 4-months post-transplantation. Relative repopulating abilities of the Kit mutants and the normal control were calculated from mean percentages of donor KSL cells as RU values; values are presented as percentages of normal repopulating ability (RU donor x 100/RU normal control). All mutant values are significantly different from normal control values (P < 0.001), with 6 donors analyzed for each genotype at each time point.
Discussion
This is the first study to measure the effects of W-41, W-42 and W-v heterozygous mutants on the overall HSC differentiation pathway. Competitive repopulation shows that these mutations greatly reduce relative HSC repopulating abilities for the peripheral blood (Table 2) and the bone marrow (Table 3), despite having only small effects on steady state hematologic parameters (Supplemental Table 1). This is also the first study to define the quantitative differences between the W-41 and W-42 mutants, and to test mutation specific effects on well-defined stages of HSC differentiation.
Kit mutant HSC and other precursors must have defective intrinsic functions, because cell numbers are normal for the progenitor stages of HSC differentiation in the 4 Kit mutants (Supplemental Table 2). Thus in these mutants repopulating and differentiating function per cell must be defective to produce the severe defects observed with competitive repopulation.
Relative repopulating abilities of the Kit mutants were significantly reduced compared to normal B6 controls. These functional defects increased over time (Table 2), suggesting that the primary effects of these Kit mutations are on the most primitive hematopoietic stem cells. Percentages of ST-HSC derived from the W-v/+, W-41/W-41 and W-42/+ decrease from 1 to 4 months post-transplantation (Table 3), suggesting that the LT-HSC which were originally transplanted into the irradiated recipients have a differentiation defect. Percentages of LT-HSC derived from these donors also decreased over time, suggesting that the originally transplanted Kit LT-HSC also have a self-renewal defect. The W-41/+ and +/+ donor cells did not exhibit these defects, as the percentages of LT- and ST-HSC remained constant or increased slightly (Table 3). Together these results support the hypothesis that the Kit gene is involved in HSC self-renewal and differentiation, at the primitive stem cell stage.
LT- and ST-HSC were distinguished solely on phenotypes and were not tested for self-renewal and differentiation activity. While transplanted cells with HSC phenotypes do not have the expected repopulating ability (46), we recently showed that these HSC phenotypes predict repopulating abilities after transplantation in B6 mice (34). Thus these phenotypes provide a way to compare precursors at defined stages of HSC differentiation. Of course, it is possible that a sizable subpopulation of HSC was excluded by not including CD4 or CD34 [41], however we used a standard, widely accepted definition of HSC [2, 38–40, 45]. As markers for HSC phenotypes are improved, they should be used in stage specific competitive repopulation.
The similar numbers of CFU-E and BFU-E in marrow from the Kit mutants and controls indicate that, once the mutated Kit cells progress this far in the hematopoietic differentiation pathway, they can produce enough peripheral blood lineages for nearly normal values of hematopoiesis (Supplemental Table 1). However, the reduced number and size of spleen colonies (Figure 3), indicates that Kit mutations also affect this stage of differentiation. The much more severe effects of the W-42 mutation at this stage may explain why it diminishes erythrocyte production much more than the W-v and W-41 mutations.
In all cases, stage-specific defects (Table 3) were far smaller than overall defects (Table 2). The defects for the erythroid and lymphoid lineages of the peripheral blood are referred to as the overall defects. This difference cannot be due to transplantation damage, as cells were only transplanted once for the assay, while damage is only shown after serial transplantation [47]. We propose a model to explain the cumulative defects observed with each mutant (Table 4). We tested the hypothesis that the overall defect (total observed) is the product of all the fractional defects in each stage of differentiation (total predicted): (the relative functional defects measured in LT-HSC [Table 3]) x (relative defects in ST-HSC [Table 3]) x (defects in CMP [Figure 3]). With this hypothesis, two patterns emerge. First, the W-v mutation, in the ATP binding domain, causes a greater defect in the LT-HSC (the most primitive HSC stage tested) than does the far more severe, W-42 mutation, suggesting that the ATP binding domain may be especially important in the LT-HSC stage of differentiation. Second, the product of effects at these 3 cell differentiation stages predicts the quantitative competitive repopulating difference observed between W-v/+ and +/+ for erythrocytes (lymphyocytes are less severely affected), but overall effects of the other mutants are still more severe in both erythrocytes and lymphocytes than predicted. Perhaps the ATP binding domain is important only in these 3 stages of differentiation, while an untested cell stage, possibly a more primitive stage responsible for LT-HSC production, is affected by mutations in the KIT phosphotransferase domain.
Table 4.
Effects of Kit mutants at each stage of HSC differentiation*
| Differentiation stage | W-v/+ | W-41/+ | W-41/W-41 | W-42/+ |
|---|---|---|---|---|
| LT-HSC† | 0.19 | 0.40 | 0.18 | 0.26 |
| ST-HSC† | 0.48 | 0.60 | 0.34 | 0.41 |
| CMP‡ | 0.50 | 0.79 | 0.21 | 0.21 |
|
| ||||
| Totals predicted§ | 0.046 | 0.19 | 0.013 | 0.022 |
|
| ||||
| Totals observed E, L|| | 0.054, 0.091 | 0.06, 0.08 | 0.0022, 0.0055 | 0.007, 0.016 |
Mutant effects are given as fraction of the normal control.
Equal numbers of donor and competitor BMC were iv injected into irradiated recipients. All mice were 2- to 3-month-old males. Recipient marrow was analyzed at 1 and 4 months post-transplantation. RU values were calculated from percentages of donor type cells with antigenic markers specifying LT-or ST- HSC. Relative repopulating abilities are the RU values of the mutants divided by those of the normal control to give fractions of the normal repopulation ability. Six mice were analyzed per genotype at each time point, and all mutant values are significantly different from B6 (P < 0.001).
CMP gives the fraction of normal 9-day CFU-S.
Totals predicted are the products of the 3 independent differentiation stage fractions.
Totals observed E, L are fractions of total erythrocyte and lymphocyte competitive repopulation after 6 months LT- and ST- HSC are common erythroid and lymphoid precursors. CMP contains no lymphoid cells.
W-41/+ cells are less severely affected than W-42/+ cells at all stages, although both are similar types of mutations in the KIT phosphotransferase domain. The residue altered in W-42 may have a much greater effect on the same pathways than the residue altered in W-41, or W-42 may alter a separate, more important pathway. Unfortunately, neither of these residues was tested in extensive molecular studies of Kit actions in vitro [4, 7].
Overall, our findings quantify the vital and sensitive role Kit plays in HSC differentiation and self-renewal in vivo. The cellular stages of HSC repopulation and differentiation affected by the Kit mutants differ in specific patterns. By defining effects of these mutants in the critical stages of HSC differentiation, we have begun to identify molecular regulatory mechanisms in different portions of the Kit receptor.
Supplementary Material
Acknowledgments
We thank Ted Duffy of The Jackson Laboratory’s Flow Cytometry Service for help with the bone marrow cell analyses, and Joanne Currer for critical editorial assistance with the manuscript.
Supported by NIH grants HL58820 and AG025007 to DEH, and HL63230, The Jackson Laboratory’s cancer core grant.
Footnotes
Publisher's Disclaimer: This is a PDF file of an unedited manuscript that has been accepted for publication. As a service to our customers we are providing this early version of the manuscript. The manuscript will undergo copyediting, typesetting, and review of the resulting proof before it is published in its final citable form. Please note that during the production process errors may be discovered which could affect the content, and all legal disclaimers that apply to the journal pertain.
References
- 1.Reya T, Morrison SF, Clarke MF, Weissman IL. Stem cells, cancer, and cancer stem cells. Nature. 2001;414:105–111. doi: 10.1038/35102167. [DOI] [PubMed] [Google Scholar]
- 2.Passegué E, Jamieson CHM, Ailles LE, Weissman IL. Normal and leukemic hematopoiesis: Are leukemias a stem cell disorder or a requisition of stem cell characteristics. Proc Natl Acad Sci. 2003;100 (Suppl 1):11842–11849. doi: 10.1073/pnas.2034201100. [DOI] [PMC free article] [PubMed] [Google Scholar]
- 3.Weissman IL. Stem cells: Units of development, units of regeneration, and units in evolution. Cell. 2000;100:157–168. doi: 10.1016/s0092-8674(00)81692-x. [DOI] [PubMed] [Google Scholar]
- 4.Rönnstrand L. Signal transduction via the stem cell factor receptor/c-Kit. Cell Mol Life Sci. 2004;61:2535–2548. doi: 10.1007/s00018-004-4189-6. [DOI] [PMC free article] [PubMed] [Google Scholar]
- 5.Geissler EN, Russell ES. Analysis of the hematopoietic effects of new dominant spotting (W) mutations of the mouse. I. Influence upon hematopoietic stem cells. Exp Hematol. 1983;11:452–460. [PubMed] [Google Scholar]
- 6.Geissler EN, McFarland EC, Russell ES. Analysis of pleiotropism at the dominant white-spotting (W) locus of the house mouse: A description of ten new W alleles. Genetics. 1981;97:337–361. doi: 10.1093/genetics/97.2.337. [DOI] [PMC free article] [PubMed] [Google Scholar]
- 7.Linnekin D. Early signaling pathways activated by c-Kit in hematopoietic cells. Int J Biochem Cell Biol. 1999;31:1053–1074. doi: 10.1016/s1357-2725(99)00078-3. [DOI] [PubMed] [Google Scholar]
- 8.DeJong MO, Westerman Y, Wagemaker G, Wognum AW. Coexpression of Kit and the receptors for erythropoietin, interleukin 6 and GM-CSF on hematopoietic cells. Stem Cells. 1997;15:275–285. doi: 10.1002/stem.150275. [DOI] [PubMed] [Google Scholar]
- 9.Chabot B, Stephenson DA, Chapman VM, Besmer P, Bernstein A. The proto-oncogene c-Kit encoding a transmembrane tyrosine kinase receptor maps to the mouse W locus. Nature. 1988;335:88–89. doi: 10.1038/335088a0. [DOI] [PubMed] [Google Scholar]
- 10.Geissler EN, Ryan MA, Housman DE. The dominant white spotting (W) locus of the mouse encodes the c-Kit proto-oncogene. Cell. 1988;55:185–192. doi: 10.1016/0092-8674(88)90020-7. [DOI] [PubMed] [Google Scholar]
- 11.Reilly JT. Receptor tyrosine kinases in normal and malignant hematopoiesis. Blood Rev. 2003;17:241–248. doi: 10.1016/s0268-960x(03)00024-9. [DOI] [PubMed] [Google Scholar]
- 12.Yarden Y, Kuang WJ, Yang-Feng T, et al. Human proto-oncogene c-Kit: a new cell surface receptor tyrosine kinase for an unidentified ligand. EMBO J. 1987;6:3341–3351. doi: 10.1002/j.1460-2075.1987.tb02655.x. [DOI] [PMC free article] [PubMed] [Google Scholar]
- 13.Chu TY, Besmer P. The Genomic Structure of the Proto-Oncogene c-Kit Encoded at the Murine White Spotting Locus. J Biomed Sci. 1995;2:36–45. doi: 10.1007/BF02257923. [DOI] [PubMed] [Google Scholar]
- 14.Giebel LB, Strunk KM, Holmes SA, Spritz RA. Organization and nucleotide sequence of the human Kit (mast/stem cell growth factor receptor) proto-oncogene. Oncogene. 1992;7:2207–2217. [PubMed] [Google Scholar]
- 15.Gokkel E, Grossman Z, Ramot B, Yarden Y, Rechavi G, Givol D. Structural organization of the murine c-Kit proto-oncogene. Oncogene. 1992;7:1423–1429. [PubMed] [Google Scholar]
- 16.Qiu FH, Ray P, Brown K, et al. Primary structure of c-Kit: relationship with the CSF-1/PDGF receptor kinase family-oncogenic activation of v-kit involves deletion of extracellular domain and C terminus. EMBO J. 1988;7:1003–1011. doi: 10.1002/j.1460-2075.1988.tb02907.x. [DOI] [PMC free article] [PubMed] [Google Scholar]
- 17.Lyman SD, Jacobsen SEW. c-kit ligand and Flt3 ligand: Stem/progenitor cell factors with overlappig yet distinct activitities. Blood. 1998;91:1101–1134. [PubMed] [Google Scholar]
- 18.Broudy VC. Stem cell factor and hematopoiesis. Blood. 1997;90:1345–1364. [PubMed] [Google Scholar]
- 19.Galli SJ, Zsebo KM, Geissler EN. The kit ligand, stem cell factor. Adv Immunol. 1994;55:1–96. doi: 10.1016/s0065-2776(08)60508-8. [DOI] [PubMed] [Google Scholar]
- 20.Nocka K, Tan JC, Chiu E, et al. Molecular bases of dominant negative and loss of function mutations at the murine c-Kit/white spotting locus: W37, Wv, W41 and W. EMBO J. 1990;9:1805–1813. doi: 10.1002/j.1460-2075.1990.tb08305.x. [DOI] [PMC free article] [PubMed] [Google Scholar]
- 21.Reith AD, Ellis C, Lyman SD, et al. Signal transduction by normal isoforms and W mutant variants of the Kit receptor tyrosine kinase. EMBO J. 1991;10:2451–2459. doi: 10.1002/j.1460-2075.1991.tb07784.x. [DOI] [PMC free article] [PubMed] [Google Scholar]
- 22.Reith AD, Rottapel R, Giddens E, Brady C, Forrester L, Bernstein A. W mutant mice with mild or severe developmental defects contain distinct point mutations in the kinase domain of the c-Kit receptor. Genes Develop. 1990;4:390–400. doi: 10.1101/gad.4.3.390. [DOI] [PubMed] [Google Scholar]
- 23.Tan JC, Nocka K, Ray P, Traktman Bessmer P. The dominant W42 spotting phenotype results from a missense mutation in the c-Kit receptor kinase. Science. 1990;247:209–212. doi: 10.1126/science.1688471. [DOI] [PubMed] [Google Scholar]
- 24.Fleischman RA. From white spots to stem cells: the role of the kit receptor in mammalian development. Trends Genetics. 1993;9:285–289. doi: 10.1016/0168-9525(93)90015-a. [DOI] [PubMed] [Google Scholar]
- 25.Casteran N, DeSepulveda P, Beslu N, et al. Signal transduction by several KIT juxtamembrane domain mutations. Oncogene. 2003;30:4710–4722. doi: 10.1038/sj.onc.1206587. [DOI] [PubMed] [Google Scholar]
- 26.Blume-Jensen P, Hunter T. Oncogenic kinase signaling. Nature. 2001;411:355–365. doi: 10.1038/35077225. [DOI] [PubMed] [Google Scholar]
- 27.Ashman LK, Ferrao P, Cole SR, Cambarreri AC. Effects of mutant c-Kit in early myeloid cells. Leuk Lymphoma. 1999;34:451–461. doi: 10.3109/10428199909058472. [DOI] [PubMed] [Google Scholar]
- 28.Ferrao P, Gonda TJ, Ashman LK. Expression of constitutively activated human c-Kit in myb transformed early myeloid cells leads to factor independence, histiocytic differentiation and tumorigenicity. Blood. 1997;90:4539–4552. [PubMed] [Google Scholar]
- 29.Piao X, Bernstein A. A point mutation in the catalytic domain of c-kit induces growth factor independence, tumorigenicity and differentiation of mast cells. Blood. 1996;87:3117–3123. [PubMed] [Google Scholar]
- 30.Sattler M, Salgia R. Targeting c-Kit mutations: basic science to novel therapies. Leuk Res. 2003;28S1:S11–S20. doi: 10.1016/j.leukres.2003.10.004. [DOI] [PubMed] [Google Scholar]
- 31.The Jackson Laboratory Animal Resource Staff. JAX Mice; Price list and product guide. Bar Harbor, ME: 1998. pp. 8–9. [Google Scholar]
- 32.Sharma Y, Flurkey K, Astle CM, Harrison DE. Mice severely deficient in growth hormone have normal hemaotopoiesis. Exp Hematol. 2005;33:776–783. doi: 10.1016/j.exphem.2005.04.003. [DOI] [PubMed] [Google Scholar]
- 33.Harrison DE, Jordan CT, Zhong RK, Astle CM. Primitive hematopoietic stem cells: direct assay of most productive populations by competitive repopulation with simple binomial, correlation and covariance calculations. Exp Hematol. 1993;21:206–219. [PubMed] [Google Scholar]
- 34.Yuan R, Astle CM, Chen J, Harrison DE. Genetic regulation of hematopoietic stem cell exhaustion during development and growth. Exp Hematol. 2005;33:243–250. doi: 10.1016/j.exphem.2004.10.014. [DOI] [PubMed] [Google Scholar]
- 35.Till JE. McCulloch A direct measurement of the radiation sensitivity of normal mouse bone marrow cells. Radiat Res. 1961 Feb;14:213–22. [PubMed] [Google Scholar]
- 36.Morse HC., III Genetic nomenclature for loci controlling surface antigens of mouse hemopoietic cells. J Immunol. 1992;149:3129–3134. [PubMed] [Google Scholar]
- 37.Trowbridge IS, Thomas ML. CD45: an emerging role as a protein tyrosine phosphatase required for lymphocyte activation and development. Annu Rev Immunol. 1994;12:85–116. doi: 10.1146/annurev.iy.12.040194.000505. [DOI] [PubMed] [Google Scholar]
- 38.Spangrude GJ, Heimfeld S, Weissman IL. Purification and characterization of mouse hematopoietic stem cells. Science. 1988;241:58–62. doi: 10.1126/science.2898810. [DOI] [PubMed] [Google Scholar]
- 39.Morrison SJ, Weissman IL. The long-term repopulating subset of hematopoietic stem cells is deterministic and isolatable by phenotype. Immunity. 1994;1:661–673. doi: 10.1016/1074-7613(94)90037-x. [DOI] [PubMed] [Google Scholar]
- 40.Christensen JL, Weissman IL. Flk-2 is a marker in hematopoietic stem cell differentiation: A simple method to isolate long-term stem cells. Proc Natl Acad Sci. 2001;98:14541–14546. doi: 10.1073/pnas.261562798. [DOI] [PMC free article] [PubMed] [Google Scholar]
- 41.Ishida A, Zeng H, Ogawa M. Expression of lineage markers by CD34+ hematopoietic stem cells of adult mice. Exp Hematol. 2002;30:361–365. doi: 10.1016/s0301-472x(01)00795-0. [DOI] [PubMed] [Google Scholar]
- 42.Ito T, Talima F, Ogawa M. Developmental changes of CD34 expression by murine hematopoietic stem cells. Exp Hematol. 2000;28:1269–1273. doi: 10.1016/s0301-472x(00)00535-x. [DOI] [PubMed] [Google Scholar]
- 43.Miller CL, Rebel VI, Lemieux ME, Helgason CD, Lansdorp PM, Eaves CJ. Studies of W mutant mice provide evidence for alternate mechanisms capable of activating hematopoietic stem cells. Exp Hematol. 1996;24:185–194. [PubMed] [Google Scholar]
- 44.Barker JE, McFarland EC. Characterization of spleen colonies derived from mice with mutations at the W locus. J Cell Physiol. 1991;149:451–458. doi: 10.1002/jcp.1041490314. [DOI] [PubMed] [Google Scholar]
- 45.Lagasse E, Shizuru JA, Uchida N, Tsukamoto A, Weissman IL. Toward regenerative medicine. Immunity. 2001;14:425–436. doi: 10.1016/s1074-7613(01)00123-6. [DOI] [PubMed] [Google Scholar]
- 46.Spangrude GJ, Brooks DM, Tumas DB. Long-term repopulation of irradiated mice with limiting numbers of purified hematopoietic stem cells: in vivo expansion of stem cell phenotype but not function. Blood. 1995;85:1006–16. [PubMed] [Google Scholar]
- 47.Harrison DE, Stone M, Astle CM. Effects of transplantation on the primitive immunohematopoietic stem cell (PSC) J Exp Med. 1990;172:431–437. doi: 10.1084/jem.172.2.431. [DOI] [PMC free article] [PubMed] [Google Scholar]
- 48.Mader SS. Human Biology. Boston: McGraw Hill; 2004. [Google Scholar]
Associated Data
This section collects any data citations, data availability statements, or supplementary materials included in this article.