Abstract
A dinuclear Nd(III) macrocyclic complex of 1 (1,4-bis[1-(4,7,10-tris(carbamoylmethyl)-1,4,7,10-tetraazacyclododecane]-p-xylene) and mononuclear complexes of 1,4,7-tris-1,4,7,10-tetraazacyclododecane 2, and 1,4,7-tris[(N-N-diethyl)carbamoylmethyl]-1,4,7,10-tetraazacyclododecane, 3, are prepared. Complexes of 1 and 2 give rise to a PARACEST (paramagnetic chemical exchange saturation transfer) peak from exchangeable amide protons that resonate approximately 12 ppm downfield from the bulk water proton resonance. The dinuclear Nd(III) complex is promising as a PARACEST contrast agent for MRI applications because it has an optimal pH of 7.5 and the rate constant for amide proton exchange (2700 s−1) is nearly as large as it can be within slow exchange conditions with bulk water. Dinuclear Ln2(1) complexes (Ln(III) = Nd(III), Eu(III)) bind tightly to anionic ligands including carbonate, diethylphosphate and DNA. The CEST amide peak of Nd2(1) is enhanced by certain DNA sequences that contain hairpin loops, but decreases in the presence of diethyl phosphate or carbonate. Direct excitation luminescence studies of Eu2(1) show that double-stranded and hairpin loop DNA sequences displace one water ligand on each Eu(III) center. DNA displaces carbonate ion despite the low dissociation constant for the Eu2(1) carbonate complex (Kd = 15 µM). Enhancement of the CEST effect of a lanthanide complex by binding to DNA is a promising step toward the preparation of PARACEST agents containing DNA scaffolds.
INTRODUCTION
CEST (chemical exchange saturation transfer) agents are a promising new class of MRI contrast agent. Contrast is produced by applying a presaturation pulse at the resonance frequency of NH or OH protons of an amino acid, sugar, nucleotide or other metabolite. Transfer of the proton magnetization to the bulk water through chemical exchange results in the reduction of the bulk water signal.(1) The chemical shifts of the diamagnetic NH or OH protons are only 2–5 ppm different than that of bulk water, which makes it difficult to avoid direct saturation of the bulk water.(2–5) This limitation is overcome by forming complexes with lanthanide ions. Paramagnetic lanthanide CEST agents (PARACEST agents) possess mobile protons such as OH, NH of chelating amide or alcohol ligands or water ligands with resonance frequencies that are often more than 20 ppm away from that of bulk water.(6–8)
For CEST agents, the maximum reduction of the bulk water signal is reached when the magnetization of the nuclei of exchangeable protons are completely saturated and the bulk water protons are not directly irradiated by the presaturation pulse that excites the exchangeable protons.(8) This condition is met when the presaturation pulse power is optimized and the chemical shift difference between exchangeable protons and bulk water protons (Δω) is large enough so that direct irradiation of the bulk water resonance is negligible. Under these conditions, the saturation transfer percent (ST%) is expressed as shown in eq. 1 where I is the signal intensity of the bulk water protons taken immediately after pulse is applied to the exchangeable (mobile) protons of CEST agent, I0 the initial intensity of bulk water protons in the absence of saturation, kex is the exchange rate constant, n is the number of saturated protons per CEST molecule, C is the concentration of the CEST agent and T1 is the longitudinal relaxation time of bulk water protons.(6)
| (1) |
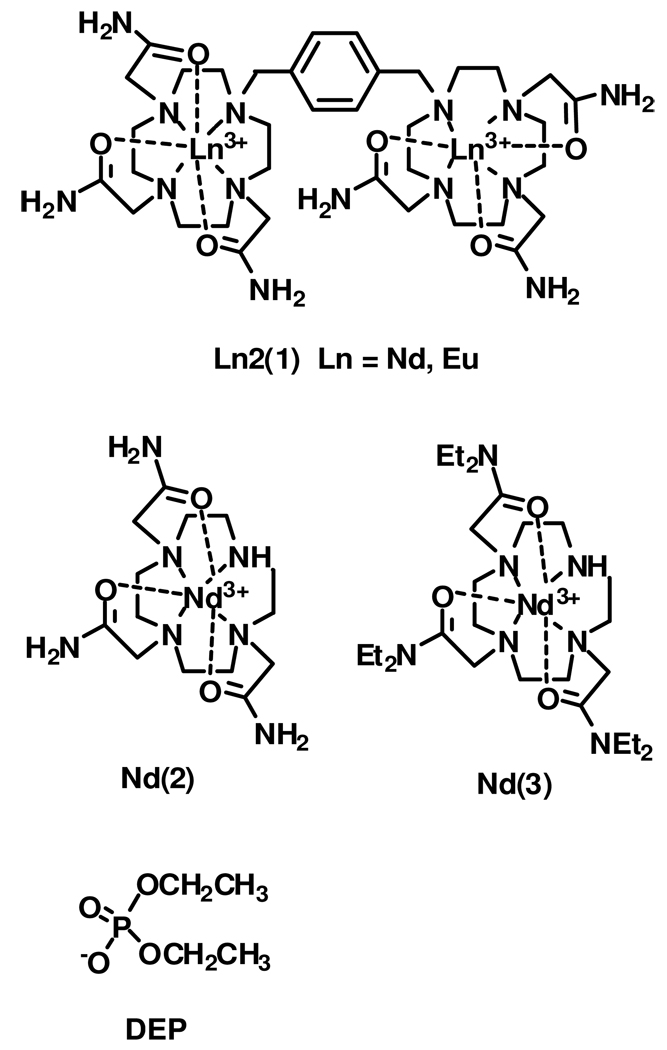
An important goal in the development of PARACEST contrast agents is to decrease the concentration of agent required. One option is to increase the number of exchangeable protons (n in eq. 1). This has been accomplished through studies on macromolecules with multiple exchangeable groups such as a dendrimers,(9, 10) albumin,(11) poly-U(12) or peptides(13) as CEST agents. Sherry’s studies on Yb(III) complexes with pendent amide groups featured eight amide protons in two sets of four equivalent protons.(14) To further increase the number of exchangeable protons, we linked two macrocyclic complexes together to produce dinuclear Ln(III) complexes with twelve amide protons (Chart 1). A potential drawback in this design is that the amide protons in these complexes are chemically inequivalent. For Ln(2), all amide protons for the commonly observed capped square antiprism diastereomer are inequivalent. The presence of an additional diastereomer such as a capped twisted square antiprism would give rise to second set of resonances. For Ln2(1), there are two such Ln(III) centers. In practice, however, the chemical shift of the amide resonances may be sufficiently similar to produce overlapping resonances that increase the efficiency of the CEST agent.
Chart 1.
In addition to their large number of exchangeable protons, dinuclear Ln(III) complexes have unique binding properties for small molecules. Such specific binding events may lead to new MRI responsive agents that report on the concentration of metabolites or macromolecules.(15–17) For example, dinuclear complexes of Eu(III) bind more strongly to phosphate esters than do their mononuclear analogs.(18) Dinuclear Ln(III) complexes of macrocycles related to 1 bind to compounds containing carboxylates.(19) An anion of primary importance for the application of these dinuclear Ln(III) complexes as PARACEST that has not been quantitatively studied is carbonate. Carbonate is present in milimolar concentrations in most tissues in the body and many lanthanide complexes bind carbonate strongly.(20, 21) Thus the influence of carbonate complexes on the CEST properties of these lanthanide complexes is of interest.
Macromolecule binding to Ln(III) complexes modulates their CEST properties by changing the rate of proton exchange and the chemical shift of the mobile protons. This has been demonstrated for Ln(III) complexes of proteins including albumin and ferritin.(11, 22) A further example includes a supramolecular Tm(III) complex of poly-L-arginine that gives rise to an intense CEST effect (6). By contrast, the effect of nucleic acid binding to Ln(III) complexes that are PARACEST agents has not yet been reported despite interest in using contrast agents to monitor DNA delivery for gene therapy(9, 12, 23, 24) and to use DNA as a scaffold for attaching multiple Ln(III) contrast agents.(25)
Here we report on a Nd(III) dinuclear complex that functions as a PARACEST agent through exchange of amide protons. Comparisons are made to two mononuclear complexes. The most efficient CEST agent of these complexes, Nd2(1), binds DNA and certain DNA sequences to give an increased CEST effect. DNA and carbonate binding are further characterized by direct excitation lanthanide luminescence spectroscopy studies of the Eu2(1) analog.
EXPERIMENTAL SECTION
Materials
Ln(CF3SO3)3 salts were purchased from Aldrich. Synthetic DNAs were purchased from Integrated DNA Technologies (IDT) in desalted form and the different oligonucleotides were annealed by heating to 90 °C for 10 minutes and allowed to cool to room temperature overnight. 1,4-bis[1-(4,7,10-tris(carbamoylmethyl)-1,4,7,10-tetraazacyclododecane]-p-xylene (1) was prepared as described previously.(18) Syntheses of 1,4,7-tris(carbamoylmethyl)-1,4,7,10-tetrazacyclododecane (2) and 1,4,7-tris[(N-N-diethyl)carbamoylmethyl]-1,4,7,10-tetraazacyclododecane (3) have been reported elsewhere.(18) Milli-Q purified water was boiled and bubbled with nitrogen gas for one hour prior to use in CEST experiments or in luminescence measurements to minimize carbonate concentrations.
Instrumentation
An Orion research digital ionalyzer, Model 510, equipped with a temperature compensation probe was used for all pH measurements. All 1H and 13C NMR were recorded on a Varian Gemini-300, Varian Inova-400 or Inova-500 spectrometer. A Beckman Coulter DU® 640 UV-vis spectrophotometer equipped with a high performance peltier temperature controller was utilized for all thermal melting experiments. Data was fit by using the Meltwin 3.5 program. The melting temperatures for HP1 and HP2 (Chart 1) were independent of concentration over the range 40–200 µM DNA, consistent with a hairpin loop structure. Values of Tm for HP1, HP2 and GGCCGGCC (50 µM) were 60 °C, 63 °C, 60 °C, respectively at pH 7.0 with 20 mM HEPES, 50 mM NaNO3. Addition of an equivalent of Nd2(1) increased the Tm of all sequences by 2–3 °C.
Ln(III) complexes
The Nd(III) complex was prepared by heating Nd(CF3SO3)3 and the macrocyclic ligand (1) to reflux in dry methanol for eight hours. In a typical preparation, 0.200g (0.253 mmol) of ligand and 0.301 g (0.507 mmol) of Nd(CF3SO3)3 were heated to reflux in 20 mL of dry methanol for 8 h. The solvent was reduced to 1 mL and chloroform was slowly added until a precipitate formed at the bottom of the flask. The precipitation was repeated one more time. The supernatant was decanted and the solid was dried under vacuum to give a white solid. Yield 90%. 13C NMR (300 MHz, D2O): δ = 19.3, 30.8, 32.5, 34.5, 44.8, 51.8, 60.2, 130.0, 131.8, 175.3. Anal. Cald for C42H64N14O24F18S6Nd: C 23.89, H 2.96, 8.87. Found C 23.78, H 2.88, N 8.75. The synthesis of Eu(III) complex of ligand 1 has been reported elsewhere.(18) This procedure was modified to reduce the concentration of the carbonate complex. The complex was formed in an aqueous solution by incubation of 1.00 mM ligand 1, 2.00 mM Eu(CF3SO3)3 and 20.0 mM HEPES (pH 7.0) over a period of an hour. Complex formation was verified by Eu(III) luminescence spectroscopy and by ESI-MS spectroscopy. In a few experiments, 25 mM Pb(NO3)2 was added to the Eu2(1) solution to precipitate adventitious carbonate as Pb(CO3). To remove the excess Pb(II), 25 mM NaCl followed by 25 mM NaOH (carbonate free) were added to bring the solution to neutral pH. The solution was vortexed for 30 seconds and spun in a refrigerated Savant μ-SpeedFuge SFR 13K centrifuge for 60 min at an RFC of 13,000 g. The supernatant was removed from the white pellet. Nd(III) complexes of ligand 2 and 3 were prepared by heating Nd(CF3SO3)3 and the macrocyclic ligands to reflux in dry methanol for eight hours. The solvent was then reduced to 1 mL and chloroform was slowly added until a precipitate formed at the bottom of the flask. Nd(2) Yield 90%. ESI m/e: 783, 784, 785, 786, 787, 789, 790 ([Nd(2)](CF3SO3)3 – (CF3SO3−)). 13C NMR (300 MHz, D2O): δ = 22.1, 23.3, 28.5, 38.3, 40.8, 62.0, 152.5, 176.8. Anal. Cald for C17H29N7O12F9S3Nd: C 21.99, H 3.30, 10.22. Found C 21.94, H 3.21, N 10.38. Nd(3); Yield 90%. ESI m/e: 951, 952, 953, 954, 955, 957, 959 ([Nd(3)](CF3SO3)3 – (CF3SO3−)). 13C NMR (300 MHz, D2O): δ = 13.5, 14.0, 38.5, 42.0, 43.1, 44.8, 47.5, 48.2, 49.2, 50.5, 160.8, 172.6. Anal. Cald for C29H52N7O12F9S3Nd: C 27.55, H 4.18, N 7.41. Found C 27.62, H 4.16, N 7.28.
NMR Measurements
All experiments were carried out on a Varian Inova 500 MHz spectrometer operating at 11.75 T. The saturation transfer experiments were carried out at 298 K by irradiating the sample at 1 ppm incremental steps. The presaturation pulse power was 1,000 Hz except where noted. The sample contains 10 mM HEPES buffer (pH 6.5–8.0) and 50 mM NaNO3. An insert coaxial NMR tube was utilized and the volume of the sample was 100 µL. CEST spectra were measured by recording the bulk water signal intensity as a function of presaturation frequency (in ppm). Studies were conducted using a presaturation pulse irradiation over the range of 20 to −20 ppm with a fixed irradiation time of 3s. CEST spectra were obtained by plotting the intensity ratio of bulk water signal in the absence of presaturating RF pulse (I0) and presence of RF irradiation (I) against the frequency of the RF pulse (in ppm). Figure S1 shows CEST spectra as a function of irradiation (saturation) time. The spectra show only minor differences and the CEST effects are also nearly identical at around 12 ppm where proton exchange occurs. This is an indication that the efficiency of saturation transfer (ST) reaches a steady state value, and also that the exchange between amide NH and bulk water protons reaches equilibrium with 3 s of irradiation time,(6, 26) the value used for all CEST data acquisition here.
The longitudinal relaxation time (T1) of bulk water protons was measured by inversion recovery method. This was done by applying a 180º pulse to invert the magnetization of the bulk water protons followed by a 90º pulse prior to acquisition. Upon completion of the acquisition, Varian Inova software was used to calculate the T1 value based on the experimental data. Triplicate measurements of T1 on different samples and different days gave values that were reproducible to ± 40%.
Luminescence Spectroscopy
Eu(III) excitation spectra and excited state lifetimes were obtained using a Spectra-Physics Quanta Ray PRO-270-10 Q-switched Nd:YAG pump laser (10 Hz, 60 mJ/pulse) and a MOPO SL for all luminescence measurements.(27) The 7F0 → 5D0 transition of the Eu(III) ion was scanned between 578 and 581 nm while the 5D0 → 7F2 emission band was monitored at 614 nm using a band pass filter. Excitation spectra were fit by using the program Peak Fit 4.12 (Jandel). Time resolved luminescence measurements were collected by using a digital Tektronix TDS 3034B oscilloscope. Five data sets per wavelength were fit to a single exponential decay by using Graphpad Prism 4 (Graphpad Prism Software, Inc.) and averaged. The number of bound waters, q, was estimated by using equation 2 (28, 29) where A is specific to Eu(III) (1.2 ms), and kH2O and kD2O are the rate constants for luminescence decay in H2O and D2O, respectively. The khnc=oterm is for quenching by amides 0.075 ms−1 and δ is the number of amide groups in the innersphere (3 amides) and α is the total outersphere quenching 0.25 ms−1.
| (2) |
DNA binding curves were fit to equation 3 for a simple solution system that involves non-competitive tight binding of metal complex to multiple binding sites on DNA.(30) Here I0 and I are the luminescence intensity in the absence and presence of nucleic acid, Rb is the luminescence intensity of the bound complex, M is concentration of the complex, Kd is the dissociation constant, n is the number of bases per binding sites, A is the nucleic acid concentration, x is equal to the concentration of DNA times the number of bases in the sequence. The solution includes 25 µM complex, 20 mM HEPES buffered at pH 7.0, 50 mM NaNO3 and 5–50 µM nucleic acid.
| (3) |
For simple substrates with 1:1 binding stoichiometry, data was fit to equation 4. I0 and I are the luminescence intensity in the absence and presence of nucleic acid, Imax is the maximum luminescence intensity, M is the concentration of Eu2(1), L is the sodium bicarbonate concentration, Kd, is the dissociation constant. The solution includes 20 µM complex, 20 mM HEPES buffer, 50 mM NaNO3 and 20–300 µM concentrations of sodium bicarbonate. This is a method to determine equilibrium binding constant using a non-linear least squares fit of the experimental data.(31)
| (3) |
RESULTS
CEST Spectra
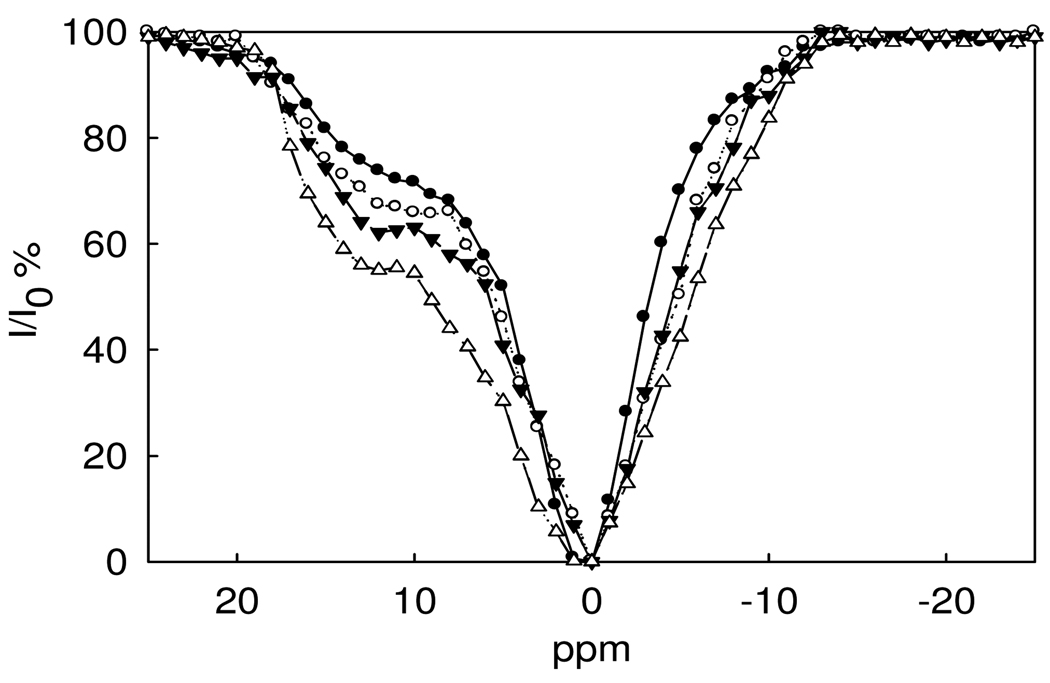
The CEST spectrum of Nd2(1) is shown in Figure 1. The vertical axis shows the percent reduction of the intensity of the bulk water peak upon irradiation with a presaturation pulse in 1 ppm steps over the range 25 to −25 ppm with the bulk water resonance set at 0 ppm. There is a broad shoulder observed at approximately 12 ppm downfield from the bulk water proton resonance that we attribute to the protons of the NH groups. This assignment was supported by a CEST study of a Nd(III) derivative that lacks NH groups (see below). The only other exchangeable protons are from water ligands and these are expected to exchange too fast to observe a CEST signal. Attempts to assign the NH amide proton resonances by 1H NMR studies of Nd2(1) in H2O failed (Figure S2), even at lowered temperatures (5 °C) where slower exchange rate constants may facilitate the observation of these resonances. The absence of a proton resonance in the chemical shift range of the CEST shoulder is attributed to broadening of the NH protons by exchange with water. As discussed below, the rate constants for NH proton exchange is fast in comparison to other lanthanide amide complexes and the observed rate constant suggests that the Nd(III) complex is at the limit of the NMR spectroscopy slow exchange regime.
Figure 1.
CEST spectra of 5.0 mM (•), 10 mM (○), 15 mM (θ) and 20 mM (▪) Nd2(1) at pH 7.0, 10 mM HEPES, 50 mM NaNO3, 25 °C.
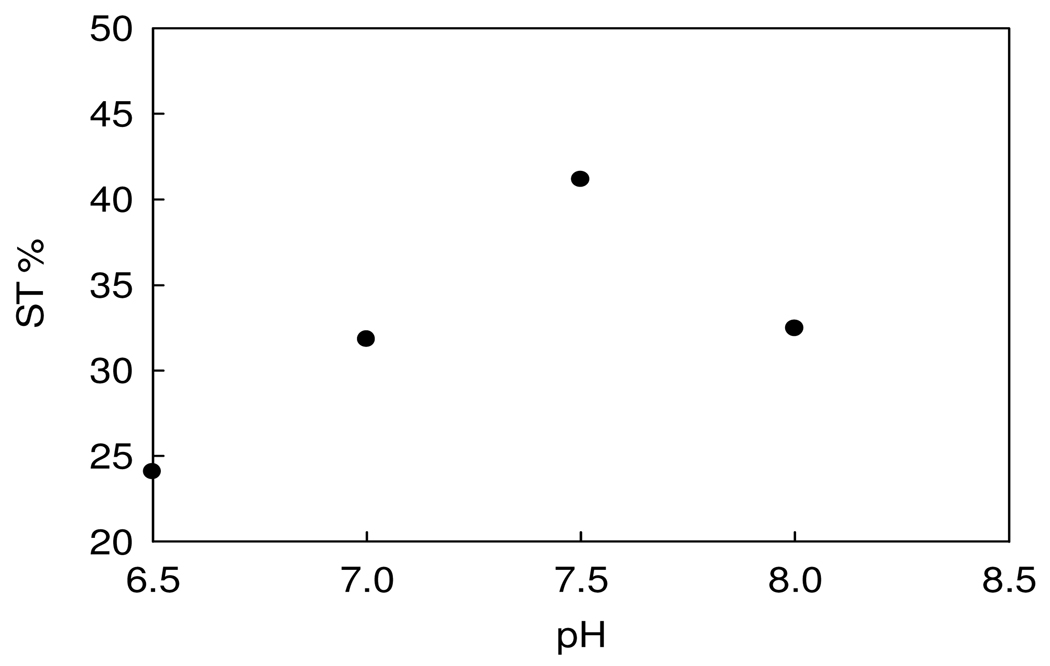
The CEST spectrum of the Nd2(1) complex was further investigated as a function of concentration and pH (Figure 1 and Figure 2). The CEST enhancement upon increasing pH in the 6.5–7.5 interval is consistent with previously observed enhancements due to base catalysis of the exchange of the amide protons.(32) A decrease in the CEST enhancement at the 12 ppm shoulder concomitant with a shift of the CEST peak toward the bulk water peak (Figure S3) suggests that exchange becomes even more rapid at pH 8.0, leading to the loss of the CEST peak as the NH peak begins to merge with the bulk water peak at high pH values. The concentration dependence of the CEST spectrum of Nd2(1) is shown in Figure 1.
Figure 2.
The pH dependence of saturation transfer (ST) efficiency of Nd2(1) at 25°C, 10 mM buffer, 50 mM NaNO3.
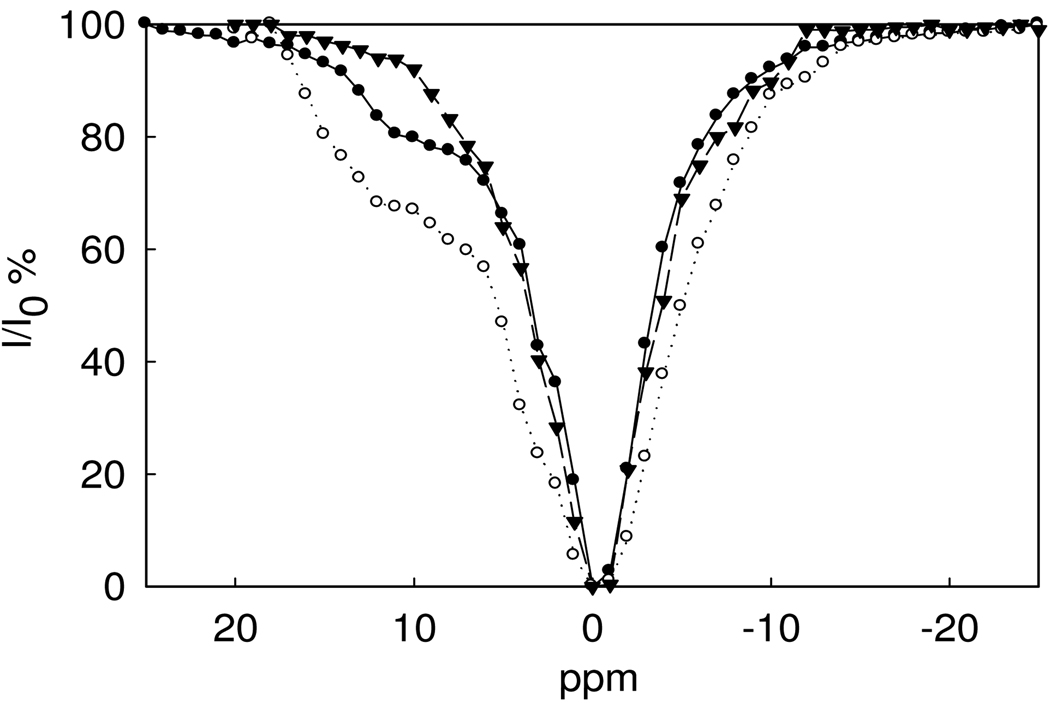
Figure 3 shows that the dinuclear Nd2(1) complex has a stronger CEST amide NH peak than the mononuclear Nd(2) complex at equivalent concentrations. This is presumably due to the larger number of exchangeable amide NH protons in Nd2(1) compared to Nd(2), although as noted above, both complexes have several sets of chemically distinct NH protons. For comparison, Figure 3 shows a CEST spectrum of the Nd(III) complex of 3, a ligand lacking NH groups. Nd(3) has no discernable CEST peak and only shows a peak for direct irradiation of bulk water. This suggests that the CEST effect centered around 11 ppm for Nd(2) and 12 ppm for Nd2(1) are for amide NH protons. Nd(III) macrocyclic complexes with peptide pendent groups have NH CEST peaks with similar chemical shifts.(33)
Figure 3.
CEST spectra of 5.0 mM Nd2(1) (○), 5.0 mM Nd(2) (○) and 5.0 mM Nd(3)(θ), B1 = 1,200 Hz, at pH 7.0, 10 mM HEPES, 50 mM NaNO3, 25 °C.
By contrast, the Eu2(1) complex has no observable CEST peaks under these conditions (Figure S4). This result is similar to previously reported mononuclear Eu(III) complex analogs that have a barely discernable NH CEST shoulder because their amide NH resonance is very close to the bulk water resonance.(33, 34)
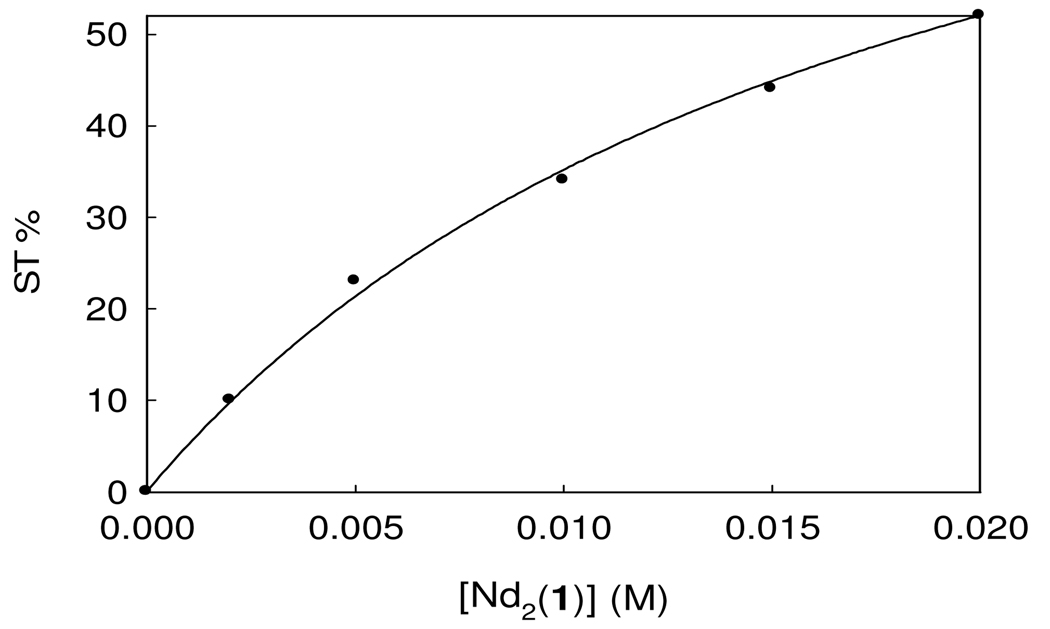
To estimate the rate constant for NH proton exchange, a concentration study for the saturation transfer of Nd2(1) ranging from 5–20 mM was carried out. The plot of the saturation transfer (ST, eq. 1) efficiency as a function of concentration is shown in Figure 4. The data is fit to eq. 1 to give an exchange rate constant of kex of 2700 s−1 for a measured longitudinal relaxation time (T1) of bulk water protons of 0.18 s.
Figure 4.
Saturation transfer (ST) effect as a function of Nd2(1) concentration with 50 mM NaNO3 at pH 7.0 and 25 °C. The data was fit to eq. 1 to obtain a kex of 2.7 × 10³ s−1.
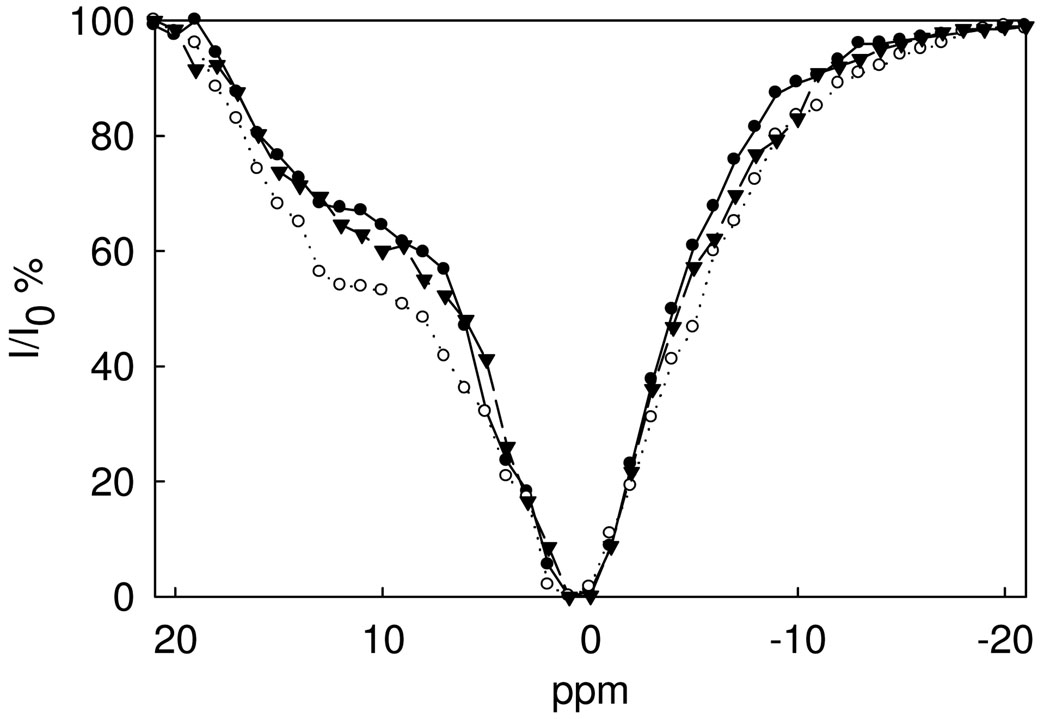
Our interest in the design of lanthanide(III) DNA conjugates as MRI contrast agents led us to study the interaction of Nd2(1) with phosphate esters and DNA to determine whether certain DNA structural elements might support or even enhance the CEST effect (Figure 6, Chart 2). Addition of diethylphosphate (DEP) led to a slight decrease in the CEST peak attributed to the NH group (Figure S5). By contrast, certain structured DNA sequences modestly increased the CEST shoulder at 12 ppm. The hairpin DNA (HP1) was the most efficient (Chart 2) with a 15% enhancement of CEST over the complex alone upon addition of 0.50 mM DNA (Figure 5). Mutation of the closing base pair gives a DNA sequence that enhances the CEST spectrum to a smaller extent at 5%. This suggests that the CEST efficiency is dependent on structural differences in the DNA that are dictated by the closing base pair. In comparison, neither the self complimentary oligonucleotide GGCCGGCC, nor single-stranded T5 measurably affects the CEST spectrum under similar conditions (data not shown).
Figure 6.
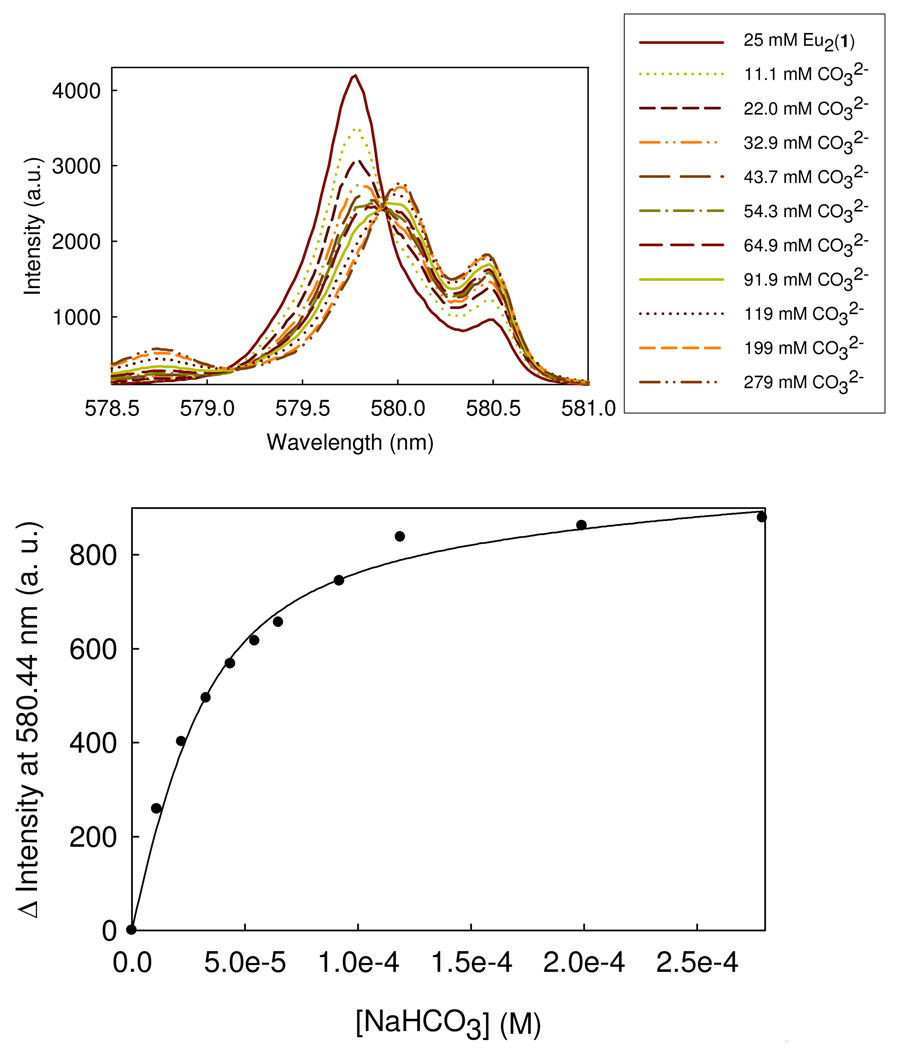
The effect of carbonate on the 7F0 → 5D0 excitation band of Eu2(1) for solutions containing 25 µM Eu2(1), 20 mM HEPES, pH 7.0, 50 mM NaNO3 (top). Data are fit to eq. 4 with a Kd of 15 uM (bottom).
Chart 2.
Figure 5.
CEST spectra of Nd2(1) 5.0 mM (θ) titrated with 0.20 mM (θ) and 0.50 mM (○) HP1 at pH 7.0, 10 mM HEPES, 50 mM NaNO3, 25 °C.
The effect of carbonate on the CEST spectrum of Nd2(1) was examined. Addition of an equivalent of carbonate to the dinuclear complex at pH 7.4 gave a decrease in the amide CEST peak (Figure S6), consistent with suppression of the NH amide CEST effect for the carbonate complex. Addition of Pb(NO3)2 to a solution of Nd2(1) to sequester carbonate had little effect on the CEST spectrum. This result suggests that freshly prepared and degassed solutions of Nd2(1) do not contain carbonate complexes in appreciable quantities. Interaction of Ln2(1) with carbonate and DNA was studied quantitatively by using luminescence spectroscopy for the Eu(III) analog (see below).
Luminescence spectroscopy
Direct excitation luminescence spectroscopy of the Eu2(1) complex was studied to probe interactions with phosphate esters, DNA and carbonate. The 7F0 → 5D0 transition for Eu(III) is between two non-degenerate levels and thus useful for determining the number of species in solution. The 7F0 → 5D0 excitation spectrum of Eu2(1) is shown in Figure 6. As shown previously,(18) the major peak at 579.82 nm is attributed to the dinuclear complex with four bound water ligands (Eu2(1)(H2O)4) and the red-shifted shoulder and peak at 580.22 and 580.53 nm are attributed to a carbonate complex that forms in water at neutral pH upon exposure of the complex to the atmosphere or upon addition of carbonate ion in buffered solutions. For selected studies, the concentration of carbonate complex was reduced to obtain a solution with predominantly (Eu2(1)(H2O)4). This was accomplished by treating the Eu2(1) complex with Pb(NO3)2 to form insoluble Pb(CO3) followed by precipitation of any remaining Pb(II) with chloride ion.
Addition of carbonate to solutions containing Eu2(1) gives rise to two pronounced excitation peaks at 580.20 and 580.45 nm (Figure 6). These two peaks are attributed to two different isomers, both of which have bound carbonate and have low q values of 0.5 to 0.6 (Table 1). The small peak at 578.74 nm that grows in with increasing carbonate concentration is assigned as the free Eu(III) ion.(27) A plot of the luminescence intensity as a function of bicarbonate gives a binding isotherm with a Kd of 15 µM by fitting the data to eq. 4.
Table 1.
Luminescence lifetimes of Eu2(1) upon binding of DNA or carbonate.a
| Anion | Wavelength(nm) | H2O µs | D2O µs | Anion (µM) | q b |
|---|---|---|---|---|---|
| HP1 | 579.64 | 537 | 1700 | 50 | 0.96 |
| HP2 | 579.70 | 512 | 1630 | 50 | 0.93 |
| GGCC | 579.70 | 490 | 1600 | 50 | 1.1 |
| CO32− | 580.45 | 608 | 1330 | 20 | 0.50 |
| CO32− | 580.20 | 587 | 1360 | 20 | 0.59 |
Solutions contained 50 mM NaNO3, 20 mM HEPES, pH 7.0 with 25 µM Eu21(1).
The number of bound water molecules, q, was calculated by using equation 2. Standard deviations in lifetime values are typically ≤ 7% in H2O and ≤ 3% in D2O.(27)
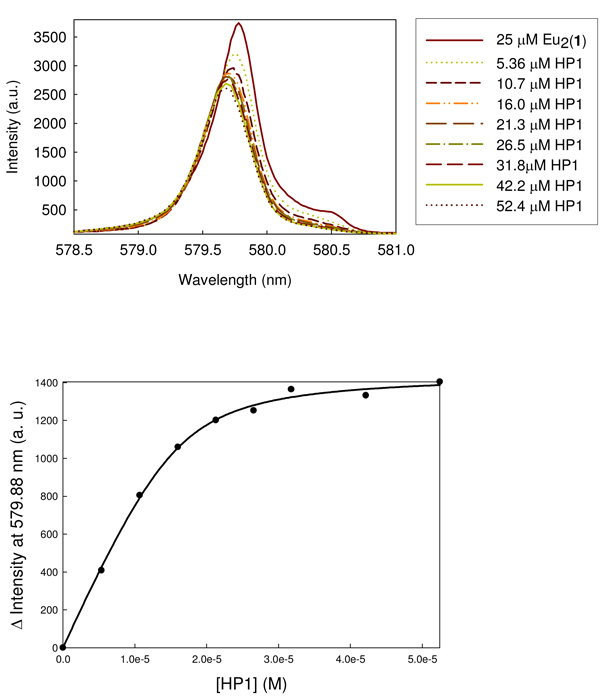
Titration of Eu2(1) with HP1 DNA gives a decrease in the major excitation peak to give a new peak that is slightly blue-shifted (579.69 nm). A plot of the change in luminescence intensity as a function of DNA gives a binding constant of 2.5 µM and n=8.2 (number of bases in binding site) by fitting the data to eq. 3 (Figure 7). HP2 DNA and the self-complementary GGCCGGCC DNA give similar excitation peaks and binding curves with dissociation constants of 4.2 µM (n=12) and 28 µM (n=6.9), respectively (Figure S7, S8). By contrast, T5 has only a small effect on luminescence intensity (Figure S9) and a plot of this change in intensity with DNA concentration suggests that binding is weak under conditions of the titration. Luminescence lifetime studies show that there is a reduction in the number of bound waters on each Eu(III) center of the aqua complex (excitation at 579.82 nm) upon DNA binding to hairpin or double-stranded DNA (Table 1). In addition, excitation luminescence studies of the Eu2(1) carbonate complex treated with DNA (Figure S10) show that the carbonate ligand is displaced by DNA.
Figure 7.
7F0 → 5D0 excitation spectra (5D0 → 7F2 emission) of solutions of 25 µM Eu2(1) titrated with HP1 DNA at pH 7.0, 20 mM HEPES, 50 mM NaNO3 (top). Data are fit to eq. 3 with a Kd of 2.5 µM and n of 8.2 (bottom).
DISCUSSION
Nd2(1) shows a more pronounced CEST effect than the mononuclear complex Nd(2) under the conditions studied here, corresponding to the larger number of mobile amide protons for the dinuclear complex at equal concentrations of complex. In addition, the relatively large exchange rate constant for Nd2(1) amide protons (2700 s−1) contributes favorably to the efficiency of CEST. By comparison, mononuclear Nd(III) complexes have NH proton exchange rate constants that range from 125 s−1 to 826 s−1 .(14, 32) The rate constant for Nd2(1) is nearly as large as it can be (6500 s−1 ) before slow exchange conditions no longer hold Δω• τ≥1. Notably, peaks in the CEST spectrum are observed for mobile protons that approach or even exceed this limit whose resonances are consequently broadened into the baseline.(16)
The solution chemistry of Ln2(1) complexes are dominated by carbonate complex formation. Indeed, isolation of a carbonate free complex of Eu2(1) is difficult in aqueous solution without the addition of a carbonate sequestering agent. Eu2(1) binds carbonate more strongly than related monomeric complexes.(18) This is consistent with the propensity of the dinuclear complex to bind tightly to anions including phosphate esters, carbonate and sulfonates.(18) An increased affinity for anions is attributed in part to the aromatic linker which leads to increased Lewis acidity of the Ln(III) centers as well as the possible interaction of anions with both Ln(III) centers. The two distinct excitation peaks for the carbonate complex are attributed to two isomers. One possibility is that the two isomers have similar numbers of bound waters, based on their nearly identical q numbers derived from luminescence lifetimes. However, the non-integral q number for the isomers (0.5 and 0.6) suggests an alternate explanation. The two carbonate complex isomers that give rise to two distinct excitation peaks may actually differ by number of bound water molecules (q values of approximately 1 and 0), but are in rapid exchange on the luminescence emission time scale to give an apparent q that is the average of the two complexes.(35) This case would be similar to the hydration isomers observed for Eu(EDTA)(H2O)x (x = 2 or 3)(27, 36) that give rise to two excitation peaks but a single luminescence lifetime. For the complexes here, an equilibrium between a bidentate carbonate complex with q = 0,(37) and a monodentate carbonate complex with a q = 1 would be involved. The relatively large difference in the excitation peak frequencies is consistent with this alternative. Also supportive of this assignment is that other carbonate complexes we have reported to date, including both dinuclear and mononuclear Eu(III) complexes of septadentate macrocycles, have two peaks at similar frequencies to those observed here.(18) These similarities suggest that the isomers do not involved interactions that are specific to dinuclear complexes such as bridging carbonate.
Excitation luminescence studies of complexes related to Eu2(1) show that DEP coordinates to dinuclear Eu(III) complexes with a binding constant of 0.43 mM.(18) Luminescence lifetime studies are consistent with displacement of one water molecule at each Eu(III) center upon DEP binding.(38) Assuming a similar binding constant between Nd2(1) and DEP, DEP should be fully bound in the CEST experiment shown in Figure S5. Binding of DEP results in a 10% decrease of the amide CEST peak of the Nd(III) complex. The origin of this decrease may involve a change in the rate constants for amide proton exchange upon binding of DEP mediated by a change in the Lewis acidity of the metal ion center upon complexation of DEP. Alternately, there may be a change in the chemical shift dispersion of the different amide protons for the Nd(III) complex of DEP so that the CEST peak shape is changed. A similar decrease in the CEST amide peak is observed for carbonate binding to Nd2(1). Thus, complexation of either of these two simple anionic ligands leads to a decrease in the CEST amide peak of Nd2(1).
The preparation of biopolymers, polymers and nanoparticles conjugated to multiple copies of CEST agents is of interest in order to increase the number of CEST agents at a targeted tissue.(15, 39–41) For Ln(III) PARACEST agents, the close proximity of a biopolymer may give rise to changes in the CEST peaks attributed to the influence of the biopolymer environment on the complex.(22) Thus, it is important to choose an environment that supports or enhances the CEST effect. Typically, interactions of Ln(III) PARACEST agents with other molecules leads to changes in the rate constants for the mobile protons and this may either enhance or decrease the CEST effect.(16, 17) In some cases, Ln(III) complexes form supramolecular complexes that induce hyperfine shifting of multiple macromolecular protons to enhance the CEST effect.6 In addition to proteins, DNA is of interest for conjugation of lanthanide MRI contrast agents.(24, 25) Our work here shows that Eu2(1) and Nd2(1) complexes interact strongly with DNA and that both binding strength and CEST effect modulation are dependent on DNA secondary structure.
Titration of the Eu2(1) complex with HP1, HP2 and the GGCC stem leads to a decrease in luminescence intensity to form a new complex with a single bound water for each Eu(III) center (q = 1, Table 1). Fitting of the data to a binding isotherm for DNA sequences with multiple binding sites shows that all three DNA sequences bind tightly to Eu2(1) with binding constants that are in the micromolar range. The large binding site sizes for the hairpins (n = 8–11) are most consistent with one to two Eu2(1) complexes bound to DNA. For the GGCC stem, data is most consistent with two Eu2(1) binding sites. In any case, this data suggests that, under the conditions of the CEST experiments which contain higher concentrations of Nd(III) complex and DNA, all DNA is bound to the lanthanide complex. Only single-stranded T5 binds weakly to the dinuclear complex, demonstrating that double helical DNA is required for tight binding. The tight binding constants of the hairpin loops and double-stranded DNA led us to initially anticipate that these DNA sequences would have similar effects on the CEST spectrum of Nd2(1).
Modulation of the CEST spectrum is, however, DNA sequence dependent. The CEST peak of Nd2(1) increases upon addition of the hairpin DNA sequences but not with addition of the GGCC stem or T5. At this juncture it is not known which protons in the Nd2(1) bound DNA complex give rise to the CEST peak. It is likely that, given the large number of amide protons of the Nd(III) complex and the presence of this complex in excess over DNA, the CEST peak results from a favorable increase in the amide proton exchange rate by interaction of the complex with DNA. In addition, it is noteworthy that nucleic acids such as poly U act as CEST agents through both amide NH and alcohol protons. However, the exchangeable DNA amide protons would have to be hyperfine-shifted by the Nd(III) complex(12) to produce the observed CEST peak in our studies. Our data suggest that there is a specific interaction of the Nd2(1) complex with the hairpin loop of HP1 that enhances the CEST peak at 12 ppm. This is supported by the lack of an effect of the GGCC-stem sequence on the CEST spectrum despite strong binding of this DNA to the Ln(III) complex. Even more remarkable is the fact that a change in the hairpin closing base pair (CG to GC) affects the Nd2(1)-DNA complex CEST intensity although both hairpins bind nearly equally as strongly. Given the important role of the closing base pair on DNA hairpin loop structure,(42) this data suggests that loop structure is important in the association of the complex. The limited number of DNA secondary structures studied here prevents us from formulating rules for effective enhancement of Ln(III) CEST agents. Our data suggest, however, that secondary structures such as hairpin loops that have been shown to bind lanthanide ions such as the thymidine triloop studied here(43) give rise to increased CEST effects. Speculation on the mode of Ln(III) complex DNA interactions is premature, but it is noteworthy that a simple phosphate diester decreases the CEST effect. DNA of a particular sequence and structure gives rise to the modestly enhanced CEST spectrum of the Nd2(1)-DNA complex.
CONCLUSIONS
The presence of a large number of exchangeable amide protons in combination with a relatively rapid amide proton exchange rate in the Nd2(1) complex suggests that further development of dinuclear complexes as PARACEST agents is warranted. Binding of carbonate to complexes of Ln2(1) will influence the solution and PARACEST properties of these complexes in biological systems where carbonate concentrations are high. Interestingly, the carbonate acts as a masking agent that is readily displaced by anionic ligands such as DNA that bind even more strongly than carbonate. This work shows that DNA complexes of PARACEST agents are promising for the design of new nanosized biocompatible systems that use DNA as a carrier or as a scaffold. The position of lanthanide ion complex conjugation to DNA and the secondary structure of the DNA conjugate, however, require further study to optimize the CEST effect. This will require the study of different DNA sequences toward a better understanding of the basis for the modulation of the PARACEST effect by macromolecule binding.
Supplementary Material
ACKNOWLEDGEMENT
We thank the National Institutes of Health for support of this work (EB-04609) and the National Science Foundation for a major instrumentation award (CHE-0321058) to build the MOPO laser system.
Footnotes
Supporting information available: CEST spectra and Eu(III) excitation luminescence titrations with DNA with binding curves. This information is free of charge via the internet at http://pubs.acs.org.
LITERATURE CITED
- 1.Ward KM, Aletras AH, Balaban RS. A New Class of Contrast Agents for MRI Based on Proton Chemical Exchange Dependent Saturation Transfer (CEST) J. Mag. Res. 2000;143:79–87. doi: 10.1006/jmre.1999.1956. [DOI] [PubMed] [Google Scholar]
- 2.Zhou J, Payen J-F, Wilson DA, Traystman RJ, van Zijl PCM. Using the amide proton signals of intracellular proteins and peptides to detect pH effects in MRI. Nat. Med. 2003;9:1085–1090. doi: 10.1038/nm907. [DOI] [PubMed] [Google Scholar]
- 3.Guivel-Scharen V, Sinnwell T, Wolff SD, Balaban RS. Detection of Proton Chemical Exchange between Metabolites and Water in Biological Tissues. J. Mag. Res. 1998;133:36–45. doi: 10.1006/jmre.1998.1440. [DOI] [PubMed] [Google Scholar]
- 4.Sun PZ, Zhou J, Sun W, Huang J, van Zijl PCM. Suppression of lipid artifacts in amide proton transfer imaging. Mag. Res. Med. 2005;54:222–225. doi: 10.1002/mrm.20530. [DOI] [PubMed] [Google Scholar]
- 5.Zhou J, van Zijl PCM. Chemical exchange saturation transfer imaging and spectroscopy. Prog. NMR Spect. 2006;48:109–136. [Google Scholar]
- 6.Aime S, Castelli DD, Terreno E. Novel pH-reporter MRI contrast agents. Angew. Chem., Int. Ed. 2002;41:4334–4336. doi: 10.1002/1521-3773(20021115)41:22<4334::AID-ANIE4334>3.0.CO;2-1. [DOI] [PubMed] [Google Scholar]
- 7.Zhang S, Winter P, Wu K, Sherry AD. A Novel Europium(III)-Based MRI Contrast Agent. J. Am. Chem. Soc. 2001;123:1517–1518. doi: 10.1021/ja005820q. [DOI] [PubMed] [Google Scholar]
- 8.Zhang S, Merritt M, Woessner DE, Lenkinski RE, Sherry AD. PARACEST Agents: Modulating MRI Contrast via Water Proton Exchange. Acc. Chem. Res. 2003;36:783–790. doi: 10.1021/ar020228m. [DOI] [PubMed] [Google Scholar]
- 9.Goffeney N, Bulte JWM, Duyn J, Bryant LH, van Zijl PCM. Sensitive NMR Detection of Cationic-Polymer-Based Gene Delivery Systems Using Saturation Transfer via Proton Exchange. J. Am. Chem. Soc. 2001;123:8628–8629. doi: 10.1021/ja0158455. [DOI] [PubMed] [Google Scholar]
- 10.Pikkemaat JA, Wegh RT, Lamerichs R, van de Molengraaf RA, Langereis S, Burdinski D, Raymond AYF, Janssen HM, de Waal BFM, Willard NP, Meijer EW, Grüll H. Dendritic PARACEST contrast agents for magnetic resonance imaging. Cont. Med. Mol. Imag. 2007;2:229–239. doi: 10.1002/cmmi.149. [DOI] [PubMed] [Google Scholar]
- 11.Ali MM, Woods M, Suh EH, Kovacs Z, Tircso G, Zhao P, Kodibagkar VD, Sherry AD. Albumin-binding PARACEST agents. JBIC, J. Biol. Inorg. Chem. 2007;12:855–865. doi: 10.1007/s00775-007-0240-z. [DOI] [PMC free article] [PubMed] [Google Scholar]
- 12.Snoussi K, Bulte JWM, Guéron M, van Zijl PCM. Sensitive CEST agents based on nucleic acid imino proton exchange: detection of poly(rU) and of a dendrimer-poly(rU) model for nucleic acid delivery and pharmacology. Magn. Reson. Med. 2003;49:998–1005. doi: 10.1002/mrm.10463. [DOI] [PubMed] [Google Scholar]
- 13.Yoo B, Pagel MD. Peptidyl Molecular Imaging Contrast Agents Using a New Solid-Phase Peptide Synthesis Approach. Bioconjugate Chem. 2007;18:903–911. doi: 10.1021/bc060250q. [DOI] [PMC free article] [PubMed] [Google Scholar]
- 14.Zhang S, Michaudet L, Burgess S, Sherry AD. The amide protons of an ytterbium(III) dota tetraamide complex act as efficient antennae for transfer of magnetization to bulk water. Angew. Chem., Int. Ed. 2002;41:1919–1921. [PubMed] [Google Scholar]
- 15.Yoo B, Pagel MD. An overview of responsive MRI contrast agents for molecular imaging. Frontiers in Bioscience. 2008;13:1733–1752. doi: 10.2741/2796. [DOI] [PubMed] [Google Scholar]
- 16.Huang C-H, Morrow JR. A PARACEST Agent Responsive to Inner- And Outer-Sphere Phosphate Ester Interactions for MRI Applications. J. Am. Chem. Soc. 2009;131:4206–4207. doi: 10.1021/ja900290z. [DOI] [PMC free article] [PubMed] [Google Scholar]
- 17.Aime S, Delli Castelli D, Fedeli F, Terreno E. A Paramagnetic MRI-CEST Agent Responsive to Lactate Concentration. J. Am. Chem. Soc. 2002;124:9364–9365. doi: 10.1021/ja0264044. [DOI] [PubMed] [Google Scholar]
- 18.Nwe K, Andolina C, Morrow JR. Tethered Dinuclear Eu(III) Catalysts for the Cleavage of RNA. J. Am. Chem. Soc. 2008;130:14861–14871. doi: 10.1021/ja8037799. [DOI] [PubMed] [Google Scholar]
- 19.Harte AJ, Jensen P, Plush SE, Kruger PE, Gunnlaugsson T. A Dinuclear Lanthanide Complex for the Recognition of Bis(carboxylates): Formation of Terbium(III) Luminescent Self-Assembly Ternary Complexes in Aqueous Solution. Inorg. Chem. 2006;45:9465–9474. doi: 10.1021/ic0614418. [DOI] [PubMed] [Google Scholar]
- 20.Dickins RS, Gunnlaugsson T, Parker D, Peacock RD. Reversible anion binding in aqueous solution at a cationic heptacoordinate lanthanide center: selective bicarbonate sensing by time-delayed luminescence. Chem. Commun. 1998:1643–1644. [Google Scholar]
- 21.Murray BS, New EJ, Pal R, Parker D. Critical evaluation of five emissive europium(iii) complexes as optical probes: correlation of cytotoxicity, anion and protein affinity with complex structure, stability and intracellular localisation profile. Org. Biomol. Chem. 2008;6:2085–2094. doi: 10.1039/b803895c. [DOI] [PubMed] [Google Scholar]
- 22.Vasalatiy O, Zhao P, Zhang S, Aime S, Sherry AD. Catalytic effects of apoferritin interior surface residues on water proton exchange in lanthanide complexes. Contrast Media Mol. Imaging. 2006;1:10–14. doi: 10.1002/cmmi.93. [DOI] [PubMed] [Google Scholar]
- 23.Himmelreich U, Aime S, Hieronymus T, Justicia C, Uggeri F, Zenke M, Hoehn M. A responsive MRI contrast agent to monitor functional cell status. NeuroImage. 2006;32:1142–1149. doi: 10.1016/j.neuroimage.2006.05.009. [DOI] [PubMed] [Google Scholar]
- 24.Crich Simonetta G, Lanzardo S, Barge A, Esposito G, Tei L, Forni G, Aime S. Visualization through magnetic resonance imaging of DNA internalized following “in vivo” electroporation. Mol Imaging. 2005;4:7–17. doi: 10.1162/15353500200504151. [DOI] [PubMed] [Google Scholar]
- 25.Cai J, Shapiro EM, Hamilton AD. Self-Assembling DNA Quadruplex Conjugated to MRI Contrast Agents. Bioconjugate Chem. 2009;20:205–208. doi: 10.1021/bc8004182. [DOI] [PMC free article] [PubMed] [Google Scholar]
- 26.McMahon MT, Zhou J, Gilad AA, Bulte JWM, van Zijl PCM. Physical mechanism and applications of CEST contrast agents. Mol. Cell. MRI. 2007:85–100. [Google Scholar]
- 27.Andolina CM, Holthoff WG, Page PM, Mathews RA, Morrow JR, Bright FV. Spectroscopic System for Direct Lanthanide Photoluminescence Spectroscopy with Nanomolar Detection Limits. Appl. Spectrosc. 2009;63:483–493. doi: 10.1366/000370209788346959. [DOI] [PubMed] [Google Scholar]
- 28.Supkowski RM, Horrocks WD. On the determination of the number of water molecules, q, coordinated to europium(III) ions in solution from luminescence decay lifetimes. Inorg. Chim. Acta. 2002;340:44–48. [Google Scholar]
- 29.Beeby A, Clarkson IM, Dickins RS, Faulkner S, Parker D, Royle L, de Sousa AS, Williams JAG, Woods M. Non-radiative deactivation of the excited states of europium, terbium and ytterbium complexes by proximate energy-matched OH, NH and CH oscillators: an improved luminescence method for establishing solution hydration states. J. Chem. Soc., Perkin Trans. 1999;2:493–504. [Google Scholar]
- 30.Stootman FH, Fisher DM, Rodger A, Aldrich-Wright JR. Improved curve fitting procedures to determine equilibrium binding constants. Analyst. 2006;131:1145–1151. doi: 10.1039/b604686j. [DOI] [PubMed] [Google Scholar]
- 31.Ye Y, Lee H-W, Yang W, Shealy S, Yang JJ. Probing Site-Specific Calmodulin Calcium and Lanthanide Affinity by Grafting. J. Am. Chem. Soc. 2005;127:3743–3750. doi: 10.1021/ja042786x. [DOI] [PubMed] [Google Scholar]
- 32.Terreno E, Castelli DD, Cravotto G, Milone L, Aime S. Ln(III)-DOTAMGly complexes: a versatile series to assess the determinants of the efficacy of paramagnetic chemical exchange saturation transfer agents for magnetic resonance imaging applications. Invest Radiol. 2004;39:235–243. doi: 10.1097/01.rli.0000116607.26372.d0. [DOI] [PubMed] [Google Scholar]
- 33.Wojciechowski F, Suchy M, Li AX, Azab HA, Bartha R, Hudson RHE. A Robust and Convergent Synthesis of Dipeptide-DOTAM Conjugates as Chelators for Lanthanide Ions: New PARACEST MRI Agents. Bioconjugate Chem. 2007;18:1625–1636. doi: 10.1021/bc0701287. [DOI] [PubMed] [Google Scholar]
- 34.Woods M, Woessner DE, Zhao P, Pasha A, Yang M-Y, Huang C-H, Vasalitiy O, Morrow JR, Sherry AD. Europium(III) Macrocyclic Complexes with Alcohol Pendant Groups as Chemical Exchange Saturation Transfer Agents. J. Am. Chem. Soc. 2006;128:10155–10162. doi: 10.1021/ja061498t. [DOI] [PMC free article] [PubMed] [Google Scholar]
- 35.Bruno J, Herr BR, Horrocks WD., Jr Laser-induced luminescence studies of europium hexaazamacrocycle Eu(HAM)3+ An evaluation of complex stability and the use of the gadolinium analog as a relaxation agent in yttrium-89 NMR. Inorg. Chem. 1993;32:756–762. [Google Scholar]
- 36.Graeppi N, Powell DH, Laurenczy G, Zekany L, Merbach AE. Coordination equilibria and water exchange kinetics of lanthanide(III) propylenediaminetetraacetates and other magnetic resonance imaging related complexes. Inorg. Chim. Acta. 1995;235:311–326. [Google Scholar]
- 37.Dickins RS, Aime S, Batsanov AS, Beeby A, Botta M, Bruce JI, Howard JAK, Love CS, Parker D, Peacock RD, Puschmann H. Structural, Luminescence, and NMR Studies of the Reversible Binding of Acetate, Lactate, Citrate, and Selected Amino Acids to Chiral Diaqua Ytterbium, Gadolinium, and Europium Complexes. J. Am. Chem. Soc. 2002;124:12697–12705. doi: 10.1021/ja020836x. [DOI] [PubMed] [Google Scholar]
- 38.Nwe K, Richard JP, Morrow JR. Direct excitation luminescence spectroscopy of Eu(III) complexes of 1,4,7-tris(carbamoylmehtyl)-1,4,7,10-tetraazacyclododecane derivatives and kinetic studies of their catalytic cleavage of an RNA analog. Dalton Trans. 2007:5171–5178. doi: 10.1039/b710072h. [DOI] [PubMed] [Google Scholar]
- 39.Liu G, Li Y, Pagel MD. Design and characterization of new irreversible responsive PARACEST MRI contrast agent that detects nitric oxide. Magn. Reson. Med. 2007;58:1249–1256. doi: 10.1002/mrm.21428. [DOI] [PubMed] [Google Scholar]
- 40.Trokowski R, Zhang S, Sherry AD. Cyclen-Based Phenylboronate Ligands and Their Eu3+ Complexes for Sensing Glucose by MRI. Bioconjugate Chem. 2004;15:1431–1440. doi: 10.1021/bc0498976. [DOI] [PubMed] [Google Scholar]
- 41.Zhang S, Trokowski R, Sherry AD. A Paramagnetic CEST Agent for Imaging Glucose by MRI. J. Am. Chem. Soc. 2003;125:15288–15289. doi: 10.1021/ja038345f. [DOI] [PubMed] [Google Scholar]
- 42.Moody EM, Bevilacqua PC. Folding of a Stable DNA Motif Involves a Highly Cooperative Network of Interactions. J. Am. Chem. Soc. 2003;125:16285–16293. doi: 10.1021/ja038897y. [DOI] [PubMed] [Google Scholar]
- 43.Mathews RA. Ph.D. Thesis. University at Buffalo, State University of New York; 2008. Cleavage of an RNA analog by mononuclear Zn(II) macrocyclic complexes and metal ion and metallodrug interactions with deoxyribonucleic acids. [Google Scholar]
Associated Data
This section collects any data citations, data availability statements, or supplementary materials included in this article.


