

Abstract
Rationale: Lung adenocarcinoma histology and clinical outcome are heterogeneous and associated with tumor invasiveness. Objectives: We hypothesized that invasiveness is associated with a distinct molecular signature and that genes differentially expressed in tumor or adjacent stroma will identify cell surface signal transduction and matrix remodeling pathways associated with the acquisition of invasiveness in lung adenocarcinoma. Main Results: Microarray analysis of microdissected noninvasive bronchioloalveolar carcinoma (BAC) and invasive adenocarcinoma and adenocarcinoma-mixed type with BAC features identified transcriptional profiles of lung adenocarcinoma invasiveness. Among the signature set that was lower in adenocarcinoma-mixed compared with BAC was the type II transforming growth factor β (TGF-β) receptor, suggesting downregulation of TGFβRII is an early event in lung adenocarcinoma metastasis. Immunostaining in independently acquired specimens demonstrated a correlation between TβRII expression and length of tumor invasion. Repression of TGFβRII in lung cancer cells increased tumor cell invasiveness and activated p38 mitogen-activated protein kinases. Microarray analysis of invasive cells identified potential downstream mediators of TGFβRII with differential expression in lung adenocarcinomas. Conclusions: The repression of type II TGF-β receptor may act as a significant determinant of lung adenocarcinoma invasiveness, an early step in tumor progression toward metastasis.
Keywords: adenocarcinoma, lung cancer, microarray analysis, neoplasm invasiveness, transforming growth factor-β
Lung cancer, the leading cause of cancer death in the United States, with 163,000 deaths expected in 2005, is also the leading cause of cancer death worldwide, with 1.1 million annual deaths (1). In contrast to other common neoplasms in breast, colon, and prostate, which are predominantly adenocarcinoma, only 40% of lung cancers are adenocarcinomas. Within the subtype of non–small cell lung carcinoma, all tumors are treated similarly without regard to biological heterogeneity, which may be associated with histologic subclassification. The poor outcome of lung cancer compared with other common cancers (15 vs. 62–97% average 5-year survival) is partly attributable to the current limited ability to distinguish fundamental differences in tumor biological predisposition to metastasis that may be associated with histologic heterogeneity.
Lung cancer metastasis is frequent; approximately 40% of patients have distant metastases at the time of diagnosis. Furthermore, among patients who present with localized resectable disease, approximately 30% will develop metastases and succumb to their disease within 5 years. Lung cancer metastasis to lymphatics and visceral organ beds via the systemic circulation is the result of several well-characterized, sequentially acquired properties of tumor cells. These steps include the following: enzyme-mediated invasion of organ stroma, circulation in lymphatic or vascular channels, and extravasation and proliferation in distant organ beds (2). Using high-throughput genomic strategies, the molecular programs driving the tumor–stromal interactions that lead to metastases are becoming well characterized, with delineation of roles for transcription factors (3, 4), proteinases, such as matrix metalloproteinase-11 and cathepsin L2 (5), and chemokines, such as CXCL12 and CXCL14 (6).
We and other researchers have previously reported molecular signatures discriminative of non–small cell lung carcinoma differentiation and prognosis (7–10). Gene signatures of lung carcinoma prognosis often contain gene classifiers of metastasis in other tumor systems. A potential limitation of molecular signatures of prognosis derived from resected tumors is that associations of gene expression with survival may be confounded by tumor biological heterogeneity and non–tumor-related properties, such as patient performance status, comorbid disease, and non–cancer-related causes of death. To address this limitation, we have focused on identifying signatures of invasiveness, an intrinsic biological tumor attribute directly related to the clinically relevant endpoint of metastasis.
Within lung adenocarcinoma, histology is heterogeneous and associated with tissue invasion and clinical outcomes. The World Health Organization has subclassified adenocarcinoma on the basis of predominant cell morphology and growth pattern (11), such as bronchioloalveolar carcinoma (BAC), adenocarcinoma with mixed subtypes, and homogenously invasive tumors with a variety of histologic patterns. BAC cells are cuboidal to columnar, with or without mucin, and grow in a noninvasive fashion along alveolar walls. The histologic distinction between BAC and other adenocarcinoma subclassifications is tissue invasion, the first step of the metastasis process, in which epithelial cells lose cell–cell adhesion, gain motility, and invade adjacent stroma (2). Adenocarcinomas with mixed subtypes frequently contain regions of noninvasive tumor at the periphery of invasive tumor. Pure invasive adenocarcinomas are devoid of bronchioloalveolar morphology.
The spectrum of intratumoral histologic heterogeneity in adenocarcinoma suggests invasiveness represents a continuum of disease, from noninvasive BAC to adenocarcinoma-mixed subtype with BAC component to pure invasive adenocarcinoma. The molecular events essential to this transition in the lung are presently unknown. This study focuses on invasion in lung adenocarcinoma, a significant biological and morphologic characteristic of cancer. We hypothesize that adenocarcinoma invasiveness will be distinguished by a unique molecular signature and that genes differentially expressed in tumor or in adjacent stroma will identify cell surface signal transduction and matrix remodeling pathways associated with the acquisition of invasiveness in lung adenocarcinomas. We used DNA microarray gene expression profiling to identify signatures of invasiveness. Among the genes in the acquisition of invasiveness classifiers was the type II transforming growth factor β (TGF-β) receptor (TGFβRII), which was expressed at lower levels in invasive tumors. We examined the role of TβRII, showing that repression is directly associated with increased invasiveness, and we identified potential effectors of TGF-β–mediated invasion in lung adenocarcinoma. Some of the results have been reported previously in the form of an abstract.
METHODS
DNA Microarray Analysis
Methods for RNA extraction, labeling, and hybridization for DNA microarray analysis of lung tumor specimens have been described previously (10). Some of the microarray data have been reported previously (12). Probe level analysis was performed using the Robust Multiarray Algorithm (13). Gene expression data were normalized to a baseline value obtained from nonmalignant lung tissues. The gene list was filtered to include only genes with a log ratio range greater than 1 and those present in at least two specimens. Thus, 2,194 genes remained for analysis. Hierarchic clustering was performed with Pearson correlation using GeneSpring version 7.0 (Silicon Genetics, Redwood City, CA). Specimen acquisition procedures were approved by the Columbia University Medical Center Institutional Review Board.
For the cell line data, RNA was extracted from H23 and SK-LU (obtained from American Type Culture Collection [ATCC]) snap-frozen cell pellets acquired 48 hours after administration of siRNA constructs in experiments performed in duplicate. cRNA were hybridized to the Affymetrix U133 Plus 2.0 array (Redwood City, CA). Probe level analysis was performed using Robust Multiarray Algorithm normalization without a baseline. The gene list was filtered to include 14,035 genes with a log ratio range greater than 1. To determine expression of U133 Plus 2.0 array genes in lung tumor specimens analyzed with U95Av2 arrays, homologous probes were identified using the following website source: http://www.affymetrix.com/analysis/index.affx.
Quantitative Real-Time Polymerase Chain Reaction in Tumors
Tumor RNA was isolated from frozen sections with the RNeasy Kit (Qiagen, Valencia, CA) and converted into cDNA using SuperScriptIII (Invitrogen, Basel, Switzerland).
Immunostaining
TβRII tumor immunostaining was performed in formalin-fixed paraffin-embedded sections (antibody source, R&D Systems, Minneapolis, MN: AF-241-NA). The antibody was diluted 1:50. Pituitary adenoma was used as a positive control. The staining of TβRII was recorded as negative (score 0), low (faint multifocal or diffuse staining, score 1), or high (strong multifocal or diffuse staining, score 2). All slides were reviewed blinded to the results of the analysis of greatest linear dimension of histologic invasiveness, which was performed before immunostaining.
For immunofluoresence, cells transfected with siRNA or negative control were grown on glass cover slips for 48 hours until fixation. Immunofluoresence was performed using primary antibody diluted 1:100 and visualized on the Nikon Eclipse E600 (Melville, NY) using Alexa Green conjugated antigoat antibody. Images were obtained through the SPOT analysis program (Diagnostic Instruments, Sterling Heights, MI).
RNA Interference
Predesigned annealed siRNA (sense 5′-GGUCGCUUUGCUGAGGUCUtt-3′, antisense 5′-AGACCUCAGCAAAGCGACCtt-3′) against human TGFβRII and control siRNA, which has no significant homology to any known gene sequences, were purchased from Ambion (Austin, TX; catalog no. 16704 and 4611). Cells were seeded in 6-well plates at a concentration of 200,000 cells/well for 24 hours before transfection. Transfection was performed using Lipofectamine 2000 (Invitrogen) using 100 nM annealed siRNA as directed. Transfection efficiency was measured using the Silencer B-actin siRNA control system (catalog no. 4607; Ambion).
Transwell Migration
TGFβRII knock-down and control cells were harvested 48 hours after transfection and placed into serum-free media. A total of 50,000 cells were loaded into the top chamber of the BD Biocoat Matrigel Invasion Chamber (BD Biosciences, San Diego, CA), with fetal bovine serum 25% in the lower chamber, and were incubated for 22 hours. Noninvading cells adherent to the top surface were removed by scrubbing, and invasive cells were fixed and stained with Diff-Quik (Dade Behring, Deerfield, IL). Five representative fields (5×) were counted.
Western Analysis
Cells were treated with TGF-β (R&D Systems) 1 ng/ml after maintenance in serum-free media for 1 hour. Whole cell protein extracts from cells were prepared using radio immunoprecipitation assay (RIPA) buffer (0.15 mM NaCl/0.05 mM Tris HCl, pH 7.2/1% Triton X-100/1% sodium deoxycholate/0.1% sodium dodecyl sulfate) and from tissues using TNT lysis buffer (20 mm Tris HCl, pH 8.0/150 mm NaCl/1% Triton X-100). Immunoblots were incubated with the indicated antibody and detected using a BM chemiluminescence kit (Roche). Intensity (densitometric units) was obtained using Image J v1.33 (http://rsb.info.nih.gov/ij/). Sources of antibody were as follows: Cell Signaling (Beverly, MA) (total p38, phospho-p38, phospho-Smad2, total Akt, phospho-Akt); BD Transduction Laboratories (San Diego, CA) (total-Smad2), Sigma (St. Louis, MO) (β-actin), and Santa Cruz (Santa Cruz, CA) (TβRII, no. 17792).
RESULTS
We examined gene expression signatures associated with invasiveness in lung adenocarcinoma represented by the subclasses: BAC (n = 5), invasive carcinoma (n = 10), and adenocarcinoma with both BAC and invasive components (adenocarcinoma-mixed, n = 10; Figure 1). The complete gene expression dataset of the microdissected lung adenocarcinoma specimens is available at http://hora.cpmc.columbia.edu/dept/pulmonary/5ResearchPages/Laboratories/Powell%20Lab.htm. Demographic attributes for the patients in the study are provided in Table 1. Unsupervised hierarchic clustering identified three subgroups of specimens that were associated with invasiveness. Specimens derived from invasive adenocarcinomas clustered separately from other tumors, and 13 of 15 BAC and adenocarcinoma-mixed segregated according to histologic subtype class (Figure 2). Two other tumors (A20 and B1) displayed a transcriptional profile distinct from other specimens with similar histologic subtype. Because morphologic characteristics or clinical parameters did not account for clustering of these two specimens, it is possible the gene signature was affected by tissue heterogeneity that persisted despite needle microdissection or by other tumor properties not macroscopically obvious. Overall, the dendrogram indicates that adenocarcinoma histology subclassification and invasiveness are associated with global differences in gene expression.
Figure 1.
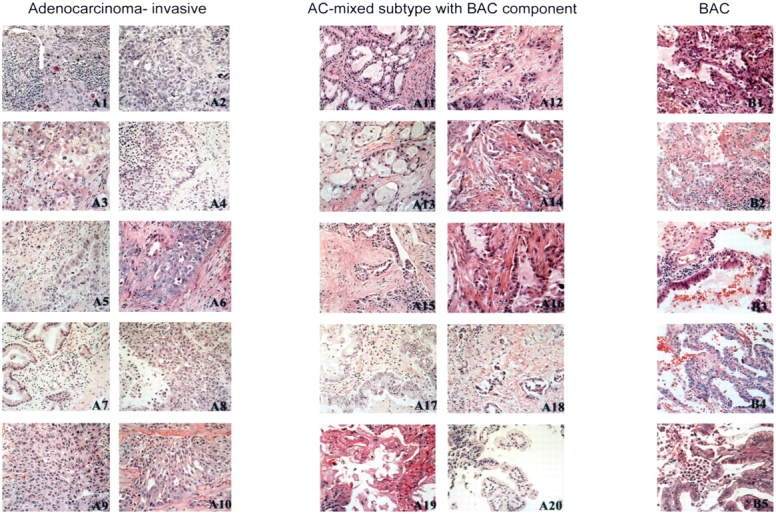
Lung adenocarcinoma histologic subtypes. Photomicrographs of representative permanent sections of regions microdissected from adenocarcinoma tumors for gene profiling. The histopathology patterns of adenocarcinoma correspond to three major groups, using World Health Organization classification. The tumors in the left panel are invasive adenocarcinomas without a bronchioloalveolar component. The tumors in the center panel are mixed subtype adenocarcinomas (AC), showing a bronchioloalveolar carcinoma (BAC) component that ranged from 25 to 80% of the entire tumor. The tumors in the right panel are BAC. Hematoxylin–eosin stain; original magnification, ×100.
TABLE 1.
Characteristics of patients' adenocarcinoma tumors
| ID | Age | Sex | Histology | Size (cm) | Stage |
|---|---|---|---|---|---|
| 20009 | 61 | M | Invasive | 3 | T1N0 |
| 22003 | 59 | F | Invasive | 4 | T2N0 |
| 21006 | 77 | F | Invasive | 1.5 | T1N0 |
| 22005 | 68 | M | Invasive | 2 | T1N0 |
| 99034 | 79 | F | Invasive | 4.5 | T2N0 |
| 21012 | 68 | F | Invasive | 5 | T2N0 |
| 99015 | 66 | F | Invasive | 2.6 | T1N0 |
| 99035 | 70 | F | Invasive | 3.5 | T2N1 |
| 21014 | 51 | F | Invasive | 1.3 | T1N0 |
| 23005 | 55 | M | Invasive | 6 | T3N1 |
| 20014 | 73 | F | AC-mixed | 5 | T2N0 |
| 21002 | 39 | F | AC-mixed | 12 | T2N1 |
| 20033 | 62 | M | AC-mixed | 3.5 | T2N2 |
| 21001 | 63 | M | AC-mixed | 1.2 | T1N0 |
| 21011 | 56 | F | AC-mixed | 1.5 | T1N1 |
| 99043 | 56 | F | AC-mixed | 1.8 | T1N0 |
| 22037 | 70 | M | AC-mixed | 3 | T2N0 |
| 22051 | 80 | F | AC-mixed | 2.5 | T2N0 |
| 22048 | 77 | M | AC-mixed | 3.5 | T2N0 |
| 21013 | 67 | M | AC-mixed | 1.4 | T1N0 |
| 21028 | 74 | M | BAC | 2 | T1N0 |
| 22057 | 65 | F | BAC | 2.5 | T1N0 |
| 22056 | 77 | F | BAC | 3 | T1N0 |
| 22058 | 68 | F | BAC | 4 | T2N0 |
| 22011 | 56 | F | BAC | 2.6 | T1N0 |
Definition of abbreviations: AC = adenocarcinoma; BAC = bronchioloalveolar carcinoma; F = female; M = male.
Figure 2.

Hierarchical clustering of adenocarcinoma histologic subtypes. Lung adenocarcinoma tumor specimens representing BAC, pure invasive, and AC-mixed subtype were subjected to microarray analysis using the Affymetrix U95Av2 array. Unsupervised hierarchical clustering diagram indicates that invasive adenocarcinomas (blue) cluster separately from other subclassifications. Specimens are labeled to match order of panels displayed in Figure 1. The clustering procedures were performed using randomly assigned study identification numbers. With two exceptions, BAC tumors (yellow) cluster together separately from AC-mixed with BAC features (red).
We performed supervised analysis using an F test within BRB array tools (developed by Richard Simon and Amy Peng Lam; http://linus.nci.nih.gov/BRB-ArrayTools.html) to identify genes associated with histologic subtype. A total of 319 genes were differentially expressed among the three subclasses (p < 0.01; Figure 3, left panel, and Table E1 in the online supplement). As expected, the gene expression signature of pure invasive tumors was distinct from signatures of other adenocarcinomas. Functional annotation of the invasive genes suggests that, when tumor cells acquire an invasive phenotype, they also acquire a predominant gene expression signature corresponding to functions acquired by advanced malignant cells, such as cell cycle regulation, cell proliferation, and DNA replication and repair. The supervised and unsupervised clustering analyses indicate that gene expression profiles of BAC and pure invasive tumors are starkly distinct. The pattern of adenocarcinoma-mixed subtype gene expression suggests it may represent an intermediate phenotype in terms of gene expression and morphology.
Figure 3.
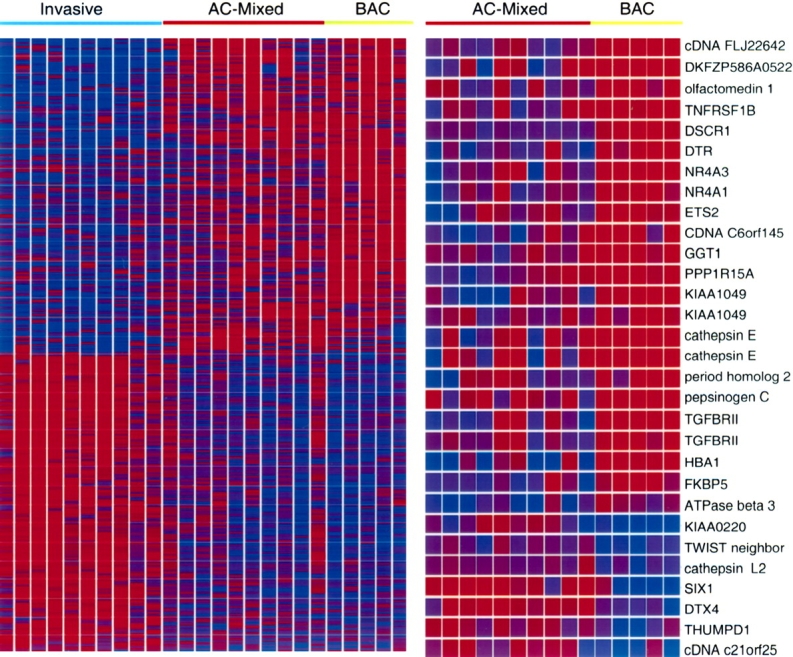
Supervised clustering of differentially expressed genes for the three subclasses of adenocarcinoma. Genes differentially expressed in three histologic subtypes (left panel) and in BAC versus AC-mixed (right panel) were identified using BRB-array tools, with p < 0.01. To determine that the class assignments were robust and that multiple testing was implicitly taken into account, class labels were randomly permuted 1,000 times and a permutation p value less than 0.01 was associated with each gene in the lists. The probability of obtaining at least 319 genes (left) and 30 genes (right) significant by chance (at the 0.01 level), if there were no real differences between the classes, was 0 and 0.002, respectively. Genes are on the y axis and tumors on the x axis. Red indicates high expression and blue indicates low expression, with the color scale at 0 to 5 relative to the experiment median.
We were interested in identifying signaling pathways that might induce the acquisition of invasiveness in adenocarcinoma-mixed type lung adenocarcinoma. We therefore directed our attention to the BAC and adenocarcinoma-mixed subtype tumors that were similar in terms of differentiation and morphology, with the exception of invasion. We used a t test within BRB array tools to identify the subset of 30 genes that were differentially expressed in BAC versus adenocarcinoma-mixed subtype tumors (p < 0.01). The genes with the most significant differential expression between the two tumor subtypes are as ranked in Table 2 and Figure 3 (right panel). Among the invasion signature genes are several transcription factors, enzymes, and signaling agonists and antagonists. Consistent with their role in tumorigenesis, SIX1 and CTSL2 were highly expressed in adenocarcinoma-mixed type tumors compared with BAC tumors. SIX1 is a homeodomain containing transcription factor important in the development of eye, muscle, and brain, and is implicated in the pathogenesis of cancer (14). SIX1 transcriptionally regulates cyclinA1-mediated tumor cell proliferation (15) and, more relevant to our focus, promotes tumor cell invasiveness (16). CTSL2 encodes cathepsin L, a lysosomal C1A family cysteine proteinase that degrades intracellular and extracellular proteins. Cathepsin L mediates tumor cell invasion in a matrix metalloproteinase–independent fashion (17). We examined the list of probe sets lower in adenocarcinoma-mixed tumors compared with BAC to identify potential lung adenocarcinoma invasiveness suppressors. Among this list were two probes representing the tumor suppressor TGFβRII, which encodes a transmembrane receptor that modulates TGF-β signaling. Importantly, in colorectal carcinoma, loss of TGF-β responsiveness attributable to the mutation of TGFβRII is associated with acquisition of invasiveness in adenomatous polyps (18). Our results suggested that, analogous to its role in colorectal carcinoma, repression of TβRII in lung adenocarcinoma promotes the acquisition of invasiveness.
TABLE 2.
Genes differentially expressed in bronchioloalveolar carcinoma versus adenocarcinoma-mixed subtype
| Probe | Gene Description | GenBank | Gene Category | p Value | ||||
|---|---|---|---|---|---|---|---|---|
| Genes Highly Expressed in AC-Mixed Type Compared with BAC Tumors | ||||||||
| 4095_at | PI-3-kinase–related SMG-1-like (KIAA0220) | AL049250 | Unknown function | 0.0003181 | ||||
| 40004_at | Sine oculis homeobox homolog 1 (SIX1) | X91868 | Transcription factor | 0.0007989 | ||||
| 35369_at | Deltex 4 homolog (DTX4) | AB023154 | Unknown function | 0.0018299 | ||||
| 40617_at | THUMP domain containing 1 | AC004381 | Unknown function | 0.0022976 | ||||
| 35007_at | TWIST neighbor | AC004940 | Unknown function | 0.0025262 | ||||
| 32107_at | cDNA c21orf25 | AL050173 | Unknown function | 0.0029529 | ||||
| 40717_at | Cathepsin L2 | AB001928 | Cysteine proteinase | 0.0073467 | ||||
| Genes Highly Expressed in BAC Compared with AC-Mixed Type Tumors | ||||||||
| 34840_at | cDNA FLJ22642 | AI700633 | Unknown function | 9.51E-05 | ||||
| 32168_s_at | Down syndrome critical region gene 1 | U85267 | Calcineurin-mediated signaling regulation | 0.0005758 | ||||
| 41267_at | mRNA for KIAA1049 | AB028972 | Unknown function | 0.0015624 | ||||
| 280_g_at | NR4A1 | L13740 | Steroid-thyroid hormone-retinoid receptor superfamily | 0.0018289 | ||||
| 31525_s_at | Hemoglobin, α pseudogene 1 | J00153 | Unknown function | 0.0020264 | ||||
| 206_at | Cathepsin E (CTSE) | M84424 | Aspartic proteinase | 0.0024424 | ||||
| 40659_at | NR4A3 | U12767 | Steroid-thyroid hormone-retinoid receptor superfamily | 0.0032117 | ||||
| 38037_at | Diphtheria toxin receptor (DTR) | M60278 | EGF-like growth factor | 0.0039134 | ||||
| 34246_at | cDNA C6orf145 | AA418437 | Unknown function | 0.0039684 | ||||
| 1814_at | TGFBRII | D50683 | Serine/threonine kinase receptor | 0.0043177 | ||||
| 37028_at | Protein phosphatase 1, regulatory subunit 15A | U83981 | Serine threonine kinase/protein phosphatase | 0.0044977 | ||||
| 271_s_at | CTSE | J05036 | Aspartic proteinase | 0.0047981 | ||||
| 35008_at | Period homolog 2 (PER2) | AB002345 | Ciracadian regulator | 0.004922 | ||||
| 33699_at | Pepsinogen C (PGC) | M18667 | Aspartic proteinase | 0.0049418 | ||||
| 1815_g_at | TGFBRII | D50683 | Serine/threonine kinase receptor | 0.0050199 | ||||
| 34721_at | FKBP5 | U42031 | Peptidylprolyl isomerase | 0.0052014 | ||||
| 38717_at | DKFZP586A0522 | AL050159 | Methyltransferase | 0.0061461 | ||||
| 36134_at | Olfactomedin 1 (OLFM1) | U79299 | Neuronal glycoprotein | 0.0062414 | ||||
| 1583_at | TNFRSF1B | M32315 | TNF-receptor superfamily | 0.0071696 | ||||
| 32563_at | ATPase, β3 | U51478 | Na+/K+ and H+/K+ ATPase | 0.0076784 | ||||
| 32893_s_at | γ-glutamyltransferase 1 (GGT1) | M30474 | Transferase protein | 0.007909 | ||||
| 1519_at | ETS2 | J04102 | Transcription factor | 0.0095507 | ||||
| 41268_g_at | mRNA for KIAA1049 protein | AB028972 | Unknown function | 0.0099509 | ||||
Definition of abbreviations: AC = adenocarcinoma; BAC = bronchioloalveolar carcinoma; EGF = epidermal growth factor; TNF = tumor necrosis factor.
The microarray data were confirmed by examination of type II TGF-β receptor transcription and translation in lung adenocarcinoma. We examined TGFβRII expression with quantitative real-time polymerase chain reaction in tumor specimens and observed that expression measured by DNA microarray correlated (Pearson correlation coefficient r = 0.59, p < .004) with expression measured by polymerase chain reaction. Western analysis of tumor homogenates similarly confirmed the microarray results (Figure E1). To determine if this result was generalizable, we examined protein localization and expression in 55 independently acquired primary lung adenocarcinoma specimens. TβRII expression was detectable in nonmalignant bronchial epithelial cells and in noninvasive BAC cells (Figure 4, top panel). In contrast, expression was absent or diminished in 61 and 70% of the adenocarcinoma-mixed and invasive tumors, respectively (Table 3). To determine the correlation of protein expression with invasion, we examined the association of TβRII immunostaining with the measured maximal length of invasion in each tumor. The maximal invasion length was inversely correlated with immunostaining intensity, with a Spearman correlation coefficient r = −0.36, p = 0.007 (Figure 4, bottom panel). These results confirm the microarray data indicating that TGFβRII expression was lower in invasive adenocarcinomas compared with BAC tumors and was negatively correlated with tumor invasiveness.
Figure 4.
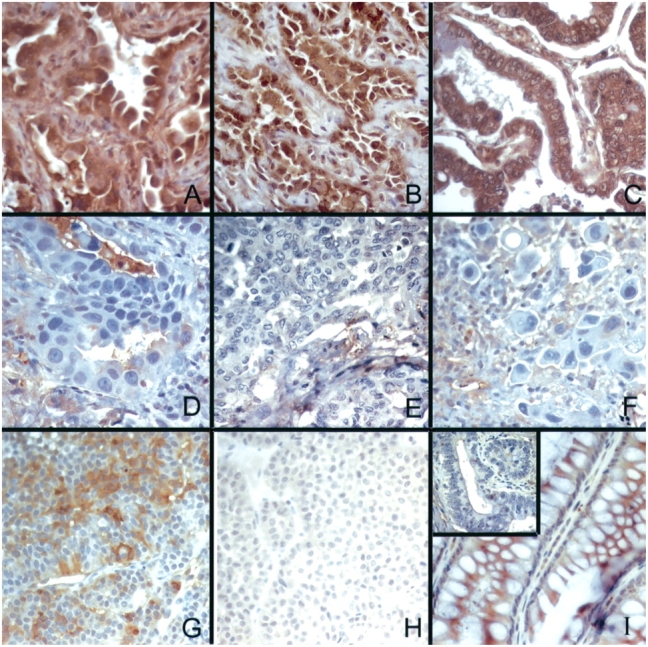

Top: TβRII immunostaining is decreased in invasive lung adenocarcinoma tumors. TβRII is expressed in BAC tumor cells (2+ immunoreactivity), localized to the cytoplasmic membrane and cytoplasm, with less intense staining detected in macrophages and endothelial cells (A–C); immunoreactivity is decreased or absent in well (D), moderately (E), and poorly (F) differentiated lung adenocarcinoma tumors. (G) Pituitary adenoma with 2+ immunoreactivity for TβRII (positive control). (H) Pituitary adenoma with isotype-matched, concentration-matched antibody showing no immunoreactivity (nonimmune antibody control). (I) Colonic mucosa showing 2+ immunoreactivity for TβRII, and inset showing invasive colonic adenocarcinoma from same section with no immunoreactivity for TβRII. Hematoxylin–eosin stain; original magnification, ×150. Bottom: TβRII immunostaining was highest in tumors with the least invasion. TβRII intensity: white bars = 0; gray bars = 1; black bars = 2. Slides of 55 independently acquired primary lung adenocarcinoma specimens were reviewed. The greatest linear dimension of histologic invasiveness was measured, which was subset into tertiles. The Spearman correlation coefficient of the relation between staining intensity and length of invasion was −0.36, p = 0.007.
TABLE 3.
Tβrii immunostaining in lung adenocarcinoma tumors
| Staining Intensity | BAC | AC-Mixed | Invasive |
|---|---|---|---|
| High 2+ | 7 (78) | 9 (39) | 7 (30) |
| Low 1+/0 | 2 (22) | 14 (61) | 16 (70) |
Definition of abbreviations: AC = adenocarcinoma; BAC = bronchioloalveolar carcinoma.
Percentages are shown in parentheses.
We hypothesized repression of TβRII was directly associated with increased invasiveness in lung adenocarcinoma. To test this hypothesis, we examined tumor cell invasive mobility in two TGF-β–responsive lung cell lines, H23 and SK-LU, in which we knocked down expression of the type II TGF-β receptor with siRNA. Expression was reduced 70 to 80% after transfection with siTGFβRII, as detected quantitatively by real-time polymerase chain reaction and qualitatively by immunofluoresence (Figure E2). Tumor cell mobility and invasion were investigated using the transwell matrigel migration assay. We observed that repression of TGFβRII was associated with a three- to fourfold increase in the number of invasive cells (p < 0.001; Figure 5), indicating an inverse correlation of TGFβRII expression with invasiveness in lung adenocarcinoma. Interestingly, there was no difference in cell number between control and knock-down cells in uncoated control wells, suggesting TGF-β signaling via proliferation control pathways did not account for the observed differences.
Figure 5.

Repression of TGFβRII increases lung tumor invasiveness. TGFβRII expression, as measured by quantitative real-time polymerase chain reaction (gray bars), was knocked down in SK-LU and H23 cells. The transwell matrigel migration assay was used to measure invasive cells after 48 hours of transfection. The number of invasive cells (average of five [5×] fields ± SEM) at 22 hours is indicated (black bars). There was no difference in the number of migrating cells through the control insert between the knocked-down and control cells. The results are representative of experiments performed in triplicate. TGFβRII = gray bars.
The response of lung tumor cells to TGF-β is complex, with signaling mediated through Smad proteins, Akt, and mitogen-activated protein kinases (MAPK). We examined the consequences of decreased TGFβRII expression on TGF-β signaling pathways (Figure 6). We observed that Smad2 activation was diminished after TGF-β stimulation in cells treated with TGFβRII siRNA, whereas total Smad2 was unchanged. Smad2 signaling pathways are involved in growth regulation, but no alteration in cell proliferation was observed in our cell lines. We next examined activation of other TGF-β signaling pathways associated with tumor cell mobility and invasion. We observed that Akt activation, similar to Smad2, was diminished in siTGFβRII cells. However, consistent with reports in breast carcinoma (19), activation of p38 MAPK was slightly increased relative to total p38 in siTGFβRII cells after stimulation with TGF-β, suggesting TGF-β–mediated p38 MAPK activation may play an important role mediating invasiveness in cells with repressed TβRII expression.
Figure 6.

Western analysis of TGF-β signaling pathway activation. H23 cell cultures transfected with control (left) or siRNA (right) constructs were incubated with TGF-β for the indicated times. Protein extracts were subjected to Western blot analysis with the indicated antibodies. The ratio of the intensity (densitometric units) of activated p38 relative to total p38 is indicated in the bottom panel.
To identify potential mediators of an invasiveness transcriptional program downstream of type II TGF-β receptor, we examined gene expression profiles of knocked-down TβRII expression in H23 cells. Genes with greater than twofold differences in expression were identified using Significance Analysis of Microarrays version 1.2.1 (http://www-stat.stanford.edu/~tibs/SAM) (20), with a median false-discovery rate of 1.5% (Table E2). To identify those genes most likely to be important in mediating invasiveness in vivo, we restricted the gene list to those that were also differentially expressed in lung adenocarcinoma tissues, as identified by an F test in BRB array tools, p < .01 (Table 4). Two members of the Nur77 nuclear receptor subfamily 4, group A family of transcription factors (NR4A2, NR4A3) were repressed in knocked-down cells. This orphan receptor subfamily of steroid thyroid hormone receptors all bind to a Nur77-binding response element to activate target gene expression (21). Although it is unknown if these regulatory elements and signaling pathways are functional in this context, the classifiers represent transcriptional regulation steps that are potentially important in TGF-β–mediated invasiveness. Among the genes negatively correlated with TGFβRII expression in knocked-down cells were the chemokine CCL5 (RANTES [regulated upon activation, T-cell secreted and expressed]) and the lysyl oxidase enzyme family members LOX and LOXL2, all of which encode secreted proteins that are associated with tumor invasiveness (22, 23).
TABLE 4.
Tgfβrii-dependent genes differentially expressed in lung adenocarcinoma subtypes
| Affymetrix Probe Set ID | GO Function/Gene Name | Gene Symbol | Fold Change* | |||
|---|---|---|---|---|---|---|
| Adhesion | ||||||
| 201130_s_at | Cadherin 1, type 1, E-cadherin (epithelial) | CDH1 | 0.23 | |||
| 205328_at | Claudin 10 | CLDN10 | 2.94 | |||
| 204750_s_at | Desmocollin 2 | DSC2 | 0.42 | |||
| 204751_x_at | Desmocollin 2 | DSC2 | 0.42 | |||
| 202267_at | Laminin, γ2 | LAMC2 | 0.38 | |||
| 203726_s_at | Laminin, α3 | LAMA3 | 0.29 | |||
| 208083_s_at | Integrin, β6 | ITGB6 | 0.13 | |||
| 208084_at | Integrin, β6 | ITGB6 | 0.24 | |||
| 226535_at | Integrin, β6 | ITGB6 | 0.42 | |||
| 215446_s_at | Lysyl oxidase | LOX | 4.00 | |||
| 202998_s_at | Lysyl oxidase-like 2 | LOXL2 | 2.70 | |||
| 214154_s_at | Plakophilin 2 | PKP2 | 0.17 | |||
| 207717_s_at | Plakophilin 2 | PKP2 | 0.42 | |||
| Transcription Factor | ||||||
| 204622_x_at | Nuclear receptor subfamily 4, group A, member 2 | NR4A2 | 0.31 | |||
| 204621_s_at | Nuclear receptor subfamily 4, group A, member 2 | NR4A2 | 0.37 | |||
| 216248_s_at | Nuclear receptor subfamily 4, group A, member 2 | NR4A2 | 0.40 | |||
| 209959_at | Nuclear receptor subfamily 4, group A, member 3 | NR4A3 | 0.42 | |||
| 209291_at | Inhibitor of DNA binding 4, dominant negative helix-loop-helix protein | ID4 | 0.41 | |||
| 209292_at | Inhibitor of DNA binding 4, dominant negative helix-loop-helix protein | ID4 | 0.28 | |||
| 202599_s_at | Nuclear receptor interacting protein 1 | NRIP1 | 0.38 | |||
| 213139_at | Snail homolog 2 (Drosophila) | SNAI2 | 0.20 | |||
| 206261_at | Zinc finger protein 239 | ZNF239 | 0.24 | |||
| Signal Transduction | ||||||
| 202609_at | Epidermal growth factor receptor pathway substrate 8 | EPS8 | 0.36 | |||
| 204396_s_at | G protein–coupled receptor kinase 5 | GRK5 | 0.43 | |||
| 202948_at | Interleukin-1 receptor, type I | IL1R1 | 0.46 | |||
| 202388_at | Regulator of G-protein signaling 2, 24 kD | RGS2 | 0.48 | |||
| 207334_s_at | Transforming growth factor, β receptor II (70/80 kD) | TGFBR2 | 0.34 | |||
| 208944_at | Transforming growth factor, β receptor II (70/80 kD) | TGFBR2 | 0.45 | |||
| Cell–Cell Signaling | ||||||
| 205290_s_at | Bone morphogenetic protein 2 | BMP2 | 0.18 | |||
| 205289_at | Bone morphogenetic protein 2 | BMP2 | 0.22 | |||
| 1405_i_at | Chemokine (C-C motif) ligand 5 | CCL5 | 3.70 | |||
| 1555759_a_at | Chemokine (C-C motif) ligand 5 | CCL5 | 2.94 | |||
| Cell Communication | ||||||
| 205490_x_at | Gap junction protein, β3, 31 kD (connexin 31) | GJB3 | 0.28 | |||
| 215243_s_at | Gap junction protein, β3, 31 kD (connexin 31) | GJB3 | 0.26 | |||
| 206156_at | Gap junction protein, β5 (connexin 31.1) | GJB5 | 0.33 | |||
| Immune Response | ||||||
| 202948_at | Interleukin-1 receptor, type I | IL1R1 | 0.46 | |||
| 212013_at | Melanoma-associated gene (IL1R antagonist) | D2S448 | 2.63 | |||
| Metabolism | ||||||
| 209608_s_at | Acetyl-coenzyme A acetyltransferase 2 | ACAT2 | 0.38 | |||
| 202739_s_at | Phosphorylase kinase, β | PHKB | 0.48 | |||
| 203217_s_at | Sialyltransferase 9 | SIAT9 | 0.37 | |||
| RNA Processing | ||||||
| 207836_s_at | RNA binding protein with multiple splicing | RBPMS | 0.48 | |||
| Transport | ||||||
| 217785_s_at | SNARE protein Ykt6 | YKT6 | 0.45 | |||
| Unknown | ||||||
| 212830_at | Epidermal growth factor–like domain, multiple 5 | EGFL5 | 0.48 | |||
| 212471_at | KIAA0241 protein | KIAA0241 | 0.33 | |||
| 213929_at | mRNA; cDNA DKFZp586F1223 (from clone DKFZp586F1223) | 0.48 | ||||
Fold change = siTGFβ/control.
DISCUSSION
The spectrum of intrahistologic heterogeneity in adenocarcinoma tumors suggests invasiveness may represent a continuum of disease from noninvasive BAC, to adenocarcinoma-mixed subtype with BAC component, to pure invasive adenocarcinoma. This study examined lung adenocarcinoma specimens encompassing a spectrum of invasion and identified distinct molecular signatures of histologic subtype and of invasiveness. Because we are interested in studying the biology of tumor progression and metastasis in early clinical stage tumors, we focused our investigations on identifying gene signatures correlated with the acquisition of invasiveness using the theoretic transition of in situ BAC tumors to adenocarcinoma-mixed subtype as a model.
In contrast to genes in the pure invasive tumor subtype cluster, which predominantly represented functional categories of proliferation and DNA repair, genes differentially expressed in the BAC and adenocarcinoma-mixed classes represented functional categories of signal transduction, regulation of cell adhesion, and proteolysis. Within this latter gene signature, repression of TGFβRII was identified as an important, reproducible molecular alteration in lung adenocarcinoma that was associated with invasiveness. TGF-β receptor, type II, is a transmembrane receptor serine threonine kinase that mediates TGF-β signaling (24). On TGF-β binding, TβRII phosphorylates the type I receptor, which then activates direct phosphorylation of downstream effector signaling molecules, such as Smad2 and Smad3. TGFβRII genetic alterations have been well characterized in gastrointestinal tumors in which 25% colorectal carcinomas have missense mutations associated with microsatellite instability. Animals with targeted deletion of Tgfbr2 in the colonic epithelium demonstrate increased tumor progression from adenomas to invasive carcinomas (25), similar to human colorectal tumors with loss of TβRII (18). In breast carcinoma, mammary tumors in animals with targeted deletion of Tgfbr2 demonstrated increased progression and metastases (26). A recent case-control study indicated that, within breast hyperplasia specimens, the proportion of cells with decreased TβRII immunostaining was associated with increased risk for the development of invasive breast cancer (27). In lung cancer, TβRII repression is detectable in approximately 40% of lung adenocarcinomas overall and in up to 100% of poorly differentiated adenocarcinomas (28), and is frequently caused by epigenetic silencing (29). To our knowledge, our report is the first to associate TβRII repression with invasiveness in lung carcinoma.
Depending on context, TGF-β signaling may alternatively function to suppress tumor growth or to promote tumor cell invasiveness and metastasis (30–33). The signaling pathways essential to the prometastatic phenotype of TGF-β are not well characterized, but recent evidence suggests Smad activation mediated by TGF-β signaling is not required and alternative, parallel pathways involving MAPK and phosphatidylinositol 3-kinase are operative (34). Bhowmick and colleagues (19) demonstrated p38 MAPK was required for TGF-β–mediated epithelial mesenchymal transition and progression in mammary tumor cells expressing a dominant negative TGF-β type II receptor. These observations are in line with our results suggesting that p38 MAPK activation is required for TGF-β–mediated invasiveness in lung cancer cells with decreased TGF-β responsiveness. The importance of context, in terms of cell type and extent of TβRII repression, is demonstrated by other reports showing that, in advanced breast carcinoma cells, total blockade of TGF-β signaling reduces invasion and metastasis (35).
To more completely characterize the context of our observations in lung cancer cells, we investigated potential downstream transcriptional events associated with TβRII repression by examination of the transcriptional profile of knocked-down cells. These profiles indicate that the transcriptional activators NR4A2 and NR4A3, and E-cadherin expression were lower in knocked-down cells and in invasive lung adenocarcinoma tissues. The latter is consistent with prior reports demonstrating that TGF-β can physically interact with members of the Wnt/β-catenin pathway and lead to downregulation of E-cadherin (36). Among genes negatively correlated with TGFβRII expression, we noted increased expression of chemokine CC subfamily member CCL5, which encodes RANTES. RANTES may promote tumor cell migration via autocrine and/or paracrine effects. RANTES secretion by breast carcinoma cells is associated with disease progression (37, 38) and with enhanced tumor migration mediated via paracrine actions on monocytes and via autocrine effects on CCR5 receptor–bearing cells (22). Recent reports indicate that CCL5 expression in the lung is regulated in part by p38 MAPK (39); because H23 lung cells express CCR5 (data not shown), it is possible that an autocrine pathway of RANTES-associated tumor cell invasion mediated by TGF-β signaling is operative in our in vitro system. Although our results suggest RANTES may play a role in the promotion of invasiveness and metastasis, a recent report noted that RANTES expression was associated with longer survival in lung adenocarcinomas with active lymphocytic response (40). Clarification of the role of RANTES in mediating in vivo lung tumor invasion and disease progression will require further study.
The identification of molecular pathways associated with the biological process of invasiveness acquisition in lung adenocarcinoma has potentially important clinical implications. The prevalence of noninvasive lung adenocarcinoma, usually represented by ground glass opacities on chest imaging studies is increasing, presumably as a result of increased detection by screening (41). Clinical studies indicate that the prognosis of noninvasive BAC is favorable and suggest that treatment approaches in terms of surgical procedure and adjuvant chemotherapy may be tailored to biological properties of these tumors (42). More recent evidence suggests ascertainment and application of biologically and clinically important molecular programs, such as the invasiveness signature, into clinical decision making may further enhance the effective allocation of treatment (43) for patients with lung carcinoma.
In summary, we have identified a transcriptional profile that distinguishes invasive from noninvasive lung adenocarcinoma, includes reduced expression of a previously identified tumor suppressor, TGFβRII, and suggests that downregulation is an early step in adenocarcinoma metastasis. Potential mediators of invasion resulting from suppression of TGFβRII in tumors were identified and include several transcriptional factors and E-cadherin, which were lower in TGFβRII knock-down cells and in primary invasive tumor specimens. The clinical implementation of these invasiveness signatures, once refined and tested, has the potential to improve lung carcinoma diagnostics and therapeutics.
Supplementary Material
Acknowledgments
The authors thank R. Parsons for helpful advice and R. Clynes for critical review of the manuscript.
Supported by National Environmental Health Sciences grant ES00354 and by the American Thoracic Society/Lungevity Foundation.
This article has an online supplement, which is accessible from this issue's table of contents at www.atsjournals.org
Conflict of Interest Statement: None of the authors have a financial relationship with a commercial entity that has an interest in the subject of this manuscript.
References
- 1.Jemal A, Murray T, Ward E, Samuels A, Tiwari RC, Ghafoor A, Feuer EJ, Thun MJ. Cancer statistics, 2005. CA Cancer J Clin 2005;55:10–30. [DOI] [PubMed] [Google Scholar]
- 2.Fidler IJ. The pathogenesis of cancer metastasis: the “seed and soil” hypothesis revisited. Nat Rev Cancer 2003;3:453–458. [DOI] [PubMed] [Google Scholar]
- 3.Yang J, Mani SA, Donaher JL, Ramaswamy S, Itzykson RA, Come C, Savagner P, Gitelman I, Richardson A, Weinberg RA. Twist, a master regulator of morphogenesis, plays an essential role in tumor metastasis. Cell 2004;117:927–939. [DOI] [PubMed] [Google Scholar]
- 4.Liotta LA, Kohn EC. The microenvironment of the tumour-host interface. Nature 2001;411:375–379. [DOI] [PubMed] [Google Scholar]
- 5.Paik S, Shak S, Tang G, Kim C, Baker J, Cronin M, Baehner FL, Walker MG, Watson D, Park T, et al. A multigene assay to predict recurrence of tamoxifen-treated, node-negative breast cancer. N Engl J Med 2004;351:2817–2826. [DOI] [PubMed] [Google Scholar]
- 6.Allinen M, Beroukhim R, Cai L, Brennan C, Lahti-Domenici J, Huang H, Porter D, Hu M, Chin L, Richardson A, et al. Molecular characterization of the tumor microenvironment in breast cancer. Cancer Cell 2004;6:17–32. [DOI] [PubMed] [Google Scholar]
- 7.Bhattacharjee A, Richards WG, Staunton J, Li C, Monti S, Vasa P, Ladd C, Beheshti J, Bueno R, Gillette M, et al. Classification of human lung carcinomas by mRNA expression profiling reveals distinct adenocarcinoma subclasses. Proc Natl Acad Sci USA 2001;98:13790–13795. [DOI] [PMC free article] [PubMed] [Google Scholar]
- 8.Shah L, Walter KL, Borczuk AC, Kawut SM, Sonett JR, Gorenstein LA, Ginsburg ME, Steinglass KM, Powell CA. Expression of syndecan-1 and expression of epidermal growth factor receptor are associated with survival in patients with nonsmall cell lung carcinoma. Cancer 2004;101:1632–1638. [DOI] [PubMed] [Google Scholar]
- 9.Beer DG, Kardia SL, Huang CC, Giordano TJ, Levin AM, Misek DE, Lin L, Chen G, Gharib TG, Thomas DG, et al. Gene-expression profiles predict survival of patients with lung adenocarcinoma. Nat Med 2002;8:816–824. [DOI] [PubMed] [Google Scholar]
- 10.Borczuk AC, Gorenstein L, Walter KL, Assaad AA, Wang L, Powell CA. Non-small-cell lung cancer molecular signatures recapitulate lung developmental pathways. Am J Pathol 2003;163:1949–1960. [DOI] [PMC free article] [PubMed] [Google Scholar]
- 11.Brambilla E, Travis WD, Colby TV, Corrin B, Shimosato Y. The new World Health Organization classification of lung tumours. Eur Respir J 2001;18:1059–1068. [DOI] [PubMed] [Google Scholar]
- 12.Borczuk AC, Shah L, Pearson GDN, Walter KL, Wang L, Austin JHM, Friedman RA, Powell CA. Molecular signatures in biopsy specimens of lung cancer. Am J Respir Crit Care Med 2004;170:167–174. [DOI] [PubMed] [Google Scholar]
- 13.Irizarry RA, Bolstad BM, Collin F, Cope LM, Hobbs B, Speed TP. Summaries of Affymetrix GeneChip probe level data. Nucleic Acids Res 2003;31:e15. [DOI] [PMC free article] [PubMed] [Google Scholar]
- 14.Li CM, Guo M, Borczuk A, Powell CA, Wei M, Thaker HM, Friedman R, Klein U, Tycko B. Gene expression in Wilms' tumor mimics the earliest committed stage in the metanephric mesenchymal-epithelial transition. Am J Pathol 2002;160:2181–2190. [DOI] [PMC free article] [PubMed] [Google Scholar]
- 15.Coletta RD, Christensen K, Reichenberger KJ, Lamb J, Micomonaco D, Huang L, Wolf DM, Muller-Tidow C, Golub TR, Kawakami K, et al. The SIX1 homeoprotein stimulates tumorigenesis by reactivation of cyclin a1. Proc Natl Acad Sci USA 2004;101:6478–6483. [DOI] [PMC free article] [PubMed] [Google Scholar]
- 16.Yu Y, Khan J, Khanna C, Helman L, Meltzer PS, Merlino G. Expression profiling identifies the cytoskeletal organizer ezrin and the developmental homeoprotein SIX-1 as key metastatic regulators. Nat Med 2004;10:175–181. [DOI] [PubMed] [Google Scholar]
- 17.Ravanko K, Jarvinen K, Helin J, Kalkkinen N, Holtta E. Cysteine cathepsins are central contributors of invasion by cultured adenosylmethionine decarboxylase-transformed rodent fibroblasts. Cancer Res 2004;64:8831–8838. [DOI] [PubMed] [Google Scholar]
- 18.Grady WM, Rajput A, Myeroff L, Liu DF, Kwon K, Willis J, Markowitz S. Mutation of the type II transforming growth factor-beta receptor is coincident with the transformation of human colon adenomas to malignant carcinomas. Cancer Res 1998;58:3101–3104. [PubMed] [Google Scholar]
- 19.Bhowmick NA, Zent R, Ghiassi M, McDonnell M, Moses HL. Integrin beta 1 signaling is necessary for transforming growth factor-beta activation of p38MAPK and epithelial plasticity. J Biol Chem 2001;276:46707–46713. [DOI] [PubMed] [Google Scholar]
- 20.Tusher VG, Tibshirani R, Chu G. Significance analysis of microarrays applied to the ionizing radiation response. Proc Natl Acad Sci USA 2001;98:5116–5121. [DOI] [PMC free article] [PubMed] [Google Scholar]
- 21.Ke N, Claassen G, Yu DH, Albers A, Fan W, Tan P, Grifman M, Hu X, Defife K, Nguy V, et al. Nuclear hormone receptor NR4a2 is involved in cell transformation and apoptosis. Cancer Res 2004;64:8208–8212. [DOI] [PubMed] [Google Scholar]
- 22.Azenshtein E, Luboshits G, Shina S, Neumark E, Shahbazian D, Weil M, Wigler N, Keydar I, Ben-Baruch A. The CC chemokine RANTES in breast carcinoma progression: regulation of expression and potential mechanisms of promalignant activity. Cancer Res 2002;62:1093–1102. [PubMed] [Google Scholar]
- 23.Kirschmann DA, Seftor EA, Fong SF, Nieva DR, Sullivan CM, Edwards EM, Sommer P, Csiszar K, Hendrix MJ. A molecular role for lysyl oxidase in breast cancer invasion. Cancer Res 2002;62:4478–4483. [PubMed] [Google Scholar]
- 24.Massague J, Blain SW, Lo RS. TGFbeta signaling in growth control, cancer, and heritable disorders. Cell 2000;103:295–309. [DOI] [PubMed] [Google Scholar]
- 25.Biswas S, Chytil A, Washington K, Romero-Gallo J, Gorska AE, Wirth PS, Gautam S, Moses HL, Grady WM. Transforming growth factor beta receptor type II inactivation promotes the establishment and progression of colon cancer. Cancer Res 2004;64:4687–4692. [DOI] [PubMed] [Google Scholar]
- 26.Forrester E, Chytil A, Bierie B, Aakre M, Gorska AE, Sharif-Afshar AR, Muller WJ, Moses HL. Effect of conditional knockout of the type II TGF-beta receptor gene in mammary epithelia on mammary gland development and polyomavirus middle T antigen induced tumor formation and metastasis. Cancer Res 2005;65:2296–2302. [DOI] [PubMed] [Google Scholar]
- 27.Gobbi H, Dupont WD, Simpson JF, Plummer WD Jr, Schuyler PA, Olson SJ, Arteaga CL, Page DL. Transforming growth factor-beta and breast cancer risk in women with mammary epithelial hyperplasia. J Natl Cancer Inst 1999;91:2096–2101. [DOI] [PubMed] [Google Scholar]
- 28.Kang Y, Prentice MA, Mariano JM, Davarya S, Linnoila RI, Moody TW, Wakefield LM, Jakowlew SB. Transforming growth factor-beta 1 and its receptors in human lung cancer and mouse lung carcinogenesis. Exp Lung Res 2000;26:685–707. [DOI] [PubMed] [Google Scholar]
- 29.Zhang HT, Chen XF, Wang MH, Wang JC, Qi QY, Zhang RM, Xu WQ, Fei QY, Wang F, Cheng QQ, et al. Defective expression of transforming growth factor beta receptor type II is associated with CPG methylated promoter in primary non-small cell lung cancer. Clin Cancer Res 2004;10:2359–2367. [DOI] [PubMed] [Google Scholar]
- 30.Derynck R, Akhurst RJ, Balmain A. TGF-beta signaling in tumor suppression and cancer progression. Nat Genet 2001;29:117–129. [DOI] [PubMed] [Google Scholar]
- 31.Elliott RL, Blobe GC. Role of transforming growth factor beta in human cancer. J Clin Oncol 2005;23:2078–2093. [DOI] [PubMed] [Google Scholar]
- 32.Tang B, Vu M, Booker T, Santner SJ, Miller FR, Anver MR, Wakefield LM. TGF-beta switches from tumor suppressor to prometastatic factor in a model of breast cancer progression. J Clin Invest 2003;112:1116–1124. [DOI] [PMC free article] [PubMed] [Google Scholar]
- 33.Roberts AB, Wakefield LM. The two faces of transforming growth factor beta in carcinogenesis. Proc Natl Acad Sci USA 2003;100:8621–8623. [DOI] [PMC free article] [PubMed] [Google Scholar]
- 34.Massague J. How cells read TGF-beta signals. Nat Rev Mol Cell Biol 2000;1:169–178. [DOI] [PubMed] [Google Scholar]
- 35.Muraoka RS, Dumont N, Ritter CA, Dugger TC, Brantley DM, Chen J, Easterly E, Roebuck LR, Ryan S, Gotwals PJ, et al. Blockade of TGF-beta inhibits mammary tumor cell viability, migration, and metastases. J Clin Invest 2002;109:1551–1559. [DOI] [PMC free article] [PubMed] [Google Scholar]
- 36.Nishita M, Hashimoto MK, Ogata S, Laurent MN, Ueno N, Shibuya H, Cho KW. Interaction between WNT and TGF-beta signalling pathways during formation of Spemann's organizer. Nature 2000;403:781–785. [DOI] [PubMed] [Google Scholar]
- 37.Luboshits G, Shina S, Kaplan O, Engelberg S, Nass D, Lifshitz-Mercer B, Chaitchik S, Keydar I, Ben-Baruch A. Elevated expression of the CC chemokine regulated on activation, normal T cell expressed and secreted (RANTES) in advanced breast carcinoma. Cancer Res 1999;59:4681–4687. [PubMed] [Google Scholar]
- 38.Niwa Y, Akamatsu H, Niwa H, Sumi H, Ozaki Y, Abe A. Correlation of tissue and plasma RANTES levels with disease course in patients with breast or cervical cancer. Clin Cancer Res 2001;7:285–289. [PubMed] [Google Scholar]
- 39.Kujime K, Hashimoto S, Gon Y, Shimizu K, Horie T. p38 mitogen-activated protein kinase and c-jun-NH2-terminal kinase regulate RANTES production by influenza virus-infected human bronchial epithelial cells. J Immunol 2000;164:3222–3228. [DOI] [PubMed] [Google Scholar]
- 40.Moran CJ, Arenberg DA, Huang CC, Giordano TJ, Thomas DG, Misek DE, Chen G, Iannettoni MD, Orringer MB, Hanash S, et al. RANTES expression is a predictor of survival in stage I lung adenocarcinoma. Clin Cancer Res 2002;8:3803–3812. [PubMed] [Google Scholar]
- 41.Mirtcheva RM, Vazquez M, Yankelevitz DF, Henschke CI. Bronchioloalveolar carcinoma and adenocarcinoma with bronchioloalveolar features presenting as ground-glass opacities on CT. Clin Imaging 2002;26:95–100. [DOI] [PubMed] [Google Scholar]
- 42.Yamato Y, Tsuchida M, Watanabe T, Aoki T, Koizumi N, Umezu H, Hayashi J-I. Early results of a prospective study of limited resection for bronchioloalveolar adenocarcinoma of the lung. Ann Thorac Surg 2001;71:971–974. [DOI] [PubMed] [Google Scholar]
- 43.Pittman J, Huang E, Dressman H, Horng CF, Cheng SH, Tsou MH, Chen CM, Bild A, Iversen ES, Huang AT, et al. Integrated modeling of clinical and gene expression information for personalized prediction of disease outcomes. Proc Natl Acad Sci USA 2004;101:8431–8436. [DOI] [PMC free article] [PubMed] [Google Scholar]
Associated Data
This section collects any data citations, data availability statements, or supplementary materials included in this article.