

Abstract
Motivation: Current microarray analyses focus on identifying sets of genes that are differentially expressed (DE) or differentially coexpressed (DC) in different biological states (e.g. diseased versus non-diseased). We observed that in many human diseases, some genes have a significantincrease or decrease in expression variability (variance). Asthese observed changes in expression variability may be caused by alteration of the underlying expression dynamics, such differential variability (DV) patterns are also biologically interesting.
Results: Here we propose a novel analysis for changes in gene expression variability between groups of amples, which we call differential variability analysis. We introduce the concept of differential variability (DV), and present a simple procedure for identifying DV genes from microarray data. Our procedure is evaluated with simulated and real microarray datasets. The effect of data preprocessing methods on identification of DV gene is investigated. The biological significance of DV analysis is demonstrated with four human disease datasets. The relationships among DV, DE and DC genes are investigated. The results suggest that changes in expression variability are associated with changes in coexpression pattern, which imply that DV is not merely stochastic noise, but informative signal.
Availability: The R source code for differential variability analysis is available from the contact authors upon request.
Contact: joshua@it.usyd.edu.au; mcharleston@it.usyd.edu.au
1 INTRODUCTION
Microarray technology enables the expression level of all or most of the genes in the genome to be measured simultaneously. Such global-scale gene expression profiling has revolutionized medical research as we can now search for disease-related genes in a systematic and unbiased manner. In a representative biomedical gene expression profiling study, we generate and compare expression profiles taken from tissue samples of a group of patients suffering from the same disease and a group of non-diseased individuals. A typical analysis involves identification of differentially expressed (DE) genes that may be associated with the disease. A range of statistical procedures, such as linear modeling (Smyth, 2004) and SAM (Tusher et al., 2001), has been devised for accurate and efficient identification of DE genes. In recent years, the community has also started to focus on differential coexpression analyses (Choi et al., 2005; Kostka and Spang, 2004; Watson, 2006), which aim to identify sets of genes that are always coexpressed in non-diseased individuals but not in diseased individuals or vice versa. The differentially coexpressed (DC) analysis is motivated by the observation that gene expression across a group of individuals appears to be correlated, and such coexpression patterns may differ in disease and non-disease states. Both DE and DC analyses have been successful in identifying novel disease-related genes and generating new hypotheses about the molecular events related to pathogenesis (e.g. Choi et al., 2005).
In this article, we present a new type of microarray analysis called differential variability (DV) analysis. Traditional DE analysis aims to identify genes with significant changes in mean expression level between diseased and non-diseased samples, whereas DV analysis aims to identify genes with a significant change in variance of expression between a group of diseased patients and non-diseased individuals (see Fig. 1 for a comparison of DE, DC and DV patterns).
Fig. 1.

An illustration of the concept of (a) DE, (b) DC and (c) DV. The x-axes represent individual samples and the y-axes represent gene expression level.
Pritchard et al. (2001) systematically studied gene expression variability in normal mice and found a set of genes that have similar expression levels among technical replicates but very different expression levels among individual mice. Genes associated with immune-modulation, stress and hormonal regulation are found to have high expression variability. Such elevated degrees of variability are accounted for by the heterogeneous amount of regulatory signals present at the time of death (Pritchard et al. (2001). Bahar et al. (2006) showed that some genes have increased cell-to-cell gene expression variability in cardiomyocytes in older mice compared with younger mice. They attributed the increase in expression variability to stochastic deregulation of gene expression, due to DNA damage accumulated during the life-time of a mouse. Cheung et al. (2003) showed that genes of certain functional classes have elevated expression variability in human lymphoblastoid cells. In conjunction with our own observations of a large human heart microarray dataset (Stefani et al., manuscript in preparation), it appears that patterns of gene expression variability are also an important area of study in human diseases.
The main contribution of this article is to formally introduce the concept of DV analysis of gene expression, and to demonstrate its applicability to human disease datasets. Both the technical issues associated with the analysis and the biological significance of DV genes are discussed here. Specifically, we first propose a simple F-test-based procedure for identifying DV genes from large microarray datasets, and compare our method with a number of more robust variants using simulated data (here ‘robust’ is used to mean resistant to the effect of outliers). The effect of array data preprocessing on the reliability of DV analysis is investigated. In an analysis of four independent human disease datasets, we verify that statistically significant DV genes do exist and many of them are relevant to the disease development. The relationships among differential expression, coexpression and variability are also investigated.
2 METHODS
2.1 Definition of differential variability
Here we propose a simple definition of differential variability of a gene between two conditions. We first assume that the true population distribution of the expression of a gene xc in a given condition c has mean μc and variance  . For any two conditions, we formulate a two-sided hypothesis test for each gene: The null hypothesis
  versus the alternative hypothesis
  . If the null hypothesis is rejected based on some statistical test, we call this gene differentially variable (DV). A gene that has differential variability is called a DV gene.
2.2 F-test for differential variability analysis
To test for genes with significant DV, we propose to use the F-test. For any gene with n (log-)expression values in condition 1 and m (log-)expression values in condition 2, we can base our test on  where
where  and
and  are the sample variances of the expression values in condition 1 and 2, respectively.
If the expression of a gene is distributed normally, i.e.  , f follows an Fn−1, m−1 distribution under the null hypothesis. The P-value of this test is 2 × min(pr, 1−pr) for pr=P(Fn−1, m−1 ≤ f). Although the F-test is simple and is widely used to quantify differences in variance, it is sensitive to deviation from the normality assumption or presence of outliers (e.g. unexpectedly higher or lower expression values from one or two samples). To overcome this shortcoming, an outlier removal step is performed before the F-test, to eliminate those expression values that are significantly higher or lower than majority of the expression values. These so-called ‘outliers’ might indeed be true signals, so removal of those points might increase the overall false-negative rate. However, we opt for this more conservative approach as outliers can be analyzed separately. In this article, we use a simple inter-quartile range (IQR) criterion to detect outliers. Given all the expression values across the two conditions, we define Q1 and Q3 to be the first and third quartiles, and IQ = Q3 − Q1 be the IQR. Any values that are less than Q1 − rIQ or greater than Q3 + rIQ are labeled as outliers for any r>0. Outliers are then removed, followed by adjusting m and n to reflect the actual number of unfiltered samples for the gene under consideration. We used r = 1.5 in this article because it achieves desirable filtering properties in practice.
Similar to any multiple testing problem, the P-value must be adjusted to account for multiple comparisons. A range of adjustment procedures can be used in this step, and we selected the false-discovery rate correction method by Benjamini and Hochberg (1995) in our study. Finally, all the genes with adjusted P-value below a pre-defined significance level α are deemed differentially variably expressed. This procedure described here is implemented in the R language (Ihaka and Gentleman, 1996).
Our DV identification procedure can be summarized as follows:
- (1) For each gene:
- 1.1 remove outliers using the IQR criteria. Adjust n and m if necessary;
- 1.2 compute f and its corresponding P-value.
(2) Adjust the P-value for multiple comparisons and mark any genes with P ≤α as differentially variable.
2.3 Other differential variability measures
Although the F-test is a simple and intuitive test for DV analysis, its robustness against violation of the normality assumption needs investigation. In particular, our method relies on an outlier removal step, which effectively reduces the variance and sample size. Also, the parameter r of the IQR criteria is probably not the same for each gene and each dataset. We, therefore, seek to develop other methods that can better handle potential outliers without unnecessarily removing data. We developed a number of variant methods by following two general approaches: (1) replace SD with other robust scale estimators and (2) permutation tests.
Two variant DV tests are constructed by replacing the SD (s) by two robust scale estimators: median absolute deviation (MAD) and Qn (Rousseeuw and Croux, 1993). MAD is the most widely used robust scale estimator due to its simplicity and resistance to the effect of outliers. MAD is defined as:
where m = median(Xi). The factor 1.4826 is used to make it consistent with SD. Qn is another robust scale estimator which is defined as
where k=  . In other words, Qn is the k-th smallest value of all |Xi − Xj|, for i < j. The factor 2.2219 is used to make it consistent with SD. Since both MAD and Qn approximate s, the resulting f value should retain the F(n−1)(m − 1) distribution under the null hypothesis.
We also devised a number of tests based on permutation. Since we do not have to rely on any known distribution, we can employ different statistics from f. The f-statistic is based on the ratio of variance, but we may also test the hypothesis by using statistics based on the difference of two variances, or SDs. Hence, we developed three new statistics: (s1 − s2), (MAD1 − MAD2) and (Qn1 − Qn2). A permutation test is performed by randomly shuffling the sample labels, then calculating the fraction of times the original statistic is less or equal to the statistic generated by the permuted samples. In this study, we perform 1000 permutation per gene. A total of eight differential variability tests are developed (Table 1) and are evaluated using simulated data (Section 2.4).
Table 1.
Summary of the eight tests of differential variability
| Test | Statistic | Distribution |
|---|---|---|
| F |  |
F(n−1)(m−1) |
| F, outlier removed |  |
F(n−1)(m−1) |
| MAD |  |
F(n−1)(m−1) |
| Qn |  |
F(n−1)(m−1) |
| F, permutation |  |
Empirical |
| SD Diff, permutation | s1 − s2 | Empirical |
| MAD Diff, permutation | MAD1 − MAD2 | Empirical |
| Qn Diff, permutation | Qn1 − Qn2 | Empirical |
2.4 Evaluation with simulated data
We evaluated the performance of the eight DV tests (Table 1) using simulated microarray datasets with known DV structures. With a given mean μ and variance σ2, we simulated expression values as independently and identically distributed values from normal distribution N(μ, σ2), uniform distribution 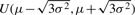 and gamma distribution Γ(μ2/σ2, μ/σ2). In all our tests, we simulated 40 expression profiles each containing 300 genes. Among the 40 profiles, 20 are assigned to be ‘normal’ and are simulated with μ=7 and σ2=6, while the other 20 ‘diseased’ profiles were simulated with μ=7 and σ2=12. The effect of outliers was simulated by randomly selecting one array and multiplying all its expression values by 3. Using this simulation scheme, eight differential variability tests were evaluated (Table 1). The proportion of genes identified as DV was calculated for each method. With a significance level of 0.01, we would expect a good DV tests to make misclassification errors in 1% of the cases. The results are presented in Section 3.1.
2.5 Effect of preprocessing methods on a real dataset
Traditionally variability of gene expression among a group of samples is treated as noise, and is to be eliminated by various transformation and normalization procedures. This motivates the question: ‘how do different preprocessing methods affect the discovery of DV genes?’. To address this issue, we preprocessed a lung cancer dataset (Stearman et al., 2005) using five different methods and compared the concordance among the five lists of inferred DV genes. The five methods evaluated here are: MAS 5.0 (Affymetrix Inc., 2002), RMA (Irizarry et al., 2003), GCRMA (Wu et al., 2004), FARMS (Hochreiter et al., 2006) and DFW (Chen et al., 2007). They were selected based on their popularity and/or their superior performance in the Affycomp II competition (Cope et al., 2004; Irizarry et al., 2006). We used the standard R implementations of all of the preprocessing methods. The raw data in CEL files were read, and were individually processed by the five methods. As far as possible, default parameters were used, otherwise, we used quantile normalization method with no background correction and ignored mismatch probe data. After the data were preprocessed, we then used the F-test procedure to rank the genes according to the P-values. The lower the P-value, the more likely it is that the gene is differentially variable. This step resulted in five ranked DV gene lists. Then for each pair of DV gene lists, the 200 genes with the lowest P-values were selected to calculate the concordance between two gene lists. Concordance between two lists (L1 and L2) of n genes is defined as
where Li(n) is the set of the n top-ranked genes in list Li. Concordance measures the proportion of overlapping genes between two lists (Patterson et al., 2006). If two methods have concordance of 0.5, it means only 50% of the genes found in one list are also in the other list.
2.6 Power of the F-test
One question is ‘how many samples per group are required to recover all true DV genes?’ We can address this problem by calculating the power of the F-test using different numbers of samples. The statistical power of a test is defined to be the probability of rejecting the null hypothesis when the alternative hypothesis is indeed true (=1 − type II error rate). The statistic f is distributed according to Fn − 1, m − 1 under the null hypothesis. If the alternative hypothesis is true, f should be distributed according to k × Fn−1, m−1 where k is the fold change in population variance,  . Therefore, the statistical power of this test is a function of k, significance level α, and the sample sizes n and m. The power function is as follows:
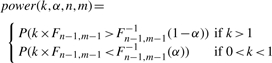 |
(1) |
2.7 Analysis of real datasets
To demonstrate the general applicability of our approach in understanding human diseases, we collected three Affymetrix datasets from the NCBI Gene Expression Omnibus (GEO) database (Edgar et al., 2002) and one Affymetrix dataset from the CardioGenomic project website of Harvard Medical School (CardioGenomics, 2008). The details of the four datasets are summarized in Table 4. All datasets were quantile normalized, followed by probe-level summarization using DFW (Chen et al., 2007). The datasets were tested for differential variability using our F-test-based procedure, and differential expression by Welch's two-sample t-test (Welch, 1947). The resulting P-values were adjusted to control for false-discovery rate in multiple comparison using the method proposed by Benjamini and Hochberg, (1995). A gene was judged as significantly DV or DE if its corresponding adjusted P was ≤ 0.05.
Table 4.
Summary of the microarray dataset used
| Dataset | Disease | n | m | Probes | Platform | |DV| | |DE| | |DV ∩ DE| |
|---|---|---|---|---|---|---|---|---|
| Stearman et al. (2005) | Lung adenocarcinoma | 19 | 20 | 12 625 | HG-U95Av2 | 1292 | 4668 | 854 |
| Haslett et al. (2002) | Duchenne muscular dystrophy | 12 | 12 | 12 625 | HG-U95Av2 | 12 | 1567 | 12 |
| Hong et al. (2007) | Colorectal cancer | 10 | 12 | 54 675 | HG-U133 Plus 2.0 | 35 | 5118 | 27 |
| CardioGenomics | Dilated cardiomyopathy | 14 | 27 | 54 675 | HG-U133 Plus 2.0 | 248 | 10 532 | 126 |
All datasets were generated from Affymetrix arrays. n is the number of arrays from non-diseased samples and m is the number of array from diseased samples. |DV|, |DE| and |DV ∩ DE| represent the number of DV genes, DE genes and genes that are both DE and DV, respectively.
Furthermore, we looked for statistically over-represented gene ontology (GO) terms associated with those DV genes using GOstat (Beissbarth and Speed, 2004). GOstat employs a χ2-test or Fisher's exact test to determine if a GO term is significantly over-represented in the set of genes. Again, the resulting P-value for each GO term is adjusted for multiple comparisons by the Benjamini and Hochberg procedure.
2.8 Differential coexpression analysis
For each of the four human disease datasets, we extracted the four subsets of 200 genes which exhibited the largest: (1) decrease in variability (DV dec.); (2) increase in variability (DV inc.); (3) decrease in expression (DE dec.); and (4) increase in expression (DE inc.) in diseased compared with non-diseased individuals. For each subset of 200 genes, we computed a Pearson correlation coefficient, r, for each pair of genes in each of the ‘normal’ samples and the ‘disease’ samples. A gene pair is positively coexpressed if its r>0.85, or negatively coexpressed if its r<−0.85. If a set of genes is differentially coexpressed, we expect the distribution of r in the ‘normal’ samples to be different from the r distribution in the ‘disease’ samples. Therefore, if DV or DE is associated with change in DC, then we expect to observe a big change in the distribution of r in the four 200-gene subsets in each human disease dataset.
3 RESULTS
3.1 Comparison of differential variability tests
We compared eight differential variability tests using simulated data. The results are shown in Table 2. For a good DV test (at 0.01 significance level), we expect it to have a false-positive rate of 1% and a true-positive rate of 99%. In general, we find that the F-test with outlier removal (F, o.r.) and all permutation-based tests are effective against false-positives. However, F-test with outlier removal has a higher than expected false-negative rate (i.e. it fails to identify at least 99% of the true DV genes). Given the high true-positive rate of the F-test (without outlier removal), it is probable that increasing the parameter r for the IQR outlier removal step can increase the true-positive rate, though compromising the false-positive rate. MAD and Qn consistently produce higher than expected false-positive rates in all simulated data. The permutation tests based on the difference of MAD (MAD Diff, perm.) and difference of Qn (Qn Diff, perm.) have low false-positive rates, but only moderately high true-positive rates. F-statistic with permutation test (F, perm.) and the difference of SDs (SD Diff, perm.) both perform reasonably well in terms of true- and false-positive rates.
Table 2.
Comparison of the performance of differential variability detection methods using simulated datasets
| DV | Distribution | F(%) | F, o.r.(%) | MAD(%) | Qn(%) | F, perm.(%) | SD Diff, perm.(%) | MAD Diff, perm.(%) | Qn Diff, perm.(%) |
|---|---|---|---|---|---|---|---|---|---|
| No | Normal | 0.33 | 0.67 | 10 | 6.33 | 0.33 | 0 | 1 | 0.67 |
| No | Normal, 1 outlier | 44.33 | 1 | 9 | 6.33 | 1.33 | 1 | 0.67 | 0.67 |
| No | Uniform | 0 | 0 | 8.33 | 2 | 1.33 | 1.67 | 1 | 1.33 |
| No | Gamma | 3 | 1 | 13.33 | 6.33 | 2 | 1.33 | 1 | 0.33 |
| Yes | Normal | 100 | 81 | 97 | 99 | 99.33 | 99.33 | 87.33 | 87 |
| Yes | Normal, 1 outlier | 78.67 | 78.67 | 99.33 | 99 | 55.33 | 55.67 | 76 | 78.67 |
| Yes | Uniform | 100 | 95.33 | 97.33 | 100 | 100 | 100 | 87.33 | 81.33 |
| Yes | Gamma | 95 | 49.67 | 49.67 | 38.67 | 89.33 | 90.67 | 14 | 4.67 |
The values represent the percentage of 300 genes that were identified as differentially variable (significance level 0.01). All results that have low false-positive rates (<1%) or high true-positive rates (>99%) are shown in bold.
Since our study aims to investigate the biological relevance of DV genes, we would like to avoid false positives as far as possible. Therefore, a method with high precision (high true-positive rate and low false-positive rate) is most suitable for our purpose. MAD and Qn fail this criterion. Although all permutation-based tests perform reasonably well, they are computationally very intensive, particularly if we want to estimate P-value accurately (e.g. 1000 rounds of permutations result in P-value accurate to at most three decimal places). Since F-test with outlier removal performs just as well as the permutation-based tests, it is a preferable test. Further, fine tuning of the parameter r may result in a better true-positive rate. Since the tuning of r is most likely dataset dependent, we do not discuss this issue further here.
3.2 Effect of preprocessing methods on concordance of DV identification
The effect of microarray preprocessing methods on DV discovery was investigated. Using a lung cancer microarray dataset (Stearman et al., 2005), we compared the lists of DV genes discovered from the dataset preprocessed by five procedures. The five sets of n = 200 most highly ranked DV genes were compared to determine their concordance. Concordance between each pair of the five lists is shown in Table 3. The results show that DV genes identified by data preprocessed by RMA, FARMS and DFW are reasonably concordant, while the results generated by MAS 5.0 preprocessed data are generally quite different from others. This conclusion is consistent irrespective of n used to calculate concordance (data not shown).
Table 3.
Concordance of the 200 most highly ranked DV genes (genes with the lowest P-values) from the Stearman et al. (2005) dataset preprocessed by five different preprocessing methods
| DFW | FARMS | RMA | GCRMA | |
|---|---|---|---|---|
| MAS 5.0 | 0.460 | 0.450 | 0.395 | 0.295 |
| GCRMA | 0.395 | 0.460 | 0.515 | |
| RMA | 0.650 | 0.680 | ||
| FARMS | 0.695 |
3.3 Analysis of human disease datasets
We collected and analyzed four microarray datasets related to human diseases (Table 4). The distribution of genes with significant increasing/decreasing DE or DV in the four datasets is shown in Table 5. Despite the differences in the types of disease and sample sizes, some general patterns emerge. First, we note that a much smaller number of significant DV genes are identified compared to significant DE genes. Second, the number of upregulated and downregulated DE genes are mostly similar, while DV genes with increased variability predominate in diseased patients. Third, there is a positive correlation between DV and DE (i.e. up-regulated DE genes are likely to have increased variability).
Table 5.
Distribution of genes with significant (P ≤ 0.05) increasing (inc.), decreasing (dec.) or non-significant (n.c.) DE or DV in the four human disease datasets
| (a) Stearman |
(b) Haslett |
(c) Hong |
(d) CardioGenomics |
||||||||||||||||||||
|---|---|---|---|---|---|---|---|---|---|---|---|---|---|---|---|---|---|---|---|---|---|---|---|
| DV | DV | DV | DV | ||||||||||||||||||||
| dec. | n.c. | inc. | dec. | n.c. | inc. | dec. | n.c. | inc. | dec. | n.c. | inc. | ||||||||||||
| DE | dec. | 18 | 1815 | 259 | 2092 | DE | dec. | 0 | 677 | 0 | 677 | DE | dec. | 1 | 2792 | 9 | 2802 | DE | dec. | 16 | 5009 | 7 | 5032 |
| n.c. | 10 | 7519 | 428 | 7957 | n.c. | 0 | 11 058 | 0 | 11058 | n.c. | 0 | 49 549 | 8 | 49 557 | n.c. | 44 | 44 021 | 78 | 44 143 | ||||
| inc. | 1 | 1999 | 576 | 2576 | inc. | 0 | 878 | 12 | 890 | inc. | 0 | 2299 | 17 | 2316 | inc. | 1 | 5397 | 102 | 5500 | ||||
| 29 | 11 333 | 1263 | 0 | 12 613 | 12 | 1 | 54 640 | 34 | 61 | 54 427 | 187 | ||||||||||||
Based on the above observations, one may suspect that the observed changes in expression variability are simply artifacts of some non-linear relationships between mean expression level and variability. More specifically, we want to know if the observed variability is due to stochastic noise in RNA production. We address this question by studying the differential coexpression patterns among the 200 most highly ranked DV and DE genes for each of the four human disease datasets. For each 200-gene set, we computed a Pearson correlation coefficient for each of the (200×199)/2=19900 pairs of genes, and accordingly labeled each gene pair as negatively, positively or not coexpressed (results shown in Table 6). In all four datasets, differential coexpression appears to be positively correlated with differential variability. This is particularly remarkable in the four DV inc. gene lists, in which increase in variability correlates with a vast increase in coexpressed gene pairs. Unexpectedly, we also observe an association between decrease in mean expression and increase in coexpression, while increase in mean expression does not appear to correspond to a change in coexpression. As an example, the distributions of pairwise gene coexpression of the DV and DE genes found in the CardioGenomics dataset are shown in Figure 2. We note the extreme difference in coexpression patterns between the normal and diseased patients in the DV inc. data (Fig. 2b and 2f, respectively). Whereas for normal individuals fewer than 1% of the gene pairs are classified as significantly coexpressed, over 60% of the gene pairs become significantly coexpressed in the diseased patients (Table 6).
Table 6.
Relationship between DE, DV and DC
| Dataset | Patterns | Normal |
Disease |
||
|---|---|---|---|---|---|
| Neg. | Pos. | Neg. | Pos. | ||
| Stearman | DV dec. | 0 | 149 | 1 | 16 |
| DV inc. | 0 | 2 | 49 | 183 | |
| DE dec. | 0 | 38 | 0 | 512 | |
| DE inc. | 1 | 11 | 0 | 58 | |
| Haslett | DV dec. | 49 | 111 | 19 | 33 |
| DV inc. | 19 | 21 | 140 | 382 | |
| DE dec. | 11 | 39 | 25 | 76 | |
| DE inc. | 6 | 144 | 2 | 379 | |
| Hong | DV dec. | 44 | 56 | 29 | 25 |
| DV inc. | 65 | 86 | 324 | 4356 | |
| DE dec. | 35 | 176 | 1 | 1528 | |
| DE inc. | 17 | 404 | 0 | 290 | |
| CardioGenomics | DV dec. | 78 | 484 | 0 | 1 |
| DV inc. | 6 | 82 | 706 | 12207 | |
| DE dec. | 1 | 68 | 0 | 761 | |
| DE inc. | 5 | 32 | 0 | 43 | |
The top ranking 200 genes with increasing/decreasing DV/DE are tested for DC. neg. = negatively coexpressed (r < −0.85), pos. = positively coexpressed (r > 0.85).
Fig. 2.

Distribution of pairwise correlation coefficient among the 200 top-ranking increasing/decreasing DV and DE genes in the CardioGenomics dataset. There is a marked increase in coexpression in profiles with higher variability.
3.4 Biological significance of DV genes
Some of the significant DV genes discovered from the four human disease datasets are presented in Table 7. The biological significance of these DV genes and/or associated over-represented GO terms are described in the following subsections.
Table 7.
Some significant DV genes discovered in the four human disease datasets
| DV | DE | |||
|---|---|---|---|---|
| Dataset | Gene | Description | adjusted P | adjusted P |
| Stearman | IL1RL1* | Interleukin 1 receptor-like 1 | 0.000220 | 9.64E-05 ↘ |
| IL6* | Interleukin 6 (interferon, β 2) | 0.004523 | 0.001240 ↘ | |
| IL8RA* | Interleukin 8 receptor, α | 0.006749 | 0.000307 ↘ | |
| STARD7* | START domain containing 7 | 0.020005 | 0.770919 | |
| JUNB* | Jun B proto-oncogene | 0.048983 | 0.002005 ↘ | |
| ADCY9 | Adenylate cyclase 9 | 8.45E-07 | 0.002343 ↘ | |
| IFI16 | Interferon, γ-inducible protein 16 | 0.000117 | 0.665773 | |
| IGF2 | Insulin-like growth factor 2 (somatomedin A) | 0.020126 | 0.792114 | |
| MTSS1 | Metastasis suppressor | 0.015878 | 0.550911 | |
| Haslett | SPP1 | Secreted phosphoprotein 1 | 4.15E-05 | 0.002375 ↗ |
| PLA2G2A | Phospholipase A2, group IIA (platelets, synovial fluid) | 0.000546 | 0.003778 ↗ | |
| TIMP1 | TIMP metallopeptidase inhibitor | 0.019086 | 0.000242 ↗ | |
| PDIA3 | Protein disulfide isomerase family A, member 3 | 0.030963 | 0.008129 ↗ | |
| FRZB | Frizzled-related protein | 0.030963 | 0.006435 ↗ | |
| MYL4 | Myosin, light chain 4, alkali; atrial, embryonic | 0.043187 | 0.002082 ↗ | |
| Hong | G6PC* | Glucose-6-phosphatase, catalytic subunit | 0.046837 | 0.014506 ↘ |
| FOSB | FBJ murine osteosarcoma viral oncogene homolog B | 0.000436 | 0.001841 ↗ | |
| CYR61 | Cysteine-rich, angiogenic inducer, 61 | 0.000436 | 0.000151 ↗ | |
| EGR1 | Early growth response 1 | 0.009421 | 0.001968 ↗ | |
| FIGF | c-Fos induced growth factor (vascular endothelial growth factor D) | 0.009421 | 0.067034 | |
| MCAM | Melanoma cell adhesion molecule | 0.031857 | 0.005266 ↗ | |
| CardioGenomics | LIMS1* | LIM and senescent cell antigen-like domains 1 | 0.005508 | 0.011308 ↘ |
| MCM4* | Minichromosome maintenance complex component 4 | 0.008197 | 0.040694 ↗ | |
| SMAD3* | SMAD family member 3 | 0.009093 | 0.079661 | |
| EPHB4 | EPH receptor B4 | 0.000965 | 0.243504 | |
| TRPC4 | Transient receptor potential cation channel, subfamily C, member 4 | 0.005356 | 0.057685 | |
| ZBP1 | Z-DNA-binding protein 1 | 0.033411 | 0.111145 |
These DV genes are selected based on biological relevance to the disease under consideration. All genes marked with asterisk have decreased expression variability, while unmarked genes have increased variability in diseased patients. The adjusted P-values for DV and DE are shown. Significant up- and downregulation are marked next to the DE P-value by up- and down-arrow, respectively.
3.4.1 Stearman dataset
The Stearman et al. (2005) study originally investigated the conservation of gene expression patterns between human and mouse in lung adenocarcinoma. In their study, 39 human microarrays were constructed from tumour tissues and adjacent (normal) tissues from 10 lung adenocarcinoma patients, run in duplicate. To simplify the analysis, we treated those technical replicates as biological replicates. Nearly 1300 DV genes were identified, and about 66% of them are also differentially expressed (Table 5). Significantly over-represented GO terms with DV genes with lower variability in cancer patients include negative regulation of cellular process (GO:0048523, P=0.0569), negative regulation of apoptosis (GO:0043066, P=0.0588) and cell differentiation (GO:0030154, P=0.0752). Significantly over-represented GO terms associated with DV genes with increased variability include regulation of transcription (GO:0045449, P = 0.0009), spindle organization and biogenesis (GO:0007051, P=0.0029) and cell–cell signaling (GO:0007267, P = 0.0252). At the gene level, we found a number of genes related to immune response, cell growth and oncogenesis (Table 7 and Fig. 3). A number of DV genes are not differentially expressed, including STARD7, IFI16, IGF2 and MTSS1 (Fig. 3). They demonstrate that biologically relevant genes can have differential variability without differential expression.
Fig. 3.

Some typical genes with statistically significant DV in the Stearman dataset. The expression value is sorted within each group independently of other genes to better visualize the variability among samples. IL1RL1, IL6 and STARD7 are examples of genes with decreased variability in lung cancer patients. ADCY9, IFI16 and IGF2 are examples of genes with increased variability in lung cancer patients.
3.4.2 Haslett dataset
The Haslett et al. (2002) study compared the expression profiles of 12 normal skeletal muscles with muscle samples from 12 Duchenne muscular dystrophy (DMD) patients. In this dataset, only 12 genes are deemed significantly DV and all of these genes have elevated variability and average expression level in DMD patients. The top-ranking DV gene, SPP1 (osteopontin), is also upregulated and was validated by reverse transcriptase–polymerase chain reaction by Haslett et al. (2002). SPP1 is a macrophage product that enhances synthesis and turnover of extracellular matrix (Porter et al., 2002), and is induced by free phosphates in damaged tissues (Beck et al., 2000). Therefore, the variable upregulation of SPP1 expression in DMD patients might be a result of varying response to muscle damage.
3.4.3 Hong dataset
The Hong et al. (2007) study compared the expression profile of 10 normal tissue samples and 12 colorectal cancer samples. We found one gene (G6PC) with decreased variability and 34 genes with increased variability in cancer patients. Among these DV genes, many of them (FOSB, CYR61, EGR1, FIGF) were also described by Hong et al. (2007) as significantly upregulated. Our analysis, therefore, show that these genes are not only upregulated in cancer patients, but that the degree of upregulation also varies significantly compared to expression variability among non-diseased individuals.
3.4.4 CardioGenomics dataset
The CardioGenomics data consists of expression profiles from left ventricular muscle of 14 non-failing donor hearts and 27 end-stage failing hearts (due to dilated cardiomyopathy). We identified 248 DV genes in which about half of them are also DE. A number of these DV genes are known to be involved in heart failure (Table 7). LIMS1 displays decreased variability and decreased expression in the failing hearts compared with non-failing hearts. The IPAP1 complex, in which LIMS1 is a member along with ILK and α-parvin proteins, is involved in cardiac hypertrophy and apoptosis (Chen et al., 2005). Loss of tight regulation of an integral member of the IPAP1 complex may be involved in the inability of the failing heart to compensate via hypertrophy for its reduced contractility, or may in fact promote cardiac dysfunction by leading to the increased loss of cardiomyocytes via apoptosis. This would in turn increase the load on the remaining cardiomyocytes and exacerbate cardiac dysfunction. MCM4 displays decreased variability and increased mean expression in failing hearts compared with non-failing hearts. Since MCM4 is a protein required for cell division (Bailis et al., 2008), these changes in RNA abundance could reflect an increase in cell division in heart failure that is not a consistent feature of hearts from donors, who at the time of death may or may not have been in a state of cardiac health that required cardiomyocyte proliferation. The loss of expression variability of SMAD3 in the failing hearts compared with non-failing hearts implies a loss of transcriptional regulation of this gene. SMAD3 is involved in transforming growth factor-β mediated interstitial fibrosis in response to cardiac injury (Bujak et al., 2007). Dysfunction of this pathway may be involved in the progression to heart failure due to failing hearts losing the ability to respond appropriately to damage. The ephrin receptor, EPHB4, seems to be involved in regulating embryonic stem cell differentiation into several cardiac tissue types including cardiomyocytes and endothelial cells (Wang et al., 2004). Therefore, the observed increase in variability of EPHB4 expression in failing hearts may reflect varying patient responses to heart failure, some with greater or lesser compensation by repair from recruited stem cells. In mouse models of cardiomyopathy (Nakayama et al., 2006) and cardiac hypertrophy (Kuwahara et al., 2006), TRPC4 expression has been shown to be elevated. TRPC4 may play a role as a store-operated cation channel, mediating calcium ion entry into the cell in times of SR calcium depletion (Dietrich et al., 2007). Here we show that the variability of TRPC4 is higher in failing hearts compared with non-failing hearts. Though the effect of such differential variability in human heart failure is unknown at this time, our results are consistent with the common observation of abnormal calcium handling in heart failure in mouse models.
4 DISCUSSION
In this article, we discuss an important but often neglected pattern in large gene expression profile datasets: DV. As demonstrated by the four human disease datasets we analyzed, it is clear that: (1) statistically significant DV genes do exist and they are biologically relevant; (2) both increase and decrease of variability in diseased patients are possible, although increase in variability seems to be more common; (3) expression variability is positively correlated with the degree of gene coexpression. As far as we are aware, this is the first study that establishes relationships between inter-sample expression variability, mean expression level and coexpression.
So what is the biological basis for differential variability? We believe it is due to the dynamics of the cellular regulatory network. Based on our results, we hypothesize that differential variability of a gene is caused by the loss or gain of a set of uniformly activating or inhibiting transcription factors (or gene expression regulators in general). For example, switching on an activator can raise the expression level of all its downstream genes, which causes an increase in coexpression. However, since the activity of the regulators may vary among individuals, the responsiveness of the downstream genes may vary as well. This causes an increased expression variability across samples. Therefore, the consequences of switching on an upstream activator include higher average expression, and more variable yet coordinated expression across samples, which matches our observations (Tables 5 and 6). Therefore, perhaps DV is a good predictor of DC among genes.
Then how does decrease in mean expression correlate with increase in coexpression? We attribute this pattern to loss of a large number of positive regulators of transcription. These activating transcription factors each perhaps regulate a group of genes that are coregulated by other transcription factors, in the form of a multiinput module (Alon, 2007). When a number of such regulators are lost, all the downstream genes will suffer a loss of expression, but also as the number of regulators is markedly reduced, the downstream genes experience much more similar regulatory input, and therefore their expression becomes more correlated. However, if the reverse happens and these transcription factors increase their expression, the patterns of coexpression will not be affected, so the reverse situation of decreased coexpression would not occur in association with increased expression, which was observed in our result.
Although we are aware of possible sources of variability from the data collection of experimental procedures, we still have confidence about our conclusions because of the strong and consistent correlation between DV and DC across all four independent datasets, and that some significant DV genes are known to be implicated in pathogenesis.
Compared to the number of DE genes, the number of significant DV genes is small. Also, the number of significant DV genes seems to increase as the number of samples per group increases. To investigate this effect, we generated power curves, using Equation 1, for the F-test based on different significance levels and sample sizes (here we assume a balanced number of samples in each group, i.e. n = m). The power curves (Fig. 4) assume that the true population variance of the ‘disease’ samples is five times higher than those from the ‘normal’ group. Since most of our datasets have fewer than 20 samples per group, at significance level of 10−5, the statistical power is <20% (i.e.<20% of the true DV genes are discovered by our procedure). This suggests that there are potentially a lot more significant DV genes present in our real datasets that cannot be recovered, due to the small sample size. In general, the larger the sample size, the higher the power, which should be made possible due to the continuous reduction of cost of running a microarray experiment.
Fig. 4.

The power curve for the F-test based on different significance levels (sig.) and sample sizes. This power curve assumes the true population variance of the ‘disease’ samples is five times higher than those from the ‘normal’ group.
When comparing the F-test with outlier removal with other robust variants, our procedure was shown to have a low false-positive rate. Since no computationally intensive permutation test is required, our test runs relatively quickly and is therefore suitable for large-scale explorative analysis. Once DV genes are extracted, we may then perform permutation tests to obtain an empirical P-value for each gene if desired. Here we only considered differential variability tests for two-group comparisons because this is the simplest and most common type of experimental data. Such a test could be extended to general multi-group comparison by using an extension to F-test such as Bartlett's test or Levine's test.
We found that the set of significant DV genes does vary when different preprocessing methods are used. The concordance between preprocessing methods varies between ∼30% and ∼70%. We subsequently chose DFW to preprocess all of our real data because of its superior accuracy (Chen et al., 2007), and its relatively high concordance with two other reasonably reliable preprocessing methods, FARMS and RMA. This result gives us a baseline for assessing how reliable a DV analysis is. For example, if we identified 100 DV genes in a dataset preprocessed by DFW, we can estimate that about 65% of these genes would also be found if the data were preprocessed by RMA or FARMS.
Prieto et al. (2006) developed an algorithm based on a variant of the mean squared residue originally developed for data biclustering (Cheng and Church, 2000) to find sets of genes that are deregulated in expression profiles of diseased patients. They defined deregulation as an increase in expression variability for a set of genes. Therefore, their definition implies that a set of genes can be deregulated due to DC (when the set of genes lose coexpression in the diseased group), DE (when some genes are upregulated and some downregulated) or DV (when all genes have increased variability in the diseased state). Their method cannot distinguish individual genes that are DE, DV or DC, which generally have different biological meaning. Further, their method does not consider the case where expression variability is decreased in the diseased samples, and may therefore exclude some candidate genes from being detected.
In fact, our definition of differential variability deliberately includes both increase and decrease of variability between two groups of samples. Many existing methods only look for genes that have more unpredictable expression patterns because they associate these altered expression patterns with deregulation, e.g. Kostka and Spang (2004) and Prieto et al. (2006) considered the problem of increase in deregulation in diseased samples. However, we found that decrease in variability is also possible in human diseases. Further, as exemplified in the CardioGenomics dataset (Fig. 2), the set of 200 most highly ranked DV genes has dramatically higher coexpression in the diseased samples compared to the normal samples (Table 6). This result shows that increase in variability does not imply deregulation, but in fact it probably means a gain of coregulation in the diseased samples. Since the Pearson correlation coefficient should be scale-invariant, the observed relationship between DV and DC is likely a biological relationship and not a technical artifact.
5 CONCLUSION
We have described DV analysis of gene expression and its application in searching for disease-related genes in human diseases using microarray data. We found that changes in expression variability are associated with changes in coexpression patterns. Therefore, differential variability is potentially an important manifestation of changes in gene regulation. As a result, DV analysis can complement traditional analysis based on differential expression and differential coexpression. As larger datasets are being generated, we anticipate our differential variability analysis to become much more applicable.
ACKNOWLEDGEMENTS
We thank Dr Jean Yee Hwa Yang for her constructive comments. We are grateful to Dr Monnie McGee for supplying the R source code of DFW.
Funding: This work is supported by an Australia Postgraduate Award and a NICTA Research Project Award.
Conflict of Interest: none declared.
REFERENCES
- Affymetrix Inc. Statistical algorithms description document. 2002 [Google Scholar]
- Alon U. Network motifs: theory and experimental approaches. Nat. Rev. Genet. 2007;8:450–461. doi: 10.1038/nrg2102. [DOI] [PubMed] [Google Scholar]
- Bahar R, et al. Increased cell-to-cell variability in gene expression in ageing mouse heart. Nature. 2006;441:1011–1014. doi: 10.1038/nature04844. [DOI] [PubMed] [Google Scholar]
- Bailis JM, et al. Minichromosome maintenance proteins interact with checkpoint and recombination proteins to promote S-phase genome stability. Mol. Cell Biol. 2008;28:1724–1738. doi: 10.1128/MCB.01717-07. [DOI] [PMC free article] [PubMed] [Google Scholar]
- Beck GR, et al. Phosphate is a specific signal for induction of osteopontin gene expression. Proc. Natl Acad. Sci. USA. 2000;97:8352–8357. doi: 10.1073/pnas.140021997. [DOI] [PMC free article] [PubMed] [Google Scholar]
- Beissbarth T, Speed TP. GOstat: find statistically overrepresentated gene ontologies within a group of genes. Bioinformatics. 2004;20:1464–1465. doi: 10.1093/bioinformatics/bth088. [DOI] [PubMed] [Google Scholar]
- Benjamini Y, Hochberg Y. Controlling the false discovery rate: a practical and powerful approach to multiple testing. J. R. Statist. Soc. B. 1995;57:289–300. [Google Scholar]
- Bujak M, et al. Essential role of Smad3 in infarct healing and in pathogenesis of cardiac remodeling. Circulation. 2007;116:2127–2138. doi: 10.1161/CIRCULATIONAHA.107.704197. [DOI] [PubMed] [Google Scholar]
- CardioGenomics. Harvard Medical School. 2008 http://cardiogenomics.med.harvard.edu.
- Chen H, et al. Role of the integrin-linked kinase/PINCH1/alpha-parvin complex in cardiac myocyte hypertrophy. Lab. Invest. 2005;85:1342–1356. doi: 10.1038/labinvest.3700345. [DOI] [PubMed] [Google Scholar]
- Chen Z, et al. A distribution free summarization methods for Affymetrix GeneChip arrays. Bioinformatics. 2007;23:321–327. doi: 10.1093/bioinformatics/btl609. [DOI] [PubMed] [Google Scholar]
- Cheng Y, Church G. Biclustering of expression data. In. Proc. 8th Intl. Conf. Intel. Sys. Mol. Biol. (ISMB'00) 2000:93–103. [PubMed] [Google Scholar]
- Cheung VG, et al. Natural variation in human gene expression assessed in lymphoblastoid cells. Nat. Genet. 2003;33:422–425. doi: 10.1038/ng1094. [DOI] [PubMed] [Google Scholar]
- Choi JK, et al. Differential coexpression analysis using microarray data and its application to human cancer. Bioinformatics. 2005;21:4348–4355. doi: 10.1093/bioinformatics/bti722. [DOI] [PubMed] [Google Scholar]
- Cope LM, et al. A benchmark for Affymetrix GeneChip expression measures. Bioinformatics. 2004;20:323–331. doi: 10.1093/bioinformatics/btg410. [DOI] [PubMed] [Google Scholar]
- Dietrich A, et al. In vivo TRPC functions in the cardiopulmonary vasculature. Cell Calcium. 2007;42:233–244. doi: 10.1016/j.ceca.2007.02.009. [DOI] [PubMed] [Google Scholar]
- Edgar R, et al. Gene Expression Omnibus: NCBI gene expression and hybridization array data repository. Nucl. Acids Res. 2002;30:207–210. doi: 10.1093/nar/30.1.207. [DOI] [PMC free article] [PubMed] [Google Scholar]
- Haslett JN, et al. Gene expression comparison of biopsies from Duchenne muscular dystrophy (DMD) and normal skeletal muscle. Proc. Natl Acad. Sci. USA. 2002;99:15000–15005. doi: 10.1073/pnas.192571199. [DOI] [PMC free article] [PubMed] [Google Scholar]
- Hochreiter S, et al. A new summarization method for Affymetrix probe level data. Bioinformatics. 2006;22:943–949. doi: 10.1093/bioinformatics/btl033. [DOI] [PubMed] [Google Scholar]
- Hong Y, et al. A susceptibility gene set for early onset colorectal cancer that integrate diverse signaling pathways: implication for tumorigenesis. Clin. Cancer Res. 2007;13:1107–1114. doi: 10.1158/1078-0432.CCR-06-1633. [DOI] [PubMed] [Google Scholar]
- Ihaka R, Gentleman R. R: a language for data analysis and graphics. J. Comput. Graph. Stat. 1996;5:299–314. [Google Scholar]
- Irizarry RA, et al. Summaries of Affymetrix GeneChip probe level data. Nucl. Acids Res. 2003;31:e15. doi: 10.1093/nar/gng015. [DOI] [PMC free article] [PubMed] [Google Scholar]
- Irizarry RA, et al. Comparison of Affymetrix GeneChip expression measures. Bioinformatics. 2006;22:789–794. doi: 10.1093/bioinformatics/btk046. [DOI] [PubMed] [Google Scholar]
- Kostka D, Spang R. Finding disease specific alternations in the co-expression of genes. Bioinformatics. 2004;20:i194–i199. doi: 10.1093/bioinformatics/bth909. [DOI] [PubMed] [Google Scholar]
- Kuwahara K, et al. TRPC6 fulfills a calcineurin signaling circuit during pathologic cardiac remodeling. J. Clin. Invest. 2006;116:3114–3126. doi: 10.1172/JCI27702. [DOI] [PMC free article] [PubMed] [Google Scholar]
- Nakayama H, et al. Calcineurin-dependent cardiomyopathy is activated by TRPC in the adult mouse heart. FASEB J. 2006;20:1660–1670. doi: 10.1096/fj.05-5560com. [DOI] [PMC free article] [PubMed] [Google Scholar]
- Patterson TA, et al. Performance comparison of one-color and two-color platforms within the Microarray Quality Control (MAQC) project. Nat. Biotechnol. 2006;24:1140–1150. doi: 10.1038/nbt1242. [DOI] [PubMed] [Google Scholar]
- Porter JD, et al. A chronic inflammatory response dominates the skeletal muscle molecular signature in dystrophin-deficient mdx mice. Hum. Mol. Genet. 2002;11:263–272. doi: 10.1093/hmg/11.3.263. [DOI] [PubMed] [Google Scholar]
- Prieto C, et al. Algorithm to find gene expression profiles of deregulation and identify families of disease-altered genes. Bioinformatics. 2006;22:1103–1110. doi: 10.1093/bioinformatics/btl053. [DOI] [PubMed] [Google Scholar]
- Pritchard CC, et al. Project normal: defining normal variance in mouse gene expression. Proc. Natl Acad. Sci. USA. 2001;98:13266–13271. doi: 10.1073/pnas.221465998. [DOI] [PMC free article] [PubMed] [Google Scholar]
- Rousseeuw PJ, Croux C. Alternatives to the median absolute deviation. J. Am. Stat. Assoc. 1993;88:1273–1283. [Google Scholar]
- Smyth GK. Linear models and empirical Bayes methods for assessing differential expression in microarray experiments. Stat. Appl. Genet. Mol. Biol. 2004;1:3. doi: 10.2202/1544-6115.1027. [DOI] [PubMed] [Google Scholar]
- Stearman RS, et al. Analysis of orthologous gene expression between human pulmonary adenocarcinoma and a carcinogen-induced murine model. Am. J. Pathol. 2005;167:1763–1775. doi: 10.1016/S0002-9440(10)61257-6. [DOI] [PMC free article] [PubMed] [Google Scholar]
- Tusher VG, et al. Significance analysis of microarrays applied to the ionizing radiation response. Proc. Natl Acad. Sci. USA. 2001;98:5116–5121. doi: 10.1073/pnas.091062498. [DOI] [PMC free article] [PubMed] [Google Scholar]
- Wang Z, et al. Ephrin receptor, EphB4, regulates ES cell differentiation of primitive mammalian hemangioblasts, blood, cardiomyocytes, and blood vessels. Blood. 2004;103:100–109. doi: 10.1182/blood-2003-04-1063. [DOI] [PubMed] [Google Scholar]
- Watson M. CoXpress: differential co-expression in gene expression data. BMC Bioinformatics. 2006;7:509. doi: 10.1186/1471-2105-7-509. [DOI] [PMC free article] [PubMed] [Google Scholar]
- Welch B. The generalization of ‘students's’ problem when several differential population variances are invovled. Biometrika. 1947;34:28–35. doi: 10.1093/biomet/34.1-2.28. [DOI] [PubMed] [Google Scholar]
- Wu Z, et al. A model-based background adjustment for oligonucleotide expression arrays. J. Am. Stat. Assoc. 2004;99:909–917. [Google Scholar]